
Evaluation of Feed Near-Infrared Reflectance Spectra as Predictors of Methane Emissions from Ruminants

 , ,
, ,
Abstract
:Simple Summary
Abstract
1. Introduction
2. Materials and Methods
2.1. Data
2.2. Generation of NIR Spectra and Calibration
2.3. Evaluation of the Prediction of Ym
3. Results and Discussion
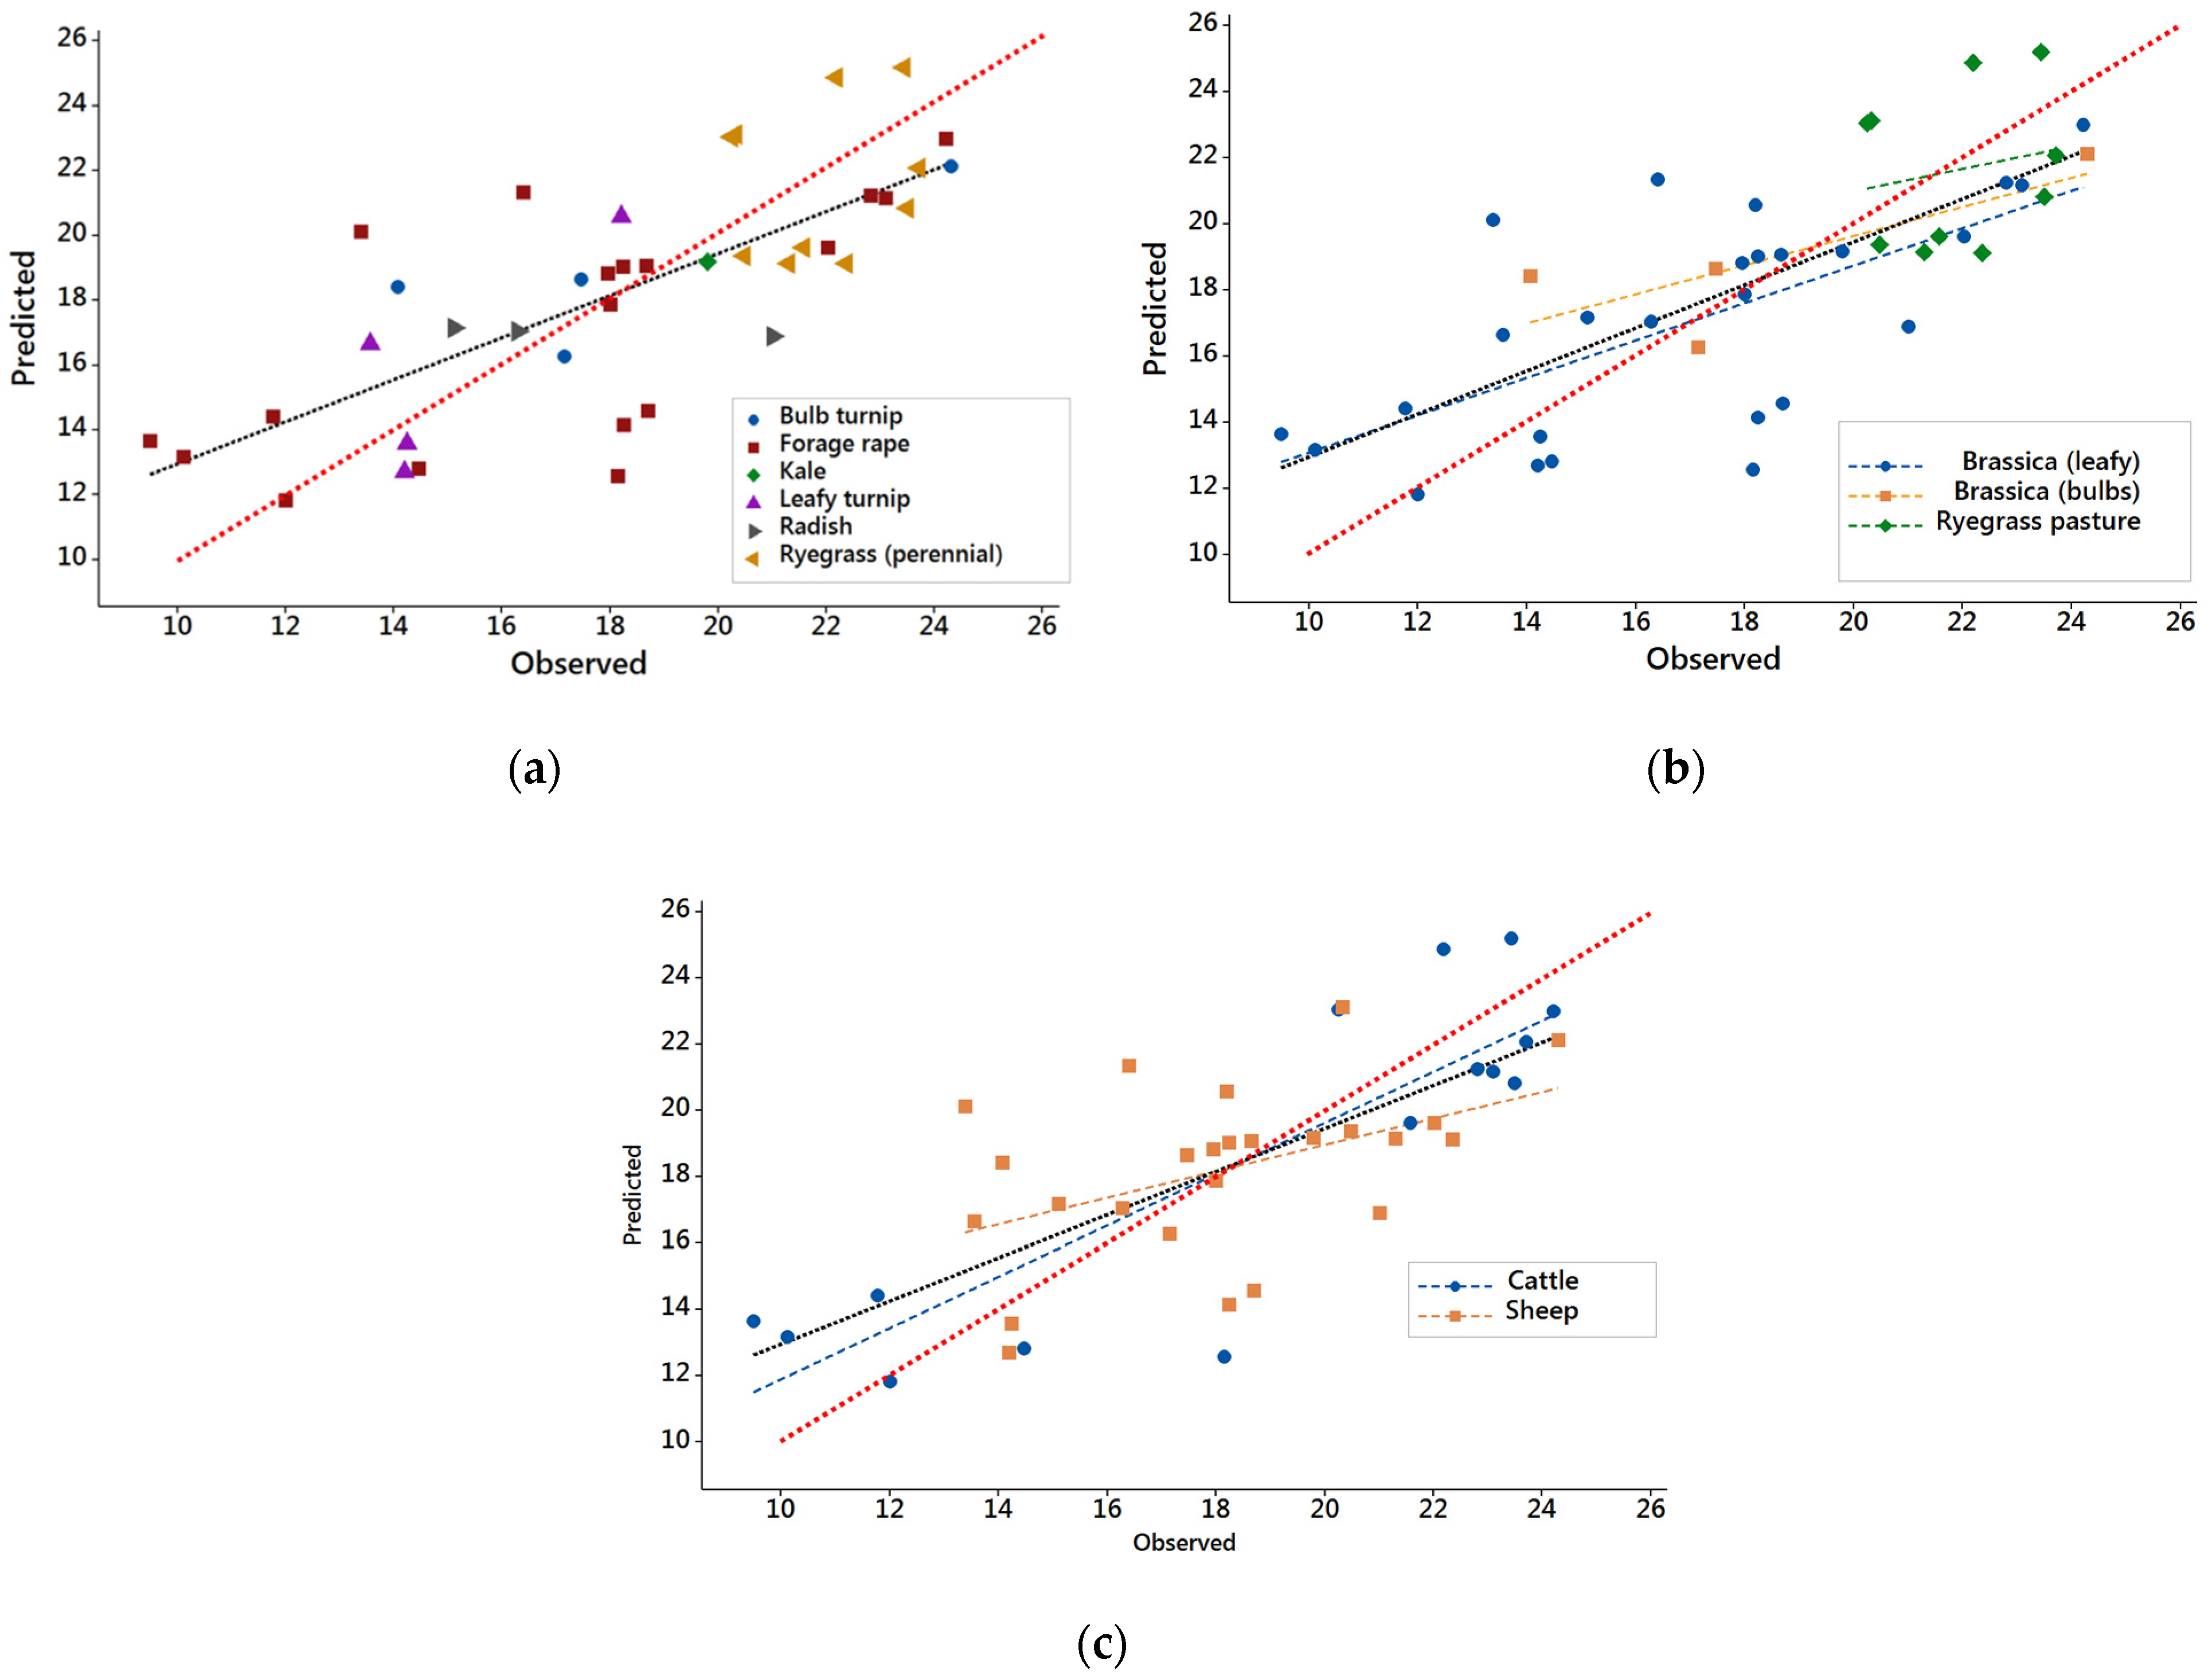
3.1. Results from DB1 with Common Feeding Level
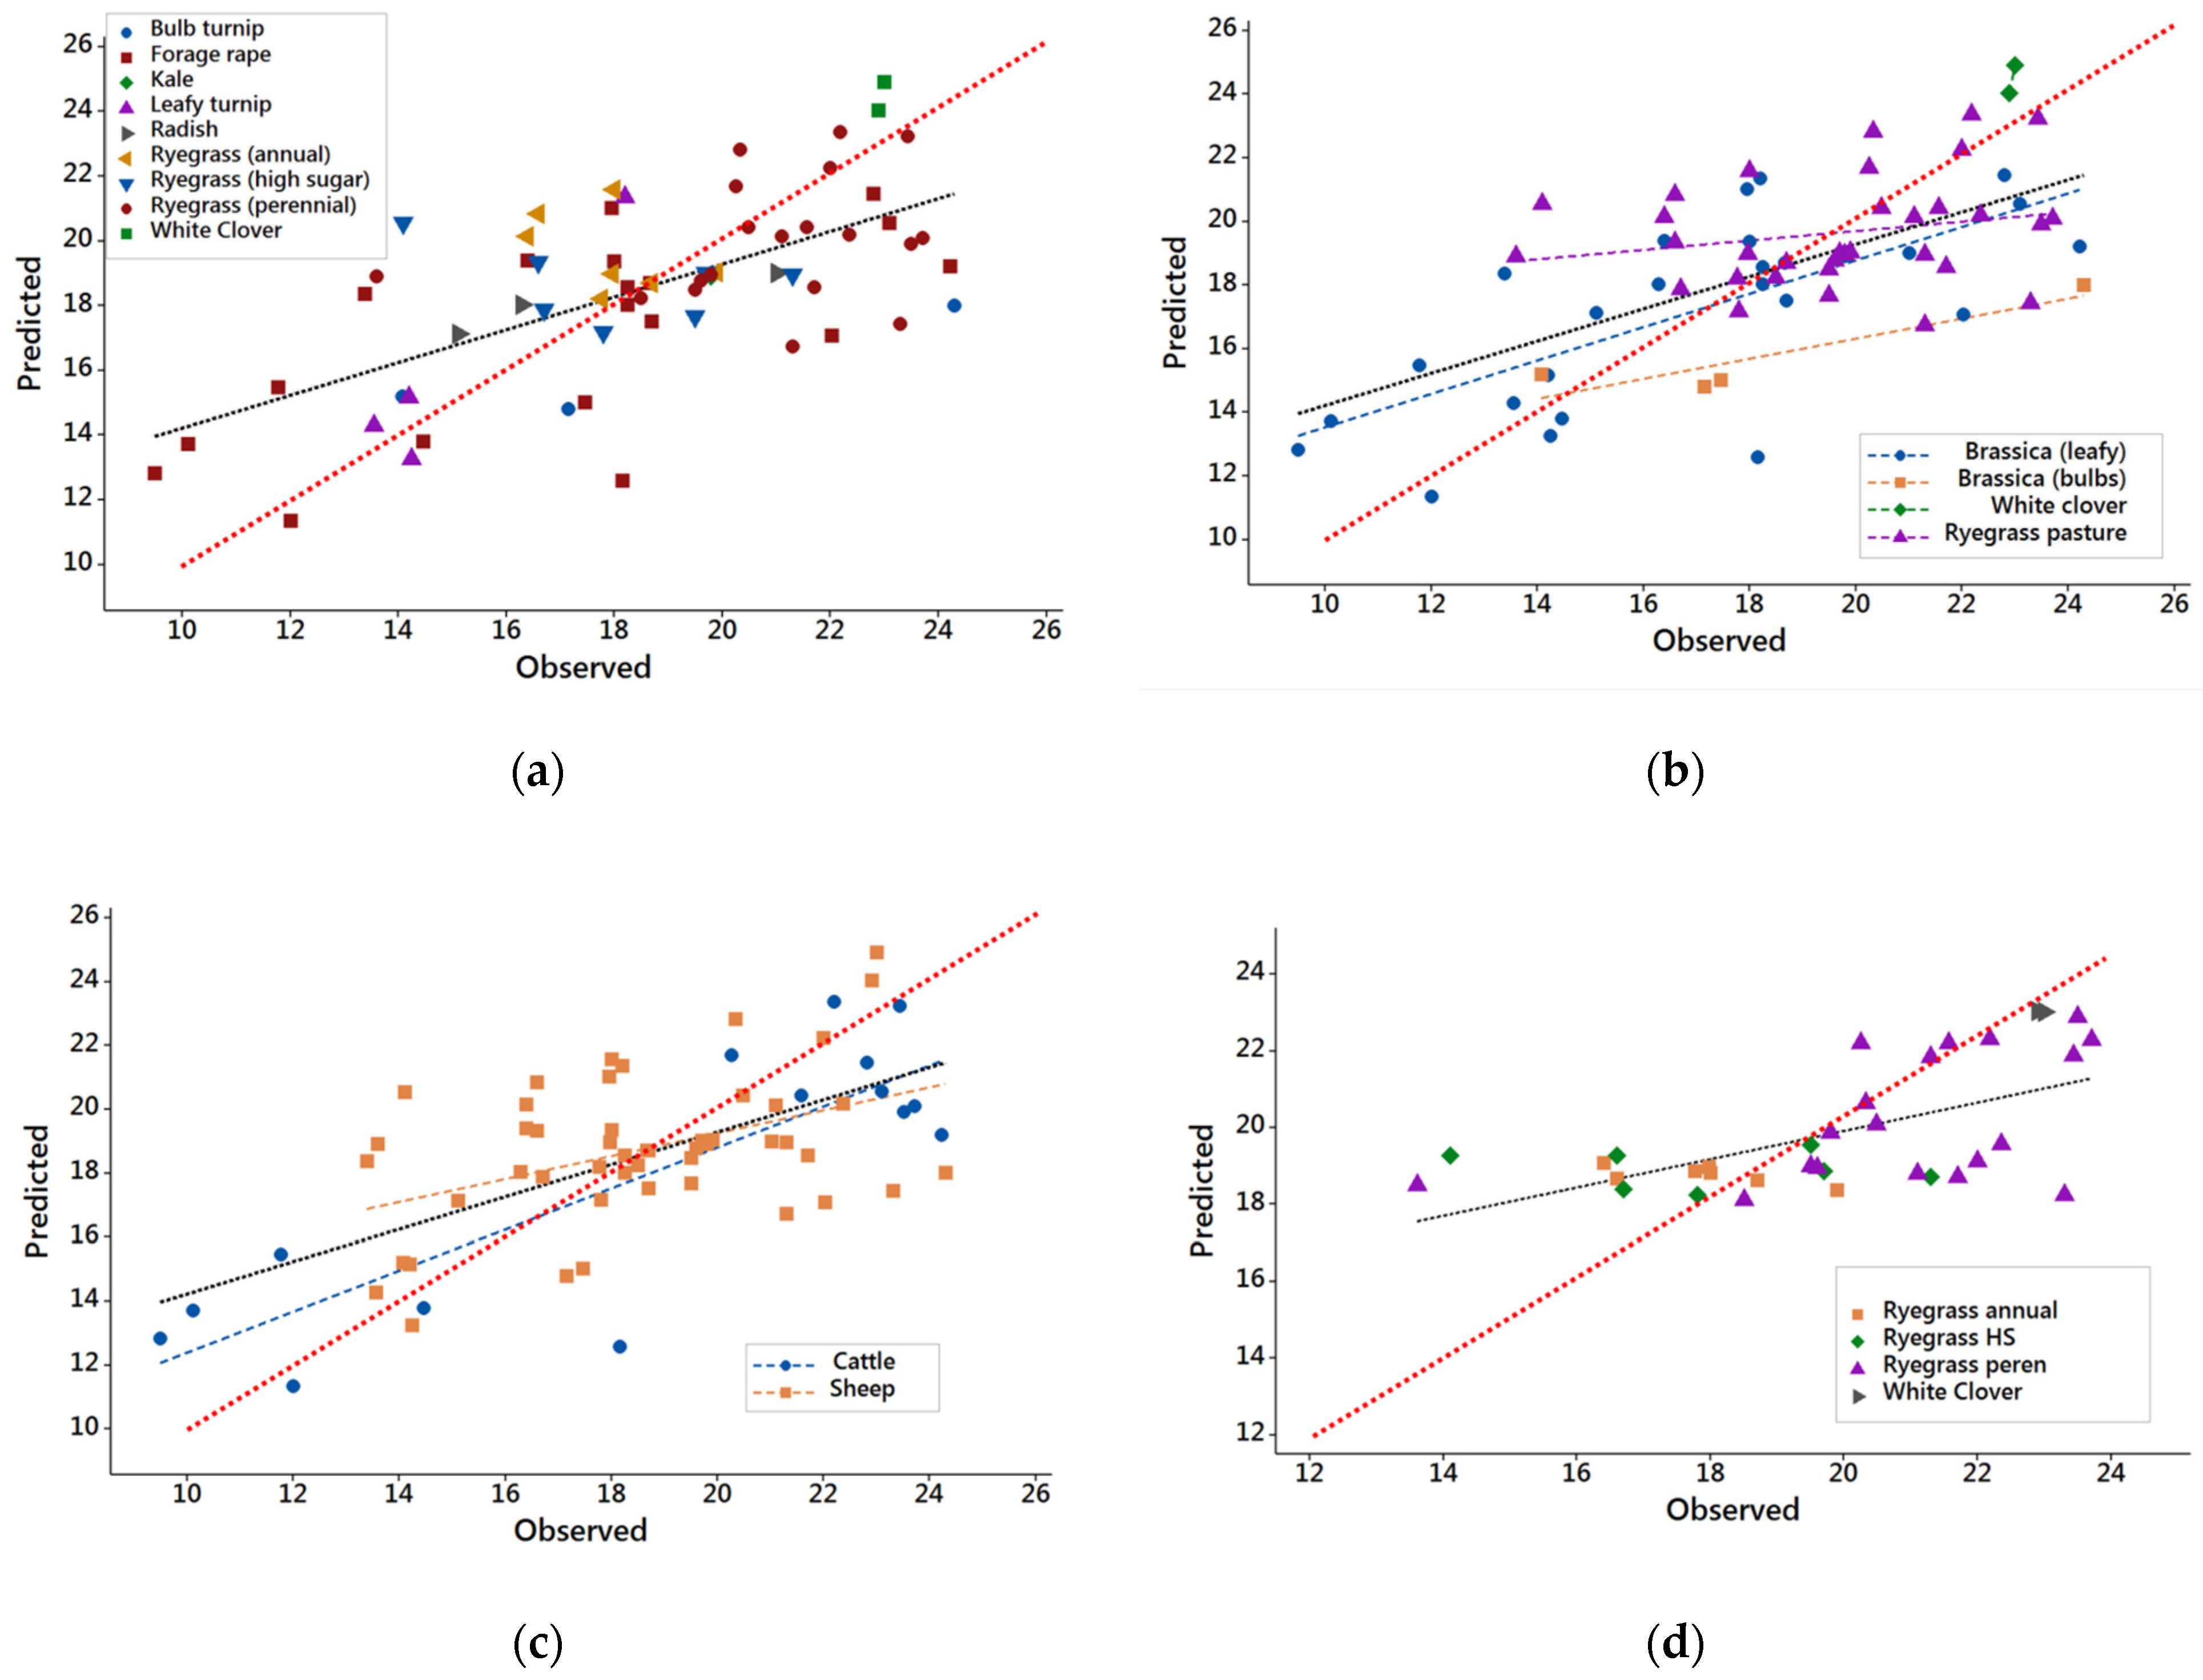
3.2. Results from DB2
3.3. Evaluation of NIRS Calibrations
4. Conclusions
Author Contributions
Funding
Institutional Review Board Statement
Informed Consent Statement
Data Availability Statement
Acknowledgments
Conflicts of Interest
References
- Arora, N.K.; Fatima, T.; Mishra, I.; Verma, M.; Mishra, J.; Mishra, V. Environmental sustainability: Challenges and viable solutions. Environ. Sustain. 2018, 1, 309–340. [Google Scholar] [CrossRef]
- United States Environmental Protection Agency. Climate Change Indicators: Atmospheric Concentrations of Greenhouse Gases. Available online: https://www.epa.gov/climate-indicators/climate-change-indicators-atmospheric-concentrations-greenhouse-gases (accessed on 30 July 2022).
- Pachauri, R.K.; Allen, M.R.; Barros, V.R.; Broome, J.; Cramer, W.; Christ, R.; Church, J.A.; Clarke, L.; Dahe, Q.; Dasgupta, P.; et al. Contribution of Working Groups I, II and III to the Fifth Assessment Report of the Intergovernmental Panel on Climate Change. In Climate Change 2014: Synthesis Report; IPCC: Geneva, Switzerland, 2014; p. 151. ISBN 978-92-9169-143-2. [Google Scholar]
- Muller, R.A.; Muller, E.A. Fugitive methane and the role of atmospheric half-life. Geoinfor. Geostat. Overv. 2017, 5, 3. [Google Scholar] [CrossRef]
- Gerber, P.J.; Steinfeld, H.; Henderson, B.; Mottet, A.; Opio, C.; Dijkman, J.; Falcucci, A.; Tempio, G. Tackling Climate Change through Livestock—A Global Assessment of Emissions and Mitigation Opportunities; Food and Agriculture Organization of the United Nations (FAO): Rome, Italy, 2013. [Google Scholar]
- Beauchemin, K.A.; Ungerfeld, E.M.; Eckard, R.J.; Wang, M. Review: Fifty years of research on rumen methanogenesis: Lessons learned and future challenges for mitigation. Animal 2020, 14, s2–s16. [Google Scholar] [CrossRef] [PubMed]
- Ripple, W.J.; Smith, P.; Haberl, H.; Montzka, S.A.; McAlpine, C.; Boucher, D.H. Ruminants, climate change and climate policy. Nat. Clim. Chang. 2014, 4, 2–5. [Google Scholar] [CrossRef]
- Appuhamy, J.A.; France, J.; Kebreab, E. Models for predicting enteric methane emissions from dairy cows in North America, Europe, and Australia and New Zealand. Glob. Chang. Biol. 2016, 22, 3039–3056. [Google Scholar] [CrossRef]
- Immig, I. The rumen and hindgut as source of ruminant methanogenesis. Environ. Monitor. Assess. 1996, 42, 57–72. [Google Scholar] [CrossRef]
- Vasta, V.; Daghio, M.; Cappucci, A.; Buccioni, A.; Serra, A.; Viti, C.; Mele, M. Invited review: Plant polyphenols and rumen microbiota responsible for fatty acid biohydrogenation, fiber digestion, and methane emission: Experimental evidence and methodological approaches. J. Dairy Sci. 2019, 102, 3781–3804. [Google Scholar] [CrossRef]
- Hristov, A.N.; Oh, J.; Firkins, J.L.; Dijkstra, J.; Kebreab, E.; Waghorn, G.; Makkar, H.P.S.; Adesogan, A.T.; Yang, W.; Lee, C.; et al. Special topics-Mitigation of methane and nitrous oxide emissions from animal operations: I. A review of enteric methane mitigation options. J. Anim. Sci. 2013, 91, 5045–5069. [Google Scholar] [CrossRef]
- Sun, X.; Cheng, L.; Jonker, A.; Munidasa, S.; Pacheco, D. A review: Plant carbohydrate types—The potential impact on ruminant methane emissions. Front. Vet. Sci. 2022, 9, 880115. [Google Scholar] [CrossRef] [PubMed]
- Hammond, K.J.; Muetzel, S.; Waghorn, G.G.; Pinares-Patino, C.S.; Burke, J.L.; Hoskin, S.O. The variation in methane emissions from sheep and cattle is not explained by the chemical composition of ryegrass. Proc. N. Z. Soci. Anim. Prod. 2009, 69, 174–178. [Google Scholar]
- Archimède, H.; Eugène, M.; Marie Magdeleine, C.; Boval, M.; Martin, C.; Morgavi, D.P.; Lecomte, P.; Doreau, M. Comparison of methane production between C3 and C4 grasses and legumes. Anim. Feed Sci. Technol. 2011, 166–167, 59–64. [Google Scholar] [CrossRef]
- Fouts, J.Q.; Honan, M.C.; Roque, B.M.; Tricarico, J.M.; Kebreab, E. Enteric methane mitigation interventions. Trans. Anim. Sci. 2022, 6, txac041. [Google Scholar] [CrossRef] [PubMed]
- Grainger, C.; Beauchemin, K.A. Can enteric methane emissions from ruminants be lowered without lowering their production? Anim. Feed Sci. Technol. 2011, 166–167, 308–320. [Google Scholar] [CrossRef]
- Vargas, J.; Ungerfeld, E.; Muñoz, C.; Dilorenzo, N. Feeding strategies to mitigate enteric methane emission from ruminants in grassland systems. Animals 2022, 12, 1132. [Google Scholar] [CrossRef] [PubMed]
- Broucek, J. Options to methane production abatement in ruminants: A review. J. Anim. Plant Sci. 2018, 28, 348–364. [Google Scholar]
- Woodward, S.L.; Waghorn, G.C.; Laboyrie, P.G. Condensed tannins in birdsfoot trefoil (Lotus corniculatus) reduce methane emissions from dairy cows. Proc. N. Z. Soci. Anim. Prod. 2004, 64, 160–164. [Google Scholar]
- Pacheco, D.; Waghorn, G.; Janssen, P.H. Decreasing methane emissions from ruminants grazing forages: A fit with productive and financial realities? Anim. Prod. Sci. 2014, 54, 1141–1154. [Google Scholar] [CrossRef]
- Corson, D.C.; Waghorn, G.C.; Ulyatt, M.J.; Lee, J. NIRS: Forage analysis and livestock feeding. Proc. N. Z. Grassl. Assoc. 1999, 61, 127–132. [Google Scholar] [CrossRef]
- Nieto-Ortega, B.; Arroyo, J.J.; Walk, C.; Castañares, N.; Canet, E.; Smith, A. Near infrared reflectance spectroscopy as a tool to predict non-starch polysaccharide composition and starch digestibility profiles in common monogastric cereal feed ingredients. Anim. Feed Sci. Technol. 2022, 285, 115214. [Google Scholar] [CrossRef]
- Landau, S.; Glasser, T.; Dvash, L. Monitoring nutrition in small ruminants with the aid of near infrared reflectance spectroscopy (NIRS) technology: A review. Small Rumin. Res. 2004, 61, 1–11. [Google Scholar] [CrossRef]
- Redshaw, E.S.; Weisenburger, R.D.; Mathison, G.W.; Milligan, L.P. Near infrared reflectance spectroscopy for predicting forage composition and voluntary consumption and digestibility in cattle and sheep. Can. J. Anim. Sci. 1986, 66, 103–115. [Google Scholar] [CrossRef]
- Zahera, R.; Sari, L.A.; Permana, I.G.; Despal. The use of near-infrared reflectance spectroscopy (NIRS) to predict dairy fibre feeds in vitro digestibility. IOP Conf. Ser. Earth Environ. Sci. 2022, 951, 012100. [Google Scholar] [CrossRef]
- Doublet, J.; Boulanger, A.; Ponthieux, A.; Laroche, C.; Poitrenaud, M.; Cacho Rivero, J.A. Predicting the biochemical methane potential of wide range of organic substrates by near infrared spectroscopy. Biores. Technol. 2013, 128, 252–258. [Google Scholar] [CrossRef]
- Triolo, J.M.; Ward, A.J.; Pedersen, L.; Løkke, M.M.; Qu, H.; Sommer, S.G. Near Infrared Reflectance Spectroscopy (NIRS) for rapid determination of biochemical methane potential of plant biomass. Appl. Energy 2014, 116, 52–57. [Google Scholar] [CrossRef]
- Norman, H.C.; Hulm, E.; Humphries, A.W.; Hughes, S.J.; Vercoe, P.E. Broad near-infrared spectroscopy calibrations can predict the nutritional value of >100 forage species within the Australian feedbase. Anim. Prod. Sci. 2020, 60, 1111–1122. [Google Scholar] [CrossRef]
- Pinares-Patiño, C.; Hunt, C.; Martin, R.; West, J.; Lovejoy, P.; Waghorn, G. New Zealand Ruminant Methane Measurement Centre, AgResearch, Palmerston North. In Technical Manual on Respiration Chamber Designs; Pinares-Patino, C., Waghorn, G., Eds.; Ministry of Agriculture and Forestry: Wellington, New Zealand, 2014; pp. 9–28. [Google Scholar]
- Sun, X.Z.; Luo, J.; Pacheco, D. Forage Brassicas: A tool for the Mitigation of Methane and Nitrous Oxide? Effect of Forage Rape on GHG Emissions from Sheep; 2013/34; Ministry for Primary Industries (NZ): Wellington, New Zealand, 2013. [Google Scholar]
- Sun, X.Z.; Pacheco, D.; Molano, G.; Luo, D.W. Sheep fed fresh forage rape (Brassica napus subsp. Oleifera L.) have lower methane emissions compared with perennial ryegrass (Lolium perenne L.). In Proceedings of the Advances in Animal Biosciences: Proceedings of the 5th Greenhouse Gases and Animal Agriculture Conference (GGAA 2013), Dublin, Ireland, 23–26 June 2013; p. 271. [Google Scholar]
- Sun, X.Z.; Waghorn, G.C.; Hoskin, S.O.; Harrison, S.J.; Muetzel, S.M.; Pacheco, D. Methane emissions from sheep fed fresh brassicas (Brassica spp.) compared to perennial ryegrass (Lolium perenne). Anim. Feed Sci. Technol. 2012, 176, 107–116. [Google Scholar] [CrossRef]
- Sun, X.; Henderson, G.; Cox, F.; Molano, G.; Harrison, S.J.; Luo, D.; Janssen, P.H.; Pacheco, D. Lambs fed fresh winter forage rape (Brassica napus L.) emit less methane than those fed perennial ryegrass (Lolium perenne L.), and possible mechanisms behind the difference. PLoS ONE 2015, 10, e0119697. [Google Scholar] [CrossRef]
- Yan, T.; Mayne, C.S.; Gordon, F.G.; Porter, M.G.; Agnew, R.E.; Patterson, D.C.; Ferris, C.P.; Kilpatrick, D.J. Mitigation of enteric methane emissions through improving efficiency of energy utilization and productivity in lactating dairy cows. J. Dairy Sci. 2010, 93, 2630–2638. [Google Scholar] [CrossRef]
- Hammond, K.J.; Pacheco, D.; Burke, J.L.; Koolaard, J.P.; Waghorn, G.C. The effects of fresh forages and feed intake level on digesta kinetics and enteric methane emissions from sheep. Anim. Feed Sci. Technol. 2014, 193, 32–43. [Google Scholar] [CrossRef]
- Conzen, J.P. Multivariate Calibration, a Practical Guide for Developing Methods in the Quantitative Analytical Chemistry; BrukerOptik GmbH: Ettlingen, Germany, 2006. [Google Scholar]
- Lin, L. A Concordance correlation coefficient to evaluate reproducibility. Biometrics 1989, 45, 225–268. [Google Scholar] [CrossRef]
- Bibby, J.; Toutenburg, H. Prediction and Improved Estimation in Linear Models; John Wiley & Sons: London, UK, 1977; pp. 16–19. [Google Scholar]
- Moriasi, D.N.; Arnold, J.G.; Van Liew, M.W.; Bingner, R.L.; Harmel, R.D.; Veith, T.L. Model evaluation guidelines for systematic quantification of accuracy in watershed simulations. Trans. ASABE 2007, 50, 885–900. [Google Scholar] [CrossRef]
- Bryant, J.R.; Lopez Villalobos, N. Choice of the most appropriate models and estimation procedures of lactation curves for grazing dairy cattle. Proc. N. Z. Soci. Anim. Prod. 2007, 67, 209–214. [Google Scholar]
- Malley, D.F.; McClure, C.; Martin, P.D.; Buckley, K.; McCaughey, W.P. Compositional analysis of cattle manure during composting using a field-portable near-infrared spectrometer. Commun. Soil Sci. Plant Anal. 2005, 36, 455–475. [Google Scholar] [CrossRef]
- Peng, W.; Beggio, G.; Pivato, A.; Zhang, H.; Lü, F.; He, P. Applications of near infrared spectroscopy and hyperspectral imaging techniques in anaerobic digestion of bio-wastes: A review. Renew. Sustain. Energy Rev. 2022, 165, 112608. [Google Scholar] [CrossRef]
- Masoero, G.; Oggiano, P.; Migliorini, P.; Taran, A.; Nuti, M.; Giovannetti, G. Litterbag-NIRS to forecast yield: A horticultural case with biofertilizer effectors. J. Soil Sci. Plant Nutr. 2022, 22, 186–200. [Google Scholar] [CrossRef]
- Huang, J.; Luo, B.; Cao, Y.; Li, B.; Qian, M.; Jia, N.; Zhao, W. Fusion of THz-TDS and NIRS based detection of moisture content for cattle feed. Front. Phys. 2022, 10, 833278. [Google Scholar] [CrossRef]

| Forage Type | Animal Species | Mean Ym | Range Ym | Total (n) | |
|---|---|---|---|---|---|
| Cattle (n) | Sheep (n) | ||||
| Bulb turnip (Brassica campestris) | 4 | 18.2 | 14.1–24.3 | 4 | |
| Perennial ryegrass (Lolium perenne) | 6 | 4 | 21.9 | 20.3–23.7 | 10 |
| Kale (B. oleracea) | 1 | 19.8 | 19.8 | 1 | |
| Leafy turnip (B. campestris) | 4 | 15.1 | 13.6–18.2 | 4 | |
| Forage radish (Raphanus sativus) | 3 | 17.5 | 15.1–21.0 | 3 | |
| Forage rape (B. napus) | 9 | 9 | 17.1 | 9.5–24.2 | 18 |
| Mean Ym | 18.7 | 18.1 | |||
| Range Ym | 9.5–24.2 | 13.4–24.3 | |||
| Total | 15 | 25 | 18.3 | 9.5–24.3 | 40 |
| Forage Type | Animal Species | Mean Ym | Range Ym | Total (n) | |
|---|---|---|---|---|---|
| Cattle (n) | Sheep (n) | ||||
| Bulb turnip (Brassica campestris) | 4 | 18.2 | 14.1–24.3 | 4 | |
| Kale (B. oleracea) | 1 | 19.8 | 19.8 | 1 | |
| Leafy turnip (B. campestris) | 4 | 15.1 | 13.6–18.2 | 4 | |
| Forage radish (Raphanus sativus) | 3 | 17.5 | 15.1–21.0 | 3 | |
| Forage rape (B. napus) | 9 | 9 | 17.1 | 9.5–24.2 | 18 |
| High sugar ryegrass (Lolium perenne) | 7 | 17.9 | 14.1–21.3 | 7 | |
| Perennial ryegrass (L. perenne) | 6 | 13 | 21.0 | 13.6–23.7 | 19 |
| Annual ryegrass (L. rigidum) | 7 | 17.0 | 16.4–19.9 | 7 | |
| White clover (Trifolium repens) | 2 | 23.0 | 22.9–23.0 | 2 | |
| Mean Ym | 18.7 | 18.6 | |||
| Range Ym | 9.5–24.2 | 13.4–24.3 | |||
| Total | 15 | 50 | 18.6 | 9.5–24.3 | 65 |
| Ym (g CH4/kg DMI a) | Ym (g CH4/kg DMI) | |||
|---|---|---|---|---|
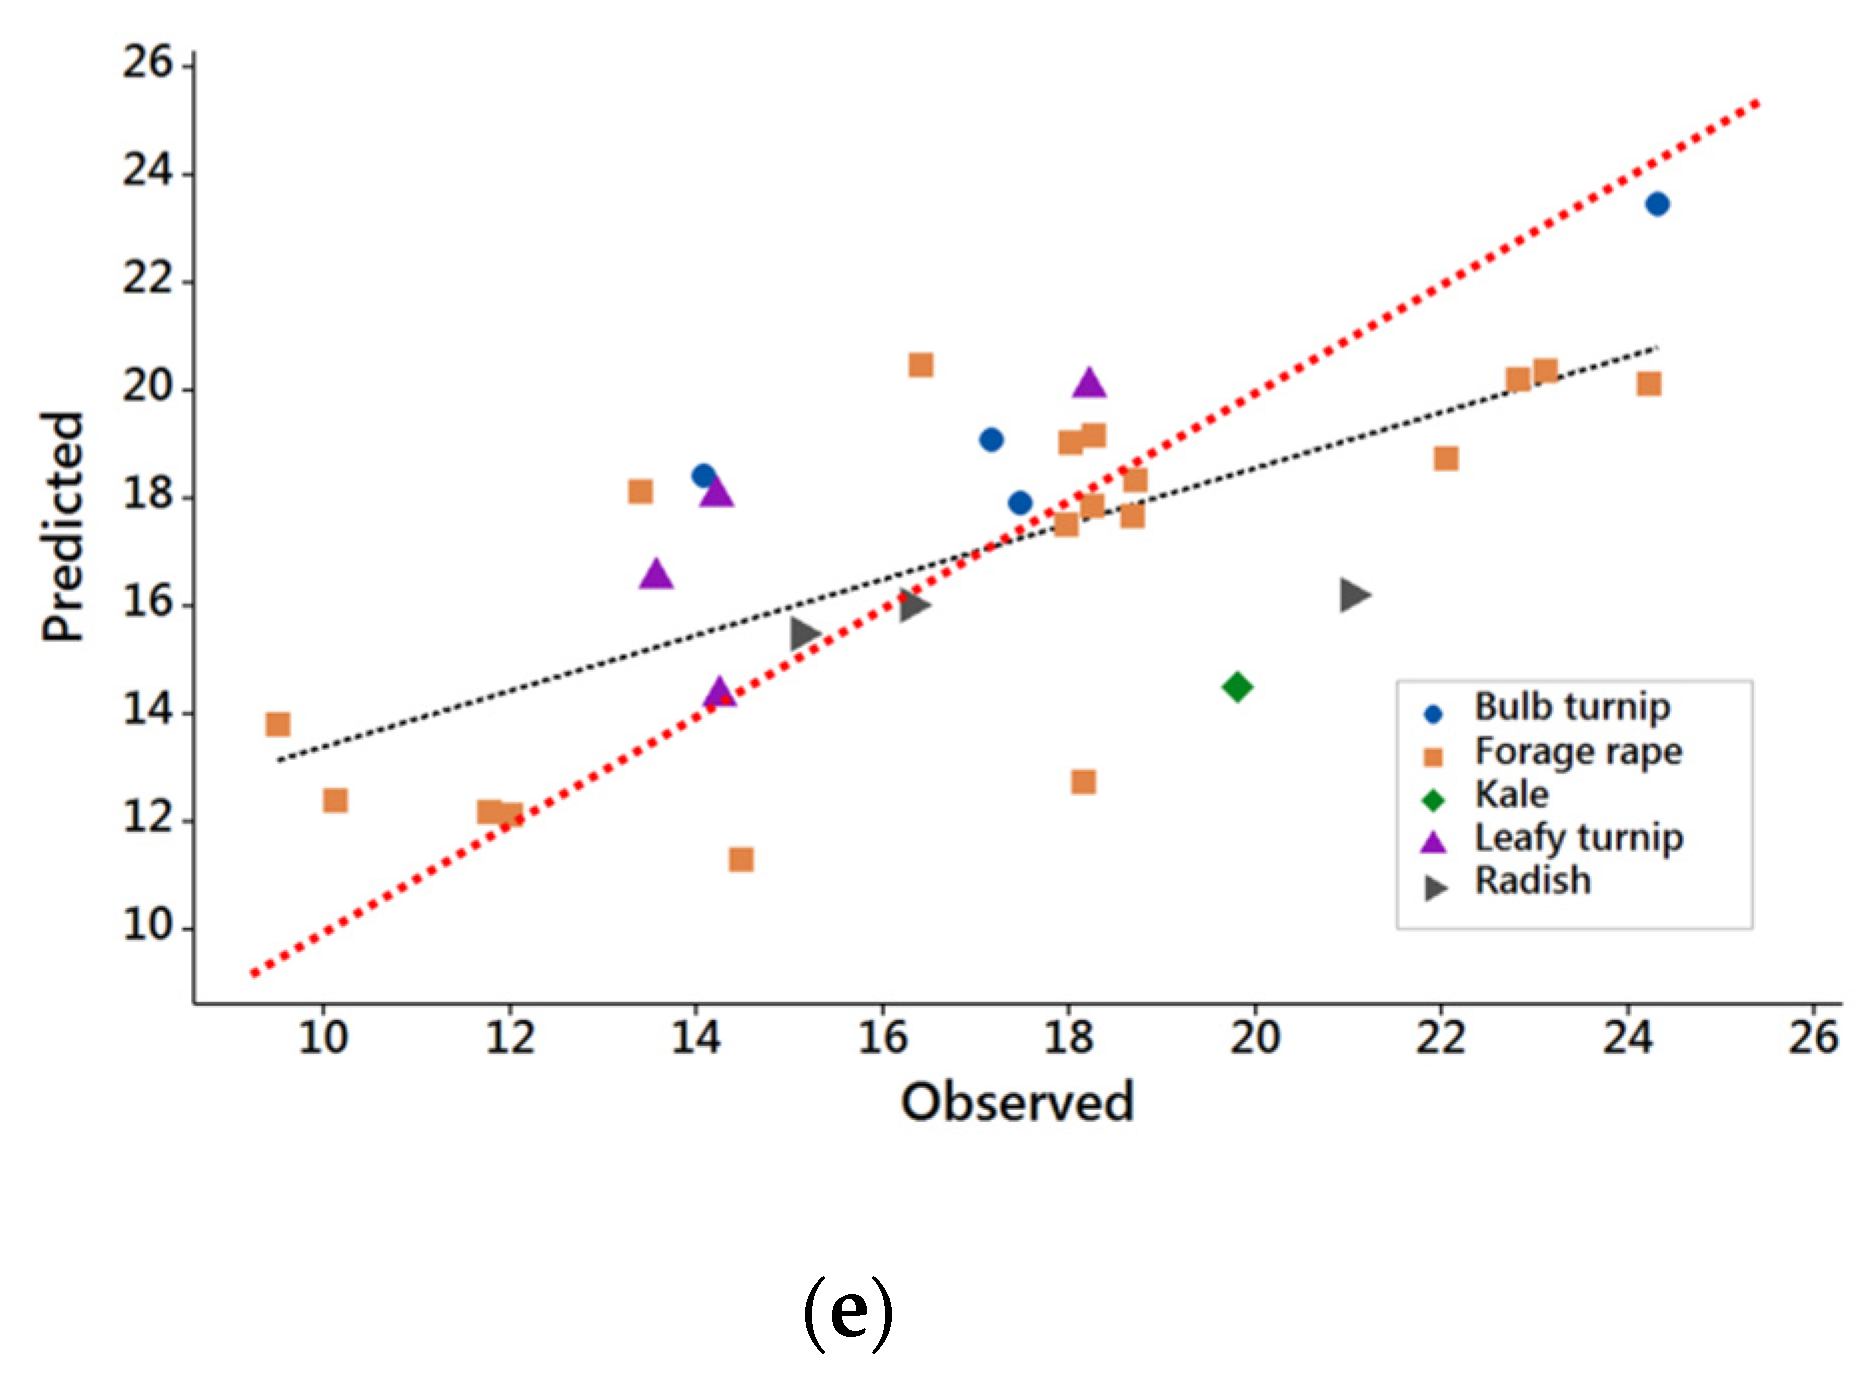
| Database DB1 | Database DB2 | Brassica Only Model | Pasture Only Model | |
| Data processing | VN b | FD c/VN | FD/VN | FD |
| Number of samples (n) | 40 | 65 | 30 | 35 |
| Mean observed | 18.31 | 18.59 | 17.10 | 19.86 |
| Mean predicted | 18.35 | 18.57 | 17.07 | 19.85 |
| Mean bias | 0.04 | −0.02 | −0.03 | −0.01 |
| RMSPE d | 2.77 | 2.77 | 2.88 | 2.08 |
| Relative prediction error e | 15.1 | 14.9 | 16.9 | 10.5 |
| Error decomposition: | ||||
| % bias | 0.02 | 0.01 | 0.01 | 0.01 |
| % slope | 4.4 | 3.9 | 1.4 | 0.05 |
| % random | 95.6 | 96.1 | 98.6 | 99.95 |
| Adjusted R2 f | 0.53 | 0.40 | 0.44 | 0.34 |
| CCC g | 0.73 | 0.62 | 0.65 | 0.53 |
| RPD h | 1.45 | 1.28 | 1.35 | 1.25 |
Publisher’s Note: MDPI stays neutral with regard to jurisdictional claims in published maps and institutional affiliations. |
© 2022 by the authors. Licensee MDPI, Basel, Switzerland. This article is an open access article distributed under the terms and conditions of the Creative Commons Attribution (CC BY) license (https://creativecommons.org/licenses/by/4.0/).
Share and Cite
Sun, X.; Pacheco, D.; Taylor, G.; Janssen, P.H.; Swainson, N.M. Evaluation of Feed Near-Infrared Reflectance Spectra as Predictors of Methane Emissions from Ruminants. Animals 2022, 12, 2478. https://doi.org/10.3390/ani12182478
Sun X, Pacheco D, Taylor G, Janssen PH, Swainson NM. Evaluation of Feed Near-Infrared Reflectance Spectra as Predictors of Methane Emissions from Ruminants. Animals. 2022; 12(18):2478. https://doi.org/10.3390/ani12182478
Chicago/Turabian StyleSun, Xuezhao, David Pacheco, Grant Taylor, Peter H. Janssen, and Natasha M. Swainson. 2022. "Evaluation of Feed Near-Infrared Reflectance Spectra as Predictors of Methane Emissions from Ruminants" Animals 12, no. 18: 2478. https://doi.org/10.3390/ani12182478
APA StyleSun, X., Pacheco, D., Taylor, G., Janssen, P. H., & Swainson, N. M. (2022). Evaluation of Feed Near-Infrared Reflectance Spectra as Predictors of Methane Emissions from Ruminants. Animals, 12(18), 2478. https://doi.org/10.3390/ani12182478