Article

Impact of Autolysed Brewer’s Yeast and Soluble Dried Yeast Extract on Growth Performance and Mucosal Health of Atlantic Salmon (Salmo salar) Parr

1
Fish Health and Nutrition Research Group, School of Biological and Marine Sciences, University of Plymouth, Plymouth PL4 8AA, UK
2
Department of Fisheries and Aquaculture, Lagos State University of Science and Technology, Ikorodu 104101, Nigeria
3
Department of Fisheries and Aquaculture Technology, Olusegun Agagu University of Science and Technology, P.M.B. 353, Okitipupa 350105, Nigeria
4
Leiber GmbH, 49565 Bramsche, Germany
*
Authors to whom correspondence should be addressed.
Animals 2025, 15(3), 323; https://doi.org/10.3390/ani15030323
Submission received: 31 December 2024 / Revised: 18 January 2025 / Accepted: 21 January 2025 / Published: 23 January 2025
(This article belongs to the Special Issue Gut Microbiota in Aquatic Animals)

Simple Summary

The aquaculture industry is increasingly pursuing sustainable practices, including the use of functional feed additives (FFAs) to enhance fish health and growth, and reduce reliance on antibiotics usage in aquafeeds. Brewer’s yeast-derived additives have emerged as promising FFAs, showing significant potential in promoting sustainable aquaculture development. In this study, the use of commercial brewer’s yeast-derived feed additives was explored to improve the health and performance of Atlantic salmon. The salmon were fed diets supplemented with autolysed brewer’s yeast (ABY) or soluble dried yeast extract (SDYE) for nine weeks to assess their impact on skin and intestinal health, immune response, intestinal bacterial communities, and growth. The results showed that the brewer’s yeast additives, particularly ABY, improved intestinal structure, enhanced immune-related gene expression, and positively influenced the bacterial community in the intestine, all while maintaining healthy blood parameters and growth rates. These findings suggest that the yeast additives can support fish health and resilience, offering a sustainable way to boost aquaculture productivity while reducing reliance on antibiotics. This has potential benefits for both environmental sustainability and global food security.

Abstract

Yeast-based feed additives have emerged as promising functional feed additives (FFAs) to promote sustainable aquaculture development through enhanced gut health and immune modulation in fish. The present study evaluated the impact of autolysed brewer’s yeast (ABY) and soluble dried yeast extract (SDYE) in improving the intestinal and skin histology, immune response, and intestinal microbiome of Atlantic salmon parr (Salmo salar) over a 9-week feeding trial. Three experimental diets were produced: a control diet, a diet supplemented with ABY at 2.5 g/kg, and a diet supplemented with SDYE at 2.5 g/kg. These diets were administered to triplicate tanks of Atlantic salmon. The yeast-supplemented diets, especially ABY, improved intestinal mucosal fold length, lamina propria width, microvilli density, and intestinal goblet cell counts, as well as skin goblet cell counts. The yeast additives had no detrimental effects on the fish haematology, with no significant differences in haemoglobin concentration, red blood cell counts, and white blood cell counts among the treatment groups. Gene expression analysis revealed upregulation of il-1β and muc-2 in fish fed the ABY diet, indicating enhanced immune function and potentially mucosal protection. Intestinal microbiota analysis revealed Firmicutes as the most dominant phylum in all groups, followed by Actinobacteriota. Distinct bacterial community shifts were observed between the treatment groups, with a significant increase in the relative abundance of taxa such as Staphylococcus in yeast-supplemented diets and a significant decrease in Streptococcus and Weissella. Collectively, these findings suggest that the yeast additives, especially ABY, enhance gut health and immune function without compromising growth performance.

1. Introduction

Atlantic salmon (Salmo salar) is an important species in global aquaculture. With Norway, Chile, the United Kingdom, and Canada leading production, Atlantic salmon ranks as one of the most valuable farmed finfish, reaching 2.87 million metric tonnes in global output, and valued at USD 21.92 billion in 2022 [1]. In addition to its economic significance, Atlantic salmon is a valuable source of omega-3 fatty acids, which are essential nutrients for human health [2].
As the aquaculture industry pursues more sustainable practices, there is growing interest in identifying functional feed additives (FFAs) that can be optimised for different fish species at various stages of development. Studies have shown that FFAs can enhance fish disease resilience, improve nutrient absorption, and reduce dependence on antibiotics, contributing to more sustainable production systems [3,4]. Brewer’s yeast and its derivative products are particularly promising FFAs due to their rich content of bioactive compounds like β-glucans, mannan oligosaccharides (MOS), nucleotides, and peptides, which are known to support fish growth, modulate immune responses, enhance gut health, and influence gut microbial diversity [5,6,7].
Mucosal health plays a vital role in maintaining the overall well-being of fish by serving as the first line of defence against pathogens and environmental stressors [8,9]. Enhancing mucosal health through diet, particularly with the inclusion of functional feed additives, can improve epithelial barrier integrity, boost goblet cell production, and modulate immune-related gene expression, ultimately leading to better disease resistance and growth performance [10,11]. As such, interventions targeting mucosal health not only contribute to individual fish resilience but also enhance the productivity and sustainability of aquaculture systems.
Several studies have reported the beneficial effects of yeast-derived additives, especially β-glucans and MOS, on Atlantic salmon. These additives have been associated with improved growth performance [12], favourable changes in gut morphology [13,14], and enhanced mucosal immunity [15], as well as modulated gut microbial communities [16]. Despite these promising findings, research on the specific effects of other brewer’s yeast-derived products, such as fully autolysed brewer’s yeast (ABY) and soluble dried yeast extract (SDYE), on gut health in Atlantic salmon parr remains limited.
This study investigates the effects of two commercial yeast additives, an autolysed brewer’s yeast (CeFi® Pro, Leiber GmbH, Bramsche, Germany) and a soluble dried yeast extract (SDYE, Leiber GmbH, Bramsche, Germany), on the growth performance and mucosal health of Atlantic salmon parr. ABY is produced through gentle autolysis, retaining both the yeast cell wall and the cell interior, and contains bioactive substances such as β-glucans, MOS, nucleotides, and peptides. In contrast, SDYE is produced by detaching the yeast cell interior from the yeast cell wall, and comprises only the soluble components of the cell interior, such as nucleotides and peptides. Due to their bioactive components, these two yeast additives are hypothesised to improve growth and mucosal health in Atlantic salmon parr. By assessing histological, haematological, and immunological impacts and analysing microbial community shifts associated with these dietary supplements, this study primarily aims to determine their efficacy in enhancing the overall health of Atlantic salmon parr under experimental conditions.

2. Materials and Methods

2.1. Experimental Design and Fish

The feeding trial was carried out at the University of Plymouth in a cold freshwater recirculating aquaculture system (RAS) of the Fish Health and Nutrition Research Group. The RAS system consisted of 9 rectangular fibreglass tanks. The water volume in each tank was maintained at 70 L and recirculated at a rate of 900 L per hour. Each tank was supplied with continuous aeration, and the water quality parameters were closely monitored and maintained to ensure they remained within a suitable range for Atlantic salmon parr. The Atlantic salmon parr were purchased from Landcatch Ltd. in Scotland, United Kingdom, and were acclimated in the experimental system for 2 weeks before starting the experiment. After acclimation, 180 Atlantic salmon parr (37.08 ± 0.10 g) were randomly allocated into 9 experimental tanks, with 20 fish allotted to each tank. The average water temperature was 15.64 ± 0.27 °C, pH 6.76 ± 0.25, dissolved oxygen 9.99 ± 0.22 mg/L, nitrate 24.86 ± 6.32 mg/L, nitrite 0.02 ± 0.01 mg/L, and ammonium 0.02 ± 0.01 mg/L. Throughout the trial and during acclimation, the Atlantic salmon parr were subjected to a fixed light and dark photoperiod of 12 h each.

2.2. Experimental Diets and Feeding

The yeast additives investigated included an autolysed brewer’s yeast (ABY; CeFi® Pro) and a soluble dried yeast extract (SDYE) produced and supplied by Leiber GmbH, Bramsche, Germany. The CeFi® Pro is a specially dried autolysed brewer’s yeast feed ingredient (100% Saccharomyces cerevisiae) consisting of both cell wall components (predominantly ß-glucans and mannans) and soluble cell content (nucleotides, peptides, amino acids, etc.). The cell wall of the ABY (CeFi® Pro) is partially perforated, and the cell content is broken down into smaller fragments due to the autolysis process, thereby increasing the bioavailability and bioactivity. The SDYE is a soluble dried brewer’s yeast extract feed ingredient (100% Saccharomyces cerevisiae) consisting of soluble cell content only. The nutritional profile of the two yeast additives is shown in Table 1.
Three isonitrogenous and isolipidic diets, containing approximately 48% protein and 24% lipid, were formulated to meet the established nutrient requirements for Atlantic salmon parr [17] using Animal Feed Optimisation Software (AFOS) Cloud. The experimental diets were produced in the Nutrition and Product Development Laboratory at the University of Plymouth using commercially relevant raw materials (Table 2). The experimental diets included a basal diet (control) and two diets supplemented with brewer’s yeast additives, the ABY diet (2.5 g/kg) and the SDYE diet (2.5 g/kg). The proximate composition of the diets (Table 2) was determined following AOAC protocols [18]. The nitrogen-free extract was calculated by subtracting the sum of crude protein, lipid, moisture, and ash from 100, while the gross energy was estimated by applying the conversion factors for protein (5.65 kcal/g), lipid (9.45 kcal/g), and NFE (4.10 kcal/g) [19].
Each experimental diet was tested in triplicate over a 9-week feeding trial, with fish hand-fed their respective diet daily at 1% of body weight. The daily ration was divided into three equal portions and administered at 9:30, 13:00, and 16:30 h. Weekly, the total fish biomass in each tank was assessed by weighing all fish collectively, allowing the feed input to be recalculated and adjusted based on updated total body weight.

2.3. Fish Sampling

A total of 6 representative fish from each tank (18 per treatment) were collected, euthanised with an overdose of buffered MS222 (Sigma-Aldrich, Poole, UK) solution (200 mg/L water for 5 min), and brain pithed following the UK Home Office Schedule 1 guidelines. The MS222 solution was buffered with sodium bicarbonate to maintain the neutral pH of the water and reduce stress during euthanasia. For 3 of these fish per replicate (9 per treatment), length and weight were recorded to calculate the Fulton’s condition factor. Blood, skin (from the dorsal region, just above the lateral line), and posterior intestine (PI) samples were collected from this set for analyses.
Blood samples (ca 50 µL) were drawn from the caudal vein with a 25-gauge needle and 1 mL syringe, and transferred into a 1.5 mL microcentrifuge tube. From this, 4 µL was pipetted into a tube with 1 mL of Drabkin’s solution to determine haemoglobin concentration, while 20 µL was added to a tube with 980 µL of Dacie’s solution for red and white blood cell counts. Skin and PI samples were excised for histological analysis. Skin and PI samples (ca 5 mm) were prepared for light microscopy, while only PI samples (ca 2 mm) were analysed with electron microscopy. Tissues for light microscopy were fixed in 10% natural buffered formalin and stored at 4 °C for 48 h before transferring them to 70% ethanol for extended storage at room temperature. Samples for electron microscopy (scanning and transmission) histological analysis were fixed in 2.5% glutaraldehyde, with those for scanning electron microscopy (SEM) rinsed in 1% S-carboxymethyl-L-cysteine prior to fixation. For gene expression analysis, PI samples (ca 200 mg) were removed and immediately immersed in 1 mL of RNAlater™ solution (Invitrogen, Thermo Fisher Scientific, Loughborough, UK), stored at 4 °C for 24 h, and then moved to −80 °C for long-term storage until RNA extraction.
The remaining 3 fish per replicate (9 per treatment) were dissected under aseptic conditions to collect digesta from the PI for 16S rRNA gut microbiome analysis. Samples were placed in sterile, nucleic acid-free microcentrifuge tubes and stored at −80 °C until DNA extraction.

2.4. Growth Performance

After the 9-week feeding period, the final biomass of fish in each tank was weighed to assess growth performance using the following parameters:
Mean   weight   gain   g = Final   body   weight   g Initial   body   weight   g
Specific   growth   rate   %   / day = l n   Final   weight   g l n   Initial   weight   g Days   fed × 100
F e e d   c o n v e r s i o n   r a t i o = F e e d   i n t a k e g W e i g h t   g a i n g
F u l t o n s   c o n d i t i o n   f a c t o r = W e i g h t 100 L e n g t h 3

2.5. Histology

2.5.1. Light Microscopy

The fixed skin (n = 9 per treatment) and PI (n = 9 per treatment) samples were dehydrated with a Leica TP 1020 tissue processor (Leica Biosystems, Sheffield, UK) and embedded in paraffin wax using a Leica EG1150 H (Leica Biosystems, Sheffield, UK). Multiple transverse sections of 5 μm were then prepared on slides with a Leica RM2235 microtome (Leica Biosystems, Sheffield, UK) and stained with H&E (Haematoxylin and Eosin), AB/PAS (Alcian Blue/Periodic Acid Schiff), or Van Gieson using a Leica Autostainer XL (Leica Biosystems, Sheffield, UK). Photomicrographs of the stained sections were taken using a Leica DMD 108 microscope (Leica Biosystems, Sheffield, UK). The images were analysed for various parameters using ImageJ v1.54 software (National Institutes of Health, Bethesda, MD, USA). Morphometric measurements, including mucosal fold length, muscularis thickness, and lamina propria width, were taken from H&E-stained PI sections, with five folds measured per section for each parameter. Goblet cell counts in skin and PI samples were assessed using AB/PAS- and Van Gieson-stained sections. For PI samples, goblet cells were counted across five folds per image and averaged over a standardised distance of 100 μm per fold. For skin samples, counts were averaged over five separate 200 μm standardised distances per section.

2.5.2. Electron Microscopy

The fixative (2.5% glutaraldehyde) in the PI samples for SEM (n = 9 per treatment) and TEM (n = 9 per treatment) was replaced twice with 0.1 M sodium cacodylate buffer (pH = 7.2) for 15 min each to ensure complete removal. SEM samples were then dehydrated through a series of incremental ethanol solutions up to 100% for 15 min each. The samples were then transferred into a 2:1 solution of 100% ethanol and hexamethyldisilazane (HMDS) for 20 min, followed by a 1:2 100% ethanol–HMDS solution for another 20 min, and then placed in fresh 100% HMDS twice for 20 min each. Afterward, they were left in HMDS overnight to dry. The dried samples were affixed to stubs using silver paint, coated with gold, and imaged with a JEOL JSM-6610LV Scanning Electron Microscope (JEOL, Tokyo, Japan) at ×20,000 magnification.
Samples for TEM were post-fixed in 1% OsO4 for 1 h, and then rinsed with sodium cacodylate 0.1 M buffer solution. The samples were then dehydrated through incremental ethanol concentrations before being embedded in resin following the standard procedure. Ultrathin sections (90 nm) were then cut from the resin blocks with a diamond knife, mounted on copper grids, and stained with uranyl acetate and Reynolds lead citrate. Micrographs of microvilli length were captured at ×20,000 magnification using a JEOL 1400 Transmission Electron Microscope (JEOL, Tokyo, Japan) at 120 kV.
All images were analysed with ImageJ v1.54 software. SEM images were analysed to quantify the microvilli density (arbitrary units [AU]), while the TEM images were analysed to measure the microvilli length, as outlined by Merrifield et al. [20].

2.6. Haematology

2.6.1. Haemoglobin Concentration

The haemoglobin concentration was determined using the Drabkin’s reagent (Sigma-Aldrich, Poole, UK) protocol. The blood samples (n = 9 per treatment) mixed with the Drabkin’s solution were gently homogenised and left at room temperature for 5 min before placing in a spectrophotometer to read the absorbance at 540 nm. The haemoglobin concentrations in the test samples were determined from a standard curve of lyophilised haemoglobin porcine powder (Sigma-Aldrich, Poole, UK) and calculated using the following formula:
H a e m o g l o b i n   c o n c e n t r a t i o n   ( g / d L ) = A 540   o f   s a m p l e × D i l u t i o n   f a c t o r A 540   o f   s t a n d a r d
where A540 = absorbance at 540 nm.

2.6.2. Blood Cell Count

The red blood cell (RBC) and white blood cell (WBC) counts were determined using the Dacie’s solution protocol. The mixed blood and Dacie’s solution (n = 9 per treatment) was vortexed for 60 s to ensure adequate dispersion of the blood cells. Ten μL of the sample was then pipetted onto a Neubauer haemocytometer (LO−LaborOptik, Lancing, UK to estimate the total RBC and WBC following standard protocol.

2.7. Gene Expression

2.7.1. RNA Extraction and cDNA Synthesis

RNA extraction from the PI and cDNA synthesis were performed following the procedures described by Rawling et al. [21]. Briefly, for total RNA extraction, samples (n = 9 per treatment) were placed in lysing tubes containing 1 mL of TRI reagent™ solution (Invitrogen, Thermo Fisher Scientific, Loughborough, UK) and homogenised using the FastPrep-24™ 5G lysis system (MP Biomedicals, Irvine, CA, USA). Phase separation was achieved by adding chloroform, followed by RNA precipitation with isopropanol. The resulting RNA pellets were washed with ethanol and dissolved in DEPC-treated water. The Qiagen RNeasy Plus Mini Kit (QIAGEN, Manchester, UK) was subsequently used to further purify the RNA and remove any DNA contamination. The quality and concentration of RNA were assessed by measuring absorbance ratios at 260/230 nm and 260/280 nm using the NanoDrop™ 2000 UV-Vis spectrophotometer (Thermo Fisher Scientific, Loughborough, UK). RNA purity and integrity were further confirmed using agarose gel electrophoresis.
For cDNA synthesis, 1 μg of extracted RNA was used in a 20 μL reaction volume with the iScript cDNA synthesis kit (Bio-Rad, Watford, UK). The reaction consisted of a priming step (5 min at 25 °C), followed by reverse transcription (20 min at 46 °C), and a final heat inactivation step (95 °C for 1 min).

2.7.2. Quantitative Real-Time PCR (qPCR)

The qPCR reaction for each sample was carried out using the SYBR green method and performed on a QuantStudio 12K Flex Real-Time PCR System (Applied Biosystems, USA), following the protocol outlined by Rawling et al. [21]. The relative expression level of 5 target genes, interleukin-1 beta (il-1β), tumor necrosis factor alpha (tnf-α), interleukin-10 (il-10), mucin 2 (muc-2), and claudin 15 (cldn-15), were analysed. Two reference genes, glyceraldehyde 3-phosphate dehydrogenase (gapdh) and elongation factor 1 alpha (ef1α), were used to normalise the results for each sample. Prior to the qPCR analysis of each sample, the expression stability measure “M” for the reference genes was determined [22]. All primers used for this gene expression analysis (Table 3) were from a previous study [23]. The primers were further validated by conducting a PCR efficiency analysis using the method of Rasmussen [24].

2.8. Intestinal Microbiome Analysis

2.8.1. DNA Extraction

DNA extraction from digesta samples (n = 9 per treatment) was conducted using the QIAamp PowerFecal Pro DNA Kit (QIAGEN, Manchester, UK) in accordance with the manufacturer’s protocol. Briefly, 250 mg of digesta was placed in a lysis tube with 800 µL of lysis buffer and vortexed for 10 min to ensure homogenisation. After centrifuging the mixture, the supernatant was treated with precipitation buffers to isolate the DNA, which was further purified through a series of wash steps in a spin column. The purified DNA was eluted in 50 µL of elution buffer and assessed for quality and concentration using a NanoDrop™ 2000 UV-vis spectrophotometer (Thermo Fisher Scientific, Loughborough, UK). The DNA samples were stored at −20 °C for downstream applications.

2.8.2. PCR Amplification and High-Throughput Sequencing

The PCR amplification and sequencing were conducted by Novogene Company Limited, Cambridge, UK. The 16S V3-V4 region was amplified using the primers 341F (5′-CCTACGGGNGGCWGCAG-3′) and 805R (5′-GGACTACNNGGGTATCTAAT-3′). Each PCR reaction contained approximately 10 ng of template DNA, 0.2 µM primers, and 15 µL Phusion High-Fidelity PCR Master Mix. Thermal cycling conditions included an initial denaturation at 98° C for 1 min, followed by 30 cycles of denaturation at 98 °C for 10 s, annealing at 50 °C for 30 s, and elongation at 72 °C for 30 s, with a final elongation at 72 °C for 5 min. The PCR products were purified with magnetic beads, pooled in equimolar concentrations, and then prepared for sequencing by adding indexed adapters. The libraries were quantified and validated before sequencing on an Illumina platform to provide high-resolution microbial community data.
The sequencing data were processed by merging paired-end reads using FLASH software v1.2.11 [25], and then filtered for quality with fastp [26]. Chimeric sequences were identified and removed using VSEARCH v2.16.0 [27]. High-quality sequences were then denoised with DADA2 to generate Amplicon Sequence Variants (ASVs) [28], which were taxonomically classified against the SILVA 138.1 database using the QIIME2 pipeline v202202 [29]. Phylogenetic relationships were analysed using QIIME2, and diversity metrics (alpha and beta) were computed based on normalised sequence data to examine community structure variations. UPGMA clustering was employed for dimensionality reduction and visualisation of community differences across samples, enabling detailed insights into microbial community composition.

2.9. Statistical Analysis

The statistical analysis of qPCR data was conducted using RStudio v2024.04.0+735 (RStudio PBC, Boston, MA, USA), while growth performance, haematology, and histology data were analysed using SPSS v22 (SPSS Inc., Chicago, IL, USA). For RT-qPCR data, a permutation test was applied following Röhmel [30]. Growth, haematology, and histology data were first assessed for normality using the Shapiro–Wilk test. Normally distributed data were analysed with one-way ANOVA, followed by Tukey’s HSD post hoc test to identify significant differences between treatment groups. For non-normally distributed data, the Kruskal–Wallis test was applied, with Dunn’s post hoc test for pairwise comparisons.
Intestinal microbiota sequencing data were analysed using R software v4.0.3 with vegan (v2.6-8) and ggplot2 (v3.5.1) packages. To assess differences in species composition and community structure, several statistical tests were performed, including Analysis of Similarity (ANOSIM), Permutational Multivariate Analysis of Variance (ADONIS), and ANOVA. Significance was accepted at p < 0.05 for all tests.

3. Results

3.1. Histology

3.1.1. Light Microscopy

The light microscopy histological analysis results of the PI and skin of Atlantic salmon parr are presented in Table 4. The photomicrographs revealed that fish from all treatment groups exhibited an intact epithelial barrier and well-organised mucosal folds, consisting of a simple lamina propria and numerous goblet cells (Figure 1 and Figure 2). The results showed that fish fed yeast-supplemented diets, especially the ABY treatment group, had improved intestinal morphology, including a higher number of goblet cells in both the intestine and skin. Specifically, the mucosal fold length was significantly longer (p < 0.05) in the ABY (307.41 ± 66.03 µm) and SDYE (375.98 ± 69.77 µm) groups compared with the control group (203.74 ± 35.04 µm). Additionally, the lamina propria width in fish fed the ABY diet (11.86 ± 2.11 µm) was significantly narrower (p = 0.04) compared with those fed the control diet (16.81 ± 6.13 µm). The number of goblet cells in the PI of fish in the ABY group (9.44 ± 1.91 n/100 µm) was significantly higher (p = 0.04) than in the control group (7.01 ± 1.71 n/100 µm). Similarly, the goblet cell counts in the skin of fish receiving the ABY diet (18.22 ± 2.48 n/200 µm) were significantly higher (p = 0.02) than those of the control group (14.56 ± 2.85 n/200 µm).

3.1.2. Electron Microscopy

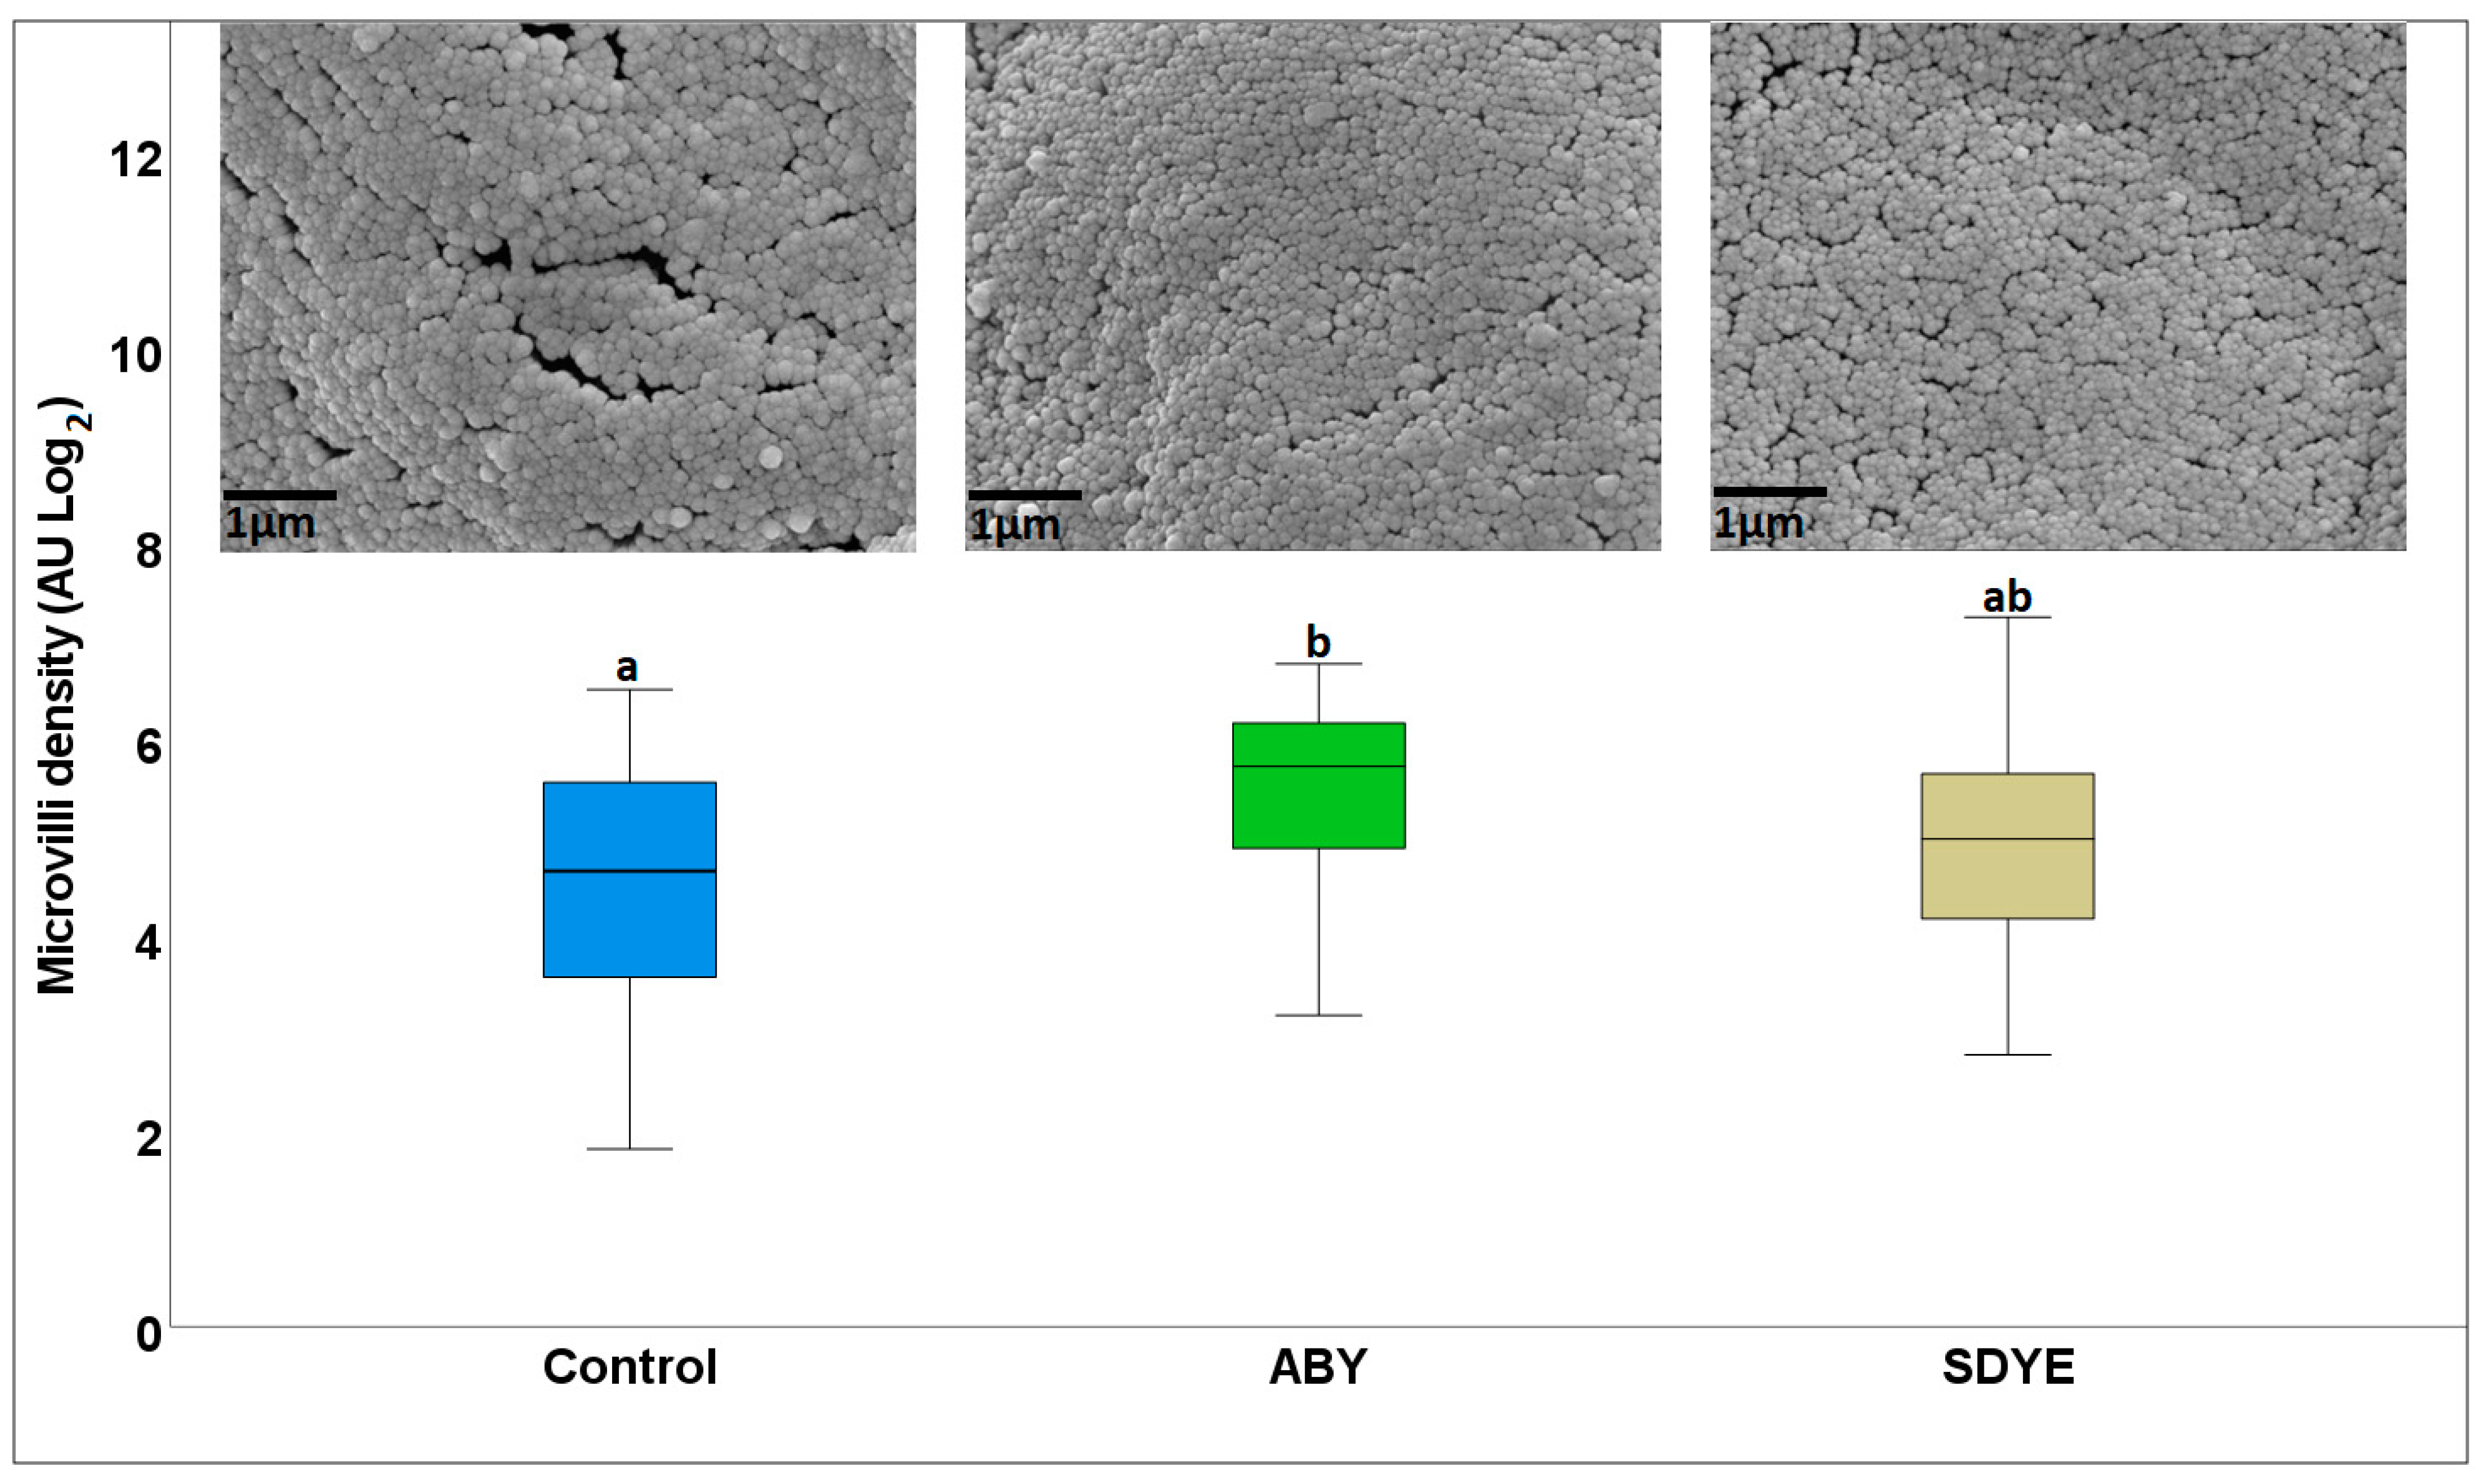
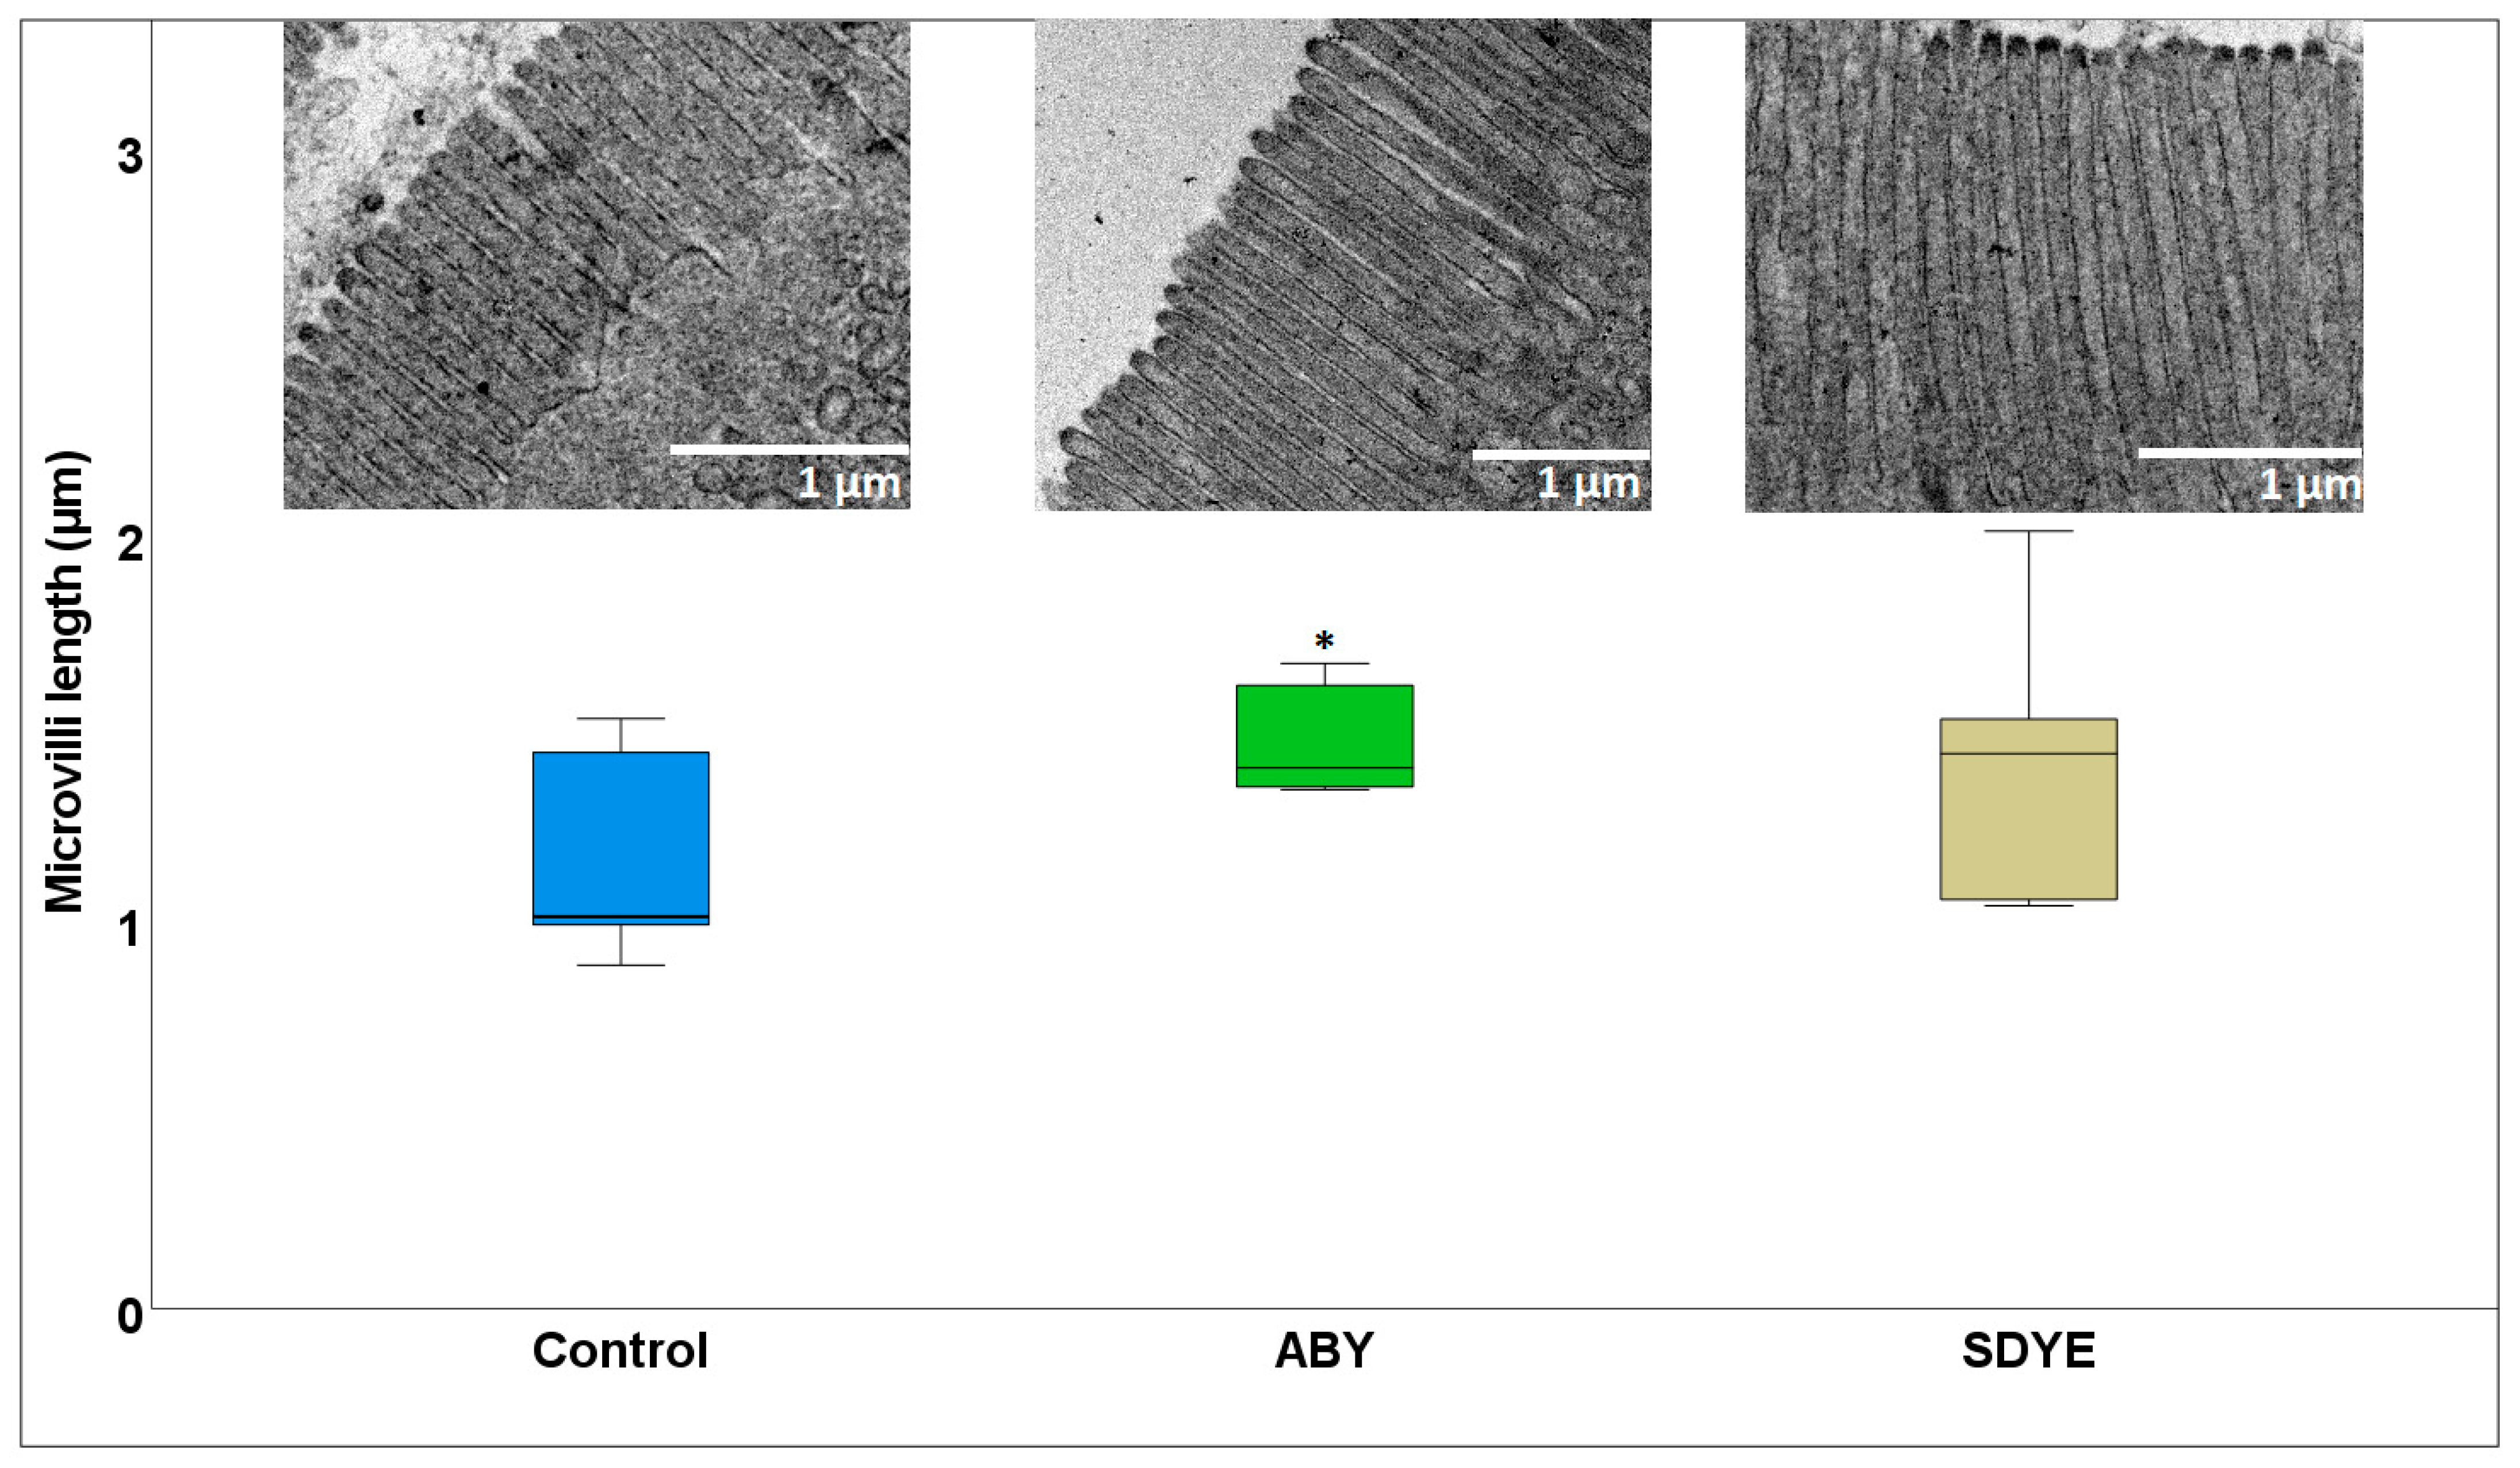
The electron microscopy result revealed a healthy brush border with densely packed microvilli across all treatment groups, with no evidence of necrosis or structural disruption (Figure 3 and Figure 4). The microvilli density in Atlantic salmon parr fed the ABY diet (5.36 ± 1.12 AU) was significantly higher (p = 0.03) than in those fed the control diet (4.57 ± 1.27 AU) (Figure 3). Similarly, the microvilli length (1.46 ± 0.14 µm) in the fish fed ABY were numerically longer than in the control group (1.15 ± 0.27 µm), with a p value approaching significance (p = 0.052) (Figure 4).

3.2. Haematology

The haemoglobin concentration and blood cell counts in Atlantic salmon parr fed the experimental diets for the 9-week feeding period are shown in Table 5. The Atlantic salmon in all treatment groups exhibited normal blood parameters. The haemoglobin concentration, RBC, and WBC counts were not significantly different (p > 0.05) among the treatment groups.

3.3. Gene Expression

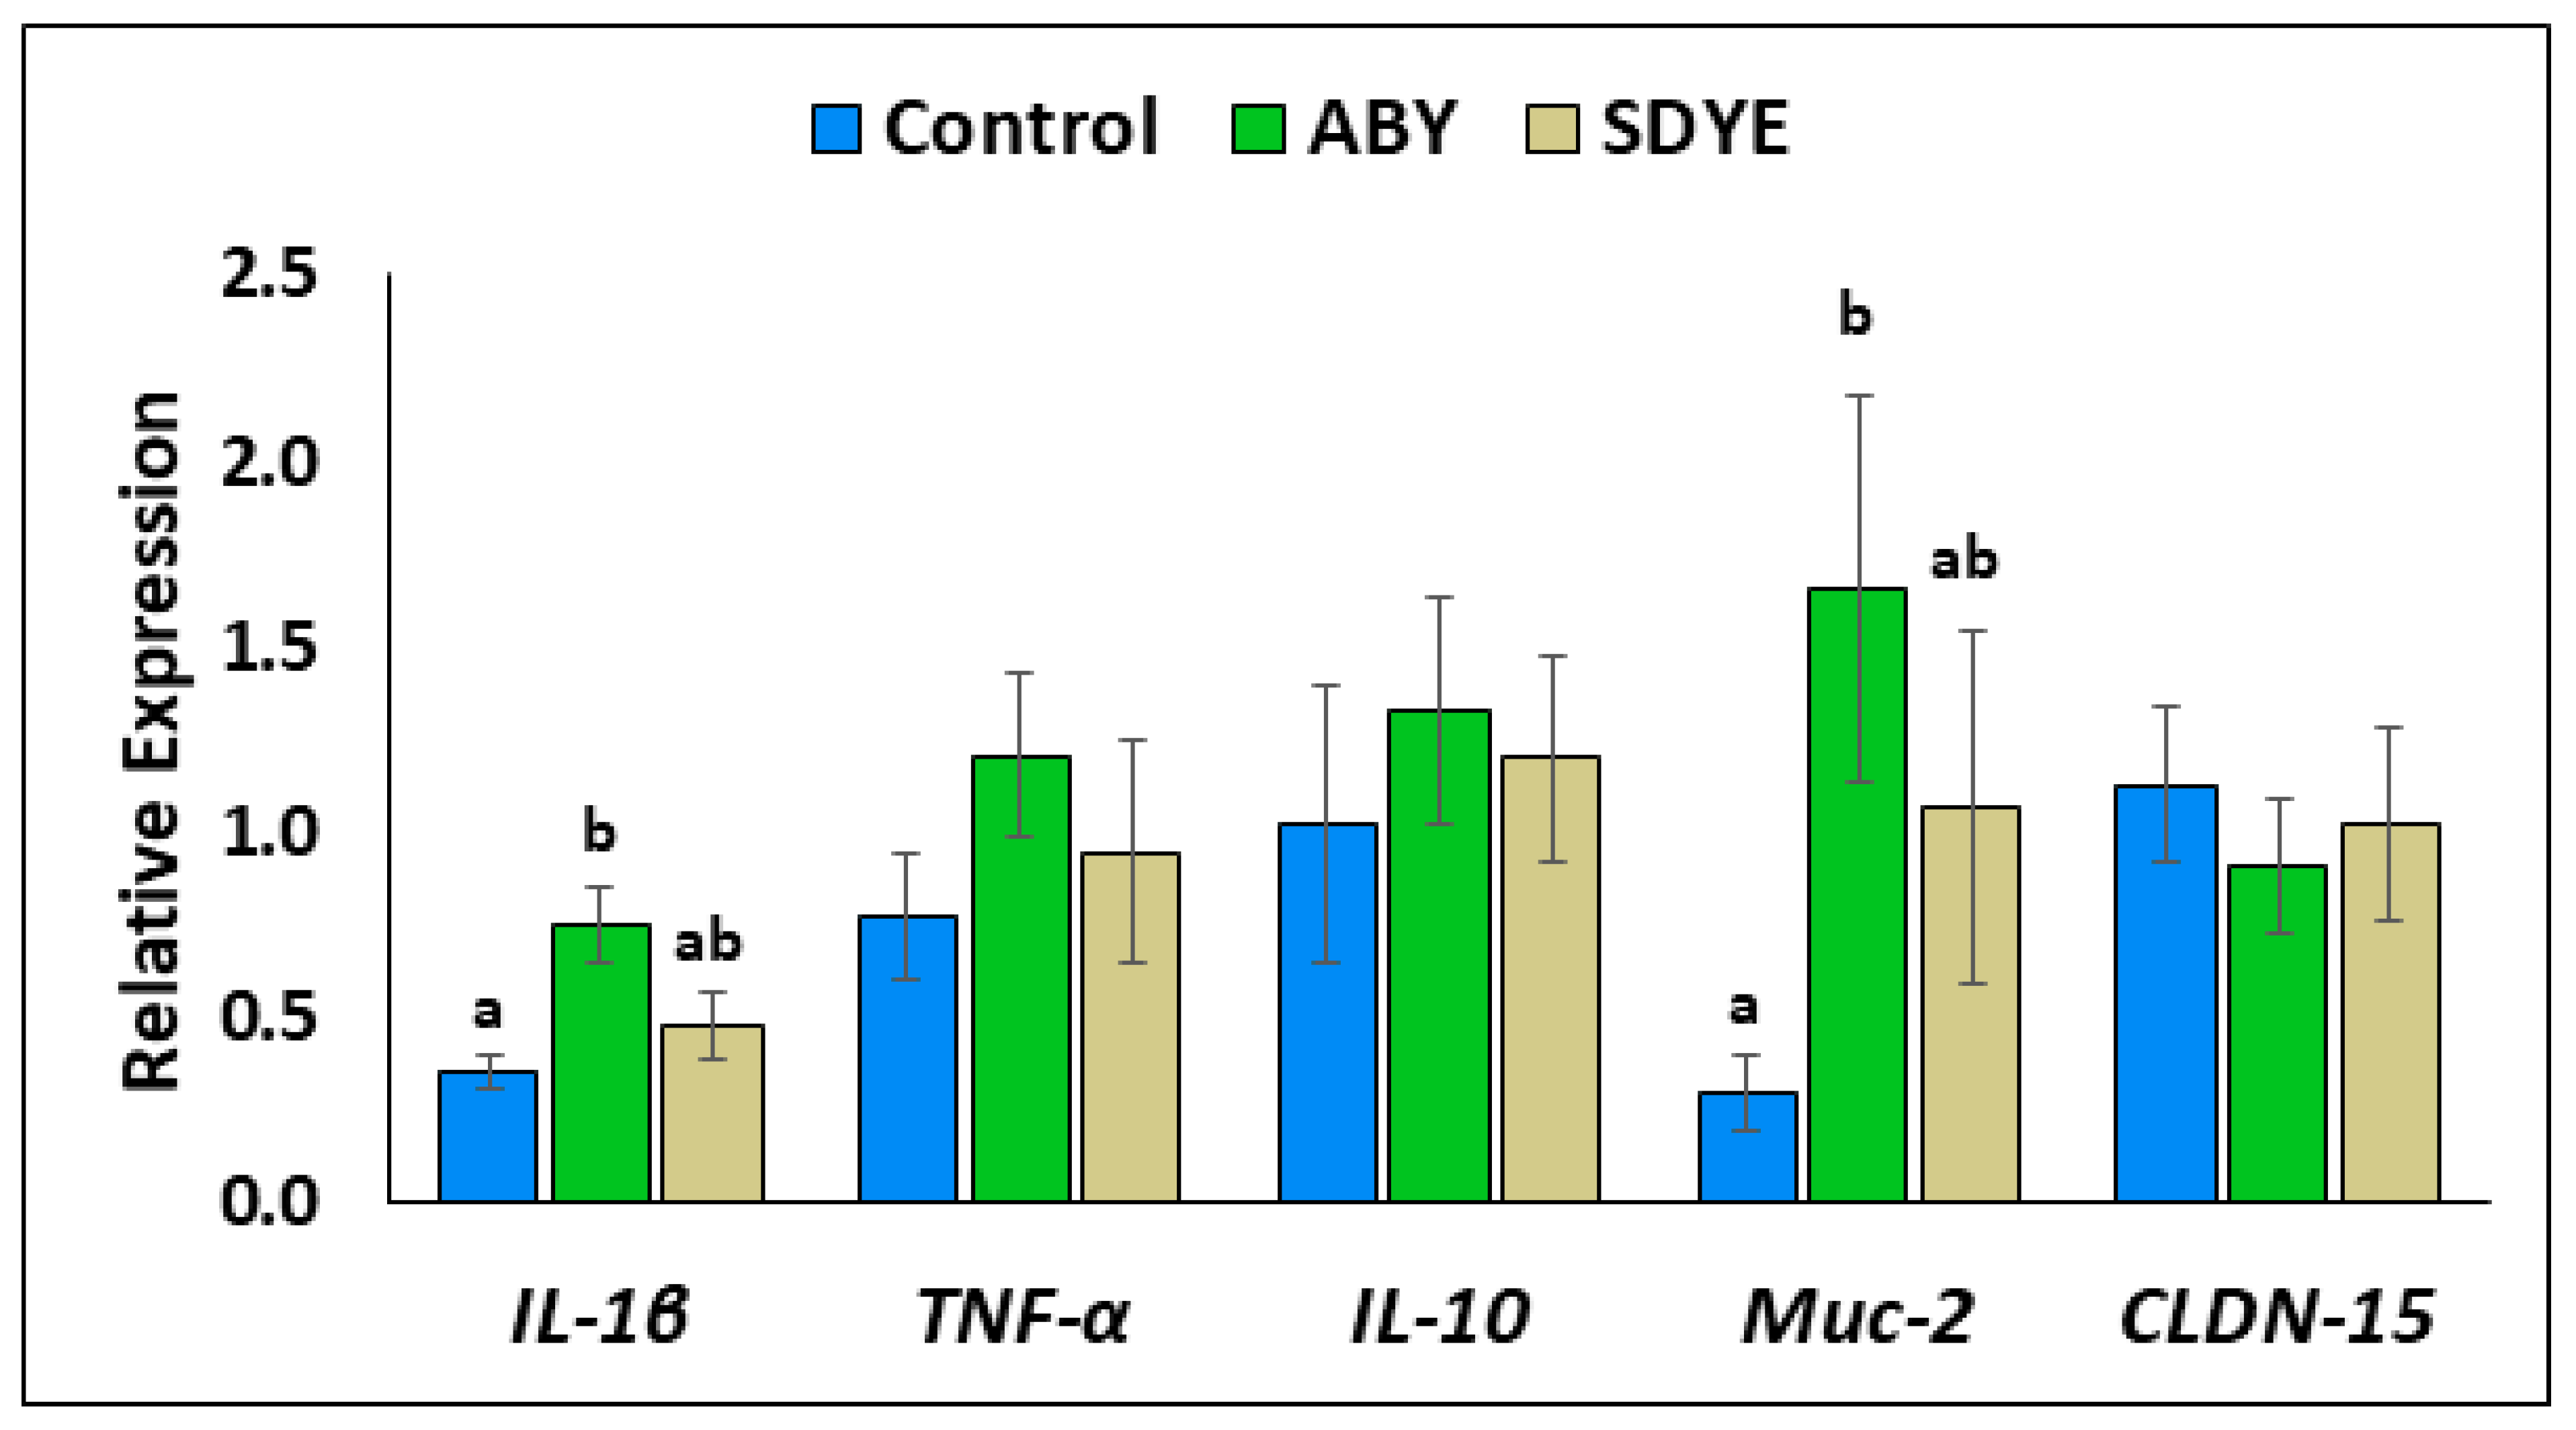
The relative expressions of the five target genes in the PI of Atlantic salmon parr following the 9-week feeding trial are presented in Figure 5. The result showed the expression level of il-1β in the PI of Atlantic salmon parr fed the ABY diet (0.88 ± 0.12) to be significantly higher (p = 0.004) than that in the control group (0.41 ± 0.05). Similarly, muc-2 expression was significantly upregulated (p = 0.01) in Atlantic salmon fed the ABY diet (1.94 ± 0.61) compared with in those fed the control diet (0.35 ± 0.11). All other analysed genes (tnf-α, il-10, and cldn-15) exhibited no significant difference (p > 0.05) across the treatment groups.

3.4. Intestinal Microbiome

3.4.1. Sequencing and ASVs Identification

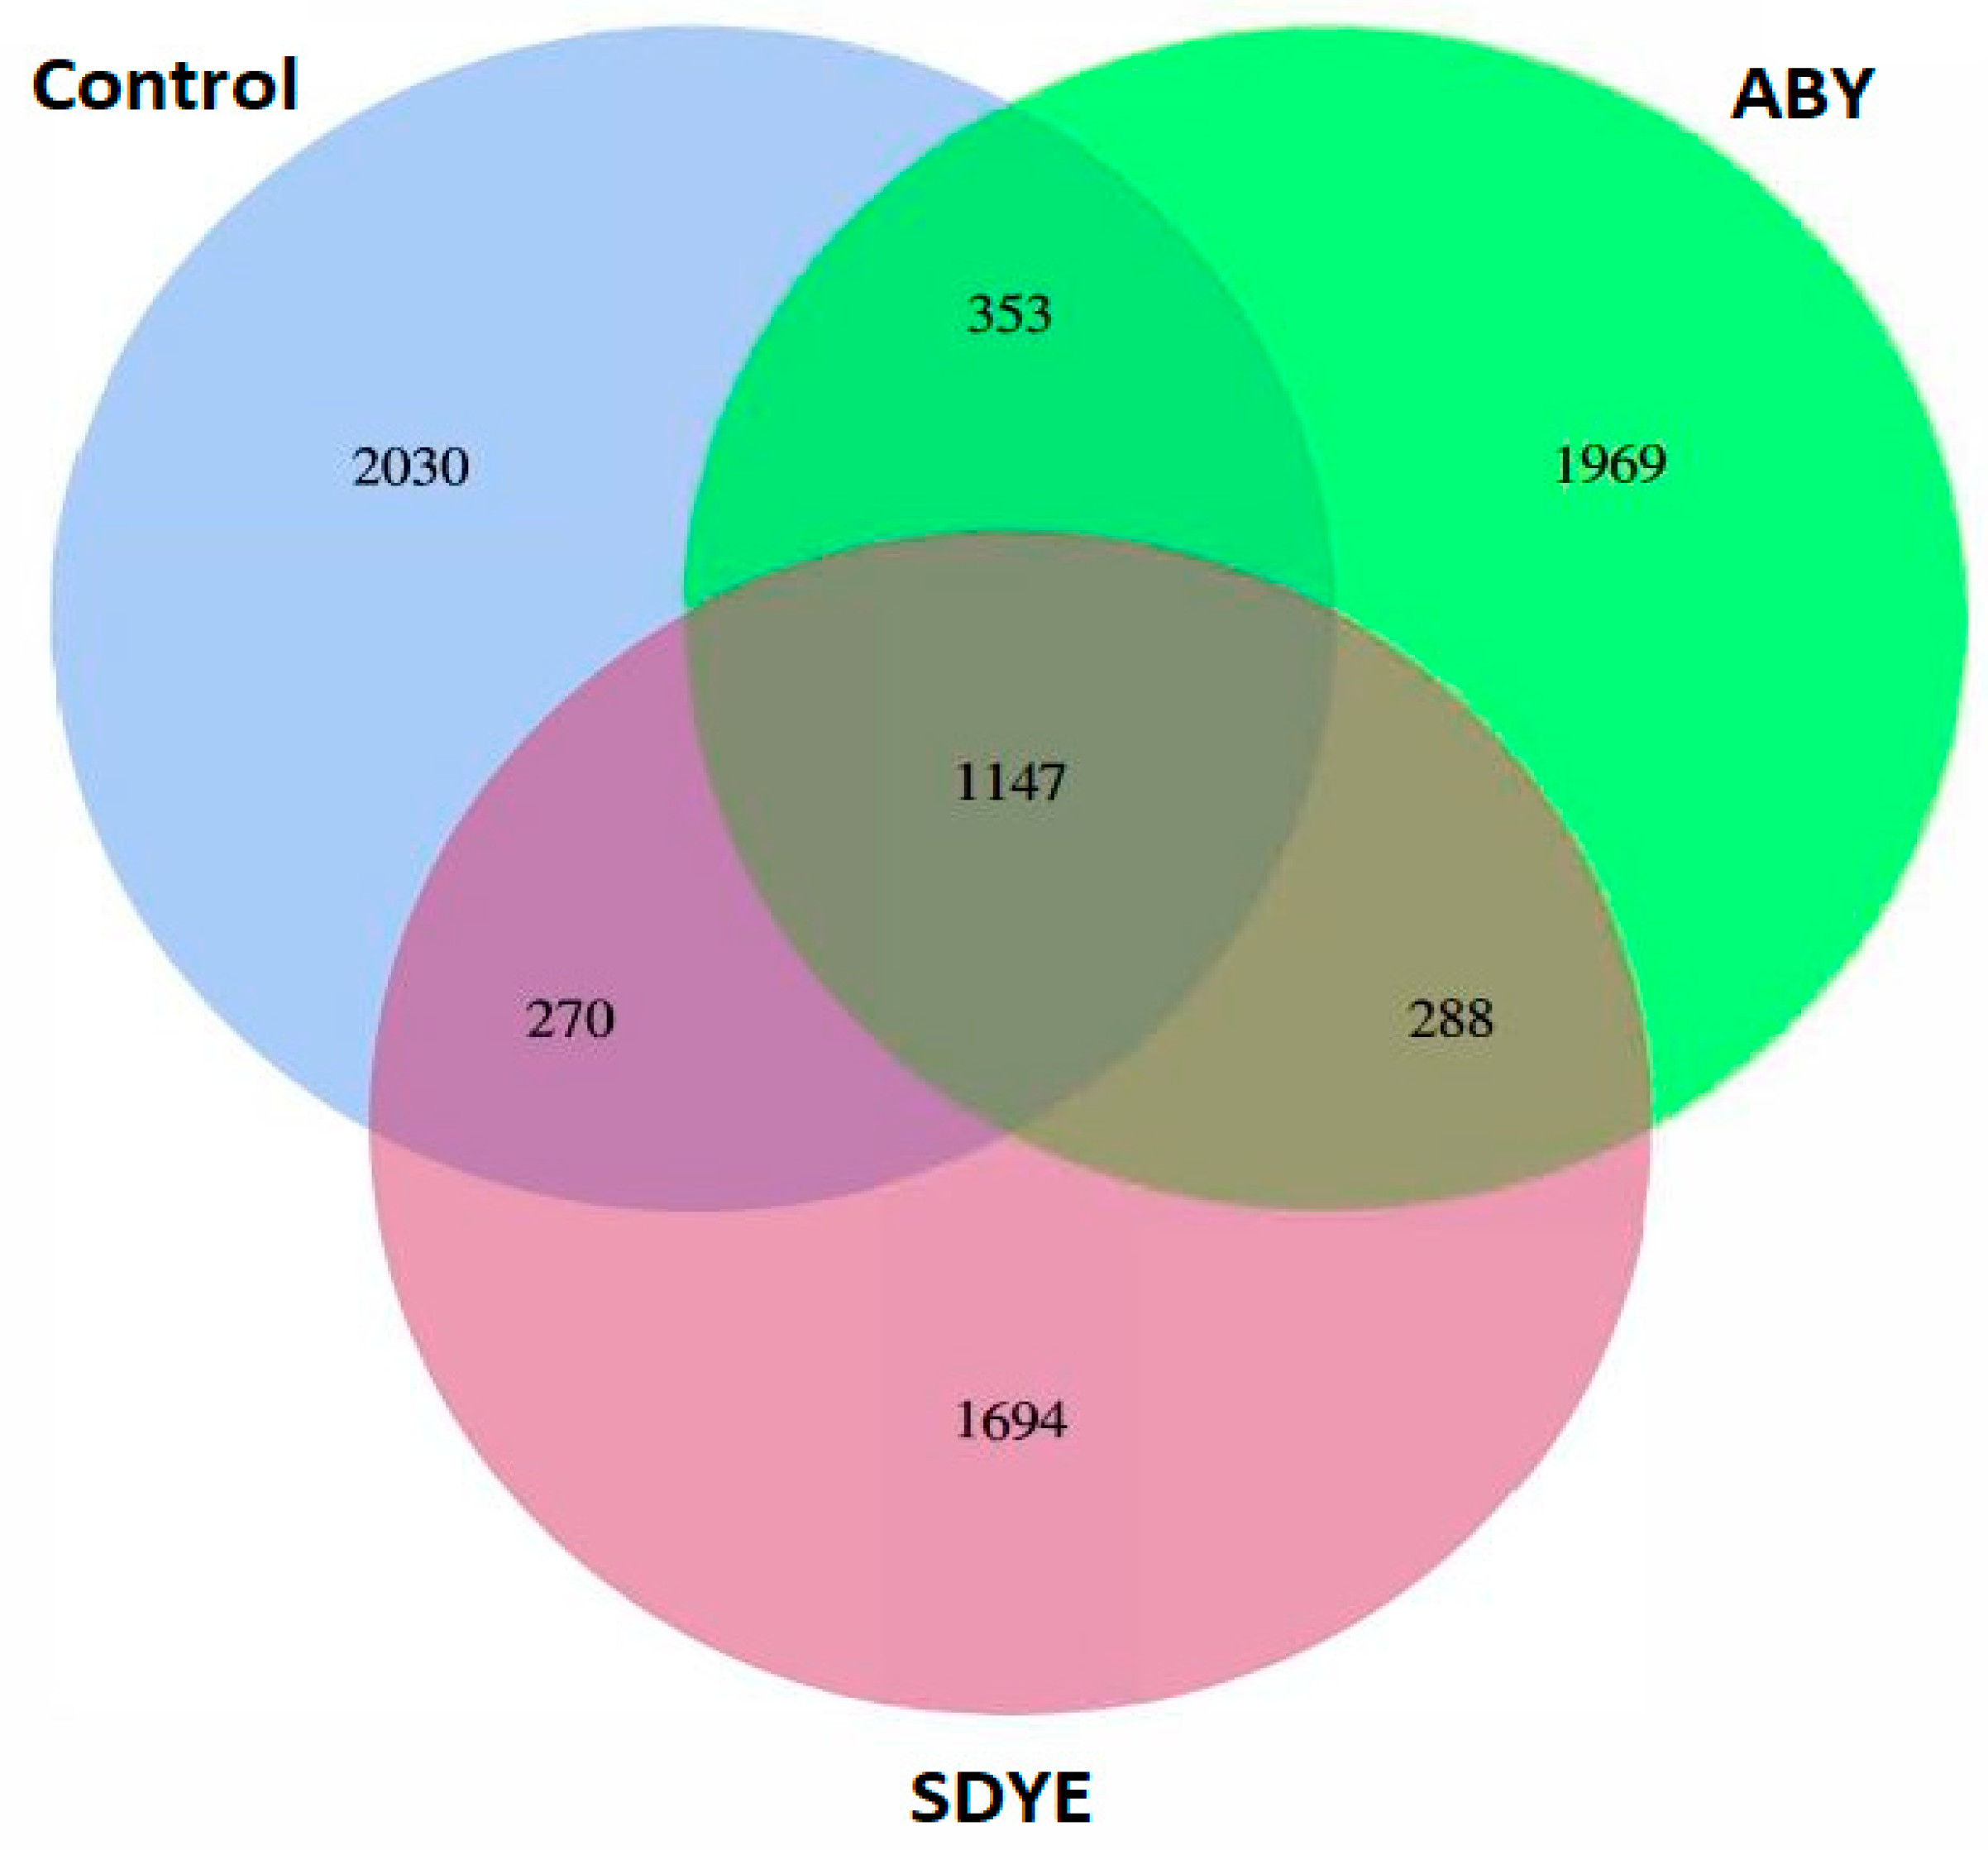
A total of 2,851,529 raw paired-end reads were obtained across all treatment groups. Following quality control and removal of chimeras, 2,610,365 high-quality reads were retained for downstream analysis, with mean values of 100,899 ± 6,575 for the control, 94,188 ± 2,059 for ABY, and 94,952 ± 5,462 for SDYE (n = 9 per treatment) (Table 6). From these 27 samples, 7,751 unique ASVs were identified, representing a total of 2,456,278 sequences (Figure 6). Among the detected ASVs, 14.8% (1,147 ASVs) were common to all the three treatment groups. Meanwhile, 26.2% (2,030 ASVs) were specific to the control group, 25.4% (1,969 ASVs) were unique to the ABY group, and 21.9% (1,694 ASVs) were unique to the SDYE group.

3.4.2. Diversity and Community Structure

Good’s coverage values of 1 were achieved for all treatment groups, indicating that the sequencing depth was sufficient to accurately capture the full diversity of the ASVs present in the sampled populations. The alpha diversity indices revealed no significant differences (p > 0.05) between the treatment groups (Table 7). However, UPGMA cluster analysis using weighted UniFrac distances (Figure 7) revealed that the communities of the two yeast treatment groups were more similar to one another than they were to those of the control group. ANOSIM values (Table 8) indicated moderate (R = 0.42816; p = 0.001) or weak (R = 0.19342; p = 0.002), yet statistically significant, separation of ABY and SDYE communities compared with the control group communities, respectively. ADONIS results (Table 8) indicated the same with F = 4.311 and F = 3.125 for control–ABY and control–SDYE, respectively (p < 0.002).

3.4.3. Bacterial Composition

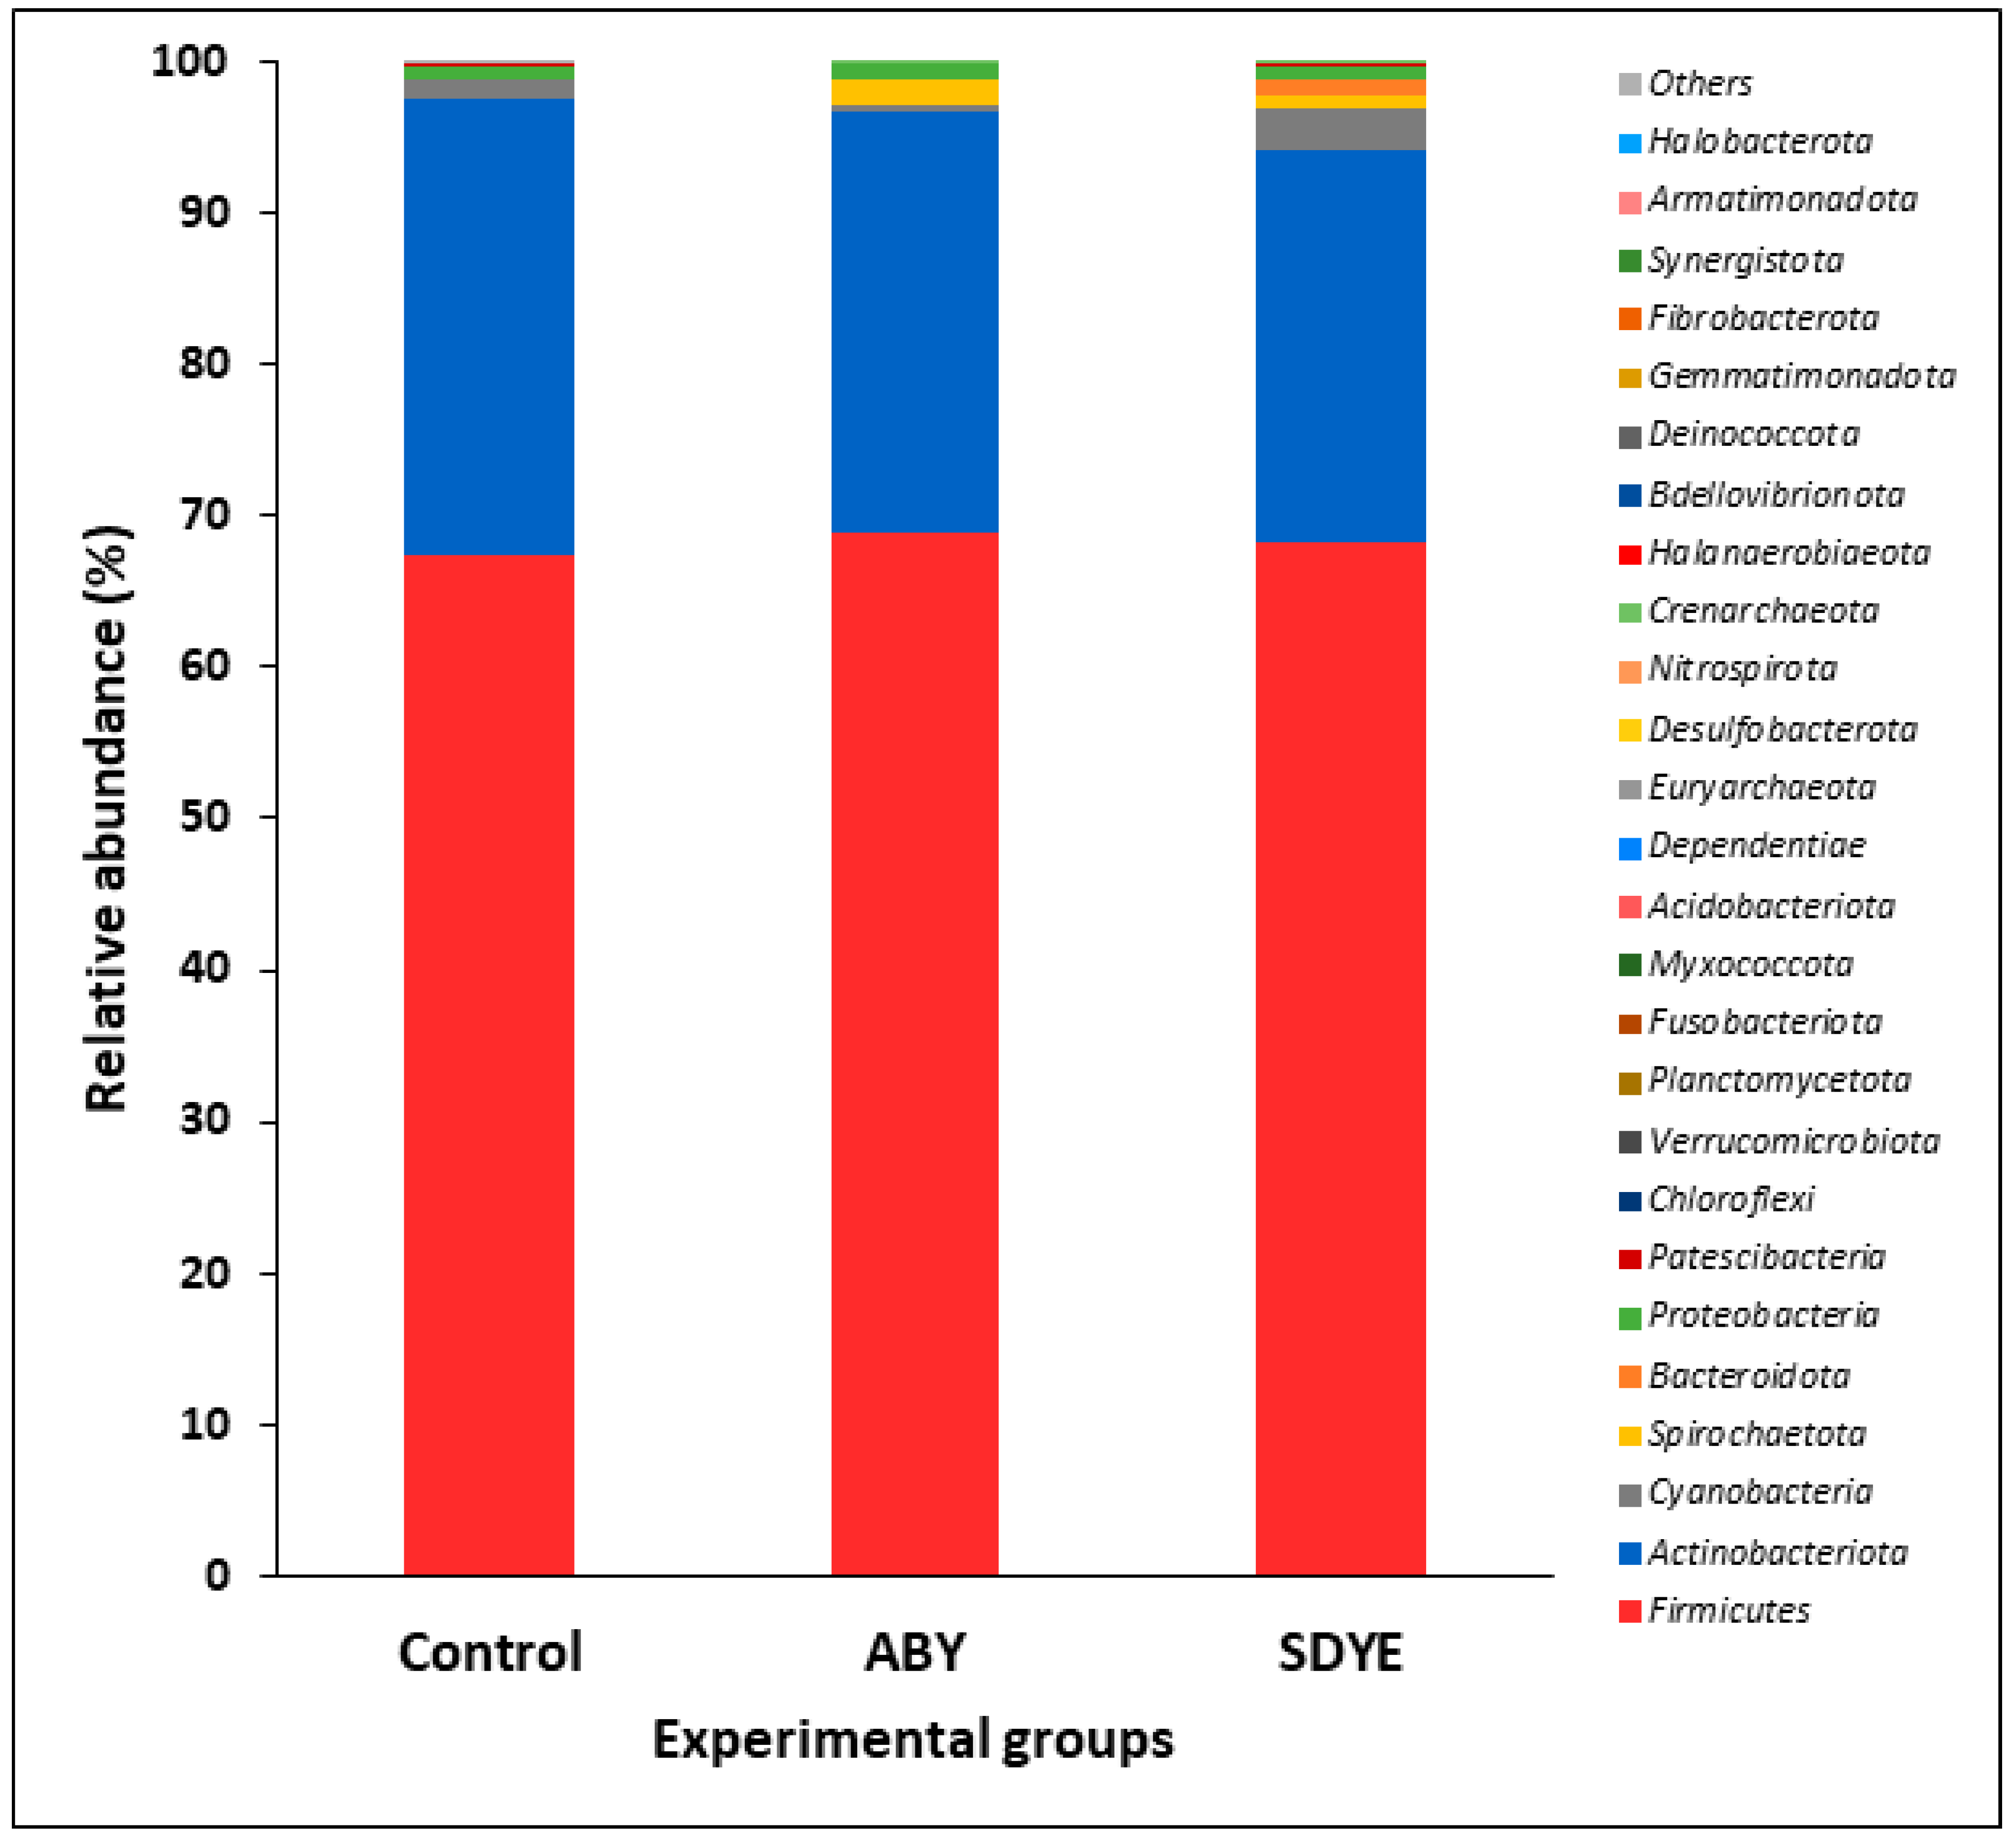
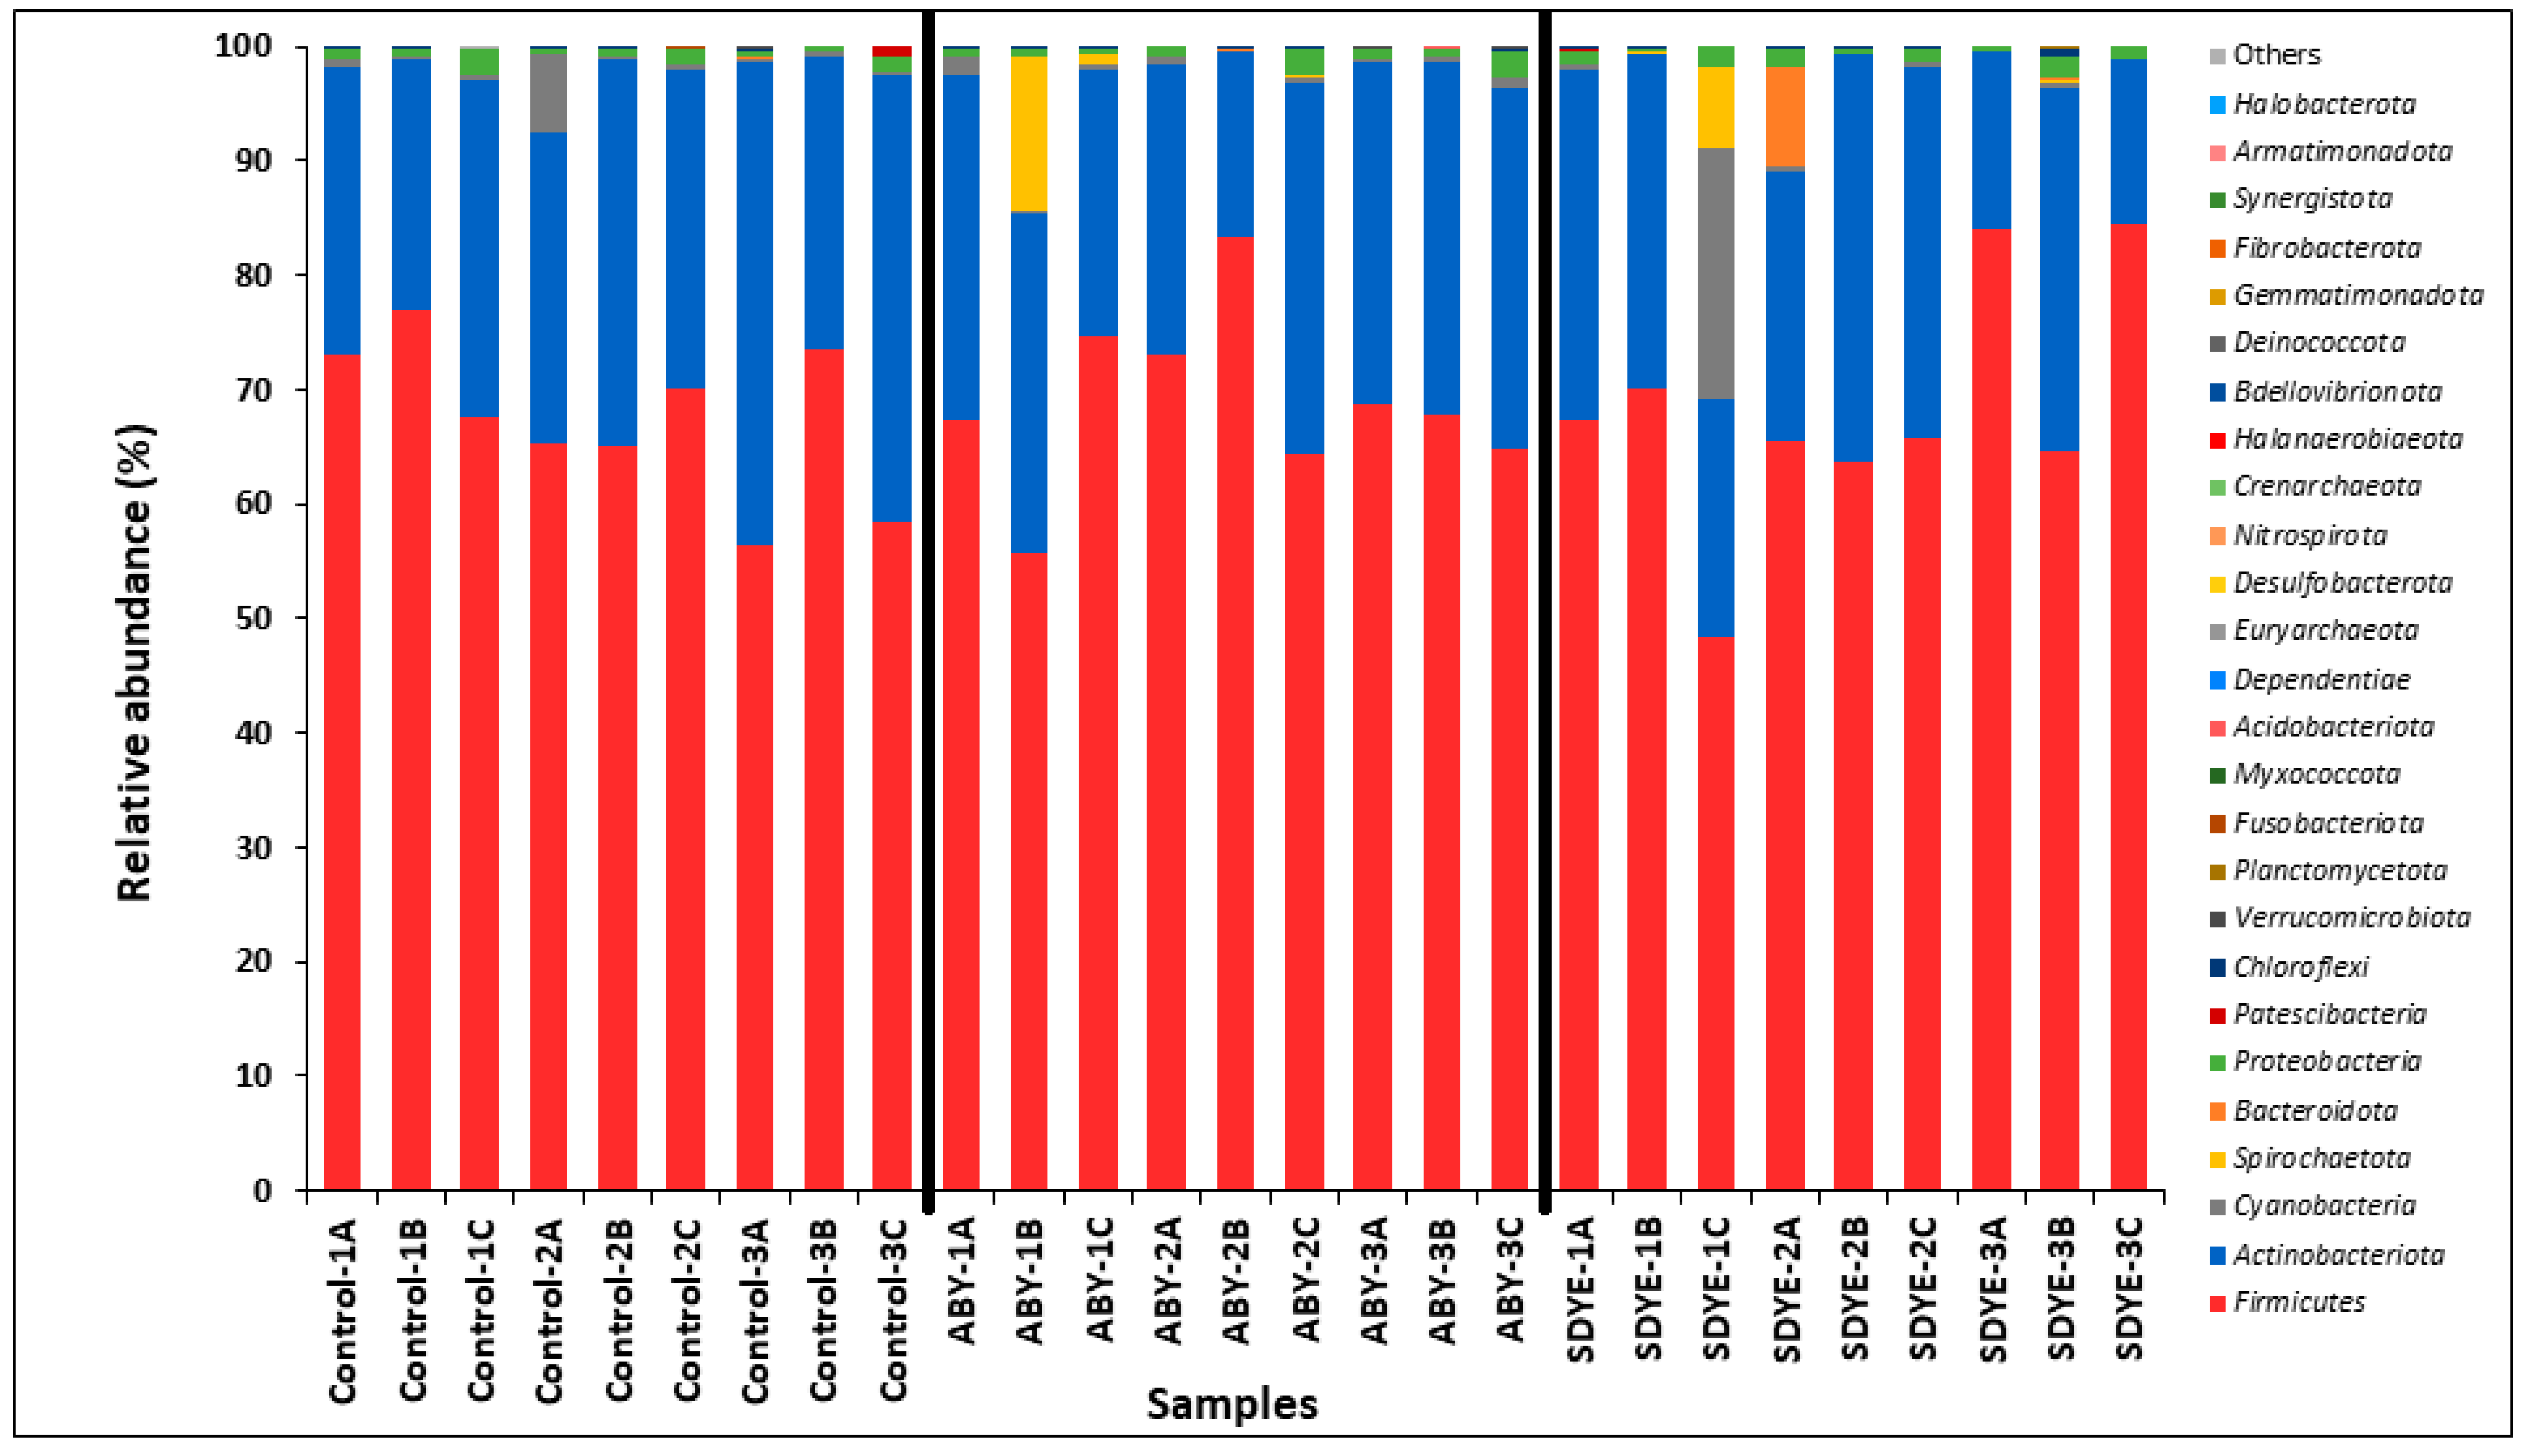
The digesta of the Atlantic salmon parr across all treatment groups contained 26 bacterial phyla, representing over 99.9% of the annotated sequences (Figure 8 and Figure 9). Firmicutes was the dominant and most prevalent phylum across all three treatment groups, comprising approximately 68% of ASVs in each group. Actinobacteriota followed as the second most abundant phylum, accounting for 26% of ASVs in the SDYE group, 28% in ABY, and 30% in the control group. The remaining 24 phyla collectively contributed 2–6% of the annotated sequences across all groups, with notable phyla including Cyanobacteria, Proteobacteria, Spirochaetota, Bacteroidota, Patescibacteria, Chloroflexi, Verrucomicrobiota, Planctomycetota, Fusobacteriota, and Myxococcota.
At the genus level, 597 bacterial taxa were classified from 2,286,589 sequences. Staphylococcus and Streptococcus were the most prevalent bacteria in the digesta of the Atlantic salmon across all treatments (Figure 10 and Figure 11). Other dominant bacterial genera identified include Saccharopolyspora, Bacillus, Bifidobacterium, Weissella, Ligilactobacillus, Lactobacillus, Limosilactobacillus, Corynebacterium, Microbacterium, Streptomyces, Enterococcus, and Geobacillus. Significant differences (p < 0.05) were observed in the relative abundance of certain genera between the control and other treatment groups (Figure 12). Notably, Staphylococcus abundance was significantly higher (p < 0.05) in fish fed ABY and SDYE diets compared with the control diet. In contrast, Streptococcus, Weissella, Macrococcus, and Aerococcus were significantly more abundant (p < 0.05) in the control-fed fish compared with the ABY and SDYE groups.

3.5. Growth Performance

The growth performance of the Atlantic salmon fed the experimental diets for 9 weeks is presented in Table 9. Atlantic salmon parr exhibited 100% survival across all treatment groups. Growth parameters such as final body weight, mean weight gain, specific growth rate, and feed conversion ratio showed no significant differences (p > 0.05) between treatments. The Fulton’s condition factor for all treatment groups was also not significantly different (p > 0.05).

4. Discussion

This study evaluated the effects of autolysed brewer’s yeast (ABY) and soluble dried yeast extract (SDYE) dietary supplementation at 2.5 g/kg on the intestinal and skin histology, haematology, immunoregulatory gene expression, microbiota composition, and growth performance of Atlantic salmon parr. The findings demonstrate that fish receiving yeast-supplemented diets, especially the ABY diet, exhibited enhanced mucosal health, modulated immune gene expression, and distinct gut microbiome profiles, while growth performance remained consistent across treatments. These results support the potential of yeast-based additives in aquaculture, particularly in enhancing fish health without negatively impacting growth.
Histological analysis revealed that Atlantic salmon fed the ABY diet exhibited increased mucosal fold length, narrower lamina propria, higher microvilli density, longer microvilli length, and enhanced goblet cell counts in the intestine and skin compared with the control group. These histological changes indicate that the ABY additive positively impacts intestinal morphology, promoting gut health. Longer mucosal folds and increased goblet cell numbers are associated with enhanced nutrient absorption and mucosal immunity, essential for maintaining intestinal health and resisting pathogens [31,32]. Similar to the findings of this study, Leclercq et al. [14] reported enhanced skin mucus and goblet cell density along with an increased intestinal goblet cell density and villi length in Atlantic salmon fed a diet supplemented with commercial yeast MOS at 4 g/kg for 65 days. Adeoye et al. [33] also reported increased intestinal goblet cell counts in African catfish (Clarias gariepinus) fed diets supplemented with ABY at 3 to 10 g/kg levels. The histological improvements in the ABY group may be attributed to bioactive components within the autolysed brewer’s yeast, such as β-glucans and MOS, which have been shown to promote mucosal immunity and gut health [34,35]. These components, found in yeast cell walls, stimulate immune responses, and promote intestinal integrity by enhancing cellular structure [32]. In contrast, the SDYE lacks these cell wall components, potentially explaining its relatively modest impact on histology compared with the ABY additive. However, SDYE still conferred improved mucosal morphology compared with controls, indicating that yeast extracts (nucleotides, peptides) also contribute to gut health [36].
Haematological parameters, including haemoglobin concentration, RBC, and WBC, are essential indicators for assessing fish health, physiological responses, and adaptation to environmental or dietary changes [37,38]. Our results showed that the blood profiles of the Atlantic salmon after 9 weeks of experimental feeding were stable, with no significant changes observed in the parameters across treatment groups. This suggests that ABY and SDYE dietary supplementation at 2.5 g/kg level did not compromise the Atlantic salmon health. This outcome is consistent with other studies that reported no significant haematological changes in fish fed diets supplemented with yeast additives. For example, Kühlwein et al. [38] reported that supplementation of β-glucan at 1 g/kg, 10 g/kg, and 20 g/kg in the diet of mirror carp (Cyprinus carpio) did not have any detrimental effect on the haematological parameters. Similarly, Neuls et al. [39] reported safe inclusion of Yarrowia lipolytica yeast in the diet of Nile tilapia (Oreochromis niloticus) as no significant changes were observed in the blood parameters when compared with the control.
The gene expression analysis in this study showed the potential of the yeast additives, especially ABY, in modulating some immunoregulatory genes in the PI of the Atlantic salmon parr. The il-1β and muc-2 genes were significantly upregulated in Atlantic salmon fed the ABY diet, indicating enhanced inflammatory and mucosal responses. The proinflammatory cytokine il-1β, crucial for early immune responses, plays a key role in initiating the immune cascade and improving pathogen resistance [40]. The muc-2 gene is a key mucin protein responsible for forming protective mucus barriers that protects the intestinal lining [41]. The increased expression of il-1β and muc-2 in the ABY group aligns with previous findings suggesting that yeast additives enhance mucosal protection and activate immune responses without inducing systemic inflammation. A significant upregulation of il-1β in the mid-intestine was previously reported in Nile tilapia fed a diet containing ABY at a dose of 1 g/kg for 5 weeks [7]. Similarly, Andriamialinirina et al. [42] reported that il-1β and other cytokines were significantly elevated in the intestine of Nile tilapia fed a diet supplemented with brewer’s yeast hydrolysate at a level of 1 g/kg for 8 weeks. Furthermore, Huang et al. [43] reported that concentrated MOS supplemented at 4 g/kg in the diet of goldfish (Carassius auratus) for 60 days modulated intestinal gene expression by increasing il-1β and muc-2 expression.
The significant upregulation of the muc-2 gene in the PI of Atlantic salmon fed ABY-supplemented diets in this study is consistent with the significantly increased number of goblet cells observed in the same group of fish. Goblet cells secrete mucins such as muc-2, which are glycoproteins with gelling properties that provides the viscous and adhesive properties of mucus, supporting gut integrity and protecting against pathogens [44].
The gut microbiota is vital to animal health, including in fish, as it supports nutrient absorption, immune function, and overall well-being [45]. The alpha diversity analyses revealed no significant differences between treatments, suggesting a similarly diverse microbial community across groups. However, UPGMA cluster analysis and community structure tests (ANOSIM and ADONIS) highlighted distinct compositional shifts in the microbiome between control and yeast-supplemented diets, underscoring the capacity of yeast additives to modulate gut microbiota. Similar findings in gilthead seabream and hybrid striped bass support the notion that dietary yeast additives can influence microbial composition [46,47].
The gut microbiome analysis indicated that Firmicutes and Actinobacteriota were predominant across treatments, which aligns with previous research in Atlantic salmon and other fish species [48,49]. Meziti et al. [49] identified Firmicutes and Actinobacteriota as dominant phyla in the gut and faecal samples of European seabass (Dicentrarchus labrax) fed yeast-supplemented diets. Agboola et al. [48] also reported these two phyla to be among the top three most abundant phyla in the digesta of Atlantic salmon fed Cyberlindnera jadinii and Wickerhamomyces anomalus yeast additives. These bacterial phyla include members such as Lactobacillus, Bacillus, Enterococcus, and Streptomyces, which are essential for supporting intestinal health and enhancing immune function in fish [50].
The gut microbiome result revealed some overlap in the microbial communities, but yeast supplementation notably influenced the relative abundance of specific bacterial taxa in the fish digesta. Specifically, the relative abundance of Staphylococcus increased in the digesta of fish fed yeast-supplemented diets, while Streptococcus and Weissella were more abundant in the control group. Staphylococcus comprises Gram-positive anaerobic bacteria with a chemoorganotrophic metabolism, utilizing carbohydrates and amino acids as carbon and energy sources through respiratory and fermentative pathways [51]. This genus, though infrequently encountered and studied in fish microbiomes [52], has been associated with dietary influences and observed in the gut microbiota of fish fed soy proteins and vegetable oil-based diets [49,53]. This could explain the dominance of this genus in this study as the diets were formulated with relatively high amounts of soybean meal and vegetable oil. Human studies indicate that live yeast can aid adhesion of staphylococci to host cells and tissues, partially through biofilm formation [54], but it is not clear in our study if the yeast additives influenced the adhesive capacity of the Staphylococcus. Similar microbiome shifts with Staphylococcus enrichment were reported in a study on European seabass, where it was found to be the most abundant genus in the intestine of European seabass fed diets formulated with soy proteins and yeast additives [49]. Pérez-Pascual et al. [55] also reported increased Staphylococcus abundance in the gut of European seabass fed diets supplemented with yeast additives. In addition, Burr et al. [46] reported a similar increase in Staphylococcus in the intestine of hybrid striped bass (Morone chrysops × Morone saxatilis) fed diets supplemented with different yeast additives such as MOS and partially autolysed brewer’s yeast.
Conversely, the reduction of Streptococcus and Weissella in the ABY and SDYE groups may be attributed to the prebiotic and immune-modulating effects of yeast. Yeast additives may modulate gut microbial composition by supporting beneficial bacterial growth and reducing potentially harmful taxa. Such shifts align with research showing yeast additives can promote microbial diversity and balance [49,53]. This decrease could indicate a decline in potentially opportunistic bacteria, as some Streptococcus species are known to be pathogenic in fish, causing streptococcosis [56]. Although most Weissella spp. have been reported to be beneficial and have probiotic effect on fish [57], some strains such as Weissella ceti have been recognised to act opportunistically and cause infections [58,59]. Prior studies have also reported a similar decrease in the abundance of Streptococcus and Weissella in the fish gut. For example, Meziti et al. [49] reported significant reduction in the abundance of Streptococcus in the gut of European sea bass fed yeast-supplemented diets.

5. Conclusions

Overall, the study demonstrates that dietary supplementation with autolysed brewer’s yeast and soluble dried yeast extract can positively impact intestinal morphology, mucosal immunity, and microbial composition in Atlantic salmon parr. The differential responses between ABY and SDYE treatments point to a potential advantage of yeast wall components in enhancing gut health, which could be valuable under diverse rearing or nutritional conditions. These findings significantly advance our understanding of how yeast additives can improve mucosal health in Atlantic salmon. However, further research is required to clarify the underlying mechanisms of these effects and to optimise the inclusion levels of ABY and SDYE in Atlantic salmon diets, ensuring growth and other benefits across different rearing conditions. It is also recommended that further research should include a gradient design with a varying inclusion level of the yeast additives to determine their optimal inclusion level for Atlantic salmon.

Author Contributions

Conceptualization, S.G.O.-O., H.K. and D.L.M., methodology, S.G.O.-O., B.E., T.A.M., S.T.A., N.E.W., F.D.A., M.E., G.M.H. and D.L.M.; investigation, S.G.O.-O.; formal analysis, S.G.O.-O.; resources, H.K.; visualization, S.G.O.-O.; writing—original draft preparation, S.G.O.-O.; writing—review and editing, T.A.M., S.T.A., V.K., H.K. and D.L.M.; supervision, D.L.M. All authors have read and agreed to the published version of the manuscript.

Funding

This research was funded by the Tertiary Education Trust Fund (TETFund), Lagos State University of Science and Technology, and Leiber GmbH.

Institutional Review Board Statement

This study was conducted according to the guidelines and approval from the University of Plymouth (code ETHICS-45-2020), with ethics committee approval granted on 9 May 2022.

Informed Consent Statement

Not applicable.

Data Availability Statement

The 16S rRNA sequencing data generated in this study have been deposited and are openly available in the NCBI Sequence Read Archive (SRA) under the accession number PRJNA1198497 and are accessible via the following link: https://www.ncbi.nlm.nih.gov/sra/PRJNA1198497 (accessed on 25 December 2024). All other data are available upon request from corresponding authors.

Acknowledgments

The authors would like to thank Joceline Triner, Victoria Cammack, and Natalie Sweet for their technical support. We also thank TETFund Nigeria and Lagos State University of Science and Technology for funding Sheu Odu-Onikosi’s research, as well as Leiber GmbH for their support in providing funding and supplying the yeast additives used in this study.

Conflicts of Interest

Leiber GmbH supplied the feed additives used and made a small contribution towards funding. H.K. was employed by Leiber GmbH. H.K. had the following involvement with the study: study design and writing of this article. The remaining authors declare no commercial or financial relationships that could be interpreted as potential conflicts of interest in the conduct of this research.

References

  1. FAO. The State of World Fisheries and Aquaculture 2024—Blue Transformation in Action; FAO: Rome, Italy, 2024. [Google Scholar]
  2. Sprague, M.; Dick, J.R.; Tocher, D.R. Impact of sustainable feeds on omega-3 long-chain fatty acid levels in farmed Atlantic salmon, 2006–2015. Sci. Rep. 2016, 6, 21892. [Google Scholar] [CrossRef] [PubMed]
  3. Encarnação, P. 5—Functional feed additives in aquaculture feeds. In Aquafeed Formulation; Nates, S.F., Ed.; Academic Press: San Diego, CA, USA, 2016; pp. 217–237. [Google Scholar]
  4. Merrifield, D.L.; Ringø, E. Aquaculture Nutrition: Gut Health, Probiotics and Prebiotics; Wiley: Hoboken, NJ, USA, 2014. [Google Scholar]
  5. Machuca, C.; Méndez-Martínez, Y.; Reyes-Becerril, M.; Angulo, C. Yeast β-Glucans as Fish Immunomodulators: A Review. Animals 2022, 12, 2154. [Google Scholar] [CrossRef] [PubMed]
  6. Rawling, M.; Schiavone, M.; Apper, E.; Merrifield, D.L.; Castex, M.; Leclercq, E.; Foey, A. Yeast cell wall extracts from Saccharomyces cerevisiae varying in structure and composition differentially shape the innate immunity and mucosal tissue responses of the intestine of zebrafish (Danio rerio). Front. Immunol. 2023, 14, 1158390. [Google Scholar] [CrossRef] [PubMed]
  7. Odu-Onikosi, S.G.; Momoh, T.A.; Eynon, B.; Pontefract, N.; Kuri, V.; Kühlwein, H.; Merrifield, D.L. Autolyzed brewer’s yeast enhances growth and intestinal health in early life stages of Nile tilapia (Oreochromis niloticus L.). J. World Aquac. Soc. 2025, 56, e13120. [Google Scholar] [CrossRef]
  8. Gomez, D.; Oriol Sunyer, J.O.; Salinas, I. The mucosal immune system of fish: The evolution of tolerating commensals while fighting pathogens. Fish Shellfish Immunol. 2013, 35, 1729–1739. [Google Scholar] [CrossRef]
  9. Lazado, C.C.; Caipang, C.M.A. Mucosal immunity and probiotics in fish. Fish Shellfish Immunol. 2014, 39, 78–89. [Google Scholar] [CrossRef]
  10. Porter, D.; Peggs, D.; McGurk, C.; Martin, S.A.M. In-vivo analysis of Protec™ and β-glucan supplementation on innate immune performance and intestinal health of rainbow trout. Fish Shellfish Immunol. 2023, 134, 108573. [Google Scholar] [CrossRef]
  11. Firmino, J.P.; Galindo-Villegas, J.; Reyes-López, F.E.; Gisbert, E. Phytogenic Bioactive Compounds Shape Fish Mucosal Immunity. Front. Immunol. 2021, 12, 695973. [Google Scholar] [CrossRef]
  12. Refstie, S.; Baeverfjord, G.; Seim, R.R.; Elvebo, O. Effects of dietary yeast cell wall β-glucans and MOS on performance, gut health, and salmon lice resistance in Atlantic salmon (Salmo salar) fed sunflower and soybean meal. Aquaculture 2010, 305, 109–116. [Google Scholar] [CrossRef]
  13. Dimitroglou, A.; Reynolds, P.; Ravnoy, B.; Johnsen, F.; Sweetman, J.W.; Johansen, J.; Davies, S.J. The Effect of Mannan Oligosaccharide Supplementation on Atlantic Salmon Smolts (Salmo salar L.) Fed Diets with High Levels of Plant Proteins. J. Aquac. Res. Dev. 2011, 1 (Suppl. S11), 6. [Google Scholar]
  14. Leclercq, E.; Pontefract, N.; Rawling, M.; Valdenegro, V.; Aasum, E.; Andujar, L.V.; Migaud, H.; Castex, M.; Merrifield, D. Dietary supplementation with a specific mannan-rich yeast parietal fraction enhances the gut and skin mucosal barriers of Atlantic salmon (Salmo salar) and reduces its susceptibility to sea lice (Lepeophtheirus salmonis). Aquaculture 2020, 529, 735701. [Google Scholar] [CrossRef]
  15. Morales-Lange, B.; Hansen, J.O.; Djordjevic, B.; Mydland, L.T.; Castex, M.; Mercado, L.; Imarai, M.; Sorum, H.; Overland, M. Immunomodulatory effects of hydrolyzed Debaryomyces hansenii in Atlantic salmon (Salmo salar L): From the in vitro model to a natural pathogen challenge after seawater transfer. Aquaculture 2024, 578, 740035. [Google Scholar] [CrossRef]
  16. Baumgärtner, S.; James, J.; Ellison, A. The supplementation of a prebiotic improves the microbial community in the gut and the skin of Atlantic salmon (Salmo salar). Aquac. Rep. 2022, 25, 101204. [Google Scholar] [CrossRef]
  17. NRC. Nutrient Requirements of Fish and Shrimp; The National Academies Press: Washington, WA, USA, 2011; p. 392. [Google Scholar]
  18. AOAC. Official Methods of Analysis of AOAC International; Latimer, G.W., Jr., Ed.; Oxford University Press: Oxford, UK, 2023. [Google Scholar]
  19. Satpathy, B.B.; Ray, A.K. Effect of dietary protein and carbohydrate levels on growth, nutrient utilization and body composition in fingerling rohu, Labeo rohita (Hamilton). J. Appl. Ichthyol. 2009, 25, 728–733. [Google Scholar] [CrossRef]
  20. Merrifield, D.L.; Dimitroglou, A.; Bradley, G.; Baker, R.T.M.; Davies, S.J. Soybean meal alters autochthonous microbial populations, microvilli morphology and compromises intestinal enterocyte integrity of rainbow trout, Oncorhynchus mykiss (Walbaum). J. Fish Dis. 2009, 32, 755–766. [Google Scholar] [CrossRef] [PubMed]
  21. Rawling, M.D.; Pontefract, N.; Rodiles, A.; Anagnostara, I.; Leclercq, E.; Schiavone, M.; Castex, M.; Merrifield, D.L. The effect of feeding a novel multistrain yeast fraction on European seabass (Dicentrachus labrax) intestinal health and growth performance. J. World Aquac. Soc. 2019, 50, 1108–1122. [Google Scholar] [CrossRef]
  22. Vandesompele, J.; De Preter, K.; Pattyn, F.; Poppe, B.; Van Roy, N.; De Paepe, A.; Speleman, F. Accurate normalization of real-time quantitative RT-PCR data by geometric averaging of multiple internal control genes. Genome Biol. 2002, 3, 10034. [Google Scholar] [CrossRef] [PubMed]
  23. Pontefract, N.M. Effects of Dietary Additives on Growth Performance, Immunity and Mucosal Barrier Defences of Salmonids. Ph.D. Thesis, University of Plymouth, Plymouth, UK, 2021. [Google Scholar]
  24. Rasmussen, R. Quantification on the LightCycler. In Rapid Cycle Real-Time PCR: Methods and Applications; Meuer, S., Wittwer, C., Nakagawara, K.-I., Eds.; Springer: Berlin/Heidelberg, Germany, 2001; pp. 21–34. [Google Scholar]
  25. Magoč, T.; Salzberg, S.L. FLASH: Fast length adjustment of short reads to improve genome assemblies. Bioinformatics 2011, 27, 2957–2963. [Google Scholar] [CrossRef] [PubMed]
  26. Chen, S.F.; Zhou, Y.Q.; Chen, Y.R.; Gu, J. Fastp: An ultra-fast all-in-one FASTQ preprocessor. Bioinformatics 2018, 34, 884–890. [Google Scholar] [CrossRef] [PubMed]
  27. Edgar, R.C.; Haas, B.J.; Clemente, J.C.; Quince, C.; Knight, R. UCHIME improves sensitivity and speed of chimera detection. Bioinformatics 2011, 27, 2194–2200. [Google Scholar] [CrossRef] [PubMed]
  28. Li, M.J.; Shao, D.T.; Zhou, J.C.; Gu, J.H.; Qin, J.J.; Chen, W.; Wei, W.Q. Signatures within esophageal microbiota with progression of esophageal squamous cell carcinoma. Chin. J. Cancer Res. 2020, 32, 755–767. [Google Scholar] [CrossRef] [PubMed]
  29. Callahan, B.J.; McMurdie, P.J.; Holmes, S.P. Exact sequence variants should replace operational taxonomic units in marker-gene data analysis. ISME J. 2017, 11, 2639–2643. [Google Scholar] [CrossRef]
  30. Röhmel, J. Precision intervals for estimates of the difference in success rates for binary random variables based on the permutation principle. Biom. J. 1996, 38, 977–993. [Google Scholar] [CrossRef]
  31. De Marco, G.; Cappello, T.; Maisano, M. Histomorphological Changes in Fish Gut in Response to Prebiotics and Probiotics Treatment to Improve Their Health Status: A Review. Animals 2023, 13, 2860. [Google Scholar] [CrossRef] [PubMed]
  32. Rawling, M.; Leclercq, E.; Foey, A.; Castex, M.; Merrifield, D. A novel dietary multi-strain yeast fraction modulates intestinal toll-like-receptor signalling and mucosal responses of rainbow trout (Oncorhynchus mykiss). PLoS ONE 2021, 16, e0245021. [Google Scholar] [CrossRef] [PubMed]
  33. Adeoye, A.A.; Obasa, S.O.; Fawole, F.J.; Wan, A.H.L.; Davies, S.J. Dietary supplementation of autolysed yeast enhances growth, liver functionality and intestinal morphology in African catfish. Aquac. Nutr. 2020, 26, 772–780. [Google Scholar] [CrossRef]
  34. Meena, D.K.; Das, P.; Kumar, S.; Mandal, S.C.; Prusty, A.K.; Singh, S.K.; Akhtar, M.S.; Behera, B.K.; Kumar, K.; Pal, A.K.; et al. Beta-glucan: An ideal immunostimulant in aquaculture (a review). Fish Physiol. Biochem. 2013, 39, 431–457. [Google Scholar] [CrossRef] [PubMed]
  35. Merrifield, D.L.; Carnevali, O. Probiotic Modulation of the Gut Microbiota of Fish. In Aquaculture Nutrition; Merrifield, D.L., Ringø, E., Eds.; Wiley: Hoboken, NJ, USA, 2014; pp. 185–222. [Google Scholar]
  36. Barducci, R.S.; de Abreu, V.; Santos, A.A.D.; Pacheco, L.G.; Koch, J.F.A.; Florencio, M.; Pilarski, F. Natural feed additive containing Saccharomyces cerevisiae-originated free nucleotides improves innate immunity, gut histology and disease resistance in Nile tilapia. Anim. Feed Sci. Technol. 2022, 289, 115337. [Google Scholar] [CrossRef]
  37. Fazio, F. Fish hematology analysis as an important tool of aquaculture: A review. Aquaculture 2019, 500, 237–242. [Google Scholar] [CrossRef]
  38. Kühlwein, H.; Merrifield, D.L.; Rawling, M.D.; Foey, A.D.; Davies, S.J. Effects of dietary β-(1,3)(1,6)-D-glucan supplementation on growth performance, intestinal morphology and haemato-immunological profile of mirror carp (Cyprinus carpio L.). J. Anim. Physiol. Anim. Nutr. 2014, 98, 279–289. [Google Scholar] [CrossRef]
  39. Neuls, L.; de Souza, V.J.; Romao, S.; Bitencourt, T.B.; Ramos, C.J.R.; Parra, J.E.G.; Cazarolli, L.H. Immunomodulatory effects of Yarrowia lipolytica as a food additive in the diet of Nile tilapia. Fish Shellfish Immunol. 2021, 119, 272–279. [Google Scholar] [CrossRef]
  40. Engelsma, M.Y.; Huising, M.O.; van Muiswinkel, W.B.; Flik, G.; Kwang, J.; Savelkoul, H.F.; Verburg-van Kemenade, B.M. Neuroendocrine-immune interactions in fish: A role for interleukin-1. Vet. Immunol. Immunopathol. 2002, 87, 467–479. [Google Scholar] [CrossRef] [PubMed]
  41. Stanforth, K.J.; Zakhour, M.I.; Chater, P.I.; Wilcox, M.D.; Adamson, B.; Robson, N.A.; Pearson, J.P. The MUC2 Gene Product: Polymerisation and Post-Secretory Organisation-Current Models. Polymers 2024, 16, 1663. [Google Scholar] [CrossRef]
  42. Andriamialinirina, H.J.T.; Irm, M.; Taj, S.; Lou, J.H.; Jin, M.; Zhou, Q.C. The effects of dietary yeast hydrolysate on growth, hematology, antioxidant enzyme activities and non-specific immunity of juvenile Nile tilapia, Oreochromis niloticus. Fish Shellfish Immunol. 2020, 101, 168–175. [Google Scholar] [CrossRef] [PubMed]
  43. Huang, X.L.; Liu, S.Y.; Zuo, F.Y.; Luo, L.; Chen, D.F.; Ou, Y.P.; Geng, Y.; Zhang, Y.F.; Lin, G.; Yang, S.Y.; et al. cMOS enhanced the mucosal immune function of skin and gill of goldfish (Carassius auratus Linnaeus) to improve the resistance to Ichthyophthirius multifiliis infection. Fish Shellfish Immunol. 2022, 126, 1–11. [Google Scholar] [CrossRef] [PubMed]
  44. Yang, S.; Yu, M. Role of Goblet Cells in Intestinal Barrier and Mucosal Immunity. J. Inflamm. Res. 2021, 14, 3171–3183. [Google Scholar] [CrossRef] [PubMed]
  45. Romero, J.; Ringø, E.; Merrifield, D.L. The Gut Microbiota of Fish. In Aquaculture Nutrition; Merrifield, D.L., Ringø, E., Eds.; Wiley: Hoboken, NJ, USA, 2014; pp. 75–100. [Google Scholar]
  46. Burr, G.; Hume, M.; Ricke, S.; Nisbet, D.; Gatlin, D., 3rd. In vitro and in vivo evaluation of the prebiotics GroBiotic-A, inulin, mannanoligosaccharide, and galactooligosaccharide on the digestive microbiota and performance of hybrid striped bass (Morone chrysops × Morone saxatilis). Microb. Ecol. 2010, 59, 187–198. [Google Scholar] [CrossRef] [PubMed]
  47. Dimitroglou, A.; Merrifield, D.L.; Spring, P.; Sweetman, J.; Moate, R.; Davies, S.J. Effects of mannan oligosaccharide (MOS) supplementation on growth performance, feed utilisation, intestinal histology and gut microbiota of gilthead sea bream (Sparus aurata). Aquaculture 2010, 300, 182–188. [Google Scholar] [CrossRef]
  48. Agboola, J.O.; Rocha, S.D.C.; Mensah, D.D.; Hansen, J.O.; Oyås, O.; Lapeña, D.; Mydland, L.T.; Arntzen, M.O.; Horn, S.J.; Overland, M. Effect of yeast species and processing on intestinal microbiota of Atlantic salmon (Salmo salar) fed soybean meal-based diets in seawater. Anim. Microbiome 2023, 5, 21. [Google Scholar] [CrossRef] [PubMed]
  49. Meziti, A.; Nikouli, E.; Papaharisis, L.; Kormas, K.; Mente, E. The response of gut and fecal bacterial communities of the European sea bass (Dicentrachus labrax) fed a low fish-plant meal and yeast protein supplementation diet. Sustain. Microbiol. 2024, 1, qvae005. [Google Scholar] [CrossRef]
  50. Spilsbury, F.; Foysal, M.J.; Tay, A.; Gagnon, M.M. Gut Microbiome as a Potential Biomarker in Fish: Dietary Exposure to Petroleum Hydrocarbons and Metals, Metabolic Functions and Cytokine Expression in Juvenile Lates calcarifer. Front. Microbiol. 2022, 13, 827371. [Google Scholar]
  51. Schleifer, K.-H.; Bell, J.A. Staphylococcus. In Bergey’s Manual of Systematics of Archaea and Bacteria; NIH: Bethesda, MD, USA, 2015; pp. 1–43. [Google Scholar]
  52. Egerton, S.; Culloty, S.; Whooley, J.; Stanton, C.; Ross, R.P. The Gut Microbiota of Marine Fish. Front. Microbiol. 2018, 9, 873. [Google Scholar] [CrossRef]
  53. Ringø, E.; Zhou, Z.; Vecino, J.L.G.; Wadsworth, S.; Romero, J.; Krogdahl, Å.; Olsen, R.E.; Dimitroglou, A.; Foey, A.; Davies, S.; et al. Effect of dietary components on the gut microbiota of aquatic animals. A never-ending story? Aquac. Nutr. 2016, 22, 219–282. [Google Scholar] [CrossRef]
  54. Carolus, H.; Van Dyck, K.; Van Dijck, P. Candida albicans and Staphylococcus Species: A Threatening Twosome. Front. Microbiol. 2019, 10, 2162. [Google Scholar] [CrossRef] [PubMed]
  55. Pérez-Pascual, D.; Estellé, J.; Dutto, G.; Rodde, C.; Bernardet, J.-F.; Marchand, Y.; Duchaud, E.; Przybyla, C.; Ghigo, J.-M. Growth Performance and Adaptability of European Sea Bass (Dicentrarchus labrax) Gut Microbiota to Alternative Diets Free of Fish Products. Microorganisms 2020, 8, 1346. [Google Scholar] [CrossRef] [PubMed]
  56. Mzula, A.; Wambura, P.N.; Mdegela, R.H.; Shirima, G.M. Present status of aquaculture and the challenge of bacterial diseases in freshwater farmed fish in Tanzania; A call for sustainable strategies. Aquac. Fish. 2021, 6, 247–253. [Google Scholar] [CrossRef]
  57. Pelusio, N.F.; Parma, L.; Volpe, E.; Ciulli, S.; Errani, F.; Natale, S.; De Cesare, A.; Indio, V.; Carcano, P.; Mordenti, O.; et al. Yeast-extracted nucleotides and nucleic acids as promising feed additives for European sea bass (Dicentrarchus labrax) juveniles. Front. Mar. Sci. 2023, 10, 1145660. [Google Scholar] [CrossRef]
  58. Ladner, J.T.; Welch, T.J.; Whitehouse, C.A.; Palacios, G.F. Genome Sequence of Weissella ceti NC36, an Emerging Pathogen of Farmed Rainbow Trout in the United States. Genome Announc. 2013, 1, 10–1128. [Google Scholar] [CrossRef]
  59. Abriouel, H.; Lerma, L.L.; Muñoz, M.C.C.; Montoro, B.P.; Kabisch, J.; Pichner, R.; Cho, G.S.; Neve, H.; Fusco, V.; Franz, C.M.A.P.; et al. The controversial nature of the Weissella genus: Technological and functional aspects versus whole genome analysis-based pathogenic potential for their application in food and health. Front. Microbiol. 2015, 6, 1197. [Google Scholar] [CrossRef]
Figure 1. Photomicrographs of the posterior intestine of Atlantic salmon parr fed control (A,B), ABY (C,D), and SDYE (E,F) diets. Images (A,C,E) depict cross-sections stained with H&E, and images (B,D,F) show cross-sections stained with Van Gieson (scale bars = 100 μm). LPW: lamina propria width, MFL: mucosal fold length, MT: muscularis thickness, and GC: goblet cells.
Animals 15 00323 g001
Figure 2. Photomicrographs of AB/PAS-stained skin tissues from Atlantic salmon parr fed control (A), ABY (B), and SDYE (C) diets, with goblet cell indicated (scale bars = 100 μm). GC: goblet cells.
Animals 15 00323 g002
Figure 3. Microvilli density of the Atlantic salmon parr posterior intestine after the 9-week experimental feeding. AU = arbitrary units. Different superscript letters for individual parameters among dietary groups indicate significant differences (p < 0.05).
Animals 15 00323 g003
Figure 4. Microvilli length of the Atlantic salmon parr posterior intestine after the 9-week experimental feeding. * p = 0.052 between ABY and control.
Animals 15 00323 g004
Figure 5. Relative gene expression profiles in the posterior intestine of Atlantic salmon parr after the 9-week feeding trial. Different superscript letters denote significant differences between treatments (p < 0.05). Data presented as mean ± standard error of the mean (SEM).
Animals 15 00323 g005
Figure 6. Shared and unique ASVs in the digesta samples of Atlantic salmon parr across treatment groups.
Animals 15 00323 g006
Figure 7. UPGMA cluster tree based on weighted UniFrac distance for classifying the most abundant phyla in the digesta samples of Atlantic salmon parr across the three treatment groups.
Animals 15 00323 g007
Figure 8. Relative abundance of the 26 bacterial phyla detected in the digesta of Atlantic salmon parr in each treatment group.
Animals 15 00323 g008
Figure 9. Relative abundance of the 26 bacterial phyla detected in the 27 individual digesta samples.
Animals 15 00323 g009
Figure 10. Relative abundance of the top 14 dominant genera observed in digesta of the Atlantic salmon parr across treatment groups.
Animals 15 00323 g010
Figure 11. Relative abundance of the top 14 dominant genera observed in the 27 individual digesta samples.
Animals 15 00323 g011
Figure 12. Statistical differences in bacteria genera with mean relative abundance ≥ 0.1% across the three treatment groups. Different superscript letters denote significant differences between treatments (p < 0.05). Data presented as mean ± standard deviation (SD).
Animals 15 00323 g012
Table 1. Nutritional composition of the test yeast additives (Leiber GmbH).
CeFi® ProSDYE
Crude protein50.0%65.0%
Crude fibre1.0%1.0%
Crude ash6.6%9.4%
Crude fat3.0%0.1%
Moisture5.0%5.0%
Table 2. Formulations and proximate compositions of the experimental diets.
Ingredients (g/kg)ControlABYSDYE
Soybean meal 48 1150.0150.0150.0
Sunflower meal 2159.4157.8157.8
Fishmeal 270.070.070.0
Corn gluten meal 2220.0220.0220.0
Wheat gluten meal 2138.2138.2138.2
Fish oil 290.090.090.0
Sunflower oil 3120.8120.8120.8
Lysine 420.020.020.0
DL methionine 43.23.23.2
Threonine 41.71.71.7
Histidine 43.13.13.1
Arginine 413.613.613.6
CMC binder 45.05.05.0
Vitamin and mineral premix 55.05.05.0
ABY 6-2.5-
SDYE 6--2.5
Proximate composition (% wet weight basis)
Protein49.45 ± 0.1648.73 ± 0.7649.34 ± 0.07
Lipid24.15 ± 0.0723.39 ± 0.6222.43 ± 1.32
Moisture3.78 ± 0.103.93 ± 0.083.85 ± 0.13
Ash4.46 ± 0.274.13 ± 0.154.28 ± 0.22
Nitrogen-free extract18.16 ± 0.2719.82 ± 0.4520.10 ± 1.34
Gross energy (kcal/g)5.82 ± 0.015.78 ± 0.035.73 ± 0.07
Proximate composition data presented as mean ± standard deviation (SD). ABY = autolysed brewer’s yeast; SDYE = soluble dried yeast extract. 1 Skretting, Stavanger, Norway. 2 Biomar, Aarhus, Denmark. 3 Tesco, Plymouth, UK. 4 Sigma-Aldrich, Poole, UK. 5 Premier nutrition vitamin/mineral premix (contains 121 g kg−1 of calcium, 5.2 g kg−1 of phosphorous, 15.6 g kg−1 of magnesium, 250 mg kg−1 of copper (as cupric sulphate), 7.0 g kg−1 of Vit E (as alpha-tocopherol acetate), 1.0 μg kg−1 of Vit A, 0.1 μg kg−1 of Vit D3, & 787 g kg−1 ash). 6 Leiber GmbH, Bramsche, Germany.
Table 3. Target and reference genes used for qPCR in the posterior intestine of Atlantic salmon, with their corresponding primer details.
GeneGene AnnotationNCBI Accession NumberPrimer Sequence (5′–3′)
gapdhGlyceraldehyde 3-phosphate dehydrogenaseXM_014141819.2Fwd—GCACCCATCGCCAAGGTTAT
Rev—AGTCTTCTGTGTGGCTGTGA
ef1αElongation factor 1 alphaNM_001141909Fwd—GGCTGATTGTGCTGTGCTTAT
Rev—CACGAGTCTGCCCGTTCTTT
il-1βInterleukin-1 betaAY617117Fwd—AGGAGGGAAGCAGGGTTCA
Rev—CATCAGGACCCAGCACTTGT
tnf-αTumor necrosis factor alpha NM_001123617.1Fwd—GCACCGAAGACAACAAGGTTTA
Rev—GCTGAACACTGCTCCCACATA
il-10Interleukin-1 betaEF165028.1Fwd—ACGAAGGCATTCTACACCACTT
Rev—CACCGTGTCGAGGTAGAACT
muc-2Mucin 2-likeXM_029770456.1Fwd—CGACTCAACGTGGATGTAGGA
Rev—GCGACCACTAGCCAGAAAGA
cldn-15Claudin 15XM_014206890.1Fwd—GTCGGGATGCAGTGTTCTAAAG
Rev—TGGGTGATGTTGAAAGCATACC
Table 4. The posterior intestine and skin histology of the Atlantic salmon parr using light microscope after the 9-week experimental feeding.
ParametersControlABYSDYE
Mucosal fold length (µm)203.74 ± 35.04 a307.41 ± 66.03 b375.98 ± 69.77 b
Muscularis thickness (µm)56.76 ± 13.7372.97 ± 15.7369.89 ± 13.11
Lamina propria width (µm)16.81 ± 6.13 a11.86 ± 2.11 b13.31 ± 3.02 ab
Intestine goblet cell counts (n/100 µm)7.01 ± 1.71 a9.44 ± 1.91 b9.24 ± 2.44 ab
Skin goblet cell counts (n/200 µm)14.56 ± 2.85 a18.22 ± 2.48 b14.44 ± 2.66 a
Different superscript letters for individual parameters among dietary groups indicate significant differences (p < 0.05). Data presented as mean ± standard deviation (SD).
Table 5. Haematological parameters in Atlantic salmon parr after the 9-week feeding trial.
ParametersControlABYSDYE
Haemoglobin (g/dL)0.03 ± 0.010.04 ± 0.010.03 ± 0.01
Red blood cell count (106/µL)0.89 ± 0.341.19 ± 0.261.13 ± 0.20
White blood cell count (103/µL)11.32 ± 4.3614.36 ± 3.6312.71 ± 5.68
Data presented as mean ± standard deviation (SD).
Table 6. Raw paired-end reads, non-chimera reads, ASVs, and sequences assigned to ASVs of microbiota composition in Atlantic salmon digesta samples after the 9-week feeding trial.
TreatmentsRaw Paired-End ReadsNon-Chimera ReadsNumber of ASVsSequences Assigned to ASVs
Control109,556 ± 6,279100,899 ± 6,5753,80094,946 ± 6,458
ABY104,255 ± 1,76894,188 ± 2,0593,75788,385 ± 2,015
SDYE103,025 ± 7,36494,952 ± 5,4623,39989,588 ± 5,106
Data for raw paired-end reads, non-chimera reads, and sequences assigned to ASVs are presented as mean ± standard deviation (SD).
Table 7. Goods coverage and diversity/richness indices of the microbiota composition in Atlantic salmon digesta samples after the 9-week feeding trial.
TreatmentsGood’s CoverageChao1 IndexShannon’s Diversity IndexSimpson’s Index of Diversity
Control1.00 ± 0.00880.79 ± 182.646.94 ± 0.380.96 ± 0.01
ABY1.00 ± 0.00902.04 ± 80.446.85 ± 0.600.96 ± 0.03
SDYE1.00 ± 0.00775.58 ± 193.296.53 ± 1.080.94 ± 0.08
Data presented as mean ± standard deviation (SD).
Table 8. ANOSIM and ADONIS analyses of bacterial communities in digesta samples of Atlantic salmon after 9 weeks on experimental diets.
GroupsANOSIMADONIS
R-Valuep-ValueF-Valuep-Value
Control–ABY0.4280.0014.3110.002
Control–SDYE0.1930.0023.1250.001
ABYE–SDYE0.1880.0042.4360.008
Table 9. Growth performance, feed utilisation, and survival of Atlantic salmon parr fed experimental diets for 9 weeks.
ParametersControlABYSDYE
Initial body weight (g)37.10 ± 0.0037.10 ± 0.1737.03 ± 0.06
Final body weight (g)66.64 ± 2.5263.18 ± 1.5867.69 ± 0.61
Mean weight gain (g)29.54 ± 4.3726.08 ± 2.5830.65 ± 1.11
Feed intake (g)27.42 ± 0.5826.25 ± 0.9027.45 ± 0.48
Specific growth rate (%/day)0.93 ± 0.110.85 ± 0.060.96 ± 0.02
Feed conversion ratio0.94 ± 0.121.01 ± 0.070.90 ± 0.02
Survival (%)100.00 ± 0.00100.00 ± 0.00100.00 ± 0.00
Fulton’s condition factor (K)1.20 ± 0.081.20 ± 0.061.17 ± 0.03
Data presented as mean ± standard deviation (SD).
Disclaimer/Publisher’s Note: The statements, opinions and data contained in all publications are solely those of the individual author(s) and contributor(s) and not of MDPI and/or the editor(s). MDPI and/or the editor(s) disclaim responsibility for any injury to people or property resulting from any ideas, methods, instructions or products referred to in the content.