
FASN, SCD, and PLAG1 Gene Polymorphism and Association with Carcass Traits and Fatty Acid Profile in Hanwoo Cattle
 , , , ,
Simple Summary
Abstract
1. Introduction
2. Materials and Methods
2.1. Animals, Phenotypic Data, and Sample Collection
2.2. Genomic DNA Extraction and Polymerase Chain Reaction-Restriction Fragment Length Polymorphism (PCR-RFLP)
2.3. Total RNA Extraction and RT-qPCR
2.4. Fatty Acid Analysis
2.5. Statistical Analysis
3. Results
3.1. Genotype Frequencies and Allele Frequencies with Carcass Traits in the Hanwoo Steer
3.1.1. Analysis of Genotype and Allele Frequencies in Hanwoo Steers
3.1.2. Correlation Between Genotypes/Alleles and Beef Quality Grades
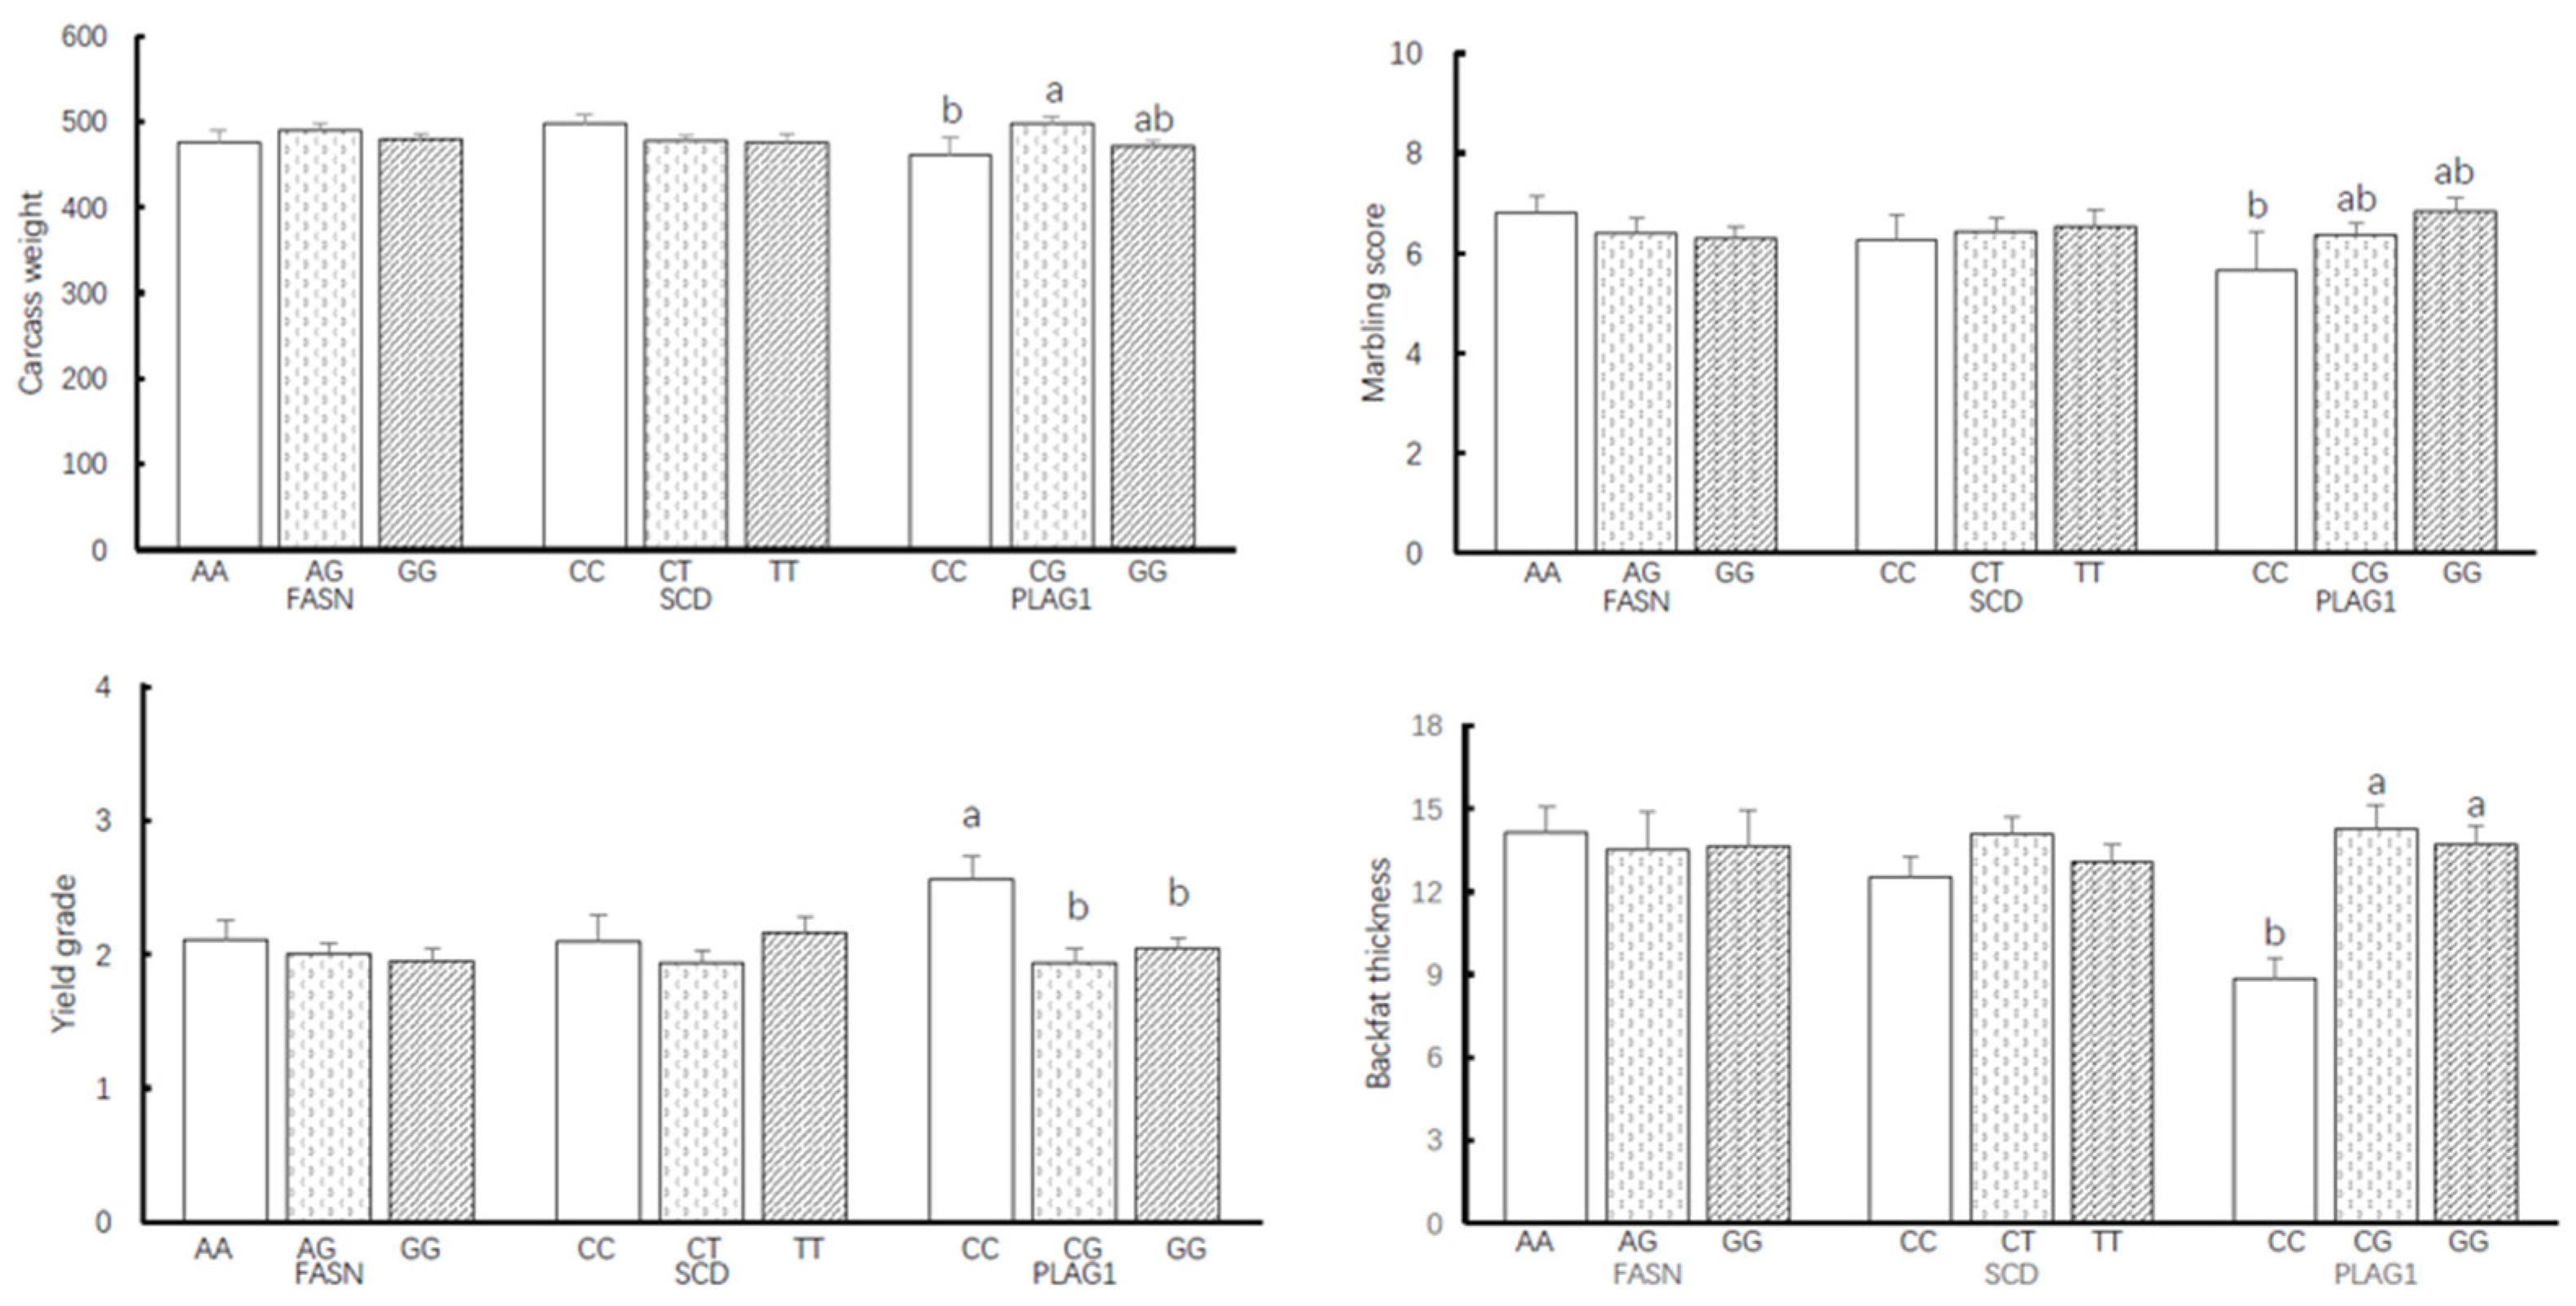
3.1.3. Differential Impact of FASN, SCD, and PLAG1 Genotypes on Carcass Traits
3.2. Fatty Acid Composition of Different Genotypes in Hanwoo Steers
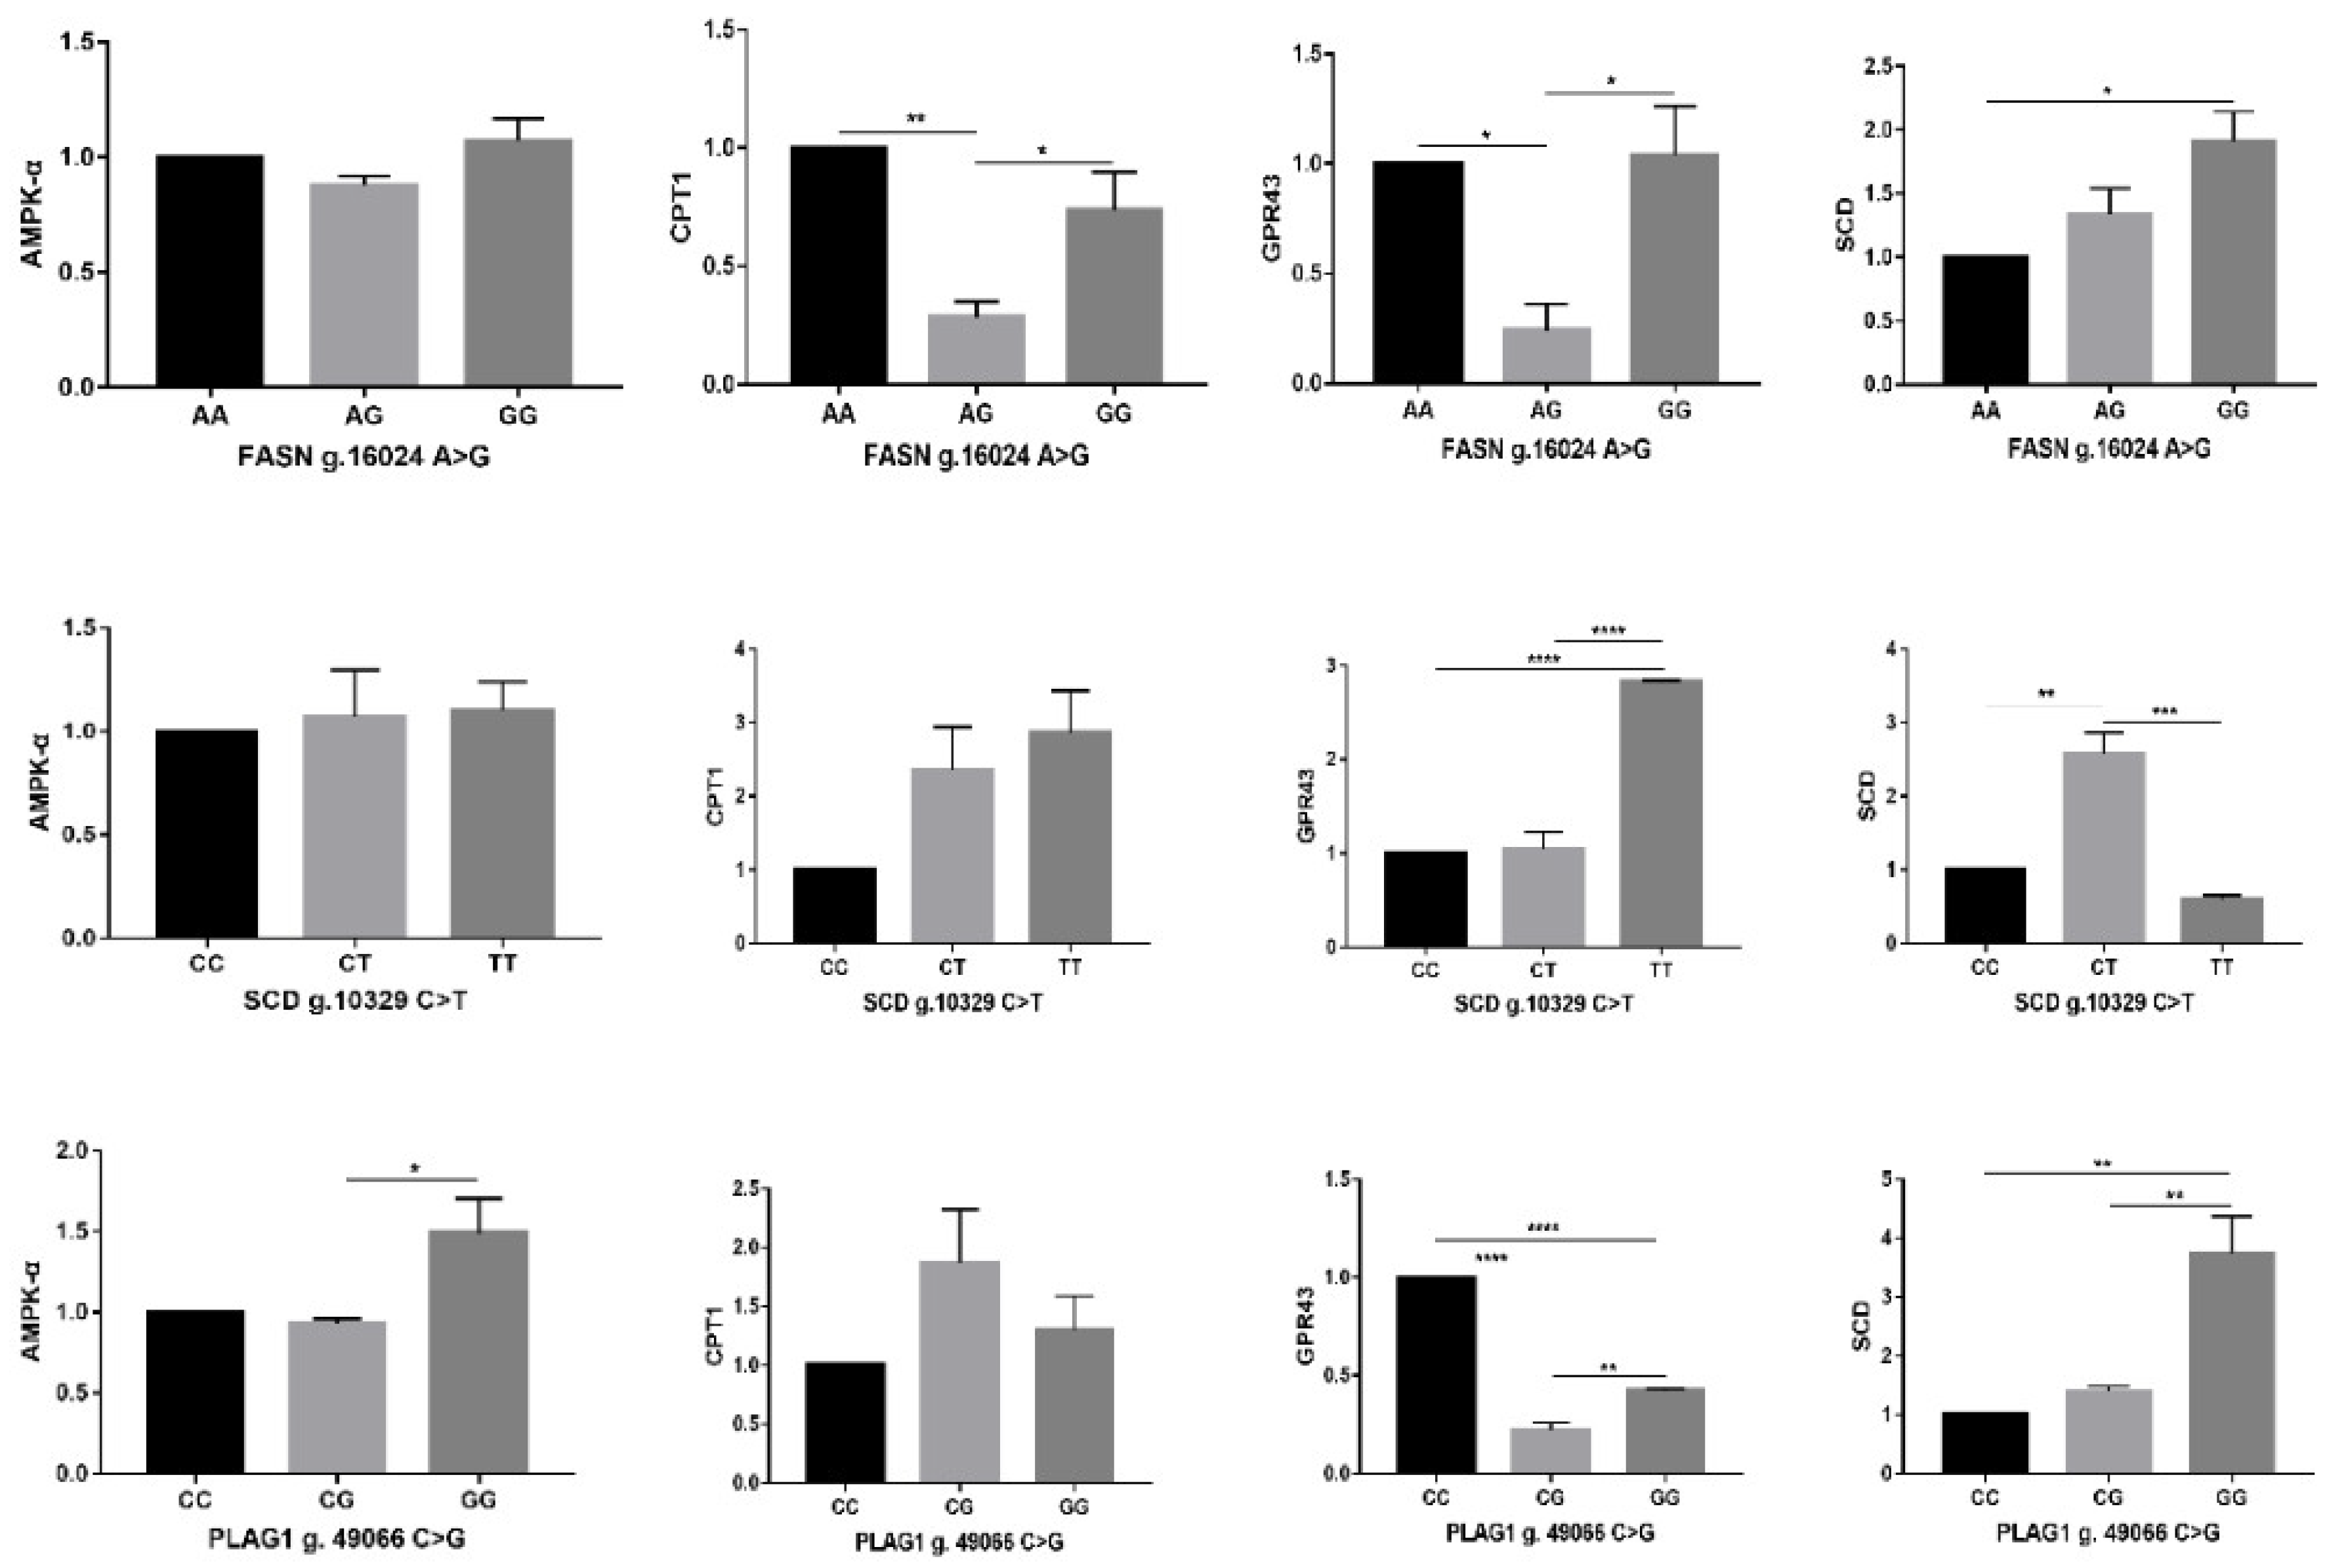
3.3. Relative Gene Expression of Different Genotypes in Hanwoo Steer
4. Discussion
4.1. Genotype Frequencies and Allele Frequencies with Carcass Traits
4.2. Fatty Acid Composition of Different Genotypes
4.3. Relative Expression of Adipogenic Genes of Different Genotypes in Hanwoo Steer
5. Conclusions
Author Contributions
Funding
Institutional Review Board Statement
Informed Consent Statement
Data Availability Statement
Conflicts of Interest
Abbreviations
| SNP | Single Nucleotide Polymorphism |
| QTL | Quantitative Trait Locus |
| FASN | Fatty Acid Synthase |
| SCD | Stearoyl-CoA Desaturase |
| PLAG1 | Pleomorphic Adenoma gene 1 |
| RPS9 | Ribosomal protein S9 |
| AMPK-α | AMP-activated protein kinase-α |
| CPT1β | Carnitine Palmitoyl Transferase-1β |
| GPR43 | G-coupled protein receptor-43 |
| PCR-RFLP | Polymerase chain reaction–restriction fragment length polymorphism |
| PCR | Polymerase Chain Reaction |
| BF3 | Boron trifluoride |
| KOH | Potassium hydroxide |
| FID | Fréchet inception distance |
| GLM | General Linear Model |
| HWE | Hardy–Weinberg Equilibrium |
| DMRT | Duncan’s Multiple Range test |
| SEM | Standard Error Mean |
| RT-qPCR | Real-time polymerase chain reaction |
| SFA | Saturated fatty acid |
| MUFA | Monounsaturated fatty acid |
References
- Choi, Y.; Davis, M.E.; Chung, H. Effects of Genetic Variants in the Promoter Region of the Bovine Adiponectin (ADIPOQ) Gene on Marbling of Hanwoo Beef Cattle. Meat Sci. 2015, 105, 57–62. [Google Scholar] [CrossRef] [PubMed]
- Henchion, M.M.; McCarthy, M.; Resconi, V.C. Beef Quality Attributes: A Systematic Review of Consumer Perspectives. Meat Sci. 2017, 128, 1–7. [Google Scholar] [CrossRef]
- Doyle, J.L.; Berry, D.P.; Veerkamp, R.F.; Carthy, T.R.; Evans, R.D.; Walsh, S.W.; Purfield, D.C. Genomic regions associated with muscularity in beef cattle differ in five contrasting cattle breeds. Genet. Sel. Evol. 2020, 52, 2. [Google Scholar] [CrossRef]
- Romero, J.V.; Olleta, J.L.; Resconi, V.C.; Santolaria, P.; del Mar Campo, M. Genetic Markers Associated with Beef Quality: A Review. Livest. Sci. 2024, 289, 105583. [Google Scholar] [CrossRef]
- Kawaguchi, F.; Tsuchimura, M.; Oyama, K.; Matsuhashi, T.; Maruyama, S.; Mannen, H.; Sasazaki, S. Effect of DNA markers on the fertility traits of Japanese Black cattle for improving beef quantity and quality. Arch. Anim. Breed. 2020, 63, 9–17. [Google Scholar] [CrossRef]
- Mwangi, F.W.; Charmley, E.; Gardiner, C.P.; Malau-Aduli, B.S.; Kinobe, R.T.; Malau-Aduli, A.E. Diet and genetics influence beef cattle performance and meat quality characteristics. Foods 2019, 8, 648. [Google Scholar] [CrossRef] [PubMed]
- Bhuiyan, M.S.; Kim, Y.K.; Kim, H.J.; Lee, D.H.; Lee, S.H.; Yoon, H.B.; Lee, S.H. Genome-Wide Association Study and Prediction of Genomic Breeding Values for Fatty-Acid Composition in Korean Hanwoo Cattle Using a High-Density Single-Nucleotide Polymorphism Array. J. Anim. Sci. 2018, 96, 4063–4075. [Google Scholar] [CrossRef]
- Smith, J.L.; Wilson, M.L.; Nilson, S.M.; Rowan, T.N.; Oldeschulte, D.L.; Schnabel, R.D.; Decker, J.E.; Seabury, C.M. Genome-wide association and genotype by environment interactions for growth traits in US Gelbvieh cattle. BMC Genom. 2019, 20, 926. [Google Scholar] [CrossRef]
- Terry, S.A.; Basarab, J.A.; Guan, L.L.; McAllister, T.A. Strategies to improve the efficiency of beef cattle production. Can. J. Anim. Sci. 2020, 101, 1–19. [Google Scholar] [CrossRef]
- Mwangi, F.W.; Pewan, S.B.; Otto, J.R.; Adegboye, O.A.; Charmley, E.; Gardiner, C.P.; Malau-Aduli, B.S.; Kinobe, R.T.; Malau-Aduli, A.E. Single nucleotide polymorphisms in the fatty acid binding protein 4, fatty acid synthase and stearoyl-CoA desaturase genes influence carcass characteristics of tropical crossbred beef steers. Agriculture 2022, 12, 1171. [Google Scholar] [CrossRef]
- Pećina, M.; Konjačić, M.; Ugarković, N.K.; Ivanković, A. Effect of FASN, SCD, and GH genes on carcass fatness and fatty acid composition of intramuscular lipids in F1 Holstein× beef breeds. Agriculture 2023, 13, 571. [Google Scholar] [CrossRef]
- Zhu, B.; Wang, T.; Niu, Q.; Wang, Z.; Hay, E.H.; Xu, L.; Chen, Y.; Zhang, L.; Gao, X.; Gao, H.; et al. Multiple strategies association revealed functional candidate FASN gene for fatty acid composition in cattle. Commun. Biol. 2025, 8, 208. [Google Scholar] [CrossRef]
- Abe, T.; Saburi, J.; Hasebe, H.; Nakagawa, T.; Misumi, S.; Nade, T.; Nakajima, H.; Shoji, N.; Kobayashi, M.; Kobayashi, E. Novel Mutations of the FASN Gene and Their Effect on Fatty Acid Composition in Japanese Black Beef. Biochem. Genet. 2009, 47, 397–411. [Google Scholar] [CrossRef] [PubMed]
- Dawood, M.; Kramer, L.M.; Shabbir, M.I.; Reecy, J.M. Genome-Wide Association Study for Fatty Acid Composition in American Angus Cattle. Animals 2021, 11, 2424. [Google Scholar] [CrossRef]
- Jin, S.; Lee, S.H.; Lee, D.H.; Manjula, P.; Lee, S.H.; Lee, J.H. Genetic association of DEGS1, ELOVL6, FABP3, FABP4, FASN and SCD genes with fatty acid composition in breast and thigh muscles of Korean native chicken. Anim. Genet. 2020, 51, 344–345. [Google Scholar] [CrossRef]
- Sasago, N.; Abe, T.; Sakuma, H.; Kojima, T.; Uemoto, Y. Genome-wide association study for carcass traits, fatty acid composition, chemical composition, sugar, and the effects of related candidate genes in Japanese Black cattle. Anim. Sci. J. 2017, 88, 33–44. [Google Scholar] [CrossRef]
- Edea, Z.; Jeoung, Y.H.; Shin, S.-S.; Ku, J.; Seo, S.; Kim, I.-H.; Kim, S.-W.; Kim, K.-S. Genome–Wide Association Study of Carcass Weight in Commercial Hanwoo Cattle. Asian-Australas. J. Anim. Sci. 2017, 31, 327–334. [Google Scholar] [CrossRef]
- Utsunomiya, Y.T.; Milanesi, M.; Utsunomiya, A.T.; Torrecilha, R.B.; Kim, E.S.; Costa, M.S.; Aguiar, T.S.; Schroeder, S.; Do Carmo, A.S.; Carvalheiro, R.; et al. A PLAG1 Mutation Contributed to Stature Recovery in Modern Cattle. Sci. Rep. 2017, 7, 17140. [Google Scholar] [CrossRef]
- GT Pereira, A.; Utsunomiya, Y.T.; Milanesi, M.; Torrecilha, R.B.; Carmo, A.S.; Neves, H.H.; Carvalheiro, R.; Ajmone-Marsan, P.; Sonstegard, T.S.; Sölkner, J.; et al. Pleiotropic genes affecting carcass traits in Bos indicus (Nellore) cattle are modulators of growth. PLoS ONE 2016, 11, e0158165. [Google Scholar] [CrossRef]
- Takasuga, A. PLAG1 and NCAPG-LCORL in livestock. Anim. Sci. J. 2016, 87, 159–167. [Google Scholar] [CrossRef]
- Fahira, A.; Noor, R.R.; Jakaria, J. Diversity of SNP C.795A > G PLAG1 Gene and Its Association to Birth Weight of Bali Cattle. J. Ilmu Ternak Dan Vet. 2022, 27, 107–113. [Google Scholar] [CrossRef]
- Ministry of Agriculture, Food and Rural Affairs. Detailed Criteria for Livestock Product Grading, Ministry of Agriculture, Food and Rural Affairs Notice No. 2023-102; MAFRA: Sejong, Republic of Korea, 2023.
- Livak, K.J.; Schmittgen, T.D. Analysis of Relative Gene Expression Data Using Real-Time Quantitative PCR and the 2−ΔΔCT Method. Methods 2001, 25, 402–408. [Google Scholar] [CrossRef]
- Schennink, A.; Bovenhuis, H.; Léon-Kloosterziel, K.M.; Van Arendonk, J.A.M.; Visker, M.H.P.W. Effect of Polymorphisms in TheFASN, OLR1, PPARGC1A, PRL and STAT5Agenes on Bovine Milk-Fat Composition. Anim. Genet. 2009, 40, 909–916. [Google Scholar] [CrossRef]
- Bartoň, L.; Bureš, D.; Kott, T.; Řehák, D. Associations of Polymorphisms in Bovine DGAT1, FABP4, FASN, and PPARGC1A Genes with Intramuscular Fat Content and the Fatty Acid Composition of Muscle and Subcutaneous Fat in Fleckvieh Bulls. Meat Sci. 2016, 114, 18–23. [Google Scholar] [CrossRef] [PubMed]
- Matsuhashi, T.; Maruyama, S.; Uemoto, Y.; Kobayashi, N.; Mannen, H.; Abe, T.; Sakaguchi, S.; Kobayashi, E. Effects of Bovine Fatty Acid Synthase, Stearoyl-Coenzyme a Desaturase, Sterol Regulatory Element-Binding Protein 1, and Growth Hormone Gene Polymorphisms on Fatty Acid Composition and Carcass Traits in Japanese Black Cattle1. J. Anim. Sci. 2011, 89, 12–22. [Google Scholar] [CrossRef]
- Taye, M.; Yoon, J.; Dessie, T.; Cho, S.; Oh, S.J.; Lee, H.K.; Kim, H. Deciphering signature of selection affecting beef quality traits in Angus cattle. Genes Genom. 2018, 40, 63–75. [Google Scholar] [CrossRef] [PubMed]
- Seo, D.; Lee, D.H.; Jin, S.; Won, J.I.; Lim, D.; Park, M.; Kim, T.H.; Lee, H.K.; Kim, S.; Choi, I.; et al. Long-term artificial selection of Hanwoo (Korean) cattle left genetic signatures for the breeding traits and has altered the genomic structure. Sci. Rep. 2022, 12, 6438. [Google Scholar] [CrossRef] [PubMed]
- Song, Y.; Xu, L.; Chen, Y.; Zhang, L.; Gao, H.; Zhu, B.; Niu, H.; Zhang, W.; Xia, J.; Gao, X.; et al. Genome-Wide Association Study Reveals the PLAG1 Gene for Knuckle, Biceps and Shank Weight in Simmental Beef Cattle. PLoS ONE 2016, 11, e0168316. [Google Scholar] [CrossRef]
- Zhou, Z.; Huang, B.; Lai, Z.; Li, S.; Wu, F.; Qu, K.; Jia, Y.; Hou, J.; Liu, J.; Lei, C.; et al. The Distribution Characteristics of a 19-Bp Indel of the PLAG1 Gene in Chinese Cattle. Animals 2019, 9, 1082. [Google Scholar] [CrossRef]
- Chu, M.; Wu, X.Y.; Guo, X.; Pei, J.; Jiao, F.; Fang, H.T.; Liang, C.N.; Ding, X.Z.; Bao, P.J.; Yan, P. Association between Single-Nucleotide Polymorphisms of Fatty Acid Synthase Gene and Meat Quality Traits in Datong Yak (Bos grunniens). Genet. Mol. Res. 2015, 14, 2617–2625. [Google Scholar] [CrossRef]
- Gao, Y.Y.; Cheng, G.; Cheng, Z.X.; Bao, C.; Yamada, T.; Cao, G.F.; Bao, S.Q.; Schreurs, N.M.; Zan, L.S.; Tong, B. Association of Variants in FABP4, FASN, SCD, SREBP1 and TCAP Genes with Intramuscular Fat, Carcass Traits and Body Size in Chinese Qinchuan Cattle. Meat Sci. 2022, 192, 108882. [Google Scholar] [CrossRef]
- Fink, T.; Tiplady, K.; Lopdell, T.; Johnson, T.; Snell, R.G.; Spelman, R.J.; Davis, S.R.; Littlejohn, M.D. Functional Confirmation of PLAG1 as the Candidate Causative Gene Underlying Major Pleiotropic Effects on Body Weight and Milk Characteristics. Sci. Rep. 2017, 7, 44793. [Google Scholar] [CrossRef]
- Kawaguchi, F.; Kigoshi, H.; Nakajima, A.; Matsumoto, Y.; Uemoto, Y.; Fukushima, M.; Yoshida, E.; Iwamoto, E.; Akiyama, T.; Kohama, N.; et al. Pool-Based Genome-Wide Association Study Identified Novel Candidate Regions on BTA9 and 14 for Oleic Acid Percentage in Japanese Black Cattle. Anim. Sci. J. Nihon Chikusan Gakkaiho 2018, 89, 1060–1066. [Google Scholar] [CrossRef] [PubMed]
- Sasazaki, S. Development of DNA Markers for Improvement of Meat Quality in a Japanese Black Cattle Population in Hyogo Prefecture. Anim. Sci. J. 2021, 92, e13663. [Google Scholar] [CrossRef]
- Yokota, S.; Sugita, H.; Ardiyanti, A.; Shoji, N.; Nakajima, H.; Hosono, M.; Otomo, Y.; Suda, Y.; Katoh, K.; Suzuki, K. Contributions of FASN and SCD Gene Polymorphisms on Fatty Acid Composition in Muscle from Japanese Black Cattle. Anim. Genet. 2012, 43, 790–792. [Google Scholar] [CrossRef]
- Otto, J.R.; Mwangi, F.W.; Pewan, S.B.; Adegboye, O.A.; Malau-Aduli, A.E. Lipogenic gene single nucleotide polymorphic DNA markers associated with intramuscular fat, fat melting point, and health-beneficial omega-3 long-chain polyunsaturated fatty acids in Australian pasture-based Bowen Genetics Forest Pastoral Angus, Hereford, and Wagyu beef cattle. Genes 2022, 13, 1411. [Google Scholar] [CrossRef] [PubMed]
- Kim, H.J.; Sharma, A.; Lee, S.H.; Lee, D.H.; Lim, D.J.; Cho, Y.M.; Yang, B.S.; Lee, S.H. Genetic Association of PLAG1, SCD, CYP7B1 and FASN SNPs and Their Effects on Carcass Weight, Intramuscular Fat and Fatty Acid Composition in Hanwoo Steers (Korean Cattle). Anim. Genet. 2017, 48, 251–252. [Google Scholar] [CrossRef]
- Oh, D.; Jin, M.; Lee, Y.; Ha, J.; Kim, B.; Yeo, J.; Lee, J. Identification of Stearoyl-CoA Desaturase (SCD) Gene Interactions in Korean Native Cattle Based on the Multifactor-Dimensionality Reduction Method. Asian-Australas. J. Anim. Sci. 2013, 26, 1218–1228. [Google Scholar] [CrossRef]
- Oh, D.; Lee, Y.; La, B.; Yeo, J.; Chung, E.; Kim, Y.; Lee, C. Fatty Acid Composition of Beef Is Associated with Exonic Nucleotide Variants of the Gene Encoding FASN. Mol. Biol. Rep. 2011, 39, 4083–4090. [Google Scholar] [CrossRef]
- Sevane, N.; Levéziel, H.; Nute, G.R.; Sañudo, C.; Valentini, A.; Williams, J.; Dunner, S. Phenotypic and Genotypic Background Underlying Variations in Fatty Acid Composition and Sensory Parameters in European Bovine Breeds. J. Anim. Sci. Biotechnol. 2014, 5, 20. [Google Scholar] [CrossRef]
- Saini, R.K.; Keum, Y.S. Omega-3 and omega-6 polyunsaturated fatty acids: Dietary sources, metabolism, and significance—A review. Life Sci. 2018, 203, 255–267. [Google Scholar] [CrossRef] [PubMed]
- Gökçe, G. The effect of SCD and FASN gene polymorphisms on milk fatty acid composition in Holstein breed. Food Sci. Anim. Resour. 2024. [Google Scholar] [CrossRef]
- Arshad, M.S.; Sohaib, M.; Ahmad, R.S.; Nadeem, M.T.; Imran, A.; Arshad, M.U.; Kwon, J.H.; Amjad, Z. Ruminant meat flavor influenced by different factors with special reference to fatty acids. Lipids Health Dis. 2018, 17, 223. [Google Scholar] [CrossRef] [PubMed]
- Dinh TT, N.; To, K.V.; Schilling, M.W. Fatty acid composition of meat animals as flavor precursors. Meat Muscle Biol. 2021, 5, 1–16. [Google Scholar] [CrossRef]
- Zhong, J.-L.; Xu, J.-W.; Wang, J.; Wen, Y.-F.; Niu, H.; Zheng, L.; He, H.; Peng, K.; He, P.; Shi, S.-Y.; et al. A Novel SNP of PLAG1 Gene and Its Association with Growth Traits in Chinese Cattle. Gene 2019, 689, 166–171. [Google Scholar] [CrossRef] [PubMed]
- Zhang, R.; Miao, J.; Song, Y.; Zhang, W.; Xu, L.; Chen, Y.; Zhang, L.; Gao, H.; Zhu, B.; Li, J.; et al. Genome-Wide Association Study Identifies the PLAG1-OXR1 Region on BTA14 for Carcass Meat Yield in Cattle. Physiol. Genom. 2019, 51, 137–144. [Google Scholar] [CrossRef]
- Kim, H.; Park, S.; Kim, B.; Kim, M.; Lee, T.H.; Yu, J.; Park, I.S.; Hur, S.J.; Li, X.Z.; Choi, S.H. Effect of Glucose and Lysine Supplementation on Myogenic and Adipogenic Gene Expression in Muscle Satellite Cells Isolated from Hanwoo with Different Genotypes of PLAG1: Implications for Cell-Based Food Production. Curr. Res. Food Sci. 2024, 9, 100879. [Google Scholar] [CrossRef]
- Fang, C.; Pan, J.; Qu, N.; Lei, Y.; Han, J.; Zhang, J.; Han, D. The AMPK pathway in fatty liver disease. Front. Physiol. 2022, 13, 970292. [Google Scholar] [CrossRef]
- Wang, J.; Xiang, H.; Lu, Y.; Wu, T.; Ji, G. The Role and Therapeutic Implication of CPTs in Fatty Acid Oxidation and Cancers Progression. Am. J. Cancer Res. 2021, 11, 2477–2494. [Google Scholar] [PubMed Central]
- Yao, C.; Pang, D.; Lu, C.; Xu, A.; Huang, P.; Ouyang, H.; Yu, H. Data mining and validation of AMPK pathway as a novel candidate role affecting intramuscular fat content in pigs. Animals 2019, 9, 137. [Google Scholar] [CrossRef]
- Lee, D.H.; Kim, M.T.; Han, J.H. GPR41 and GPR43: From development to metabolic regulation. Biomed. Pharmacother. 2024, 175, 116735. [Google Scholar] [CrossRef]
- Durand, G.; Charrier, P.; Bes, S.; Bernard, L.; Lamothe, V.; Gruffat, D.; Bonnet, M. Gene expression of free fatty acids-sensing G protein-coupled receptors in beef cattle. J. Anim. Sci. 2024, 102, skae114. [Google Scholar] [CrossRef] [PubMed]
- Liu, R.; Fang, X.; Lu, X.; Liu, Y.; Li, Y.; Bai, X.; Ding, X.; Yang, R. Polymorphisms of the SCD1 Gene and Its Association Analysis with Carcass, Meat Quality, Adipogenic Traits, Fatty Acid Composition, and Milk Production Traits in Cattle. Animals 2024, 14, 1759. [Google Scholar] [CrossRef] [PubMed]
- Gamarra, D.; Aldai, N.; Arakawa, A.; Barron, L.J.; López-Oceja, A.; de Pancorbo, M.M.; Taniguchi, M. Distinct correlations between lipogenic gene expression and fatty acid composition of subcutaneous fat among cattle breeds. BMC Vet. Res. 2018, 14, 167. [Google Scholar] [CrossRef] [PubMed]
- Li, Z.; Wu, M.; Zhao, H.; Fan, L.; Zhang, Y.; Yuan, T.; He, S.; Wang, P.; Zhang, Y.; Sun, X.; et al. The PLAG1 mRNA expression analysis among genetic variants and relevance to growth traits in Chinese cattle. Anim. Biotechnol. 2020, 31, 504–511. [Google Scholar] [CrossRef]
- Aghanoori, M.R.; Smith, D.R.; Shariati-Ievari, S.; Ajisebutu, A.; Nguyen, A.; Desmond, F.; Jesus, C.H.; Zhou, X.; Calcutt, N.A.; Aliani, M.; et al. Insulin-like growth factor-1 activates AMPK to augment mitochondrial function and correct neuronal metabolism in sensory neurons in type 1 diabetes. Mol. Metab. 2019, 20, 149–165. [Google Scholar] [CrossRef]


| Gene | Primer Sequence (5′ to 3′) | Size (bp) and Amplified Region | Annealing Temp | Restriction Enzyme |
|---|---|---|---|---|
| FASN NC_037346.1 | F: CTACCAAGCCAGGCAGGTC | 337 (Exon 34) | 52 °C | HhaI |
| R: GCCATTGTACTTGGGCTTGT | ||||
| SCD NC_037353.1 | F: TCAGGTAGGTCTCAGCGTC | 494 (Exon 5) | 52 °C | FauI |
| R: CATTGTCATTTTTCACCCTTT | ||||
| PLAG1 NC_037341.1 | F: CAA GGG CTC AAC GTA GG | 374 (3′UTR) | 53 °C | HphI |
| R: TGTTTCAAGTGCCATTAGAGG |
| Gene | Gene ID | Sequence (5′ to 3′) |
|---|---|---|
| RPS9 | DT860044 | F: GAGCTGGGTTTGTCGCAAAA |
| R: GGTCGAGGCGGGACTTCT | ||
| AMPK-α | NM_001109802 | F: ACCATTCTTGGTTGCTGAAACTC |
| R: CACCTTGGTGTTTGGATTTCTG | ||
| CPT1β | NM_001034349 | F: ACACATCTACCTGTCCGTGATCA |
| R: CCCCTGAGGATGCCATTCT | ||
| GPR43 | FJ_562212 | F: GGCTTTCCCCGTGCAGTA |
| R: ATCAGAGCAGCGATCACTCCAT | ||
| SCD | AB075020 | F: TGCCCACCACAAGTTTTCAG |
| R: GCCAACCCACGTGAGAGAAG |
| FASN g. 16024 G>A | χ2 | SCD g. 10329 C>T | χ2 | PLAG1 g. 25003338 C>G | χ2 | |||||||||||||
|---|---|---|---|---|---|---|---|---|---|---|---|---|---|---|---|---|---|---|
| Genotype | Allele | Genotype | Allele | Genotype | Allele | |||||||||||||
| AA (n = 22) | AG (n = 45) | GG (n = 41) | A | G | CC (n = 12) | CT (n = 54) | TT (n = 33) | C | T | CC (n = 9) | CG (n = 39) | GG (n = 51) | C | G | ||||
| 0.204 | 0.417 | 0.380 | 0.412 | 0.588 | 0.347 | 0.121 | 0.545 | 0.333 | 0.394 | 0.606 | 0.367 | 0.091 | 0.394 | 0.515 | 0.288 | 0.712 | 0.927 | |
| Quality Grade | ||||||||||||||||||
| 1++ | 0.102 | 0.176 | 0.130 | 0.190 | 0.218 | 0.040 | 0.232 | 0.131 | 0.157 | 0.247 | 0.020 | 0.162 | 0.232 | 0.101 | 0.313 | |||
| 1+ | 0.065 | 0.120 | 0.167 | 0.125 | 0.227 | 0.040 | 0.192 | 0.131 | 0.136 | 0.227 | 0.051 | 0.162 | 0.172 | 0.131 | 0.253 | |||
| 1 | 0.028 | 0.083 | 0.074 | 0.069 | 0.116 | 0.040 | 0.091 | 0.051 | 0.086 | 0.096 | 0.000 | 0.061 | 0.091 | 0.030 | 0.121 | |||
| 2 | 0.009 | 0.037 | 0.009 | 0.028 | 0.028 | 0.000 | 0.030 | 0.020 | 0.015 | 0.035 | 0.020 | 0.010 | 0.020 | 0.025 | 0.025 | |||
| Yield Grade | ||||||||||||||||||
| A | 0.056 | 0.065 | 0.065 | 0.088 | 0.097 | 0.030 | 0.101 | 0.091 | 0.081 | 0.141 | 0.051 | 0.071 | 0.091 | 0.086 | 0.126 | |||
| B | 0.120 | 0.269 | 0.231 | 0.255 | 0.366 | 0.061 | 0.323 | 0.192 | 0.222 | 0.354 | 0.040 | 0.242 | 0.323 | 0.162 | 0.444 | |||
| C | 0.028 | 0.083 | 0.083 | 0.069 | 0.125 | 0.030 | 0.121 | 0.051 | 0.091 | 0.111 | 0.000 | 0.081 | 0.101 | 0.040 | 0.141 | |||
| Muscle Tissue | p-Value | Adipose Tissue | p-Value | |||||
|---|---|---|---|---|---|---|---|---|
| AA | AG | GG | AA | AG | GG | |||
| Decanoic acid (C10:0) | 4.35 ± 2.39 | 3.58 ± 3.16 | 2.66 ± 3.42 | 0.22 | 0.62 ± 1.86 | 1.47 ± 2.46 | 0.85 ± 2.03 | 0.564 |
| Lauric acid (C12:0) | 0.07 ± 0.03 | 0.06 ± 0.04 | 0.06 ± 0.04 | 0.354 | 0.12 ± 0.03 ab | 0.13 ± 0.03 a | 0.10 ± 0.03 b | 0.018 |
| Myristic acid (C14:0) | 2.27 ± 0.32 | 2.40 ± 0.56 | 2.20 ± 0.50 | 0.302 | 3.11 ± 0.32 | 3.66 ± 0.64 | 3.63 ± 0.93 | 0.163 |
| Myristoleic acid (C14:1) | 0.61 ± 0.23 | 0.66 ± 0.27 | 0.57 ± 0.24 | 0.354 | 2.36 ± 0.54 | 2.20 ± 0.69 | 2.40 ± 1.07 | 0.765 |
| Palmitic acid (C16:0) | 26.07 ± 1.62 | 26.74 ± 1.99 | 27.01 ± 1.44 | 0.225 | 23.36 ± 1.27 | 24.32 ± 2.11 | 24.49 ± 1.87 | 0.323 |
| Palmitoleic acid (C16:1) | 4.08 ± 0.58 | 4.15 ± 0.89 | 3.96 ± 0.75 | 0.653 | 7.79 ± 1.53 | 7.74 ± 1.37 | 8.45 ± 1.67 | 0.330 |
| Stearic acid (C18:0) | 9.37 ± 1.19 | 9.76 ± 1.24 | 9.89 ± 1.29 | 0.427 | 5.98 ± 1.55 | 6.68 ± 1.49 | 6.30 ± 1.19 | 0.438 |
| Oleic acid (C18:1) | 45.55 ± 1.87 | 44.69 ± 2.72 | 45.16 ± 2.99 | 0.595 | 50.21 ± 1.66 | 47.79 ± 3.95 | 47.86 ± 3.79 | 0.208 |
| Linoleic (C18:2n-6) | 3.86 ± 1.22 | 4.02 ± 1.89 | 4.40 ± 1.40 | 0.483 | 2.68 ± 0.34 | 2.55 ± 0.41 | 2.59 ± 0.47 | 0.771 |
| γ-Linoleic (C18:3n-6) | 0.09 ± 0.04 a | 0.08 ± 0.07 a | 0.04 ± 0.05 b | 0.013 | 0.21 ± 0.04 | 0.19 ± 0.03 | 0.19 ± 0.03 | 0.151 |
| Linolenic (C18:3n-3) | 0.13 ± 0.02 | 0.11 ± 0.07 | 0.22 ± 0.51 | 0.482 | 0.16 ± 0.02 | 0.15 ± 0.03 | 0.15 ± 0.03 | 0.530 |
| Arachidic acid (C20:0) | 0.03 ± 0.03 | 0.03 ± 0.03 | 0.02 ± 0.03 | 0.249 | 0.04 ± 0.04 | 0.05 ± 0.04 | 0.03 ± 0.04 | 0.466 |
| Heneicosanoic acid (C20:1) | 0.30 ± 0.08 | 0.25 ± 0.1 | 0.26 ± 0.09 | 0.34 | 0.53 ± 0.15 a | 0.42 ± 0.14 b | 0.39 ± 0.13 b | 0.037 |
| Eicosatrienoic acid (C20:2n-6) | 0.02 ± 0.05 | 0.01 ± 0.03 | 0.02 ± 0.04 | 0.618 | 0.02 ± 0.04 a | 0.00 ± 0.00 b | 0.00 ± 0.02 ab | 0.079 |
| C20:3n-6 | 0.48 ± 0.26 | 0.56 ± 0.36 | 0.60 ± 0.25 | 0.416 | 0.20 ± 0.06 | 0.21 ± 0.04 | 0.16 ± 0.07 | 0.063 |
| C20:4n-6 | 0.96 ± 0.58 | 1.09 ± 0.84 | 1.22 ± 0.61 | 0.493 | 0.06 ± 0.06 | 0.06 ± 0.05 | 0.04 ± 0.05 | 0.428 |
| Total SFAs (1) | 43.03 ± 2.96 | 43.50 ± 3.61 | 42.70 ± 3.31 | 0.669 | 34.21 ± 2.20 b | 37.27 ± 4.37 a | 36.35 ± 3.38 ab | 0.131 |
| Total MUFAs (2) | 51.19 ± 2.24 | 50.40 ± 2.90 | 50.61 ± 2.74 | 0.656 | 61.76 ± 1.99 | 58.92 ± 4.39 | 59.87 ± 3.16 | 0.158 |
| Total PUFAs (3) | 5.55 ± 2.00 | 5.87 ± 2.98 | 6.50 ± 2.19 | 0.426 | 3.34 ± 0.46 | 3.15 ± 0.45 | 3.14 ± 0.52 | 0.565 |
| UFAs/SFAs (4) | 1.33 ± 0.16 | 1.31 ± 0.19 | 1.35 ± 0.18 | 0.661 | 1.91 ± 0.18 a | 1.70 ± 0.30 b | 1.76 ± 0.25 ab | 0.147 |
| ω3/ω6 | 0.03 ± 0.01 | 0.02 ± 0.02 | 0.03 ± 0.07 | 0.695 | 0.05 ± 0.01 | 0.05 ± 0.01 | 0.05 ± 0.01 | 0.488 |
| Muscle Tissue | p-Value | Adipose Tissue | p-Value | |||||
|---|---|---|---|---|---|---|---|---|
| CC | CT | TT | CC | CT | TT | |||
| Decanoic acid (C10:0) | 2.25 ± 3.12 | 3.05 ± 3.12 | 4.05 ± 3.51 | 0.363 | 0.8 ± 2.11 | 1 ± 2.13 | 1.3 ± 2.37 | 0.882 |
| Lauric acid (C12:0) | 0.06 ± 0.03 | 0.06 ± 0.05 | 0.06 ± 0.05 | 0.97 | 0.11 ± 0.03 | 0.12 ± 0.03 | 0.11 ± 0.04 | 0.726 |
| Myristic acid (C14:0) | 2.09 ± 0.27 | 2.26 ± 0.53 | 2.33 ± 0.53 | 0.53 | 3.12 ± 0.66 | 3.58 ± 0.67 | 3.65 ± 0.85 | 0.279 |
| Myristoleic acid (C14:1) | 0.77 ± 0.18 a | 0.65 ± 0.32 ab | 0.51 ± 0.27 b | 0.086 | 2.61 ± 0.9 a | 2.56 ± 0.9 a | 1.85 ± 0.56 b | 0.047 |
| Palmitic acid (C16:0) | 26.59 ± 1.45 | 26.74 ± 1.57 | 26.42 ± 1.68 | 0.768 | 23.54 ± 1.76 | 24.33 ± 1.52 | 24.01 ± 1.94 | 0.562 |
| Palmitoleic acid (C16:1) | 3.9 ± 0.44 | 4.1 ± 0.99 | 4.12 ± 0.83 | 0.834 | 6.89 ± 1.67 b | 8.58 ± 1.33 a | 8.07 ± 1.02 a | 0.019 |
| Stearic acid (C18:0) | 9.15 ± 0.78 | 9.62 ± 1.39 | 10.11 ± 1.52 | 0.217 | 6.69 ± 1.61 | 5.88 ± 0.9 | 6.43 ± 0.87 | 0.14 |
| Oleic acid (C18:1) | 46.4 ± 2.7 | 45.26 ± 2.81 | 44.66 ± 2.59 | 0.324 | 49.78 ± 2.92 | 48 ± 3.36 | 48.68 ± 4.16 | 0.513 |
| Linoleic (C18:2n-6) | 4.46 ± 1.62 | 4.26 ± 1.58 | 3.95 ± 1.67 | 0.703 | 2.75 ± 0.44 | 2.57 ± 0.41 | 2.57 ± 0.51 | 0.629 |
| γ-Linoleic (C18:3n-6) | 0.07 ± 0.06 | 0.07 ± 0.07 | 0.08 ± 0.05 | 0.869 | 0.22 ± 0.03 a | 0.2 ± 0.03 ab | 0.18 ± 0.03 b | 0.041 |
| Linolenic (C18:3n-3) | 0.15 ± 0.04 | 0.2 ± 0.47 | 0.1 ± 0.06 | 0.627 | 0.15 ± 0.03 | 0.15 ± 0.03 | 0.14 ± 0.02 | 0.432 |
| Arachidic acid (C20:0) | 0.02 ± 0.03 | 0.02 ± 0.03 | 0.03 ± 0.03 | 0.564 | 0.04 ± 0.04 | 0.03 ± 0.03 | 0.05 ± 0.04 | 0.195 |
| Heneicosanoic acid (C20:1) | 0.3 ± 0.08 | 0.27 ± 0.09 | 0.24 ± 0.09 | 0.282 | 0.48 ± 0.14 | 0.41 ± 0.13 | 0.44 ± 0.16 | 0.555 |
| Eicosatrienoic acid (C20:2n-6) | 0 ± 0 | 0.02 ± 0.04 | 0.03 ± 0.04 | 0.234 | 0.01 ± 0.03 | 0 ± 0 | 0.01 ± 0.03 | 0.28 |
| C20:3n-6 | 0.65 ± 0.3 | 0.58 ± 0.28 | 0.5 ± 0.34 | 0.471 | 0.2 ± 0.03 | 0.19 ± 0.07 | 0.18 ± 0.07 | 0.839 |
| C20:4n-6 | 1.29 ± 0.64 | 1.17 ± 0.69 | 1 ± 0.82 | 0.566 | 0.04 ± 0.06 | 0.05 ± 0.05 | 0.06 ± 0.05 | 0.648 |
| Total SFAs (1) | 41.07 ± 2.17 b | 42.59 ± 3.36 ab | 43.98 ± 2.95 a | 0.077 | 35.39 ± 2.56 | 35.85 ± 3.11 | 36.44 ± 3.57 | 0.77 |
| Total MUFAs (2) | 52.08 ± 2.51 | 50.91 ± 2.7 | 50.17 ± 2.51 | 0.225 | 60.6 ± 2.82 | 60.32 ± 2.95 | 59.82 ± 3.44 | 0.849 |
| Total PUFAs (3) | 6.62 ± 2.48 | 6.29 ± 2.52 | 5.66 ± 2.69 | 0.587 | 3.36 ± 0.48 | 3.16 ± 0.48 | 3.13 ± 0.55 | 0.585 |
| UFAs/SFAs (4) | 1.44 ± 0.13 a | 1.36 ± 0.18 ab | 1.28 ± 0.15 b | 0.075 | 1.82 ± 0.18 | 1.79 ± 0.23 | 1.75 ± 0.27 | 0.831 |
| ω3/ω6 | 0.03 ± 0.01 | 0.03 ± 0.07 | 0.02 ± 0.01 | 0.723 | 0.05 ± 0 | 0.05 ± 0.01 | 0.05 ± 0 | 0.269 |
| Muscle Tissue | p-Value | Adipose Tissue | p-Value | |||||
|---|---|---|---|---|---|---|---|---|
| CC | CG | GG | CC | CG | GG | |||
| Decanoic acid (C10:0) | 4.9 ± 2.83 | 2.71 ± 3.31 | 3.31 ± 3.14 | 0.351 | 2.13 ± 2.95 | 1.09 ± 2.17 | 0.93 ± 2.13 | 0.553 |
| Lauric acid (C12:0) | 0.09 ± 0.02 | 0.06 ± 0.04 | 0.06 ± 0.04 | 0.202 | 0.16 ± 0.03 a | 0.12 ± 0.03 b | 0.1 ± 0.02 b | 0.001 |
| Myristic acid (C14:0) | 2.71 ± 0.64 a | 2.33 ± 0.54 ab | 2.14 ± 0.42 b | 0.04 | 4.47 ± 0.88 a | 3.6 ± 0.89 b | 3.37 ± 0.5 b | 0.01 |
| Myristoleic acid (C14:1) | 0.75 ± 0.24 | 0.65 ± 0.27 | 0.55 ± 0.24 | 0.118 | 2.47 ± 1.13 | 2.08 ± 0.93 | 2.4 ± 0.72 | 0.483 |
| Palmitic acid (C16:0) | 25.71 ± 2.67 | 26.75 ± 1.84 | 26.7 ± 1.39 | 0.441 | 25.74 ± 2.64 | 24.31 ± 2.28 | 24.03 ± 1.29 | 0.174 |
| Palmitoleic acid (C16:1) | 4.66 ± 1.04 a | 4.13 ± 0.84 ab | 3.9 ± 0.74 b | 0.121 | 7.81 ± 1.86 | 7.58 ± 1.54 | 8.33 ± 1.2 | 0.267 |
| Stearic acid (C18:0) | 9.48 ± 1.28 | 9.9 ± 1.3 | 9.76 ± 1.3 | 0.776 | 7.85 ± 1.71 a | 6.68 ± 1.16 b | 5.91 ± 0.88 b | 0.002 |
| Oleic acid (C18:1) | 44.5 ± 3.24 | 44.94 ± 3.17 | 45.57 ± 2.29 | 0.556 | 43.47 ± 4.32 b | 48.63 ± 4.01 a | 48.86 ± 2.61 a | 0.007 |
| Linoleic (C18:2n-6) | 3.54 ± 1.27 | 4.46 ± 1.81 | 4.12 ± 1.44 | 0.444 | 2.57 ± 0.19 | 2.52 ± 0.46 | 2.65 ± 0.45 | 0.674 |
| γ-Linoleic (C18:3n-6) | 0.07 ± 0.07 | 0.07 ± 0.07 | 0.06 ± 0.05 | 0.753 | 0.17 ± 0.05 b | 0.2 ± 0.03 a | 0.19 ± 0.03 ab | 0.153 |
| Linolenic (C18:3n-3) | 0.16 ± 0.04 | 0.1 ± 0.07 | 0.21 ± 0.48 | 0.47 | 0.16 ± 0.03 | 0.15 ± 0.03 | 0.15 ± 0.02 | 0.454 |
| Arachidic acid (C20:0) | 0.03 ± 0.03 | 0.02 ± 0.03 | 0.02 ± 0.03 | 0.766 | 0.07 ± 0.01 a | 0.04 ± 0.04 b | 0.03 ± 0.03 b | 0.072 |
| Heneicosanoic acid (C20:1) | 0.27 ± 0.11 | 0.23 ± 0.13 | 0.28 ± 0.06 | 0.148 | 0.3 ± 0.16 b | 0.46 ± 0.16 a | 0.42 ± 0.12 ab | 0.087 |
| Eicosatrienoic acid (C20:2n-6) | 0.01 ± 0.02 | 0.02 ± 0.04 | 0.02 ± 0.04 | 0.837 | 0 ± 0 | 0.01 ± 0.02 | 0 ± 0.02 | 0.809 |
| C20:3n-6 | 0.44 ± 0.16 | 0.59 ± 0.34 | 0.56 ± 0.28 | 0.6 | 0.18 ± 0.11 | 0.19 ± 0.07 | 0.19 ± 0.04 | 0.925 |
| C20:4n-6 | 0.83 ± 0.44 | 1.21 ± 0.82 | 1.1 ± 0.65 | 0.533 | 0.05 ± 0.06 | 0.04 ± 0.05 | 0.05 ± 0.05 | 0.723 |
| Total SFAs (1) | 43.8 ± 2.88 | 42.74 ± 3.44 | 42.81 ± 3.38 | 0.806 | 41.49 ± 4.61 a | 36.82 ± 3.13 b | 35.28 ± 2.61 b | 0.001 |
| Total MUFAs (2) | 50.85 ± 3.17 | 50.63 ± 3.03 | 50.92 ± 2.42 | 0.916 | 54.78 ± 4.58 b | 59.52 ± 3.09 a | 60.81 ± 2.57 a | 0.001 |
| Total PUFAs (3) | 5.05 ± 1.8 | 6.44 ± 2.84 | 6.06 ± 2.37 | 0.517 | 3.12 ± 0.29 | 3.1 ± 0.52 | 3.23 ± 0.49 | 0.698 |
| UFAs/SFAs (4) | 1.29 ± 0.16 | 1.35 ± 0.18 | 1.35 ± 0.18 | 0.764 | 1.42 ± 0.29 b | 1.72 ± 0.23 a | 1.83 ± 0.2 a | 0.002 |
| ω3/ω6 | 0.03 ± 0.01 | 0.02 ± 0.01 | 0.04 ± 0.07 | 0.41 | 0.05 ± 0.01 | 0.05 ± 0.01 | 0.05 ± 0.01 | 0.323 |
| Muscle Tissue | Adipose Tissue | |||||
|---|---|---|---|---|---|---|
| Genotype (G) | Quality Grade (Q) | G×Q | Genotype (G) | Quality Grade (Q) | G×Q | |
| Decanoic acid (C10:0) | N.S. | N.S. | N.S. | N.S. | * | N.S. |
| Lauric acid (C12:0) | N.S. | N.S. | N.S. | N.S. | N.S. | N.S. |
| Myristic acid (C14:0) | N.S. | N.S. | N.S. | N.S. | N.S. | N.S. |
| Myristoleic acid (C14:1) | N.S. | N.S. | N.S. | N.S. | N.S. | N.S. |
| Palmitic acid (C16:0) | N.S. | N.S. | N.S. | N.S. | N.S. | N.S. |
| Palmitoleic acid (C16:1) | N.S. | N.S. | N.S. | N.S. | N.S. | N.S. |
| Stearic acid (C18:0) | N.S. | N.S. | * | N.S. | N.S. | N.S. |
| Oleic acid (C18:1) | N.S. | N.S. | N.S. | N.S. | N.S. | N.S. |
| Linoleic (C18:2n-6) | N.S. | * | N.S. | N.S. | N.S. | N.S. |
| γ-Linoleic (C18:3n-6) | * | * | N.S. | N.S. | N.S. | N.S. |
| Linolenic (C18:3n-3) | N.S. | N.S. | N.S. | N.S. | N.S. | N.S. |
| Arachidic acid (C20:0) | N.S. | N.S. | N.S. | N.S. | N.S. | N.S. |
| Heneicosanoic acid (C20:1) | * | N.S. | N.S. | N.S. | N.S. | N.S. |
| Eicosatrienoic acid (C20:2n-6) | N.S. | N.S. | N.S. | * | * | * |
| C20:3n-6 | N.S. | N.S. | N.S. | N.S. | N.S. | N.S. |
| C20:4n-6 | N.S. | * | N.S. | N.S. | N.S. | N.S. |
| Total SFAs (1) | N.S. | * | N.S. | N.S. | N.S. | N.S. |
| Total MUFAs (2) | N.S. | N.S. | N.S. | N.S. | N.S. | N.S. |
| Total PUFAs (3) | N.S. | * | N.S. | N.S. | N.S. | N.S. |
| UFAs/SFAs (4) | N.S. | * | N.S. | N.S. | N.S. | N.S. |
| ω3/ω6 | N.S. | N.S. | N.S. | * | N.S. | N.S. |
| Muscle Tissue | Adipose Tissue | |||||
|---|---|---|---|---|---|---|
| Genotype (G) | Quality Grade (Q) | G×Q | Genotype (G) | Quality Grade (Q) | G×Q | |
| Decanoic acid (C10:0) | N.S. | N.S. | N.S. | N.S. | N.S. | N.S. |
| Lauric acid (C12:0) | N.S. | N.S. | N.S. | N.S. | N.S. | N.S. |
| Myristic acid (C14:0) | N.S. | N.S. | N.S. | N.S. | N.S. | N.S. |
| Myristoleic acid (C14:1) | N.S. | N.S. | N.S. | * | N.S. | N.S. |
| Palmitic acid (C16:0) | N.S. | N.S. | N.S. | N.S. | N.S. | N.S. |
| Palmitoleic acid (C16:1) | N.S. | N.S. | N.S. | * | N.S. | N.S. |
| Stearic acid (C18:0) | N.S. | N.S. | N.S. | N.S. | N.S. | N.S. |
| Oleic acid (C18:1) | N.S. | * | N.S. | N.S. | N.S. | N.S. |
| Linoleic (C18:2n-6) | N.S. | * | N.S. | N.S. | N.S. | N.S. |
| γ-Linoleic (C18:3n-6) | N.S. | N.S. | N.S. | * | N.S. | N.S. |
| Linolenic (C18:3n-3) | N.S. | N.S. | N.S. | N.S. | N.S. | N.S. |
| Arachidic acid (C20:0) | N.S. | N.S. | N.S. | N.S. | N.S. | N.S. |
| Heneicosanoic acid (C20:1) | * | N.S. | * | N.S. | N.S. | N.S. |
| Eicosatrienoic acid (C20:2n-6) | N.S. | N.S. | N.S. | N.S. | *** | N.S. |
| C20:3n-6 | N.S. | N.S. | N.S. | N.S. | N.S. | N.S. |
| C20:4n-6 | N.S. | N.S. | N.S. | N.S. | N.S. | N.S. |
| Total SFAs (1) | N.S. | N.S. | N.S. | N.S. | N.S. | N.S. |
| Total MUFAs (2) | N.S. | * | N.S. | N.S. | N.S. | N.S. |
| Total PUFAs (3) | N.S. | * | N.S. | N.S. | N.S. | N.S. |
| UFAs/SFAs (4) | N.S. | N.S. | N.S. | N.S. | N.S. | N.S. |
| ω3/ω6 | N.S. | N.S. | N.S. | N.S. | N.S. | N.S. |
| Muscle Tissue | Adipose Tissue | |||||
|---|---|---|---|---|---|---|
| Genotype (G) | Quality Grade (Q) | G×Q | Genotype (G) | Quality Grade (Q) | G×Q | |
| Decanoic acid (C10:0) | N.S. | * | N.S. | N.S. | * | N.S. |
| Lauric acid (C12:0) | * | N.S. | N.S. | * | N.S. | N.S. |
| Myristic acid (C14:0) | * | N.S. | N.S. | * | N.S. | N.S. |
| Myristoleic acid (C14:1) | * | N.S. | N.S. | N.S. | N.S. | N.S. |
| Palmitic acid (C16:0) | *** | * | *** | N.S. | N.S. | N.S. |
| Palmitoleic acid (C16:1) | ** | * | * | N.S. | N.S. | N.S. |
| Stearic acid (C18:0) | N.S. | N.S. | N.S. | * | N.S. | N.S. |
| Oleic acid (C18:1) | *** | N.S. | *** | * | N.S. | N.S. |
| Linoleic (C18:2n-6) | N.S. | N.S. | * | N.S. | N.S. | N.S. |
| γ-Linoleic (C18:3n-6) | N.S. | N.S. | N.S. | N.S. | N.S. | N.S. |
| Linolenic (C18:3n-3) | N.S. | N.S. | N.S. | N.S. | N.S. | N.S. |
| Arachidic acid (C20:0) | N.S. | N.S. | N.S. | N.S. | N.S. | N.S. |
| Heneicosanoic acid (C20:1) | * | N.S. | N.S. | N.S. | N.S. | N.S. |
| Eicosatrienoic acid (C20:2n-6) | N.S. | N.S. | N.S. | N.S. | ** | N.S. |
| C20:3n-6 | N.S. | N.S. | N.S. | N.S. | N.S. | N.S. |
| C20:4n-6 | N.S. | N.S. | N.S. | N.S. | N.S. | N.S. |
| Total SFAs (1) | ** | * | *** | * | N.S. | N.S. |
| Total MUFAs (2) | *** | N.S. | *** | * | N.S. | N.S. |
| Total PUFAs (3) | N.S. | N.S. | N.S. | N.S. | N.S. | N.S. |
| UFAs/SFAs (4) | *** | *** | *** | * | N.S. | N.S. |
| ω3/ω6 | N.S. | N.S. | N.S. | N.S. | N.S. | N.S. |
Disclaimer/Publisher’s Note: The statements, opinions and data contained in all publications are solely those of the individual author(s) and contributor(s) and not of MDPI and/or the editor(s). MDPI and/or the editor(s) disclaim responsibility for any injury to people or property resulting from any ideas, methods, instructions or products referred to in the content. |
© 2025 by the authors. Licensee MDPI, Basel, Switzerland. This article is an open access article distributed under the terms and conditions of the Creative Commons Attribution (CC BY) license (https://creativecommons.org/licenses/by/4.0/).
Share and Cite
Yu, J.; Naseem, S.; Park, S.; Hur, S.; Choi, Y.; Lee, T.; Li, X.; Choi, S. FASN, SCD, and PLAG1 Gene Polymorphism and Association with Carcass Traits and Fatty Acid Profile in Hanwoo Cattle. Animals 2025, 15, 897. https://doi.org/10.3390/ani15060897
Yu J, Naseem S, Park S, Hur S, Choi Y, Lee T, Li X, Choi S. FASN, SCD, and PLAG1 Gene Polymorphism and Association with Carcass Traits and Fatty Acid Profile in Hanwoo Cattle. Animals. 2025; 15(6):897. https://doi.org/10.3390/ani15060897
Chicago/Turabian StyleYu, Jia, Sajida Naseem, Sungkwon Park, Sunjin Hur, Yoonbin Choi, Teahyung Lee, Xiangzi Li, and Seongho Choi. 2025. "FASN, SCD, and PLAG1 Gene Polymorphism and Association with Carcass Traits and Fatty Acid Profile in Hanwoo Cattle" Animals 15, no. 6: 897. https://doi.org/10.3390/ani15060897
APA StyleYu, J., Naseem, S., Park, S., Hur, S., Choi, Y., Lee, T., Li, X., & Choi, S. (2025). FASN, SCD, and PLAG1 Gene Polymorphism and Association with Carcass Traits and Fatty Acid Profile in Hanwoo Cattle. Animals, 15(6), 897. https://doi.org/10.3390/ani15060897