
The Spatio-Temporal Distribution and Population Dynamics of Chub Mackerel (Scomber japonicus) in the High Seas of the Northwest Pacific Ocean


Simple Summary
Abstract
1. Introduction
2. Materials and Methods
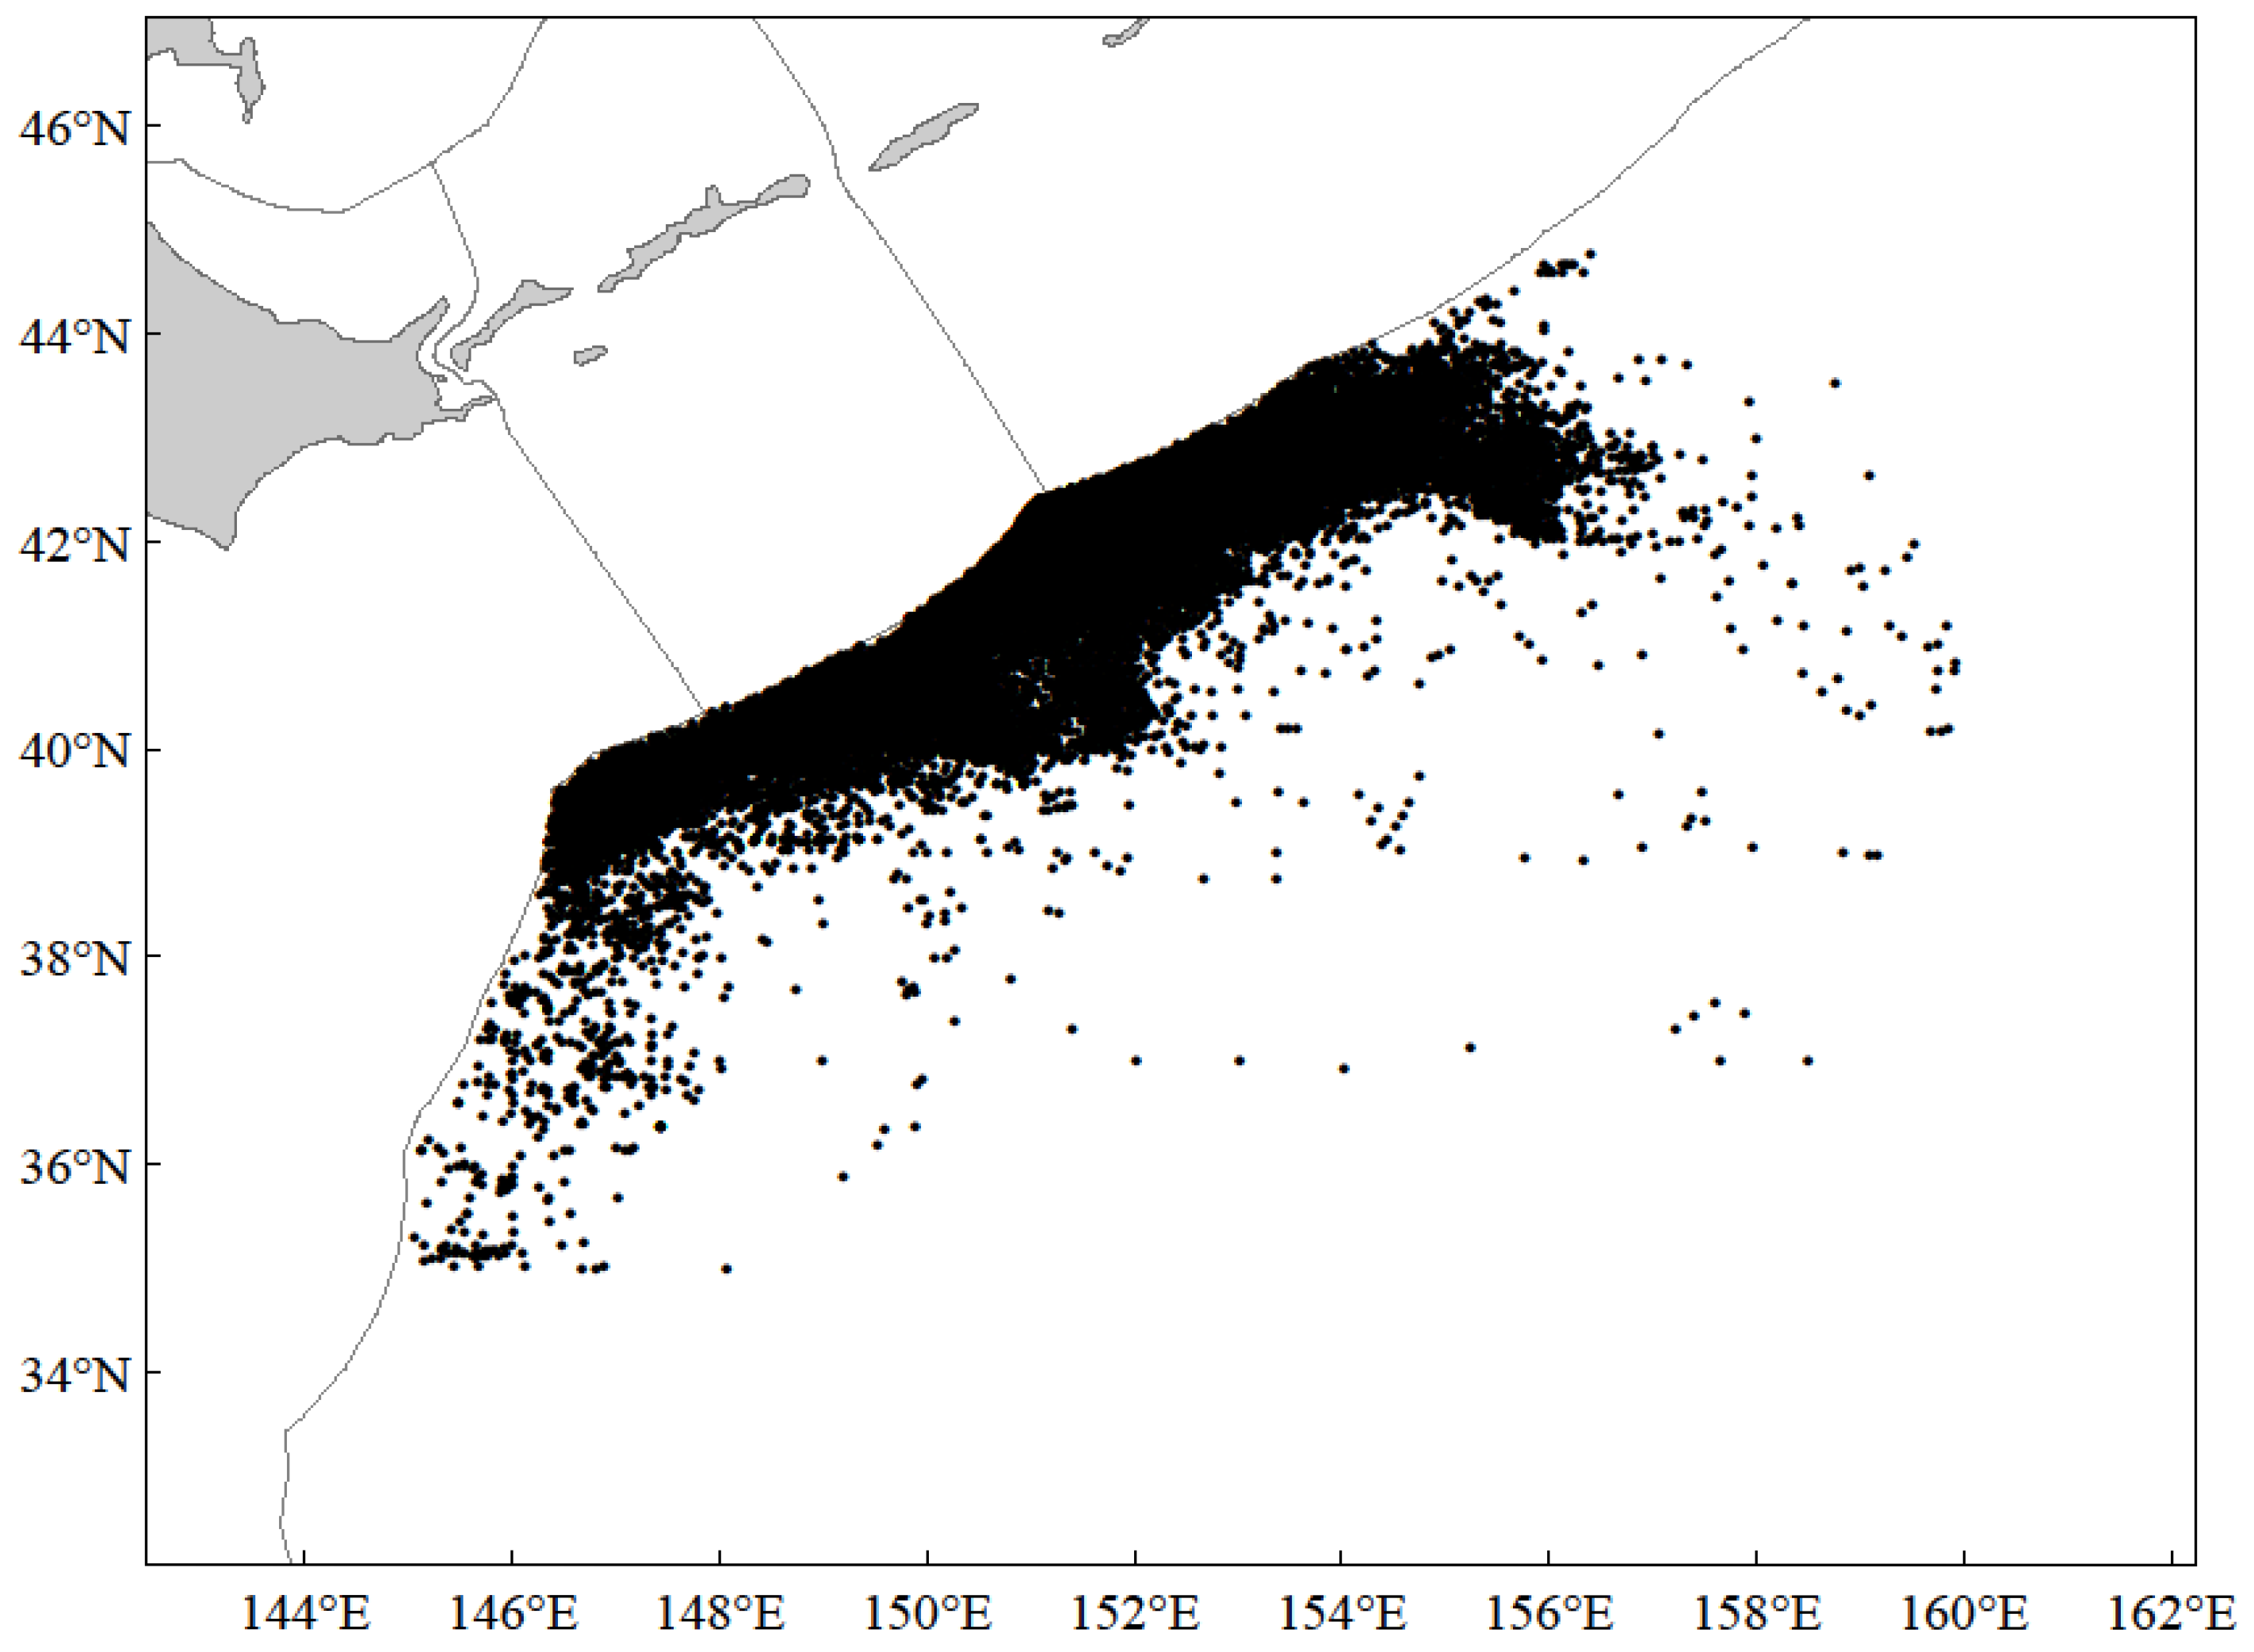
2.1. Study Area and Data Resources
2.2. Data Analysis
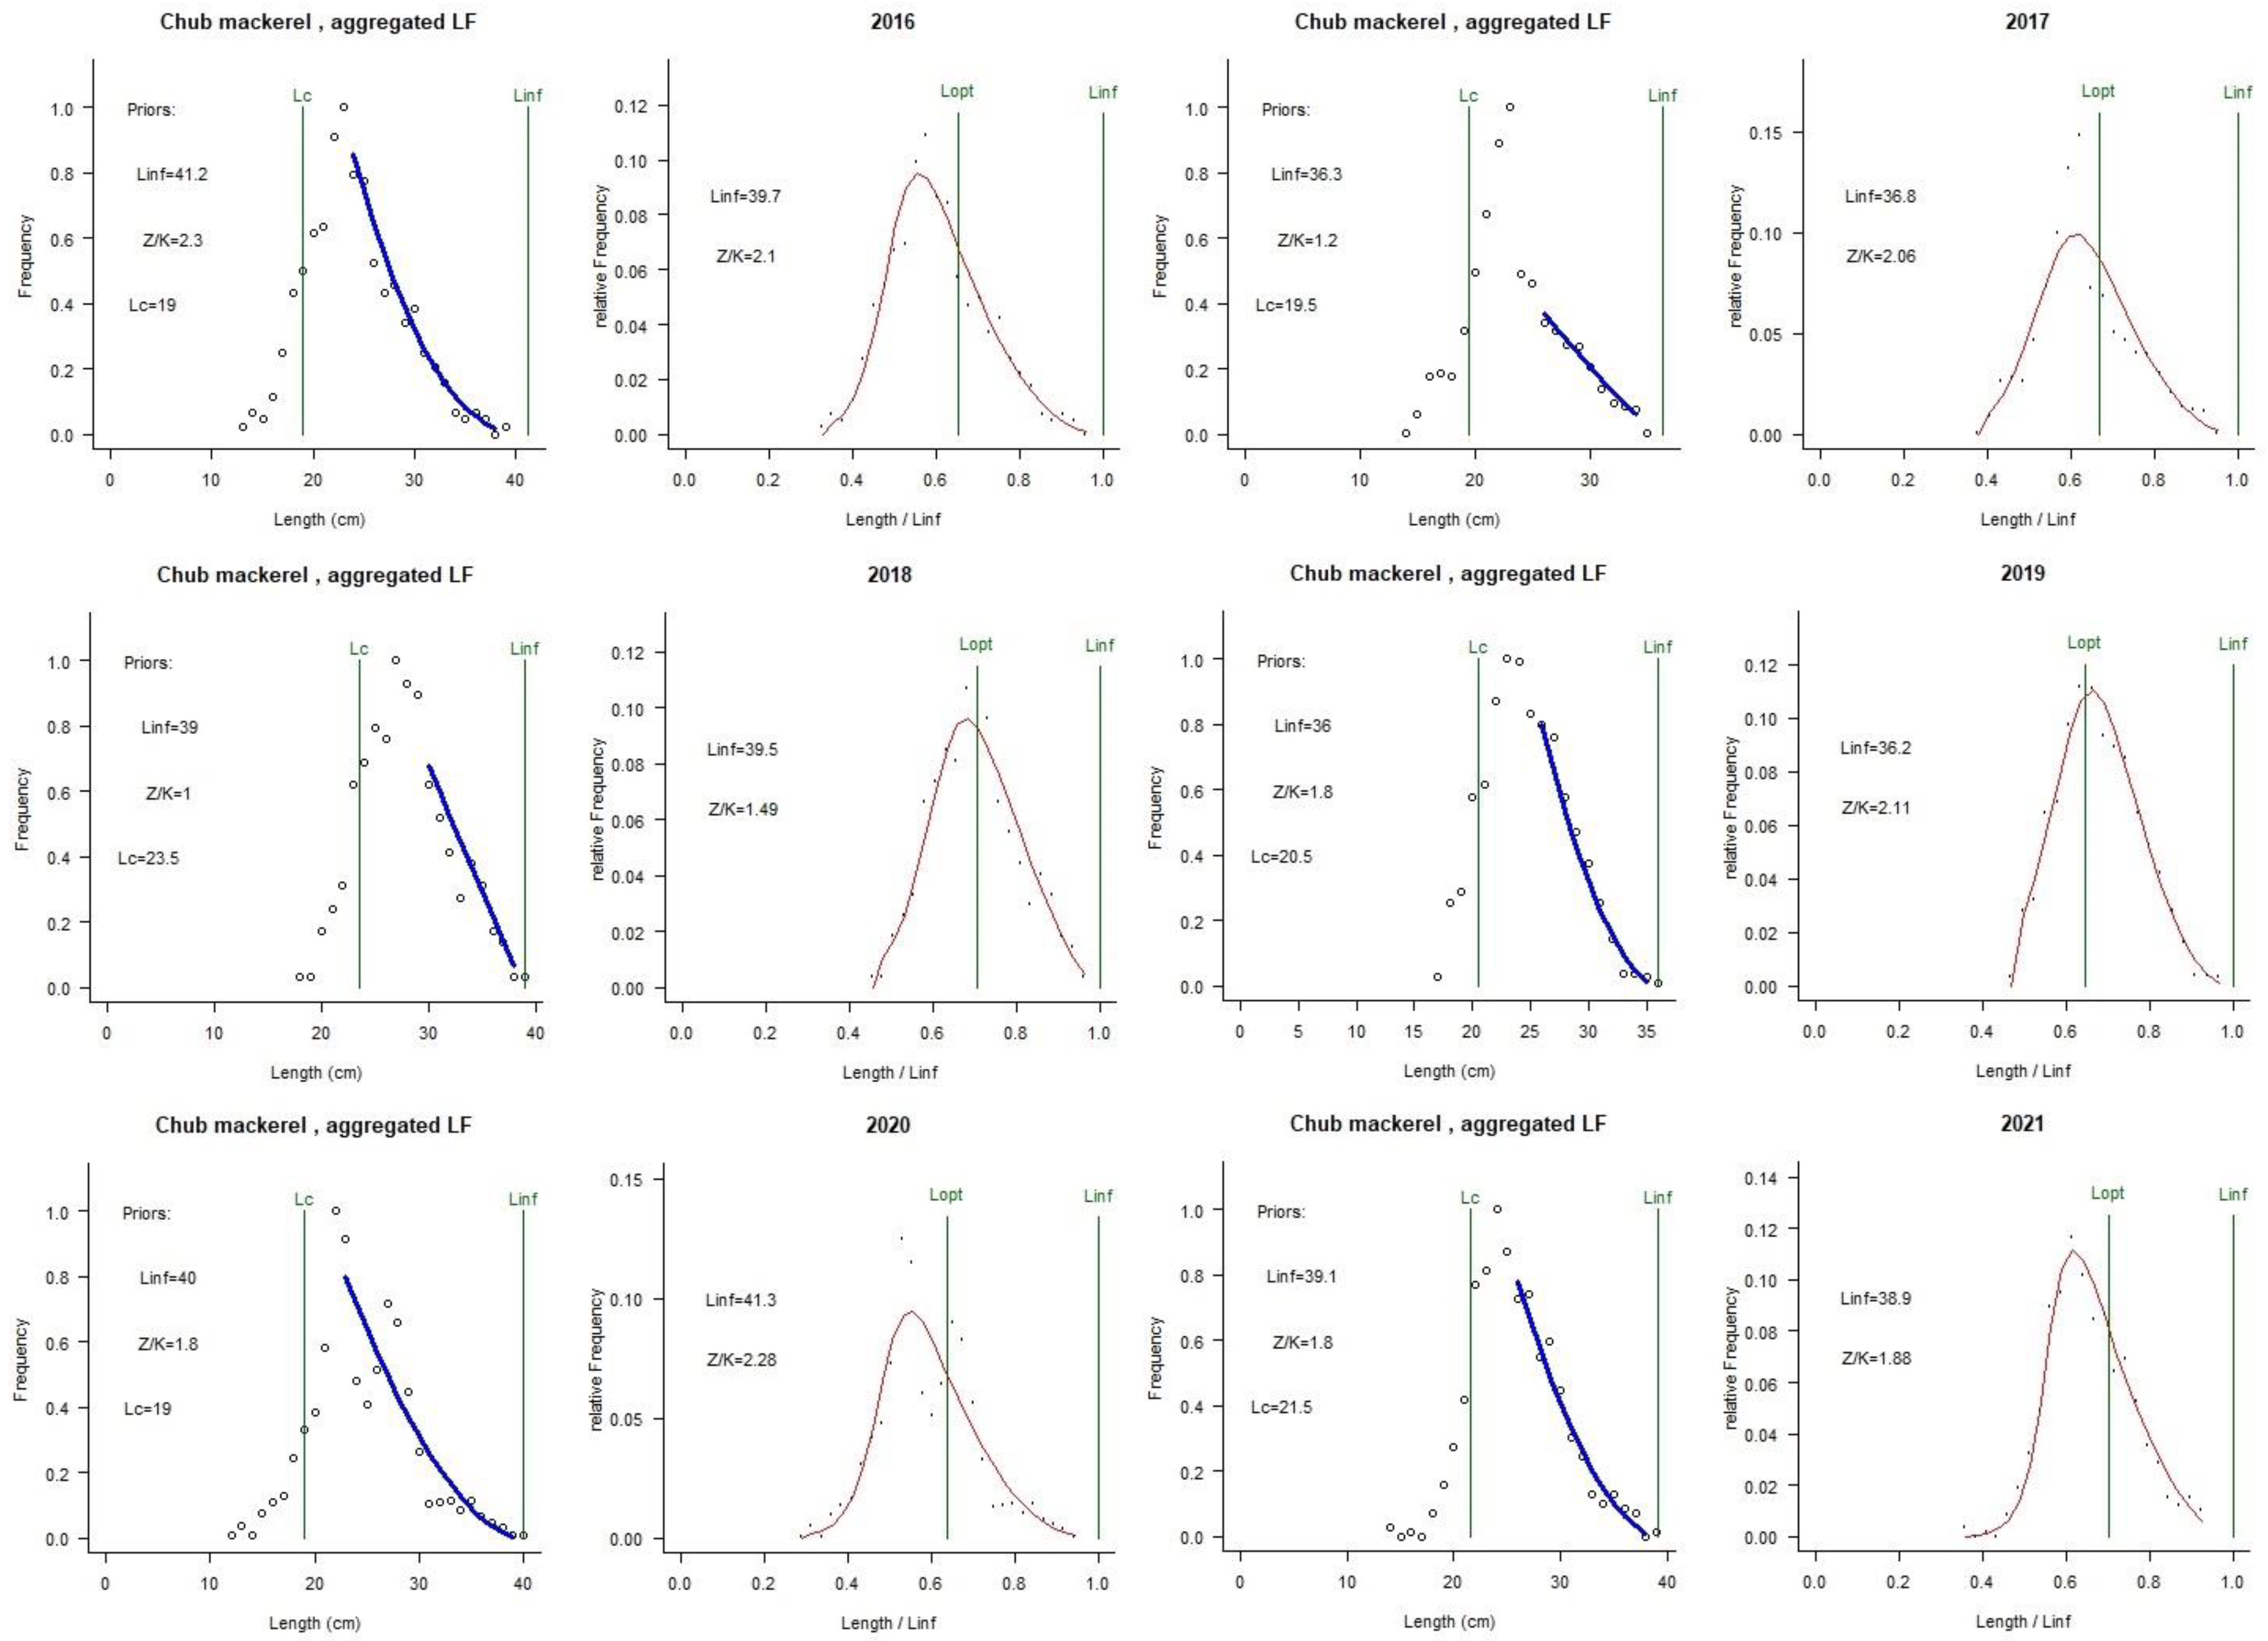
2.3. LBB Modeling
3. Results
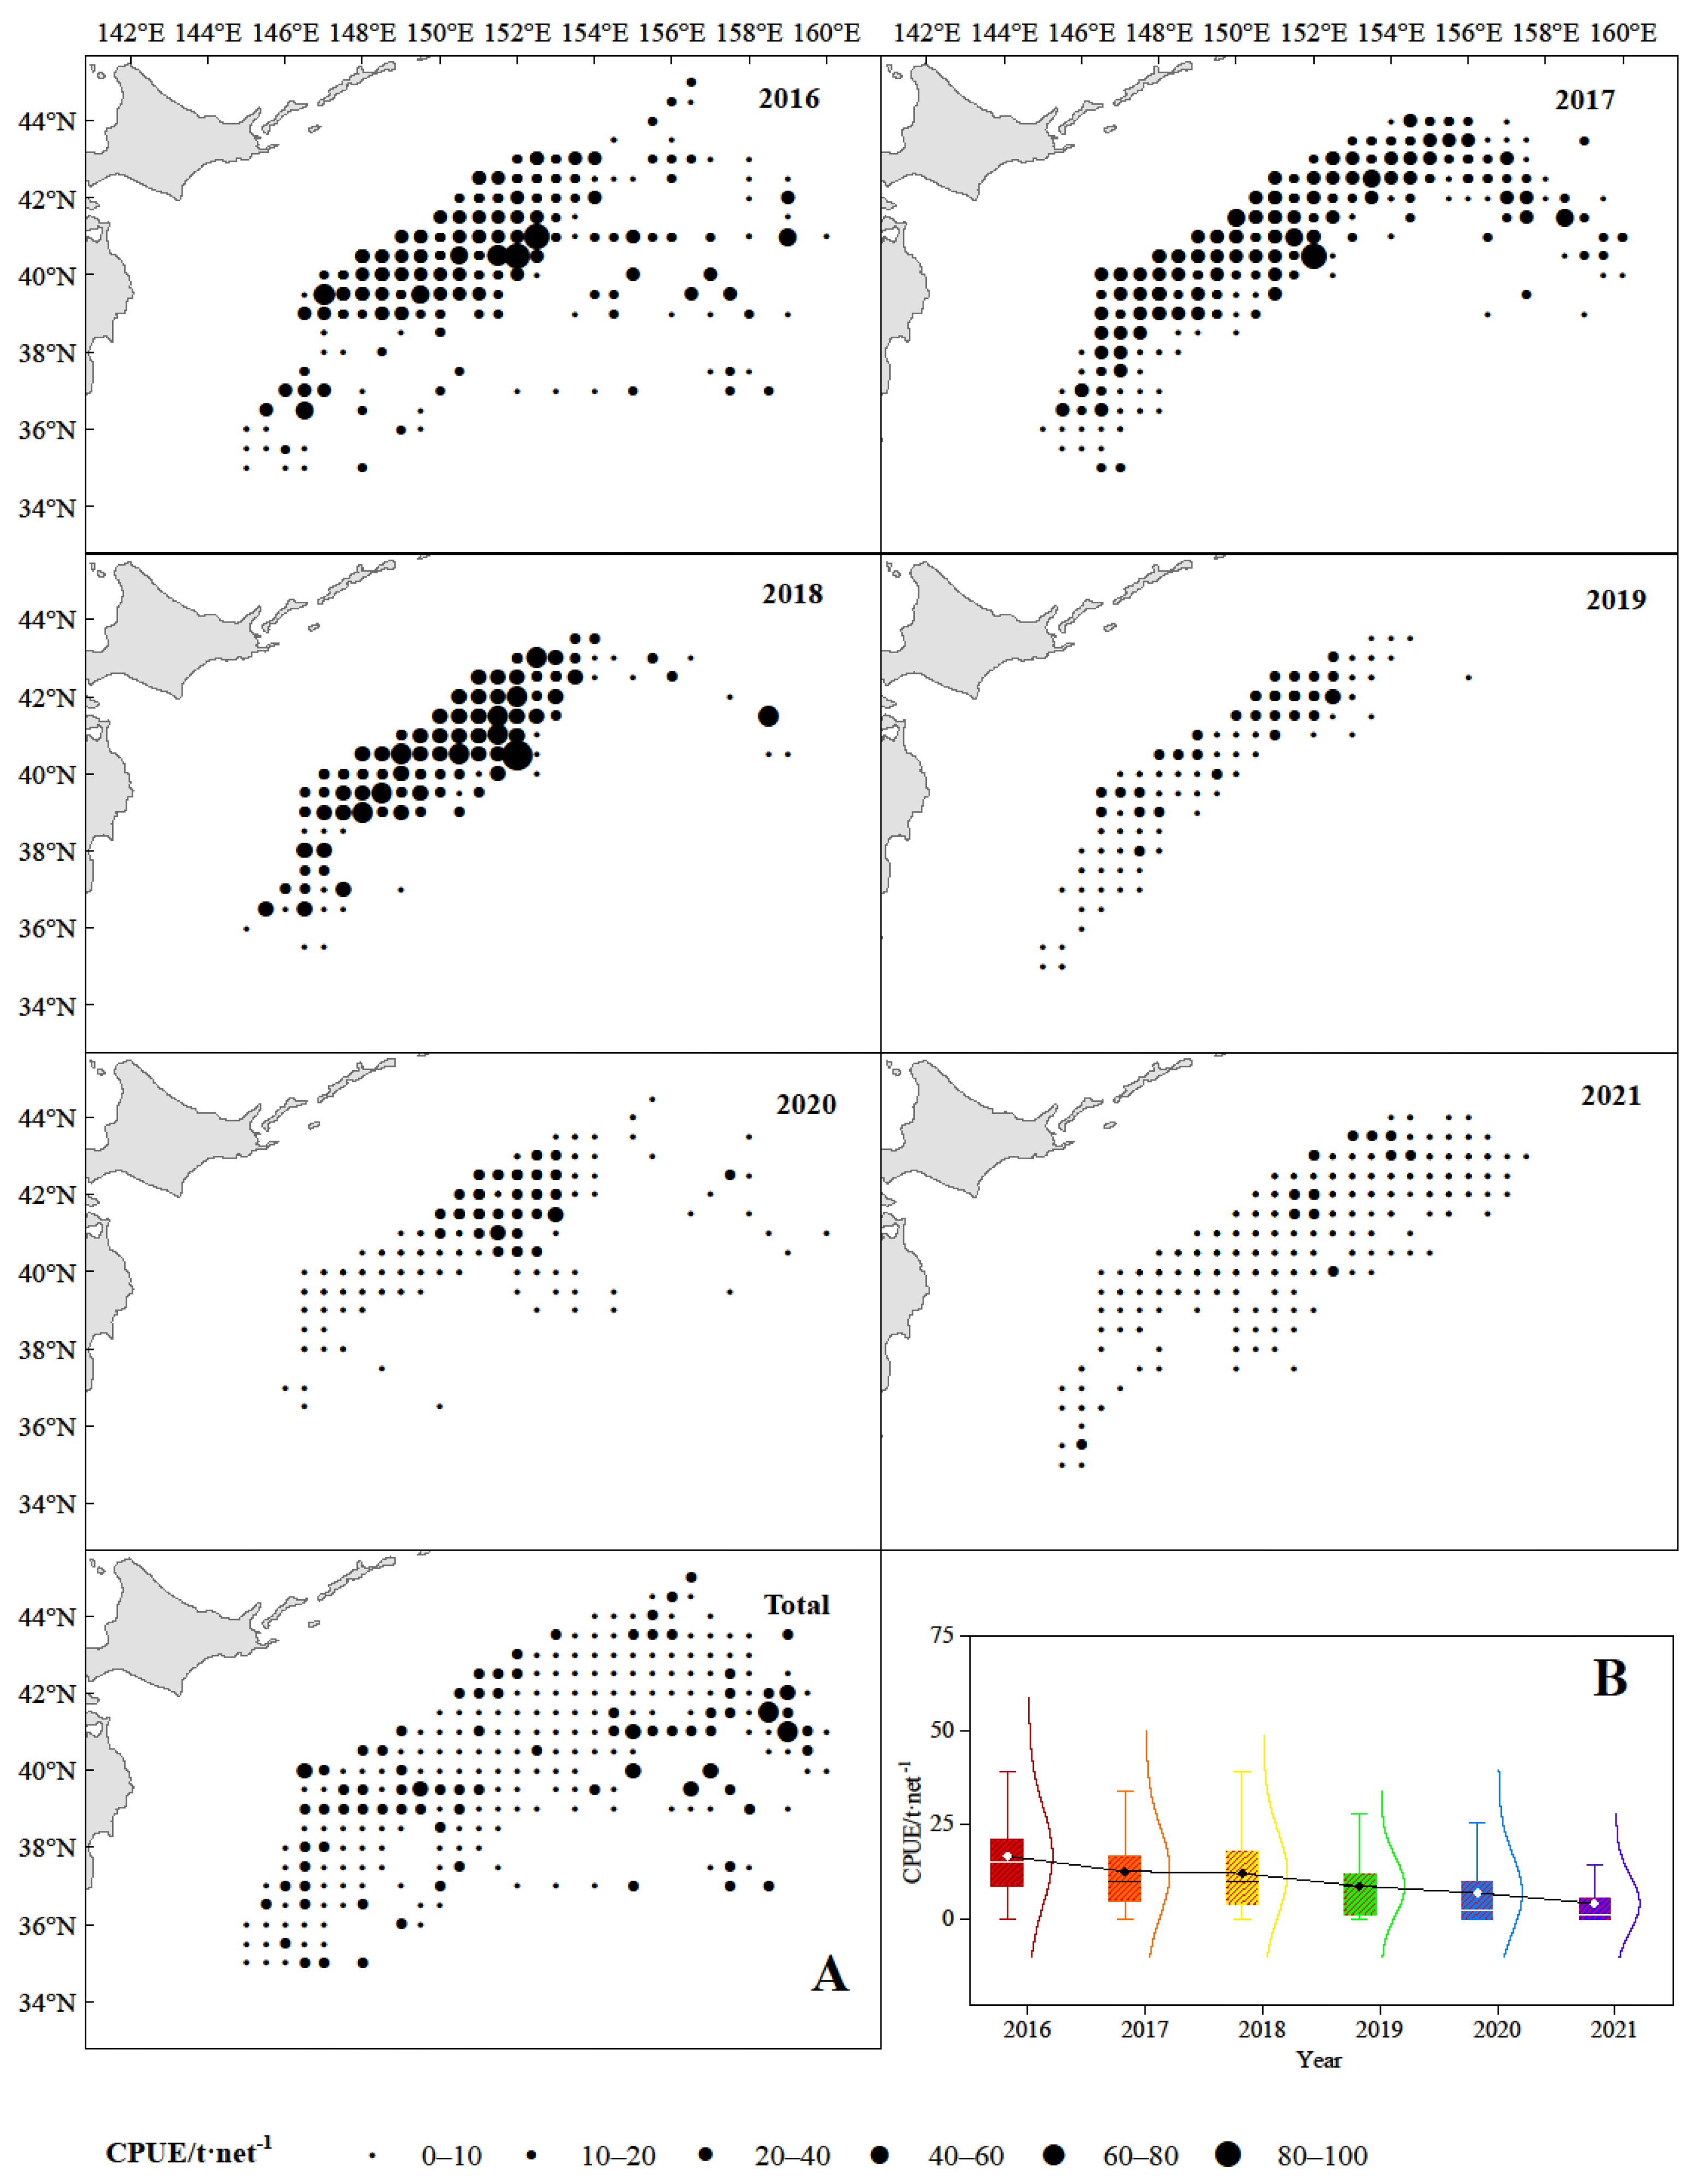
3.1. The Spatio-Temporal Distribution of Catches and CPUE of Chub Mackerel
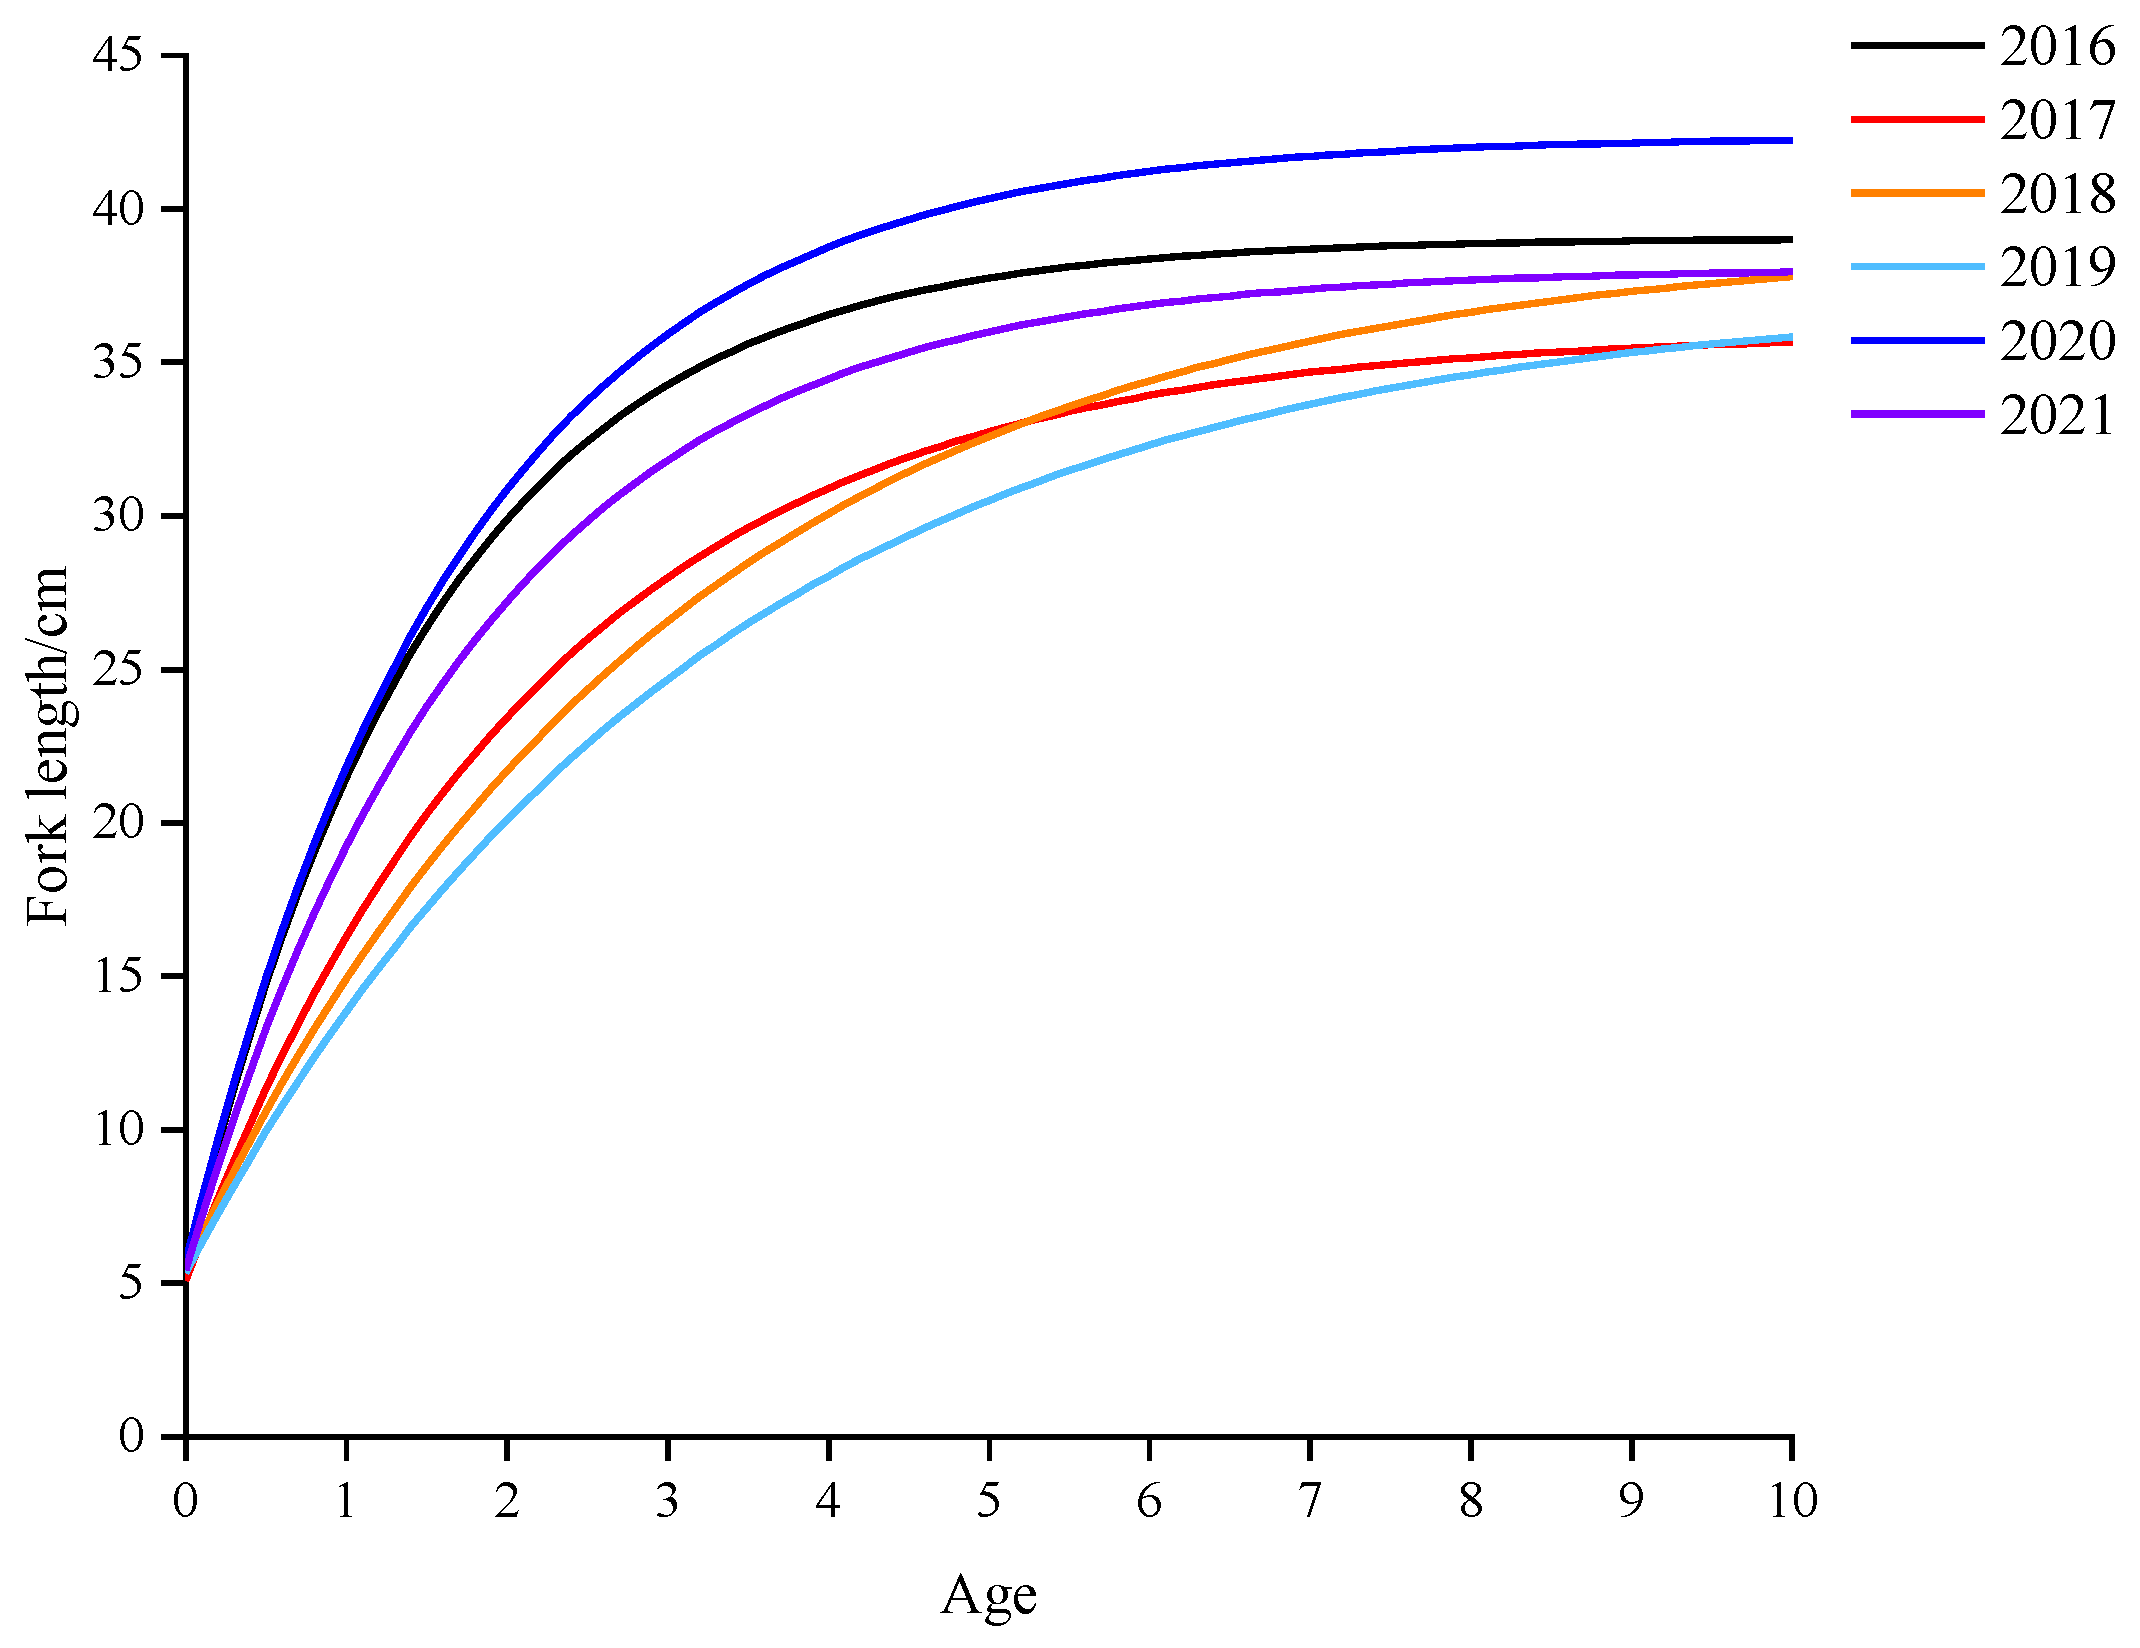
3.2. Variations in Population Parameters
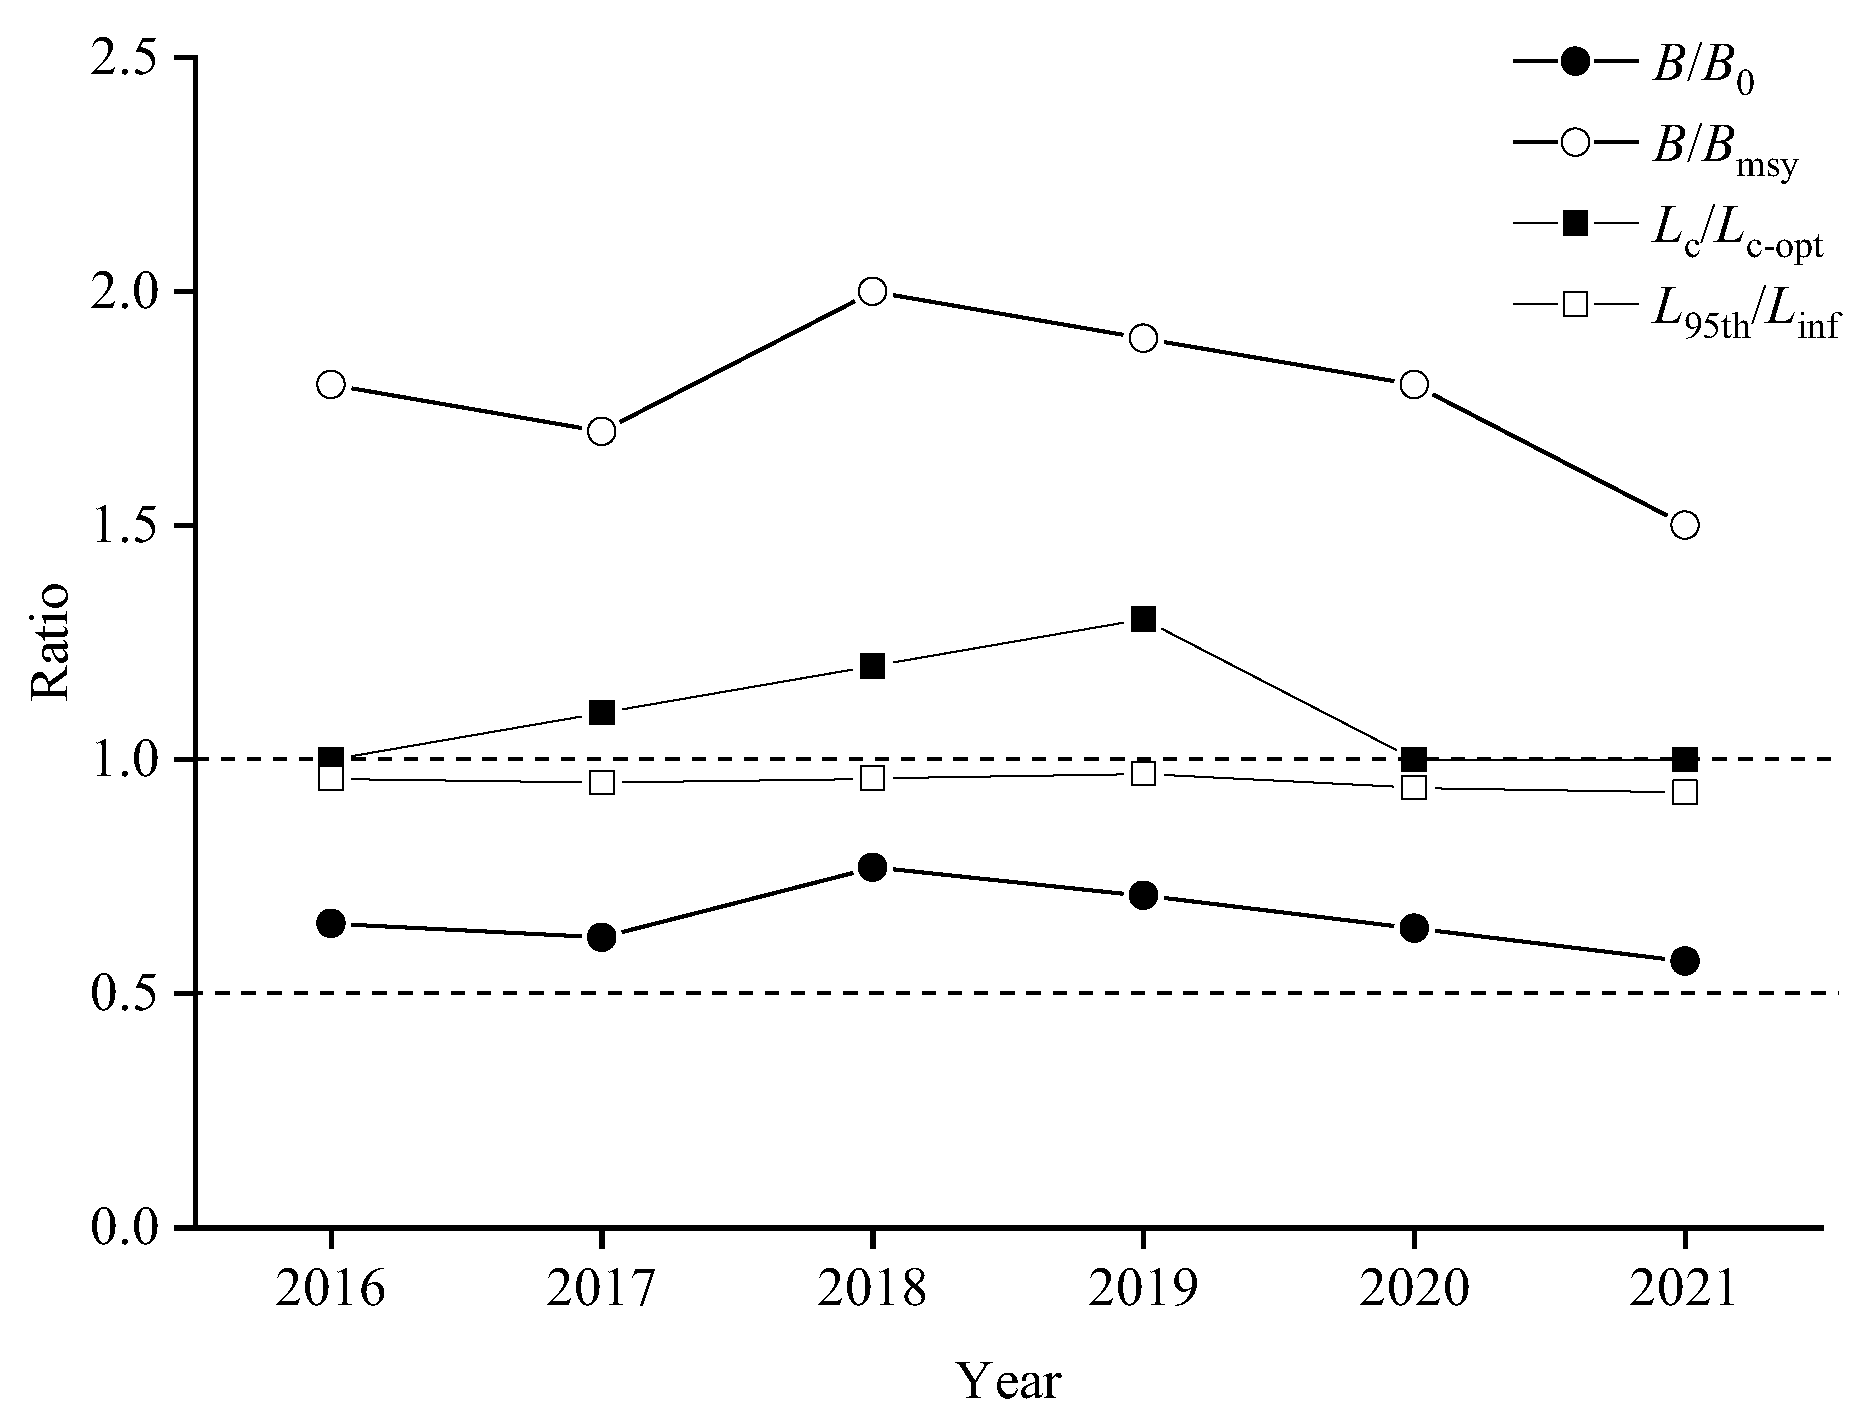
3.3. Exploitation Status of Chub Mackerel
4. Discussion
4.1. Analysis of Spatio-Temporal Distribution of Catches and CPUE
4.2. Analysis of Gravity Center of Fishing Grounds
4.3. Stock Assessment Analysis
5. Conclusions
Author Contributions
Funding
Institutional Review Board Statement
Informed Consent Statement
Data Availability Statement
Conflicts of Interest
References
- Yatsu, A.; Watanabe, T.; Ishida, M.; Sugisaki, H.; Jacobson, L.D. Environmental effects on recruitment and productivity of Japanese sardine Sardinops melanostictus and chub mackerel Scomber japonicus with recommendations for management. Fish. Oceanogr. 2005, 14, 263–278. [Google Scholar] [CrossRef]
- Bae, J.H.; Lim, S.Y. Chemical composition, antiproliferative and antioxidant properties of lipid classes in ordinary and dark muscles from chub mackerel (Scomber japonicus). Food Chem. Toxicol. 2012, 50, 823–828. [Google Scholar] [CrossRef] [PubMed]
- Wang, L.; Ma, S.; Liu, Y.; Li, J.; Liu, S.-G.; Lin, L.-S.; Tian, Y.-J. Fluctuations in the abundance of chub mackerel in relation to climatic/oceanic regime shifts in the northwest Pacific Ocean since the 1970s. J. Mar. Syst. 2021, 218, 103541. [Google Scholar] [CrossRef]
- Yukami, R.; Ohshimo, S.; Yoda, M.; Hiyama, Y. Estimation of the spawning grounds of chub mackerel Scomber japonicus and spotted mackerel Scomber australasicus in the East China Sea based on catch statistics and biometric data. Fish. Sci. 2009, 75, 167–174. [Google Scholar] [CrossRef]
- FAO. FAO Yearbook: Fishery and Aquaculture Statistics, 2019; FAO: Rome, Italy, 2021. [Google Scholar]
- Yakami, R.; Nishijima, S.; Kamimura, Y.; Furuichi, S.; Watanabe, R. Resource Evaluation of the masba Pacific Group in the Year 2020; Fisheries Agency, Fisheries Research and Education Organization: Tokyo, Japan, 2021; Available online: http://abchan.fra.go.jp/ (accessed on 3 May 2023).
- Kawai, H.; Yatsu, A.; Watanabe, C.; Mitani, T.; Katsukawa, T.; Matsuda, H. Recovery policy for chub mackerel stock using recruitmentper-Spawning. Fish. Sci. 2002, 68, 963–971. [Google Scholar] [CrossRef]
- Zhao, G.; Wu, Z.; Cui, X.; Fan, W.; Shi, Y.; Xiao, G.; Tang, F. Spatial temporal patterns of chub mackerel fishing ground in the Northwest Pacific based on spatial autocorrelation model. Haiyang Xuebao 2022, 44, 22–35. [Google Scholar] [CrossRef]
- North Pacific Fisheries Commission [NPFC]. NPFC Yearbook 2017; North Pacific Fisheries Commission: Vancouver, BC, Canada, 2017; p. 385. [Google Scholar]
- Yu, W.; Guo, A.; Zhang, Y.; Chen, X.; Qian, W.; Li, Y. Climate-induced habitat suitability variations of chub mackerel Scomber japonicus in the east china sea. Fish. Res. 2018, 207, 63–73. [Google Scholar] [CrossRef]
- Kang, S.; Lee, J.B.; Hollowed, A.; Bond, A.; Kim, S. The impact of climate changes on the distribution and abundance of mackerels in the Northwestern Pacific. Proc. Korean Soc. Ind. Appl. Math. 2010, 5, 37. [Google Scholar]
- FAO. FAO Yearbook; Fishery and Aquaculture Statistics: Rome, Italy, 2017. [Google Scholar]
- Stephen, K.B.; Manoj, S.; Roberto, F.K.; David, A.; Julia, B.; Martin, C.; Cathy, D.; David, D.; William, M.; Keith, R.; et al. Patterns and practices in fisheries assessment peer review systems. Maine Policy 2020, 117, 1–11. [Google Scholar] [CrossRef]
- Magnusson, A.; Hilborn, R. What makes fisheries data informative? Fish Fish. 2007, 8, 337–358. [Google Scholar] [CrossRef]
- Costello, C.; Ovando, D.; Hilborn, R.; Gaines, S.D.; Deschenes, O.; Lester, S.E. Status and solutions for the world’s unassessed fisheries. Science 2012, 338, 517–520. [Google Scholar] [CrossRef] [PubMed]
- Carruthers, T.R.; Punt, A.E.; Walters, C.J.; Maccall, A.; Mcallister, M.K.; Dick, E.J.; Cope, J. Evaluating methods for setting catch limits in data-limited fisheries. Fish. Res. 2014, 153, 48–68. [Google Scholar] [CrossRef]
- Wang, Y.; Wang, Y.; Liu, S.; Liang, C.; Zhang, H.; Xian, W. Stock Assessment Using LBB Method for Eight Fish Species from the Bohai and Yellow Seas. Front. Mar. Sci. 2020, 7, 164. [Google Scholar] [CrossRef]
- Cadrin, S.X.; Dickey, C.M. Stock assessment methods for sustainable fisheries. ICES J. Mar. Sci. 2014, 72, 1–6. [Google Scholar] [CrossRef]
- Watanabe, C.; Yatsu, A. Effects of density-dependence and sea surface temperature on interannual variation in length-at-age of chub mackerel (Scomber japonicus) in the Kuroshio-Oyashio area during 1970–1997. Fish. Bull. 2004, 102, 196–206. [Google Scholar] [CrossRef]
- Shi, Y.; Zhang, X.; He, Y.; Fan, W.; Tang, F. Stock Assessment Using Length-Based Bayesian Evaluation Method for Three Small Pelagic Species in the Northwest Pacific Ocean. Front. Mar. Sci. 2022, 9, 775180. [Google Scholar] [CrossRef]
- Wu, S.; Chen, X.; Liu, Z. Establishment of forecasting model of the abundance index for chub mackerel (Scomber japonicus) in the northwest Pacific Ocean based on GAM. Haiyang Xuebao 2019, 41, 36–42. [Google Scholar] [CrossRef]
- Pope, J.G. An investigation of the accuracy of virtual population analysis using cohort analysis. Int. Comm. Northwest Alt. Fish. Res. Bull. 1972, 9, 65–74. [Google Scholar]
- Walters, C.J.; Maguire, J.J. Lessons for stock assessment from the northern cod collapse. Rev. Fish Biol. Fish. 1996, 6, 125–137. [Google Scholar] [CrossRef]
- MacCall, A.D. Depletion-corrected average catch: A simple formula for estimating sustainable yields in data-poor situations. ICES J. Mar. Sci. 2009, 66, 2267–2271. [Google Scholar] [CrossRef]
- Dick, E.J.; MacCall, A.D. Depletion-based stock reduction analysis: A catch-based method for determining sustainable yields for data-poor fish stocks. Fish. Res. 2011, 110, 331–341. [Google Scholar] [CrossRef]
- Martell, S.; Froese, R. A simple method for estimating MSY from catch and resilience. Fish Fish. 2013, 14, 504–514. [Google Scholar] [CrossRef]
- Hordyk, A.; Ono, K.; Valencia, S.R.; Loneragan, N.; Prince, J. A novel length-based empirical estimation method of spawning potential ratio (SPR), and tests of its performance, for small-scale, data-poor fisheries. ICES J. Mar. Sci. 2015, 72, 217–231. [Google Scholar] [CrossRef]
- Froese, R.; Winker, H.; Coro, G.; Demirel, N.; Tsikliras, A.C.; Dimarchopoulou, D.; Scarcella, G.; Probst, W.N.; Dureuil, M.; Pauly, D. A new approach for estimating stock status from length frequency data. ICES J. Mar. Sci. 2018, 75, 2004–2015. [Google Scholar] [CrossRef]
- Rudd, M.B.; Thorson, J.T. Accounting for variable recruitment and fishing mortality in length-based stock assessments for data-limited fisheries. Can. J. Fish. Aquat. Sci. 2018, 75, 1019–1035. [Google Scholar] [CrossRef]
- Ault, J.S.; Bohnsack, J.A.; Meester, G.A. A retrospective (1979-1996) multispecies assessment of coral reef fish stocks in the florida keys. Fish. B-NOAA 1998, 96, 395–414. [Google Scholar]
- Wang, X.; Qiu, Y.; Du, F.; Lin, Z.; Sun, D.; Huang, S. Population parameters and dynamic pool models of commercial fishes in the Beibu Gulf, northern South China Sea. Chin. J. Ocean. Limnol. 2012, 30, 105–117. [Google Scholar] [CrossRef]
- Thorson, J.T.; Minto, C.; Minte-Vera, C.V.; Kleisner, K.M.; Longo, C. A new role for effort dynamics in the theory of harvested populations and data-poor stock assessment. Can. J. Fish. Aquat. Sci. 2013, 70, 1829–1844. [Google Scholar] [CrossRef]
- Free, C.M.; Jensen, O.P.; Wiedenmann, J.; Deroba, J.J. The refined ORCS approach: A catch-based method for estimating stock status and catch limits for data-poor fish stocks. Fish. Res. 2017, 193, 60–70. [Google Scholar] [CrossRef]
- Froese, R.; Demirel, N.; Coro, G.; Kleisner, K.M.; Winker, H. Estimating fisheries reference points from catch and resilience. Fish Fish. 2017, 18, 506–526. [Google Scholar] [CrossRef]
- Zhou, S.; Punt, A.E.; Ye, Y.; Ellis, N.; Dichmont, C.M.; Haddon, M.; Smith, D.C.; Smith, A.D. Estimating stock depletion level from patterns of catch history. Fish Fish. 2017, 18, 742–751. [Google Scholar] [CrossRef]
- Wang, L.; Lin, L.; Li, Y.; Xing, Y.; Kang, B. Sustainable exploitation of dominant fishes in the largest estuary in southeastern china. Water 2020, 12, 3390. [Google Scholar] [CrossRef]
- Richard, K.; Gao, C.; Pandong, N.; Ma, Q.; Tian, S.; Wu, F.; Ousmane, S. Stock status assessments of five small pelagic species in the atlantic and pacific oceans using the length-based bayesian estimation (LBB) method. Front. Mar. Sci. 2020, 7, 1–9. [Google Scholar] [CrossRef]
- Keys, A.B. The weight-length relation in fishes. Proc. Natl. Acad. Sci. USA 1928, 14, 922–925. [Google Scholar] [CrossRef] [PubMed]
- Huang, Z.; Chang, J. Fractal characteristics of length-weight relationship in fish. Acta Hydrobiol. Sinca 1999, 4, 330–336. [Google Scholar] [CrossRef]
- Hile, R. Age and growth of the cisco, Leucichthys ardeti (Le Sueur), in the lakes of the North-Eastern Highlands. Bull. Bureau. Fish. 1936, 48, 211–317. [Google Scholar]
- Blackwell, B.G.; Brown, M.L.; Willis, D.W. Relative Weight (Wr) Status and Current Use in Fisheries Assessment and Management. Rev. Fish Sci. 2000, 8, 1–44. [Google Scholar] [CrossRef]
- Bertalanffy, L.V. A quantitative theory of organic growth (inquiries on growth laws II). Hum. Biol. 1938, 10, 181–213. [Google Scholar]
- Pauly, D. Theory and management of tropical multispecies stocks: A review, with emphasis on the Southeast Asian demersal fisheries. ICLARM Stud. Rev. 1979, 1, 1–35. [Google Scholar]
- Pauly, D.; Munro, J.L. Once more on the comparison of growth in fish and invertebrates. Fishbyte 1984, 2, 21. [Google Scholar]
- Pauly, D. Some Simple Methods for the Assessment of Tropical Fish Stocks; FAO Fisheries Technical Paper, No. 234; FAO: Rome, Italy, 1983. [Google Scholar]
- R Core Team. R: A Language and Environment for Statistical Computing; R Foundation for Statistical Computing: Vienna, Austria, 2020. [Google Scholar]
- Holt, S.J. The evaluation of fisheries resources by the dynamic analysis of stocks, and notes on the time factors involved. In International Commission for the Northwest Atlantic Fisheries; ICNAF Special Publication: Vancouver, BC, USA, 1958; pp. 77–95. [Google Scholar]
- Froese, R.; Winker, H.; Gascuel, D.; Sumaila, U.R.; Pauly, D. Minimizing the impact offishing. Fish Fish. 2016, 17, 785–802. [Google Scholar] [CrossRef]
- Beverton, R.J.H.; Holt, S.J. Manual of methods for fish stock assessment—Part 2—Tables of yield functions. In FAO Fisheries Technical Papers; FAO: Rome, Italy, 1966; Volume 38, pp. 1–67. [Google Scholar]
- Zhao, G.; Shi, Y.; Fan, W.; Cui, X.; Tang, F. Study on main catch composition and fishing ground change of light purse seine in Northwest Pacific. South China Fish. Sci. 2022, 18, 33–42. [Google Scholar] [CrossRef]
- Suda, M.; Watanabe, C.; Akamine, T. Two-species population dynamics model for Japanese sardine Sardinops melanostictus and chub mackerel Scomber japonicus off the Pacific coast of Japan. Fish. Res. 2008, 94, 18–25. [Google Scholar] [CrossRef]
- Hashimoto, M.; Nishijima, S.; Yukami, R.; Watanabe, C.; Kamimura, Y.; Furuichi, S.; Ichinokawa, M.; Okamura, H. Spatiotemporal dynamics of the Pacific chub mackerel revealed by standardized abundance indices. Fish. Res. 2019, 219, 105315. [Google Scholar] [CrossRef]
- Sun, Y.; Zhang, H.; Jiang, K.; Xiang, D.; Shi, Y.; Huang, S.; Li, Y.; Han, H. Simulating the changes of the habitats suitability of chub mackerel (Scomber japonicus) in the high seas of the North Pacific Ocean using ensemble models under medium to long-term future climate scenarios. Mar. Pollut. Bull. 2024, 207, 116873. [Google Scholar] [CrossRef]
- Tang, F.; Dai, S.; Fan, W.; Cui, X.; Zhang, H. Study on stomach composition and feeding level of chub mackerel in the Northwest Pacific. J. Agric. Sci. Technol. 2019, 22, 138–148. [Google Scholar] [CrossRef]
- Dai, S.; Tang, F.; Fan, W.; Zhang, H.; Cui, X.; Guo, G. Distribution of resource and environment characteristics of fishing ground of Scomber japonicas in the North Pacific high seas. Mar. Fish. 2017, 39, 372–382. [Google Scholar] [CrossRef]
- Xu, B.; Zhang, H.; Tang, F.; Sui, X.; Zhang, Y.; Hou, G. Relationship between center of gravity and environmental factors of main catches of purse seine fisheries in North Pacific high seas based on GAM. South China Fish. Sci. 2020, 16, 60–70. [Google Scholar] [CrossRef]
- Han, H.; Yang, C.; Jiang, B.; Shang, C.; Sun, Y.; Zhao, X.; Xiang, D.; Zhang, H.; Shi, Y. Construction of chub mackerel (Scomber japonicus) fishing ground prediction model in the northwestern Pacific Ocean based on deep learning and marine environmental variables. Mar. Pollut. Bulletion. 2023, 193, 115158. [Google Scholar] [CrossRef]
- Shi, J.; Qian, W.G.; Yang, L.M. The theoretical study on suitable spacing between of light purse seine vessels for chub mackerel (Scomber japonicus). South China Fish. Sci. 2013, 9, 82–86. [Google Scholar] [CrossRef]
- Kamimura, Y.; Taga, M.; Yukami, R.; Watanabe, C.; Furuichi, S. Intra-and inter-specific density dependence of body condition, growth, and habitat temperature in chub mackerel (Scomber japonicus). ICES J. Mar. Sci. 2021, 78, 3254–3264. [Google Scholar] [CrossRef]
- Cheung, W.W.L.; Watson, R.; Pauly, D. Signature of ocean warming in global fisheries catch. Nature 2013, 497, 365–368. [Google Scholar] [CrossRef] [PubMed]
- Chen, X.; Li, G.; Feng, B.; Tian, S. Habitat suitability index of chub mackerel (Scomber japonicus) from July to September in the East China Sea. J. Oceanogr. 2009, 65, 93–102. [Google Scholar] [CrossRef]
- Peck, M.A.; Reglero, P.; Takahashi, M.; Catalán, I.A. Life Cycle Ecophysiology of Small Pelagic Fish and Climate-Driven Changes in Populations. Prog. Oceanogr. 2013, 116, 220–245. [Google Scholar] [CrossRef]
- Pinsky, M.L.; Selden, R.L.; Kitchel, Z.J. Climate-Driven Shifts in Marine Species Ranges: Scaling from Organisms to Communities. Annu. Rev. Mar. Sci. 2020, 12, 153–179. [Google Scholar] [CrossRef]
- Dulvy, N.K.; Rogers, S.I.; Jennings, S.; Stelzenmüller, V.; Dye, S.R.; Skjoldal, H.R. Climate Change and Deepening of the North Sea Fish Assemblage: A Biotic Indicator of Warming Seas. J. Appl. Ecol. 2008, 45, 1029–1039. [Google Scholar] [CrossRef]
- Werb, B.E.; Rudnick, D.L. Remarkable Changes in the Dominant Modes of North Pacific Sea Surface Temperature. Geophys. Res. Lett. 2023, 50, e2022GL101078. [Google Scholar] [CrossRef]
- Longo, G.C.; Minich, J.J.; Allsing, N.; James, K.; Adams-Herrmann, E.S.; Larson, W.; Hartwick, N.; Duong, T.; Muhling, B.; Michael, T.P.; et al. Crossing the Pacific: Genomics Reveals the Presence of Japanese Sardine (Sardinops melanosticta) in the California Current Large Marine Ecosystem. Mol. Ecol. 2024, 33, e17561. [Google Scholar] [CrossRef]
- Wang, L.; Li, Y.; Zhang, R.; Tian, Y.; Zhang, J.; Lin, L. Relationship between the resource distribution of Scomber japonicus and seawater temperature vertical of Northwestern Pacific Ocean. Period. Ocean Univ. China 2019, 49, 29–38. [Google Scholar] [CrossRef]
- Zhuang, Z.; Ma, C.; Liu, Y.; Xu, C.; Cai, J.; Shen, C. A Preliminary Study on Biological Characteristics of Scomber japonicus in the North Pacific Ocean in Autumn. Trans. Oceanol. Limnol. 2018, 6, 125–131. [Google Scholar] [CrossRef]
- Guan, W.; Tian, S.; Zhu, J.; Chen, X. A review of fisheries stock assessment models. J. Fish. Sci. China 2013, 20, 1112–1120. [Google Scholar] [CrossRef]
- Wang, J.; Yu, W.; Chen, X.; Chen, Y. Stock assessment for the western winter-spring cohort of neon flying squid (Ommastrephes bartramii) using environmentally dependent surplus production models. Sci. Mar. 2016, 80, 69–78. [Google Scholar] [CrossRef]
- Geng, Z.; Wang, Y.; Richard, K.; Zhu, J.; Dai, X. Demographic and harvest analysis for blue shark (Prionace glauca) in the Indian Ocean. Reg. Stud. Mar. Sci. 2021, 41, 101453. [Google Scholar] [CrossRef]
- Ye, X.; Zhao, X.; Ren, L.; Ren, K.; Xu, D. Assessment of the stock status of Hemiculter bleekeri in the Zhushan Lake based on the ELEFAN I and LBB methods. J. Fish. Sci. China 2021, 28, 751–761. [Google Scholar] [CrossRef]
- Hordyk, A.R.; Prince, J.D.; Carruthers, T.R.; Walters, C.J. Comment on ‘a new approach for estimating stock status from length frequency data’ by Froese et al. ICES J. Mar. Sci. 2018, 76, 457–460. [Google Scholar] [CrossRef]
- Froese, R.; Winker, H.; Coro, G.; Demirel, N.; Tsikliras, A.C.; Dimarchopoulou, D.; Scarcella, G.; Probst, W.N.; Dureuil, M.; Pauly, D. On the pile-up effect and priors for Linf and M/K: Response to a comment by hordyk et al. on “A new approach for estimating stock status from length-frequency data”. ICES J. Mar. Sci. 2019, 76, 461–465. [Google Scholar] [CrossRef]
- Zhang, K.; Zhang, J.; Shi, D.; Chen, Z. Assessment of coral reef fish stocks from the nansha islands, south china sea, using length-based bayesian biomass estimation. Front. Mar. Sci. 2021, 7, 610707. [Google Scholar] [CrossRef]
- Maunder, M.N.; Punt, A.E. A review of integrated analysis in fisheries stock assessment. Fish. Res. 2013, 142, 61–74. [Google Scholar] [CrossRef]


| Year | Numbers | Sex Ratio (♀/♂) | Length Range/mm | Mean Length/mm |
|---|---|---|---|---|
| 2016 | 315 | 1.56 | 129~389 | 212.07 |
| 2017 | 934 | 1.09 | 130~345 | 223.15 |
| 2018 | 294 | 1.43 | 175~388 | 268.28 |
| 2019 | 868 | 1.38 | 165~358 | 240.18 |
| 2020 | 1234 | 1.61 | 110~400 | 237.08 |
| 2021 | 795 | 2.55 | 102~385 | 246.17 |
| Year | Class Bin (mm) | Linf prior | Z/K prior | M/K prior | F/K prior | Lc prior | Alpha prior |
|---|---|---|---|---|---|---|---|
| 2016 | 10 | 41.2 | 2.29 | 1.5 | 0.78 | 19.4 | 29.9 |
| 2017 | 10 | 36.3 | 1.22 | 1.5 | 0.3 | 19.9 | 17.9 |
| 2018 | 10 | 39 | 1.03 | 1.5 | 0.3 | 24 | 19.6 |
| 2019 | 10 | 36 | 1.77 | 1.5 | 0.27 | 20.9 | 19.7 |
| 2020 | 10 | 40 | 1.76 | 1.5 | 0.26 | 19.4 | 29.5 |
| 2021 | 10 | 39.1 | 1.78 | 1.5 | 0.28 | 21.9 | 28.7 |
| Year | 2016 | 2017 | 2018 | 2019 | 2020 | 2021 |
|---|---|---|---|---|---|---|
| a | 5.67 × 10⁻⁷ | 1.02 × 10⁻⁷ | 1.62 × 10⁻⁷ | 1.12 × 10⁻⁷ | 8.43 × 10⁻⁷ | 3.65 × 10⁻⁵ |
| b | 3.53 | 3.43 | 3.75 | 3.39 | 3.46 | 2.78 |
| Linf | 39.05 | 36.02 | 39.01 | 36.30 | 42.35 | 38.08 |
| K | 0.65 | 0.75 | 0.88 | 0.42 | 0.58 | 0.55 |
| t0 | −0.23 | −0.15 | −0.17 | −0.37 | −0.25 | −0.28 |
| ϕ′ | 2.99 | 2.98 | 2.70 | 2.74 | 2.99 | 2.90 |
| Z | 1.01 | 1.80 | 1.81 | 1.25 | 1.25 | 1.64 |
| M | 0.78 | 1.15 | 1.24 | 0.78 | 0.71 | 0.85 |
| F | 0.23 | 0.65 | 0.57 | 0.47 | 0.55 | 0.79 |
| E | 0.23 | 0.36 | 0.31 | 0.37 | 0.44 | 0.48 |
| Year | 2016 | 2017 | 2018 | 2019 | 2020 | 2021 |
|---|---|---|---|---|---|---|
| Linf | 39.7 | 36.8 | 39.5 | 36.2 | 41.3 | 38.9 |
| Lopt | 26 | 25 | 28 | 23 | 26 | 27 |
| Lc-opt | 19 | 19 | 20 | 17 | 20 | 21 |
| M/K | 1.58 | 1.48 | 1.24 | 1.64 | 1.71 | 1.27 |
| F/K | 0.52 | 0.58 | 0.26 | 0.47 | 0.57 | 0.61 |
| Z/K | 2.1 | 2.06 | 1.5 | 2.1 | 2.32 | 1.89 |
| F/M | 0.33 | 0.39 | 0.21 | 0.29 | 0.34 | 0.46 |
| E | 0.24 | 0.26 | 0.17 | 0.22 | 0.25 | 0.32 |
| B/B0 | 0.65 | 0.62 | 0.77 | 0.71 | 0.64 | 0.57 |
| B/Bmsy | 1.8 | 1.7 | 2 | 1.9 | 1.8 | 1.5 |
| Lc | 19.8 | 20.5 | 24.4 | 22.4 | 20.4 | 22 |
| Lmean/Lc-opt | 0.97 | 1 | 1 | 1.1 | 0.98 | 0.97 |
| Lc/Lc-opt | 1 | 1.1 | 1.2 | 1.3 | 1 | 1 |
| L95th/Linf | 0.96 | 0.95 | 0.96 | 0.97 | 0.94 | 0.93 |
| Status | healthy | healthy | healthy | healthy | healthy | healthy |
Disclaimer/Publisher’s Note: The statements, opinions and data contained in all publications are solely those of the individual author(s) and contributor(s) and not of MDPI and/or the editor(s). MDPI and/or the editor(s) disclaim responsibility for any injury to people or property resulting from any ideas, methods, instructions or products referred to in the content. |
© 2025 by the authors. Licensee MDPI, Basel, Switzerland. This article is an open access article distributed under the terms and conditions of the Creative Commons Attribution (CC BY) license (https://creativecommons.org/licenses/by/4.0/).
Share and Cite
Zhao, G.; Zhang, H.; Tang, F. The Spatio-Temporal Distribution and Population Dynamics of Chub Mackerel (Scomber japonicus) in the High Seas of the Northwest Pacific Ocean. Animals 2025, 15, 1135. https://doi.org/10.3390/ani15081135
Zhao G, Zhang H, Tang F. The Spatio-Temporal Distribution and Population Dynamics of Chub Mackerel (Scomber japonicus) in the High Seas of the Northwest Pacific Ocean. Animals. 2025; 15(8):1135. https://doi.org/10.3390/ani15081135
Chicago/Turabian StyleZhao, Guoqing, Heng Zhang, and Fenghua Tang. 2025. "The Spatio-Temporal Distribution and Population Dynamics of Chub Mackerel (Scomber japonicus) in the High Seas of the Northwest Pacific Ocean" Animals 15, no. 8: 1135. https://doi.org/10.3390/ani15081135
APA StyleZhao, G., Zhang, H., & Tang, F. (2025). The Spatio-Temporal Distribution and Population Dynamics of Chub Mackerel (Scomber japonicus) in the High Seas of the Northwest Pacific Ocean. Animals, 15(8), 1135. https://doi.org/10.3390/ani15081135