Simple Summary
Donkeys have been traditionally attributed the ability to inform humans about the environment. Carefully observing the behavior and cognitive reactions of donkeys in their habitat may enable to quantify such reactions to develop informative mathematical models. These models can be used to explain present environmental situations, trace back past events or even predict future conditions. Our results suggest, environmental stressing situations may affect donkeys in a way that they register the cognitive adaptations or sequels derived from such situations. Furthermore, such environmental events may not only affect the present cognitive status of the animals, but they may drive this cognitive record affecting the behavioral patterns donkeys display through their lives. Our model is able to explain 75.9% of the variability in response type and intensity, mood, or learning capabilities. Conclusively, donkeys can be used as an environment informative sensitive tool and may therefore, predict and register slight human-unappreciable climatic variations to which they may behaviorally adapt beforehand.
Abstract
Donkeys have been reported to be highly sensitive to environmental changes. Their 8900–8400-year-old evolution process made them interact with diverse environmental situations that were very distant from their harsh origins. These changing situations not only affect donkeys’ short-term behavior but may also determine their long-term cognitive skills from birth. Thus, animal behavior becomes a useful tool to obtain past, present or predict information from the environmental situation of a particular area. We performed an operant conditioning test on 300 donkeys to assess their response type, mood, response intensity, and learning capabilities, while we simultaneously registered 14 categorical environmental factors. We quantified the effect power of such environmental factors on donkey behavior and cognition. We used principal component analysis (CATPCA) to reduce the number of factors affecting each behavioral variable and built categorical regression (CATREG) equations to model for the effects of potential factor combinations. Effect power ranged from 7.9% for the birth season on learning (p < 0.05) to 38.8% for birth moon phase on mood (p < 0.001). CATPCA suggests the percentage of variance explained by a four-dimension-model (comprising the dimensions of response type, mood, response intensity and learning capabilities), is 75.9%. CATREG suggests environmental predictors explain 28.8% of the variability of response type, 37.0% of mood, and 37.5% of response intensity, and learning capabilities.
1. Introduction
The hypothetical conditioning effects of weather, moon and climate oscillations on animal behavior and cognition have been widely but unscientifically reported. Popular knowledge has even provided untested testimony of the possibility to predict short-term future meteorological conditions basing on how animals react to the environment around them. This framework has promoted the appearance of the first empirical studies on the clinical and productive implications of such environmental factors in different animal species.
Great scale migration of animal populations, adaptation, or even census reduction or extinction have become proved symptoms of how life cycles may be affected by this progressively changing environmental situation. However, the alteration of the particular environmental characteristics of specific areas has also been suggested to lead the lower scale evolutionary process of local animal life cycles [1].
Research has focused on the study of the climatological alteration of physiological processes such as reproduction, and animal biorhythms in populations of different species [2]. By contrast, cognitive or behavioral alterations affecting animal populations may remain unnoticed due to being attributed to other more probable causes.
The study of the effects of factors such as season and weather on animal behavior and mood has typically focused on understanding the changes in the ethological patterns conditioning animal routine and daily activities. These changes may globally appear as a consequence of the evolution of certain areas, which may no longer fulfil the unique set of requirements of the animal populations inhabiting them [3].
Parallel to these more or less quantifiable effects, there is also a simultaneous repercussion on animal cognitive or behavioral health [4]. These effects may not only alter the components of disorder incidence but may also condition animal physiology, as they increase the levels of sensitivity or even distort the cognitive status of specific populations producing long-lasting consequences.
When we consider these behavioral and cognitive registers under a local specific context, we can trace back their origin up to potential weather or meteorological condition related situation or event [5].
Scientists have paid attention to the study of the environmental changes that may distort seasonal and circadian rhythms in different species. However, the effects of factors such as the moon cycle on animal behavior have only been approached assessing the alterations occurring on daily animal patterns or physiological rhythms [6]. Not to mention the inexistence of research assessing other traditionally folklore-reported environmental effects on cognition, such as the hypersensibility to anticipate particular events. The role on neuroanatomy, ethology, and endocrinology and the activity and effects of neurohormones releasing cycles may be triggered and regulated by the electromagnetic radiation and the gravitational pull of the moon and light cycles during the different moon phases, which may reflect in psychological processes such as mood or cognitive abilities.
The first aim of this research is to study at which level environmental factors such as season, year, moon cycle, meteorological factors, and climate oscillations may affect the response type and intensity, mood and learning abilities of donkeys. Second, we used categorical principal component analyses (CATPCA) to study the possibility to reduce our set of environmental variables to a smaller set that still contains most of the information in the previous one, hence reducing the likelihood of Type I error that can derive when testing for the effects of a large number of explanatory and predictor variables. Third, using this reduced information, we designed regression equations using categorical regression (CATREG) to explain, trace back, and predict the possible behavioral repercussions that certain environmental situations may have, and how these consequences may alter the behavioral patterns that donkeys display through their lives, in order to provide clues on how behavior can become a useful tool for daily care.
2. Materials and Methods
2.1. Animal Sample
Our study sample comprised 78 Andalusian uncastrated jacks and 222 unneutered jennies (n = 300), born from 1990 to 2012 and officially registered in the national studbook of the Andalusian donkey breed. As the age range was not normally distributed (p < 0.05, Kolmogorov–Smirnov test for normality) we used minimum, Q1, median, Q3 and maximum to describe the age range in our sample. Minimum age in the range was 0.27 months, Q1 age was 29.76 months, median age was 77.04 months, Q3 age was 129.07 months, and the maximum age was 270.40 months.
2.2. Information Registration
We registered the information on the response type and response intensity, mood/emotional collateral responses and learning ability from the donkeys in our sample during the development of a six-stage operant conditioning test (Table 1). Reinforcement treatments, stimuli descriptions, their classification, and their constituting elements are provided in Table 1 and Table 2. The same trained judge registered all the information concerning the four behavioral variables and 15 noncognitive factor for all the stages and animals. The donkeys were each given a maximum of 450 s to complete the operant conditioning test (75 s per stage and treatment implemented). No additional time was provided for the donkeys to complete the test. The information registered corresponded to the first immediate reaction described by each animal when each of the stages was started. In 75 s, an animal can shift attention many times. However, to simplify the observations, our study tested for the first reaction of the animals, further reactions shown through the development of the test were discarded.

Table 1.
Description of the operant conditioning test used in the study.
Table 2.
Description of the treatments and stimuli presented, their reinforcement classification and terminology considered.
The records for each animal consisted of information on 18 categorical variables divided into two sets. The first set of 4 dependent behavioral categorical variables assessed the cognitive performance of donkeys through their response type, response intensity, mood/emotion, and learning ability. The variables in this first set could be conditioned by a second set of independent variables comprising 14 environmental factors. A summary of the variables and categories included in the first variable set is described in Table S1, while Table S2 shows a summary of the factors and categories included in the second categorical factor set. Table S3 shows the descriptive statistics, and numerical parametrization of all the variables analyzed. Table S1 presents Category description and definition for response type, the intensity of response, mood/emotion, and learning variables directly controlled during the operant conditioning test.
2.3. Categorical Behavioral Variables
The reaction developed by the donkeys when they faced the six consecutive treatments provided information on four categorical behavioral variables (Table S1). To name the mood/emotion variable, we considered the definitions by Cabanac [7] and Mendl et al. [8]. Table S4 shows a description of the scales used to score the response type and mood/emotion variables. The intensity of response and learning ability variables were subdivided into five categories each described as shown in Table S1. The appraiser scored the animals relying on the intensity of their responses from low intensity responses to high intensity responses whatever the mood/emotion displayed by them was (Tables S2 and S3). As animals were only scored once, opposite behaviors were not scored correlatively in the same animal. That is to say, the response of an animal displaying a high intensity calm mood/emotion (very calm animal) was not registered as a low intensity nervous mood/emotion (slightly nervous mood/emotion) simultaneously. The reason for this is the fact that an animal cannot be nervous and calm at the same time whatever it is the intensity level at which such animal expresses its mood/emotion status (see Table S4).
2.4. Qualitative Behavioral Assessment
The same trained judge registered each donkey’s mood/emotion following the protocols developed by Navas et al. [9] which based on Minero et al. [10]. Navas et al. [9] generated the descriptor lists for the use in subsequent studies as the present one. Table S4 shows a summary of the mood/emotion descriptors used concerning Table 2.
2.5. Noncognitive Categorical Factors
Environmental categorical factors could be divided into two groups. Meteorological and environmental conditions included year of evaluation, the season of evaluation, weather conditions, temperature, moon phase at evaluation, relative humidity, windspeed, sunlight hours, barometric pressure, rainfall on the day of evaluation, and rainfall on the following day. Animal birth characteristics included season of birth, year of birth and moon phase at birth. Table S2 shows the categories for independent noncognitive factors in the second set.
The information was registered during the yearly behavior assessment sessions carried out on four random days per year, from June to November for three consecutive years from 2013 to 2015 at twenty-two different farms all over Andalusia (Southern Spain).
The 22 farms involved, reared their animals under four husbandry systems (extensive, semi extensive, semi intensive and intensive) and were located in 5 Andalusian provinces (Southern Spain). The 6% of the donkeys were tested during the breed’s Official Morphological Contest held by the Union of Andalusian Donkey Breeders (UGRA).
2.6. Meteorological and Moon Cycle Records
Day records for temperature, relative humidity, windspeed, sunlight hours, barometric pressure, rainfall per day and rainfall prediction (on the following day) were obtained from the State Meteorological Agency (AEMET) (http://www.aemet.es/). Moon phase at evaluation and moon phase at birth records were obtained from the Astronomical Applications Department of the US Naval Observatory (http://aa.usno.navy.mil).
2.7. Operant Conditioning Behavioral Test
The operant conditioning behavioral test was carried out in an open area to which the donkeys were previously accustomed (it was part of the area over which the donkeys developed their daily activities). During the operant conditioning test, the donkeys were made cross over a 200 × 200 cm oilcloth with a wooden print on it using increasingly aversive reinforcement methods (from stimuli 1 to 6). We exposed each animal to six reinforcement treatments consecutively, one at each of the six stages within the operant conditioning test. At each stage, handler A and handler B used each of the six different reinforcement treatments to lead the donkeys to cross over an oilcloth laying on the floor. These treatments/stimuli could comprise unknown elements (the animal had not been familiarized to them) or known elements (to which the animal had already been familiarized). These elements could be visual (elements fell within the visual areas of the donkeys) and/or acoustic (elements generated sounds, i.e., “motivator” or claps, although they may or may not fall within visual areas) and were presented to the donkeys from different positions (from the front or from a rear position always at 2 m away from the animals). A cameraman (Handler C) simultaneously videotaped the experiences (1080 p, 50 Hz, shutter speed: 1/250 s) to assess the donkey’s performance after the field experiences and to test for intra-observer discrepancies. Cameraman (Handler C) controlled timing. A detailed description of the operant conditioning test, the reinforcement treatments, stimuli descriptions and classification and their constituting elements are described in Navas et al. [9] and Navas González et al. [11], and summarized in Table 1 and Table 2.
2.8. Test and Scoring System Reliability
Statistical tests did not report intra-observer discrepancies as all the scores obtained on the field matched those obtained after reviewing the tapes again. Aiming at eliminating the effect of appraiser to reduce the likelihood of subjective evaluations, 50 individuals (16.67% of the total sample) were tested using the operant conditioning test described scoring for the categorical variables of response type, mood and response intensity at a preliminary stage of the study. Cohen’s κ determined whether the repeatability of the model was enough to delete the effect of the appraiser from the model, providing a measure of the accuracy of scoring of the appraisers. Then 95% confidence intervals (95% kappa IC) were computed according to 95% kappa IC = κ ± 1.96 SEκ, where; SEκ = [(po(1 − po)/n(1 − pe)2]0.5 with the Crosstabs procedure of SPSS Statistics for Windows, Version 24.0, IBM Corp. (2016, Armonk, NY, USA). This preliminary analysis aimed at testing for interobserver reliability, i.e., the reliability of the scoring system, which proved to be highly reliable as there was highly statistically significant perfect agreement between the three appraisers’ judgements when scoring for response type and response intensity for the six stimuli/treatments presented. Each stimulus corresponded to one of the six stages in the test (Table 1). When testing for mood/emotion, there was highly statistically significant almost perfect agreement among the three observers at the preliminary test for repeatability for all the traits and stimuli, except when testing for mood at the presentation of stimulus/treatment 3. In this case, the strength of agreement between appraisers 1 and 2 and 2 and 3 was substantial and at the presentation of stimuli/treatments 1 and 6, for appraisers 2 and 3 between whom inter-observer agreement was substantial. The slight distortion occurring may be attributed to the change in the kind of reinforcement applied to make the donkeys cross over the oilcloth on the floor occurring in stimuli/treatments 1, 3, and 6. At the presentation of stimulus/treatment 1, the animal passed from being at rest to start the operant conditioning test. At the presentation of stimulus/treatment 3, the animals went from being exposed to negative reinforcement (stimulus/treatment 2) to being exposed to positive/neutral reinforcement (stimulus/treatment 3). Finally, at the presentation of stimulus/treatment 6, the stimulus changed from being presented at the visible area of the donkey to be located at a rear position (blind area). Table S5 shows the results for interobserver reliability tests at this preliminary study.
2.9. Statistical Analysis
Categorical variables represent a qualitative method of scoring data. As all the variables and factors considered in our study were categorical, we used nonparametric tests to assess the information recorded statistically. A Chi-square test for independence was used to analyze whether the factors in the second set (Table S2) randomly and significantly influenced the variables in the first set (Table S1). Chi square is neutral to the parametric or non-parametric nature of the distribution and is relatively robust to situations with a limited number of data (n > 50). The most appropriate statistic to use as a measure of Chi-square association is Cramér’s V. Cramér’s V is used to measure the strength of linear correlation, that is to test for the multicollinearity and significance between each variable from the first set with each variable from the second set using the Crosstabs procedure from SPSS Statistics for Windows, Version 24.0, IBM Corp. (2016, Armonk, NY, USA) according to the indications of Nolan [17]. Table S6 shows total and relative frequencies for the associations of the four dependent categorical variables with the environmental variables.
Categorical principal components analysis (CATPCA) was used to quantify categorical factors while reducing the dimensionality of the data and Categorical regression to establish the most important descriptive and discriminative noncognitive factors on the variables considered using the Optimal Scaling procedure from the Dimension reduction task from SPSS Statistics for Windows, Version 24.0, IBM Corp. (2016, Armonk, NY, USA). Reducing the dimensionality of relatively large sets of variables prevents type I errors from occurring, as we may strip our model to the core independent variables affecting the dependent variables studied by our model. A lower number of variables means we may need stronger evidence against the null hypothesis H0 (via a lower p-value) before we will reject the null. Therefore, if the null hypothesis is true, we will be less likely to reject it by chance. This reduced information was used later at the categorical regression (CATREG) analysis.
We used CATREG to describe regression models to study how the variables assessed depended on the factors considered. The resulting regression equations could be used to trace back, explain, or predict behavior or cognitive abilities for any combination of the 14 independent factors. Categorical regression was carried out using the Optimal Scaling procedure from the Regression task from SPSS Statistics for Windows, Version 24.0, IBM Corp. (2016, Armonk, NY, USA).
2.10. Justification for Statistical Tests
The most appropriate statistic to use as a measure of Chi-square association is Cramér’s V. Cramer’s V is a measure of association for nominal variables. Effectively it is the Pearson chi-square statistic rescaled to have values between 0 and 1 as follows:
where χ2 is the Pearson chi-square, nobs represents the number of observations included in the table, and where ncols and nrows are the number of columns and rows in the table, respectively. For a 2 by 2 table, of course, this is just the square root of chi-square divided by the number of observations, which is also known as the phi coefficient. Cramer’s V squared is the average of the squares of the canonical correlation coefficient between two categorical variables. Such canonical-correlation analysis will find the strength that linear combinations of the Xi and Yj have on each other. When using Cramér’s V small effect associations range from 0.0 to 0.10, medium effect associations from 0.3 to 0.5 and large effect associations from 0.5 to anything above. The same author would recommend that the interpretation of effect size should consider a statistically significant measure (p < 0.05) with a small effect size or higher to indicate a meaningful difference, especially for behavioral or psychological studies.
CATPCA is appropriate to reveal the inherent overlapping nature of behavioral variables, hence becomes suitable for variable selection and dimension reduction in categorical variables. This statistical test analyses the interrelationships among a large number of variables and explains these variables regarding their common underlying dimensions. The objective is to find a few linear combinations of the variables (factors) that can be used to summarize the data without losing too much information in the process. CATPCA is a nonparametric method that quantifies categorical variables through a process called optimal scaling. Optimal scaling uses category quantifications in such a way that they account for as much as possible of the variance in the quantified variables. The most relevant characteristic of CATPCA is that it can handle and discover nonlinear relationships between variables. Because CATPCA directly analyses the data matrix and not the derived correlation matrix, so that, we can avoid the usual concern to have at least five times as many observations as the variables. CATPCA suits analysis in which there are more variables than objects. In behavioral sciences many of the variables used are qualitative, nominal or ordinal, thus indicating the use of CATPCA, which has been demonstrated to be more robust than PCA when assessing categorical variables.
CATPCA eigenvalues are indicators of how many dimensions are needed. As a general rule, when all variables are either single nominal, ordinal, or numerical, the eigen value for a dimension should be larger than 1. For multiple nominal variables, there is no easy rule of thumb to determine the appropriate number of dimensions. If we replace the number of variables by the total number of categories minus the number of variables, the above rule still holds. However, this rule alone would probably allow more dimensions than are needed. When choosing the number of dimensions, the most useful guideline is to keep the number small enough so that meaningful interpretations are possible. The model summary table also shows Cronbach’s alpha (a measure of reliability), which is maximized by the procedure. In this study, the stepwise method was used to prevent the possible multicollinearity problem that could arise in the linear multiple regression model formed by transformed variables. The resulting reduced set of variables can be used to perform a categorical regression analysis to build significant behavioral descriptive equations that enable quantifying the result of the effects of specific combinations of environmental factors on behavioral variables, such as response type or intensity, mood or learning abilities.
When assessing non-parametrical data, categorical variables can be included as independent variables in a regression analysis but must be converted to quantitative data for us to be able to analyze them. Ordinary linear regression models could only be used when the dependent variable is quantitative and predictive variables are either quantitative or dummy. The analysis of such ordinary linear regression models involves minimizing the sum of squared differences between a response (dependent) variable and a weighted combination of predictors (independent). Variables are typically quantitative, with (nominal) categorical data recoded to binary or contrast variables. As a result, categorical variables serve to separate groups of cases, and the technique estimates separate sets of parameters for each group. The estimated coefficients reflect how changes in the predictors affect the response. Prediction of the response is possible for any combination of predictor values. CATREG extends the standard approach by simultaneously scaling nominal, ordinal, and numerical variables. The procedure quantifies (transforms) categorical variables so that the quantifications reflect characteristics of the original categories. The procedure treats quantified categorical variables in the same way as numerical variables. Using nonlinear transformations allow variables to be analyzed at a variety of levels to find the best-fitting model. R-squared evaluates the scatter of the data points around the fitted regression line. It is also called the coefficient of determination, or the coefficient of multiple determination for multiple regression. For the same data set, higher R-squared values represent smaller differences between the observed data and the fitted values. R-squared is the percentage of the dependent variable variation that a linear model explains. As the independent noncognitive categorical factors registered in our study were categorical and the data was sorted into categories following different criteria, we used standardized coefficients to interpret and compare their effects on our behavioral dependent categorical variables. When we apply a stepwise linear regression model to the transformed variables, the standardized and unstandardized coefficients are equal. Hence, we can interpret the unstandardized coefficients. Standardized coefficients represent regression results with standard scores. By default, most statistical software, like SPSS, automatically converts both criterion (DV) and predictors (IVs) to Z scores and calculates the regression equation to produce standardized coefficients. When most statisticians refer to standardized coefficients, they refer to the equation in which one converts both DV and IVs to Z scores. In a simple model with two factors involved the coefficients for Z scores for each variable (Z’y) may be interested as follows:
β1 mean a standard deviation increase in ZX1 is predicted to result in a β1 standard deviation increase in Z’y holding constant ZX2.
β2 mean a standard deviation increase in ZX2 is predicted to result in a β2 standard deviation increase in Z’y holding constant ZX1.
Therefore, the standardized partial coefficient represents the amount of change in Zy for a standard deviation change in ZX. So, if X1, one factor involved, were increased by one standard deviation, then one would anticipate a β1 standard deviation increase in the variable tested holding constant the effect of X2 and vice versa.
With ZX1 and ZX2, being the Z scores for each factor, and β1 and β2 the standard coefficients for each of the, respectively.
As the above example shows, conversion of raw scores to Z scores changes the unit of measure for interpretation, the change from raw score units to standard deviation units.
As a rule, we assume standardized results reported used full standardization (both DV and IVs were converted to standard scores), and that the Z formula was used for standardization. The general standardized regression equation may follow the following model Z’y = β1ZX1 + β2ZX2 + …, where Z’y is the predicted value of Y in Z scores; β1 represents the standardized partial regression coefficient for X1; β2 represents the standardized partial regression coefficient for X2; and ZX1 and ZX2 are the Z score values for the variables X1 and X2, respectively.
The intercept will always equal 0.00 when standardization is based upon Z scores, and both DV and IVs are standardized.
Once the regression equation is standardized, then the partial effect of a given X upon Y, or ZX upon Zy, becomes somewhat easier to interpret because interpretation is in sd units for all predictors.
3. Results
3.1. Noncognitive Factor Analysis
Table 3 shows the results from Chi-Square and Cramér’s V, testing for the existence of linear correlations. Cramér’s V effectively measured the strength of collinearity that the noncognitive factors considered have on the behavioral variables studied, given the high significance (p < 0.001) that they report for all the factor-variable combinations except for season at birth and response type (Table 3). CATREG was performed to the 14 qualitative independent variables (environmental factors) with the four behavioral categorical variables (response type, mood/emotion, the intensity of response and learning ability) as dependent variables. Then stepwise linear regression to the data with the resulted quantifications was applied, and Table 4 and Table 5 present the summary results with the significant variables. Table 5 lists the standardized coefficients (β). CATREG reported all of the independent variables except for season at evaluation to be significant for response type (Table S7). Season at evaluation and the rainfall on that day were nonsignificant for mood/emotion. Weather conditions, temperature, and barometric pressure were nonsignificant for response intensity and learning ability.
Table 3.
Statistical significance and strength of the effects on the different variables tested in donkeys in this study.
Table 4.
Model summary of stepwise linear regression with transformed variables.
Table 5.
Standardized coefficients and significance of categorical regression (CATREG) model.
According to Cramér’s V, there was a moderate linear correlation between sunlight hours and the four behavioral variables tested (0.194 to 0.274), which was as well supported by the percentage of variance explained by this factor according to CATREG standardized coefficients. However, CATPCA addressed the correlations with three of the dimensions were inverse (from strong −0.954 to moderately weak −0.110) as reported by the values of the negative component loading (Table 3, Table 5 and Table S8). By contrast, there was a moderate positive component, thus direct correlation with dimension 2.
For the year of birth, the Cramér’s V values ranged from 0.192 to 0.310 what reported a moderately high linear correlation. Moderately high CATREG standardized coefficients reported a moderate dependence for the four variables on this factor. Component loading for dimension 1 was negligible. However, there was a moderately strong negative loading for dimension 2 (inverse correlation) and strong positive loadings for dimensions 3 and 4 (strong direct correlation) (Table 3, Table 5 and Table S8).
There was a moderate linear correlation between windspeed and the four behavioral variables tested (Cramér’s V ranging from 0.182 to 0.248), which was as well supported by the percentage of variance explained by this factor according to CATREG standardized coefficients. CATPCA addressed these correlations with two of the four dimensions (dimensions 1 and 3) were strongly inverse as reported by the high negative component loadings, while the other two were moderately positive thus direct (dimensions 2 and 4) (Table 3, Table 5 and Table S8).
For the season of evaluation, the Cramér’s V values ranged from 0.196 to 0.252 what reported a moderate linear correlation. Moderate to high CATREG standardized coefficients reported a moderate to strong dependence on the four variables on this factor. Component loading for dimension 1 was high, describing a strong direct correlation. However, there was a moderately strong negative loading for dimension 3 (inverse correlation). CATPCA component loadings for dimensions 2 and 4 were positive moderately low (moderately low direct correlation) (Table 3, Table 5 and Table S8). Season of evaluation Cramér’s values ranged from 0.049 to 0.122 (response type and mood/emotion, respectively). The CATREG standardized coefficients ranged from 0.053 to 0.075, what resembled the low to moderately low values found for Carmér’s V. CATPCA component loadings were positive and moderately low to moderate for dimensions 1, 3, and 4, and negative and moderate for dimension 2.
According to Cramér’s V, there was a moderately high linear correlation between rainfall on the following day and the four behavioral variables tested (0.183 to 0.263), which was as well supported by the percentage of variance explained by this factor according to CATREG standardized coefficients. CATPCA component loading for dimension 1 was high, describing a strong direct correlation. However, there was a moderately strong negative loading for dimension 3 (inverse correlation). Component loadings for dimensions 2 and 4 were positive moderately low (moderately low direct correlation) (Table 3, Table 5 and Table S8).
For rainfall on the same day, the range of the linear correlations of the four variables with the factor was slightly wider (Cramér’s V from 0.177 to 0.301). This was supported by the percentage of variance explained by this factor according to CATREG standardized coefficients. CATPCA component loadings reported the same value patterns described above for rainfall on the following day (Table 3, Table 5 and Table S8).
The range of the linear correlations of the four variables with barometric pressure ranged from 0.174 to 0.317), what was supported by the percentage of variance explained by this factor according to CATREG standardized coefficients with a dependence ranging from 0.054 to 0.365. CATPCA component loading reported positive and from moderate to strong values for the dimensions 1, 2 and 3, but the moderate negative value of the component loading for dimension 4 suggested a moderately strong negative inverse correlation (Table 3, Table 5 and Table S8).
According to Cramér’s V, there was a moderately high linear correlation between rainfall on the following day and the four behavioral variables tested (0.183 to 0.263), which was as well supported by the percentage of variance explained by this factor according to CATREG standardized coefficients. CATPCA component loading for dimension 1 was high, describing a strong direct correlation. However, there was a moderately strong negative loading for dimension 3 (inverse correlation). Component loadings for dimensions 2 and 4 were positive moderately low (moderately low direct correlation) (Table 3, Table 5 and Table S8).
There was a moderate linear correlation between temperature and the four behavioral variables tested (Cramér’s V ranging from 0.150 to 0.206), which was as well supported by the percentage of variance explained by this factor according to CATREG standardized coefficients. CATPCA addressed these correlations were positive and from low to high thus direct for the four dimensions (Table 3, Table 5 and Table S8).
Year of evaluation reported Cramér’s V values ranging from 0.146 to 0.267 and CATREG standardized coefficients ranging from 0.065 to 0.242 for the behavioral variables studied (Table 3, Table 5 and Table S8). The results of CATPCA loadings were 0.017 to 0.700 for dimensions 4 and 2, respectively. These loadings suggested a low to strong direct correlation of this factor (Table 5 and Table S8).
The range of Cramér’s V for moon phase at evaluation for the four variables tested was narrower than the one for other factors (0.102 to 0.121). CATREG standardized coefficient range was narrow as well, ranging from 0.107 to 0.145. Values for the loadings in the CATPCA were negative and low to moderately high for dimensions 1 and 2 (weak to moderate inverse correlation), and positive and moderate to high for dimensions 3 and 4 (moderate to strong direct correlation), respectively. However, moon phase at birth reported a wider range for Cramér’s V values than other factors (from 0.111 to 0.388). By contrast, CATREG standardized coefficient range was narrow, ranging from 0.093 to 0.117. Values for the loadings in the CATPCA were positive and from low to moderate (weak to moderate direct correlation) for all the dimensions except for dimension 3, for which the value was negative and moderate (moderate inverse correlation).
Relative humidity Cramér’s V ranged from 0.117 to 0.226 for response type and mood/emotion, respectively. CATREG standardized coefficients (β) for relative humidity factor ranged from 0.106 to 0.263 for response intensity and learning, and mood/emotion, respectively. CATPCA loadings were negative and moderately high for dimensions 1 and 3 (moderately strong inverse correlation), and positive and moderate to high for dimensions 2 and 4, addressing a moderate to strong direct correlation.
For weather conditions, the range of the linear correlations of the four variables with the factor was from moderately low to moderate (Cramér’s V from 0.096 to 0.220, for response type and mood/emotion, respectively). However, the percentage of variance explained by this factor according to CATREG standardized coefficients ranged from 0.029, for response intensity and learning ability, to 0.211 for mood/emotion. CATPCA component loadings were negative and moderately low for dimensions 1 and 4 (moderate inverse correlation), and positive and moderate to high for dimensions 2 and 3 (moderate to strong direct correlation) (Table 3, Table 5 and Table S8).
A categorical principal components analysis (CATPCA) was applied on the total data set of 14 environmental factors with the aim of establishing and interpreting the factors determining the four behavioral variables tested (response type, mood/emotion, intensity of response, and learning) to evaluate for redundancies among them. Two, three, and four-dimensional model results are shown in Table 6. Table 7 shows the factors affecting the four behavioral variables in order of importance according to the CATREG standardized coefficients (β). Since we used the stepwise method, there was no multicollinearity problem. Only 8 of the environmental factors studied contributed to the two–dimensional model in a meaningful way 11 of them meaningfully contributed to the three-dimensional model and 12 of them meaningfully contributed to the four-dimensional model (factor loadings > 0.5, Table 6), then the different components (PC1, PC2, PC3, and PC4) were best described by the factors highlighted in bold in Table 7.
Table 6.
CATPCA model summary.
Table 7.
Categorical principal component analyses (CATPCA) component loadings.
The outcomes of Cramér’s V and CATPCA analyses were used to inform the CATREG regression analyses performed and thus configure the regression equations presented in Table 8, hence the reduction of factors on each predictive equation. This reduction affects both the likelihood of Type 1 errors and the likelihood that multiple significant findings are reported as independent observations, when in fact they represent the same underlying relationship, as it was discarded in Navas et al. [9]. Table 8 presents the standardized solution for the regression equations.
Table 8.
Regression equations for the behavioral variables assessed.
The two-dimensional model has an internal consistency coefficient (Cronbach’s Alpha) of 0.880 and yields an eigen value of 5.471 for the first component, indicating that 39.075% of the variance is accounted by this component (Table 6). For the second component, the internal consistency coefficient is 0.602 with an eigen value of 2.269, indicating that its proportion of variance is 16.204%. On the whole, the internal consistency coefficient (Cronbach’s Alpha) for the bi-dimensional model was 0.938, and the eigen value yielded of 7.739, explaining a total of 55.279% of the variability.
Table 6 shows the internal consistency coefficients (Cronbach’s Alpha), eigenvalues and percentage of variability explained by each of the components of the three and four-dimensional models. On the whole, the internal consistency coefficient (Cronbach’s Alpha) for the three and four-dimensional models were 0.961 and 0.976, respectively. The eigen value yielded for the three and four-dimensional models were of 9.301 and 10.627, respectively, and they explained a total of 66.435% and 75.910% of the variability, respectively.
3.2. Model and Operant Conditioning Test Behavioral Variability Explanatory Quality
CATREG R squared coefficient obtained ranged from 0.288 to 0.375 for the response type, and response intensity and learning ability variables, respectively (Table 4). In the same way, when CATPCA was implemented, four and three-dimensional models accounted for 75.910% and 66.435% of the total variance of behavioral variables, respectively. These results could compare to those obtained by CATREG. These findings address the fact that two of the components of the study could be summarized into one, with a low loss (9.475%) in the explanatory power of the variability. This low loss could stem from the fact that the response type variable was obtained classifying the levels in the mood/emotion variable, so that response type variable somehow derived from the mood/emotion variable. This percentage of loss is around the same value shown by CATPCA for the explanatory power of the 4th dimension (11.280%).
4. Discussion
Our statistical outputs suggest that the operant conditioning tests and model designed and used for our study efficiently and successfully enable quantifying the variation in the adaptive and cognitive behavioral response of donkeys (Table 4 and Table 7).
Cramer’s V has been stated to be the most suitable parameter for assessing factor strength and testing for significance after the results of cross-sectional studies relying on chi-square analyses. Although most meteorological or climatological variables could be assumed to be approximately normally distributed, some other such as rainfall, remarkably deviate from a Gaussian distribution [18]. Chi-square tests become then especially relevant, as they are neutral to the parametric or non-parametric nature of the distribution and relatively robust to situations in which there are only a limited number of data common to endangered populations, as it would be the case of donkey breeds.
As our results suggest, when we aim at comparing continuous environmental factors relying on linear scales with accurately described behavioral or cognitive categorical variables, it is useful to homogenize their nature, turning continuous variables into categorical ones. This homogenization may simplify establishing effective, easily-understandable relationships.
According to Cohen [19], when using Cramer’s V, small effect associations may range from 0.0 to 0.10, medium effect associations from 0.3 to 0.5 and large effect associations from 0.5 to anything above. The same author would suggest this parameter to be especially suitable for behavioral or psychological studies, considering a statistically significant measure of p < 0.05 with a smaller or greater effect size to indicate a meaningful difference among the categories of a particular factor influencing the different categorical levels of the variables under study.
While studying our first hypothesis, Chi-Square and Cramér’s V highlighted there was a significant linear correlation between environmental factors and variables (Table 3), although the behavioral variables tested were not dependent on some of them as shown in the result section.
Chi-Square and Cramér’s V highlighted there was a highly statistically significant linear correlation (p < 0.001) between all environmental factors and variables, except for season at birth which was just significant (p < 0.05) for response intensity and learning ability and non-significant for response type (Table 3). However, the only factor behavioral variables tested were not dependent on some of them as shown in the result section.
Date of birth has been extensively reported to influence behavior and cognitive abilities in animal models which have later been applied to humans [20,21] with an underneath basis relying on circadian rhythms [22], frequently or exclusively focusing on the influence of birth months. However, the CATREG standardized coefficients and CATPCA component loadings reported found an almost three times lower variation and therefore a weaker factor strength for the birth season when compared to birth year. This low variation among seasons could rely on season shifting, one of the most widely discussed events of climate change [23]. The occurrence of shifting seasons is directly linked to warmer worldwide temperatures. According to Stine et al. [24], the amplitude component of the annual cycle (half the difference between summer and winter temperatures) has progressively decreased in most continental areas. This situation translates into the occurrence of warmer winters resulting in a lower seasonal weather variation through the year, as our results suggest. In the same way, the greater importance and higher relative frequency for birth year variations may support all of the long-term progressively increasing temperature records existing from one year to another since 1884 [25].
It may be worth noting that the late gestation of the animals displaying a depressive behavior pattern took place during the winter to early spring of 2005, when the cold wave accounting for the lowest temperature in the last 117 years, took place in Spain [26]. This situation may be worsened given the characteristics of the light grey coat of Andalusian donkeys which makes them more sensitive to cold weather. Furthermore, the animals born during that spring were all jennies. Studies in humans [27] and rats [28] have reported that the pregnancies of mothers who had been exposed to extreme weather conditions not only presented a resulting offspring with a lower weight at birth and at increased risk to experience developmental, learning, and emotional disorders, but also an altered sex ratio, lowering the occurrence of newborn male offspring in different species [29,30,31].
Moon phases have been reported to increase the number of deliveries in cows [32]. The same authors would report that apart from the higher birth rates of the dairy cows near and during the full moon, the predicted and real delivery dates significantly differed within the eight moon phases. Cows with predicted delivery dates before the first-quarter moon tended to deliver later than expected, whereas cows with delivery dates on a full moon to last-quarter phase tended to deliver on schedule. Although our study is the first to attempt the assessment of the effect of the moon phase at birth on mood or behavior, it is possible that this reported alteration on the times at delivery may be the basis for different degree alterations of cognitive development. These cognitive alterations may translate into future behavioral mood statuses, as suggested by the near 10% linearly correlated effect of moon phase at birth on learning abilities and 12% linearly correlated effect of moon phase at birth on mood found in our study through Cramér’s V and CATREG. Figure 1 shows the relative frequency distribution for different mood/emotion patterns displayed by the donkeys relative to the phase of the moon at the moment of birth and at the time of evaluation.
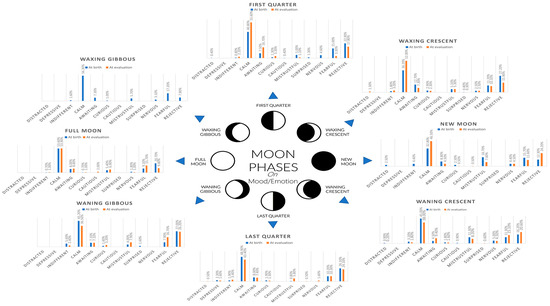
Figure 1.
Relative frequency distribution for different mood/emotion patterns displayed by the donkeys relative to the phase of the moon at the moment of birth and at the time of evaluation.
Our results support the information found by Zakari et al. [33], according to which the behavioral repertoire of donkeys is modulated depending on the season. This seasonal evaluation effect has also been reported by equid welfare organizations such as The Brooke in working donkeys [34]. The study by Meyer et al. [35] in humans reported cognitive abilities to be distorted by a seasonal effect linked to serotonin levels in humans with better cognitive performance in summer, what extended to our experience could explain the increased frequency of animals refusing to cross the unknown surface. Donkeys’ increased cognitive abilities have been mistaken with stubbornness. Therefore, refusal to cross new surfaces may be related with an increased ability to assess potentially harmful or dangerous situations.
Moon phase has been reported to alter both humans and animal at many different psychological and physiological levels [6]. A slight decrease in the strength of the effect of moon phase at the date of evaluation of more than half the strength for the effect of moon phase at birth was reported according to CATREG standardized coefficients. Cramér’s V for moon phase at evaluation was around half the value for moon phase at birth, what suggested a stronger linear correlation between this factor and mood, response intensity, and learning ability variables. The power that the moon exerts on living beings may be mainly attributed to two factors or primary forces which differ along the consecution of the moon cycle; gravity and light changes, and their suggested effect on hormonal production and regulation. Folklore has reported a possibly calmer, hyporeactive status and low cognitive abilities in marine animals like the whale shark, which, as South Sea Islanders believe, are most easily caught a few days after a full moon. In the same way, the Miskito Indians of Eastern Nicaragua, believe that all animals respond to tides, that the woodpecker pecks when the tide is changing, and that hunting and fishing are best at the rising tide, but not at a new moon [36]. This has also been reported for hunting behavior in such large felines as lions, which were prone to hunt larger preys during new moon phases [37]. The time between two successive high or low tides is 12.4. A “lunar day” is 24.8 h. Tides are greatest at a new moon when the gravitational pull of the sun and moon are both acting in the same direction. Because the moon is moving relative to the Earth and the Sun, “lunar days” are not precisely 24 h [38], which at the same time alters normal light cycles. LeGates et al. [39] reported that when subjected to an abnormal light cycle, mice’s cognitive and mood functions were directly affected through intrinsically photosensitive retinal ganglion cells, which may support the strength of the effects obtained for all variables in our study. The effect of the number of sunlight hours found in our study not only was the stronger one according to CATREG standardized coefficients but also the one holding the strongest inverse correlations for all the dimensions in the CATPCA. Exposure to unnatural lighting can induce significant changes in affection, increasing depressive-like and decreasing anxiety-like responses as it disrupts circadian rhythms of locomotor activity, body temperature, hormones, and the sleep-wake cycle in animals [40].
Behavioral responses and mood have been reported to be altered because of weather conditions and the effects of high and low extreme temperature and relative humidity, although still no previous study assessing the direct correlation with weather conditions or environment temperature has been carried out. The results by Denissen et al. [41] revealed the main effects of temperature, wind power, and sunlight on negative emotion patterns in humans and this could be extrapolated to donkeys as highlighted by the CATPCA loadings and CATREG standardized coefficients observed for the temperature, relative humidity and weather conditions on the four variables tested (Table 3, Table 5, Table 8 and Table S8). The basis for this behavioral and possibly cognitive repercussion could be, as stated by [42], the fact that endothermic animals such as equids usually keep their body temperature within narrow limits with changing environmental conditions in an attempt to cool brain temperature. This advantage means a drawback as well, as it occurs at a high energetic cost, making endothermic animals face a two-fold challenge. This double challenge could be one of the reasons, as reported by Janczarek et al. [43], for adverse changes in the behavior of recreational horses that can occur if the horse is ridden when the air temperature is above 26 °C. These conditions may cause an alteration in mood, with donkeys showing more elusive and hyporeactive responses, and a reduction in the willingness to work in horses and other equids. In our study, this was supported by the increase on the refusal to cross and lack of cooperation when completing the problem-solving test, a decrease on the frequency for neutral responses and an increase in the frequencies for rejective and fearful attitudes when temperature ranged from 25 to 29 °C.
Relative humidity has been reported to be a thermally stressing factor from a welfare perspective and to affect donkey behavior and performance when it reaches extreme upper values as reported by Zakari et al. [5] and Gebresenbet et al. [44]. Heat loss mechanisms include evaporation, skin blood flow, and cardiovascular support for thermoregulation and exercise. Low temperatures have been reported to inhibit sweat gland in the donkey [45] and when simultaneously relative humidity is high this effects increase. Sweat does not readily evaporate from the body, and therefore it cannot reduce its temperature efficiently. When this rate is low, such evaporation rate is excessive therefore causing mucosa and skin dryness and increasing heart rate [44]. This situation alters performance in working donkeys and has been reported to reduce complex cognitive capacities in humans [46]. Parallelly, the low cooperative response frequency may be attributed to the fact that as temperature increases and relative humidity decreases, when kept around an optimal point for donkeys, they may be prone to display natural behaviors. Donkeys are energetic natural savers [47], and they will tend to slow moving and decrease their behavioral activity rather than display the compensative methods that they are likely to present under stressing meteorological situations [5].
Extreme high windspeed has been reported to be a welfare distorting factor for donkeys [5,48] to which individuals may adapt differently. Interestingly, as windspeed decreased, the responses of the donkeys became milder, and their attitudes turn less cooperative. White or light coat animals such as the Andalusian donkey have been reported to absorb more heat under higher to 3 m/s windspeeds, which may make them develop more stressful responses [49], hence, the high frequency for stress related moods and slightly lower intensity responses for calmer or cooperative moods. The low variation found, may account for the similar values obtained for almost all the variables. Similarly to our findings, studies in mice have reported a pronounced behavioral inhibition as well as a cognitive disruption because of an increase in the duration of light phases per day, which should be considered when testing animals for such traits [50].
Slight barometric pressure fluctuations have traditionally been reported to promote behavioral and feeding activity in fish. Fishers usually relate slight changes towards high pressure to clear sky occurrence during which fishing is medium to slow as fish may slowly be in deeper water or near cover. These trends progressively invert when there is falling pressure, the best attributed timing for fishing during degrading weather when fish are more active what may support our results [51], though still no previous scientific research has been carried out on the effects of slight variations on barometric pressure. Studies on rats have reported individuals to be more prone to develop depressive behavioral patterns when they are exposed to a sharp fall in barometric pressure (20 hPa below the natural atmospheric pressure) [52]. However, the animals in our study were not exposed to such extreme air pressure variations.
Rainfall has been reported to be especially crucial as a welfare distorting or stressful provoking factor in donkeys [48]. Curiously, donkeys have traditionally been attributed the ability to predict lousy weather (Graphical abstract) and rain occurrence [53,54] as it could be stated by this study, although this may be the first attempt to scientifically proof such ability.
5. Conclusions
Environmental conditions, seasonal, timing (year) and moon cycle phases are potential stress factors or behavioral modulators that affect the behavior and cognitive responses of donkeys, as well as may have potentially long lasting effects which can be traced back. Climate oscillation effects may affect donkeys altering their physiological biorhythms and produce severe behavioral and cognitive modifications. Deviations in behavioral patterns or on the abilities of the donkeys to perform complex tasks to which they may not be accustomed may become relevant indicators of welfare as well as they may address the most suitable techniques or methods to be applied in each case. Furthermore, behavior becomes a relevant tool when predicting future weather conditions as well as may report the potential distortion that they may cause, a prominent importance fact for veterinarians, practitioners and donkey owners, as it may allow them to anticipate such situations in order to counteract their effects.
Supplementary Materials
The following are available online at http://www.mdpi.com/2076-2615/8/11/215/s1. Table S1. Category description and definition for response type, the intensity of response, mood/emotion, and learning variables directly controlled during the operant conditioning test; Table S2. Categorical variable description and levels for the effects of meteorological environment and birth characteristics collaterally controlled during the fulfilment of the test during the first phase of the study; Table S3. Descriptive statistics and numerical parametrization of all the variables analyzed; Table S4. Description for the mood and response type behavioral categorical variables and “Mercalli” scales; Table S5. Cohen’s kappa and 95% confidence interval for inter-observer reliability testing; Table S6. Total and relative frequencies for the associations of the four dependent categorical variables (type and intensity/degree of response, mood/attitude and problem-solving success/learning rate) with eleven independent environmental factors (year, season and moon phase at evaluation, temperature, relative humidity, windspeed, sunlight hours, barometric pressure, rainfall per day, rainfall on the following day and weather conditions); and the three birth related environmental characteristics (season, year and moon phase at birth).; Table S7. CATREG Standardized Coefficients (β) sorted in order of importance on the variables tested; Table S8. Cramér’s V (Chi squared), Standardized Coefficients (β) (CATREG) and loadings (CATPCA) output comparison.
Author Contributions
Conceptualization, F.J.N.G.; Data curation, F.J.N.G., J.J.V. and J.V.D.B.; Formal analysis, F.J.N.G., J.J.V. and J.V.D.B.; Investigation, F.J.N.G., G.P.I. and A.A.A.; Methodology, F.J.N.G., J.J.V. and J.V.D.B.; Resources, F.J.N.G., G.P.I. and A.A.A.; Software, F.J.N.G.; Supervision, J.J.V. and J.V.D.B.; Validation, J.V.D.B.; Writing—original draft, F.J.N.G.; Writing—review & editing, F.J.N.G., J.J.V. and J.V.D.B.
Funding
This research received no external funding.
Acknowledgments
This work would not have been possible if it had not been for the support and assistance of UGRA (Union of Breeders of the Andalusian Donkey Breed) and the PAIDI AGR 218 research group. Especially we would like to thank the international team composed of Navas B., McLean A., and León, J.M.
Conflicts of Interest
The authors declare no conflict of interest.
Ethics Statement
All farms included in the study followed specific codes of good practices for equids and particularly donkeys and therefore, the animals received humane care in compliance with the national guide for the care and use of laboratory and farm animals in research. All subjects gave their informed consent for inclusion before they participated in the study. The study was conducted in accordance with the Declaration of Helsinki. The Spanish Ministry of Economy and Competitivity through the Royal Decree Law 53/2013 and its credited entity, the Ethics Committee of Animal Experimentation from the University of Córdoba, permitted the application of the protocols present in this study as cited in the 5th section of its 2nd article, as the animals assessed were used for credited zootechnical use. This national Decree follows the European Union Directive 2010/63/UE, from the 22 September of 2010.
References
- Van Hoof, T.B.; Bunnik, F.P.; Waucomont, J.G.; Kürschner, W.M.; Visscher, H. Forest re-growth on medieval farmland after the Black Death pandemic—Implications for atmospheric CO2 levels. Palaeogeogr. Palaeoclimatol. Palaeoecol. 2006, 237, 396–409. [Google Scholar] [CrossRef]
- Visser, M.E.; Both, C.; Lambrechts, M.M. Global Climate Change Leads to Mistimed Avian Reproduction. In Advances in Ecological Research; Moller, A., Fiedler, W., Berthold, P., Eds.; Academic Press: Waltham, MA, USA, 2004; Volume 35, pp. 89–110. ISBN 0065-2504. [Google Scholar]
- Jalili, A.; Jamzad, Z.; Thompson, K.; Araghi, M.K.; Ashrafi, S.; Hasaninejad, M.; Panahi, P.; Hooshang, N.; Azadi, R.; Tavakol, M.S.; et al. Climate change, unpredictable cold waves and possible brakes on plant migration. Glob. Ecol. Biogeogr. 2010, 19, 642–648. [Google Scholar] [CrossRef]
- De La Rocque, S.; Rioux, J.A.; Slingenbergh, J. Climate change: Effects on animal disease systems and implications for surveillance and control. Rev. Sci. Tech. 2008, 27, 339–354. [Google Scholar] [PubMed]
- Zakari Friday, O.; Ayo Joseph, O.; Kawu Mohammed, U.; Rekwot, I. The effect of season and meteorological stress factors on behavioural responses and activities of donkeys (Equus asinus)—A review. Ann. Anim. Sci. 2015, 15, 307–321. [Google Scholar] [CrossRef]
- Zimecki, M. The lunar cycle: Effects on human and animal behavior and physiology. Postȩpy Higieny i Medycyny Doświadczalnej 2006, 60, 1. [Google Scholar] [PubMed]
- Cabanac, M. What is emotion? Behav. Process. 2002, 60, 69–83. [Google Scholar] [CrossRef]
- Mendl, M.; Burman, O.H.; Paul, E.S. An integrative and functional framework for the study of animal emotion and mood. Proc. R. Soc. B 2010, 277, 2895–2904. [Google Scholar] [CrossRef] [PubMed]
- Navas, F.J.; Jordana, J.; León, J.M.; Arando, A.; Pizarro, G.; McLean, A.K.; Delgado, J.V. Measuring and modeling for the assessment of the genetic background behind cognitive processes in donkeys. Res. Vet. Sci. 2017, 113, 105–114. [Google Scholar] [CrossRef] [PubMed]
- Minero, M.; Dalla Costa, E.; Dai, F.; Murray, L.A.M.; Canali, E.; Wemelsfelder, F. Use of Qualitative Behaviour Assessment as an indicator of welfare in donkeys. Appl. Anim. Behav. Sci. 2016, 174, 147–153. [Google Scholar] [CrossRef]
- Navas González, F.J.; Jordana Vidal, J.; León Jurado, J.M.; Arando Arbulu, A.; McLean, A.K.; Delgado Bermejo, J.V. Genetic parameter and breeding value estimation of donkeys’ problem-focused coping styles. Behav. Process. 2018, 153, 66–76. [Google Scholar] [CrossRef] [PubMed]
- McLean, A.K.; Heleski, C.R.; Yokoyama, M.T.; Wang, W.; Doumbia, A.; Dembele, B. Improving working donkey (Equus asinus) welfare and management in Mali, West Africa. J. Vet. Behav. Clin. Appl. Res. 2012, 7, 123–134. [Google Scholar] [CrossRef]
- Nansen, C.; Blache, D. Responses of Domestic Horses and Ponies to Single, Combined and Conflicting Visual and Auditory Cues. J. Equine Vet. Sci. 2016, 46, 40–46. [Google Scholar] [CrossRef]
- Sankey, C.; Richard-Yris, M.-A.; Henry, S.; Fureix, C.; Nassur, F.; Hausberger, M. Reinforcement as a mediator of the perception of humans by horses (Equus caballus). Anim. Cognit. 2010, 13, 753–764. [Google Scholar] [CrossRef] [PubMed]
- Hockenhull, J.; Creighton, E. Training horses: Positive reinforcement, positive punishment, and ridden behavior problems. J. Vet. Behav. Clin. Appl. Res. 2013, 8, 245–252. [Google Scholar] [CrossRef]
- Skinner Burrhus, F. The Behaviour of Organisms, 1st ed.; Appleton-Century-Crofts: New York, NY, USA, 1938; p. 486. ISBN 9780874114874. [Google Scholar]
- Nolan, S.; Heinzen, T. Statistics for the Behavioral Sciences, 4th ed.; Macmillan Learning: London, UK, 2017; ISBN 9781319067366. [Google Scholar]
- Allcroft, D.; Glasbey, C.; Durban, M. Modelling weather data. SCRI Annu. Rep. 2001, 2001, 192–195. [Google Scholar]
- Cohen, J. Statistical Power Analysis for the Behavioral Sciences, 2nd ed.; Lawrence Earlbaum Associates, Inc.: Hillsdale, NJ, USA, 1988; p. 400. ISBN 9780805802832. [Google Scholar]
- Crawford, C.; Dearden, L.; Greaves, E. Does When You Are Born Matter? The Impact of Month of Birth on Children’s Cognitive and Non-Cognitive Skills in England; International Foundation for Science: Stockholm, Sweden, 2011. [Google Scholar]
- Menet, F.; Eakin, J.; Stuart, M.; Rafferty, H. Month of Birth and Effect on Literacy, Behaviour and Referral to Psychological Service. Educ. Psychol. Pract. 2000, 16, 225–234. [Google Scholar] [CrossRef]
- Ciarleglio, C.M.; Axley, J.C.; Strauss, B.R.; Gamble, K.L.; McMahon, D.G. Perinatal photoperiod imprints the circadian clock. Nat. Neurosci. 2011, 14, 25–27. Available online: http://www.nature.com/neuro/journal/v14/n1/abs/nn.2699.html#supplementary-information (accessed on 15 November 2018). [CrossRef] [PubMed]
- Thomson, D.J. Climate change: Shifts in season. Nature 2009, 457, 391–392. [Google Scholar] [CrossRef] [PubMed]
- Stine, A.; Huybers, P.; Fung, I. Changes in the phase of the annual cycle of surface temperature. Nature 2009, 457, 435. [Google Scholar] [CrossRef] [PubMed]
- NASA/GISS. Time Series: 1884 to 2016 2017. Available online: https://climate.nasa.gov/vital-signs/global-temperature/ (accessed on 14 August 2017).
- Cuadrat Prats, J.M.; Serrano Notivoli, R.; Tejedor Vargas, E. Heat and cold waves in Spain. In Adverse Weather in Spain; Garcia-legaz Martinez, C., Valero, R., Eds.; Madrid Vicente, A.: Madrid, Spain, 2013; pp. 307–324. ISBN 9788496709430. [Google Scholar]
- Ha, S.; Liu, D.; Zhu, Y.; Kim, S.S.; Sherman, S.; Mendola, P. Ambient Temperature and Early Delivery of Singleton Pregnancies. Environ. Health Persp. 2017, 125, 453–459. [Google Scholar] [CrossRef] [PubMed]
- Tazumi, T.; Hori, E.; Uwano, T.; Umeno, K.; Tanebe, K.; Tabuchi, E.; Ono, T.; Nishijo, H. Effects of prenatal maternal stress by repeated cold environment on behavioral and emotional development in the rat offspring. Behav. Brain Res. 2005, 162, 153–160. [Google Scholar] [CrossRef] [PubMed]
- Fukuda, M.; Fukuda, K.; Shimizu, T.; Nobunaga, M.; Mamsen, L.S.; Yding Andersen, C. Climate change is associated with male:female ratios of fetal deaths and newborn infants in Japan. Fertil. Steril. 2014, 102, 1364–1370. [Google Scholar] [CrossRef] [PubMed]
- Laloë, J.-O.; Cozens, J.; Renom, B.; Taxonera, A.; Hays, G.C. Effects of rising temperature on the viability of an important sea turtle rookery. Nat. Clim. Chang. 2014, 4, 513–518. [Google Scholar] [CrossRef]
- Kühl, H.S.; N’Guessan, A.; Riedel, J.; Metzger, S.; Deschner, T. The Effect of Climate Fluctuation on Chimpanzee Birth Sex Ratio. PLoS ONE 2012, 7, e35610. [Google Scholar] [CrossRef] [PubMed]
- Yonezawa, T.; Uchida, M.; Tomioka, M.; Matsuki, N. Lunar Cycle Influences Spontaneous Delivery in Cows. PLoS ONE 2016, 11, e0161735. [Google Scholar] [CrossRef] [PubMed]
- Zakari, F.O.; Ayo, J.O.; Rekwot, P.I.; Kawu, M.U. Influence of season on daytime behavioral activities of donkeys in the Northern Guinea Savanna zone of Nigeria. J. Equine Sci. 2015, 26, 105–111. [Google Scholar] [CrossRef] [PubMed]
- Nurtazina, G. The Relationship between Work Type and Behaviour and Welfare of Working Equids; University of Edinburgh: Edinburgh, UK, 2016. [Google Scholar]
- Meyer, C.; Muto, V.; Jaspar, M.; Kussé, C.; Lambot, E.; Chellappa, S.L.; Degueldre, C.; Balteau, E.; Luxen, A.; Middleton, B.; et al. Seasonality in human cognitive brain responses. Proc. Natl. Acad. Sci. USA 2016, 113, 3066–3071. [Google Scholar] [CrossRef] [PubMed]
- Nietschmann, B. Hunting and fishing focus among the Miskito Indians, eastern Nicaragua. Hum. Ecol. 1972, 1, 41–67. [Google Scholar] [CrossRef]
- Orsdol, K.G.V. Foraging behaviour and hunting success of lions in Queen Elizabeth National Park, Uganda. Afr. J. Ecol. 1984, 22, 79–99. [Google Scholar] [CrossRef]
- Tromp, S.W. Possible effects of extra-terrestrial stimuli on colloidal systems and living organisms. Int. J. Biometeorol. 1972, 16, 239–248. [Google Scholar] [PubMed]
- LeGates, T.A.; Altimus, C.M.; Wang, H.; Lee, H.-K.; Yang, S.; Zhao, H.; Kirkwood, A.; Weber, E.T.; Hattar, S. Aberrant light directly impairs mood and learning through melanopsin-expressing neurons. Nature 2012, 491, 594–598. Available online: http://www.nature.com/nature/journal/v491/n7425/abs/nature11673.html#supplementary-information (accessed on 15 November 2018). [CrossRef] [PubMed]
- Fonken, L.K.; Finy, M.S.; Walton, J.C.; Weil, Z.M.; Workman, J.L.; Ross, J.; Nelson, R.J. Influence of light at night on murine anxiety- and depressive-like responses. Behav. Brain Res. 2009, 205, 349–354. [Google Scholar] [CrossRef] [PubMed]
- Fonken, L.K.; Finy, M.S.; Walton, J.C.; Weil, Z.M.; Workman, J.L.; Ross, J.; Nelson, R.J. The effects of weather on daily mood: A multilevel approach. Emotion 2008, 8, 662. [Google Scholar]
- Zakari Friday, O.; Ayo Joseph, O.; Rekwot, P.I.; Kawu Mohammed, U. Effect of age, sex, physical activity and meteorological factors on haematological parameters of donkeys (Equus asinus). Comp. Clin. Path. 2016, 25, 1265–1272. [Google Scholar] [CrossRef] [PubMed]
- Janczarek, I.; Wilk, I.; Zalewska, E.; Bocian, K. Correlations between the behavior of recreational horses, the physiological parameters and summer atmospheric conditions. Anim. Sci. J. 2015, 86, 721–728. [Google Scholar] [CrossRef] [PubMed]
- Gebresenbet, G.; Aradom, S.; Kaumbutho, P.G. Performance and welfare status of working donkeys. Changes 2016, 12, 15. [Google Scholar] [CrossRef]
- Robertshaw, D.; Taylor, C.R. Sweat gland function of the donkey (Equus asinus). J. Physiol. 1969, 205, 79–89. [Google Scholar] [CrossRef] [PubMed]
- Taylor, L.; Watkins, S.L.; Marshall, H.; Dascombe, B.J.; Foster, J. The impact of different environmental conditions on cognitive function: A focused review. Front. Physiol. 2015, 6, 372. [Google Scholar] [CrossRef] [PubMed]
- Delgado, J.V.; Navas, F.J.; Miranda, J.C.; Miró, M.; Arando, A.; Pizarro, M.G. Preliminary body weight estimation methodology and its applicaction to the Andalusian donkey breed as an energetic producer. Actas Iberoam. Conserv. Anim. 2014, 4, 207–209. [Google Scholar]
- Ayo, J.O.; Dzenda, T.; Zakari, F.O. Individual and diurnal variations in rectal temperature, respiration, and heart rate of pack donkeys during the early rainy season. J. Equine Vet. Sci. 2008, 28, 281–288. [Google Scholar] [CrossRef]
- Dean, W.R.J.; Milton, S. The Karoo: Ecological Patterns and Processes, 1st ed.; Cambridge University Press: Cape Town, South Africa, 1999; p. 398. ISBN 9780521554503. [Google Scholar]
- Roedel, A.; Storch, C.; Holsboer, F.; Ohl, F. Effects of light or dark phase testing on behavioural and cognitive performance in DBA mice. Lab. Anim. 2006, 40, 371–381. [Google Scholar] [CrossRef] [PubMed]
- Allen, B. Finding Trout in All Conditions: A Guide to Understanding Nature’s Forces for Better Production on the Water, 1st ed.; WestWinds Press: Portland, OR, USA, 2016; p. 164. ISBN 9780871083289. [Google Scholar]
- Mizoguchi, H.; Fukaya, K.; Mori, R.; Itoh, M.; Funakubo, M.; Sato, J. Lowering barometric pressure aggravates depression-like behavior in rats. Behav. Brain Res. 2011, 218, 190–193. [Google Scholar] [CrossRef] [PubMed]
- Merry, R. Prognostications of the Weather. In Robert Merry’s Museum; Samuel Griswold, G., Ed.; Boston’s Horace B. Fuller: Boston, MA, USA, 1844; pp. 154–159. [Google Scholar]
- Dobie, J.F. Weather wisdom of the Texas-Mexican border. In Coffee in the Gourd: Publications of the Texas Folklore Society; Dobie, J.F., Ed.; University of North Texas Press Dallas: Austin, TX, USA, 1923; Volume 2, p. 110. ISBN 9780870740398. [Google Scholar]


© 2018 by the authors. Licensee MDPI, Basel, Switzerland. This article is an open access article distributed under the terms and conditions of the Creative Commons Attribution (CC BY) license (http://creativecommons.org/licenses/by/4.0/).