Article

Stable Isotope Tracers of Cretaceous Arctic Paleoprecipitation

1
Kansas Geological Survey, University of Kansas, 1930 Constant Avenue, Lawrence, KS 66047, USA
2
Department of Geology, University of Cincinnati, 2600 Clifton Avenue, Cincinnati, OH 45221, USA
3
Department of Geology, University of Kansas, Lawrence, KS 66047, USA
4
Bureau of Economic Geology, University of Texas at Austin, P.O. Box X, Austin, TX 78713, USA
5
Department of Geosciences, University of Alaska Fairbanks, Reichardt Building, Room 308, 1930 Yukon Drive, P.O. Box 755780, Fairbanks, AK 99775, USA
6
Department of Geography & Environmental Studies, Texas State University, 601 University Drive, San Marcos, TX 78666, USA
7
Geology, Energy & Minerals Science Center, United States Geological Survey, 12201 Sunrise Valley Drive, Mail Stop 954, Reston, VA 20192, USA
*
Author to whom correspondence should be addressed.
Geosciences 2022, 12(4), 143; https://doi.org/10.3390/geosciences12040143
Submission received: 1 February 2022 / Revised: 2 March 2022 / Accepted: 9 March 2022 / Published: 23 March 2022

Abstract

:
We report estimated stable isotope compositions of depositional waters and paleoprecipitation from the Cretaceous Arctic to further elucidate the role of the global hydrologic cycle in sustaining polar warmth during that period. Estimates are based on new hydrogen isotopic analyses of n-alkane biomarkers extracted from Late Cretaceous and mid-Cretaceous terrestrial deposits in northern Alaska and the Canadian High Arctic. We integrate these new results with earlier published work on oxygen isotopic analyses of pedogenic siderites, dinosaurian tooth enamel phosphates, and pedogenic clay minerals from the same field areas. Average Late Cretaceous δD values of −143‰ VSMOW corresponded with average δ18O values of −24.1‰ VSMOW, and average mid-Cretaceous δD values of −106‰ VSMOW corresponded with average δ18O values of −22.1‰ VSMOW. The distributions of water isotope δD and δ18O values from Cretaceous Arctic deposits do not intersect with the Global Meteoric Water Line, suggesting an apparent deuterium excess ranging from about 40 to 60 per mil. We considered several possible explanations for these Cretaceous results including (1) mass-balance changes in zonal patterns of evaporation and precipitation at lower latitudes, (2) concentration of 2H in leaf tissue waters from continuous transpiration by coniferous paleofloras during the Arctic growing season, and (3) concentration of 2H in the groundwaters of methane-emitting Arctic soils.

1. Introduction

The Cretaceous period is an iconic example of an ancient greenhouse world [1,2], a climate state of direct relevance to the future human prospect [3,4]. An interval of Earth’s history with higher atmospheric pCO2 levels, warmer global temperatures, and reduced equator-to-pole temperature gradients, the Cretaceous greenhouse world has long posed a challenge to paleoclimate modelers. Data–model misfits between evidence for Cretaceous polar warmth and the results of climate model simulations have been a chronic problem [5]. More recently, some model simulations have produced results that better accord with paleoclimate proxy data suggesting a warm Cretaceous Arctic, and they implicate the involvement of the hydrologic cycle in the processes that sustained polar warmth [6,7].
Modern and ancient dynamics of the global hydrologic cycle are traced by stable isotopes of H2O in the liquid phase. These include the hydrogen (2H or 1H, otherwise expressed as δD or δ2H) and oxygen (18O or 16O, otherwise expressed as δ18O) isotopic compositions of modern atmospheric precipitation [8] along with derivative geologic proxies of ancient minerals that formed in shallow groundwaters and fossil organisms or their organic biomarkers preserved in records of ancient terrestrial ecosystems.
There is a scientific controversy about the impacts of super greenhouse worlds on the stable isotope tracers of polar paleoprecipitation and thus the mechanistic role of the hydrologic cycle in sustaining polar warmth. This question concerns the applicability of a modern relationship between local mean annual surface temperature and the δD and δ18O of mean annual precipitation [8]. Extrapolation of this relationship to ancient super greenhouse episodes predicts that the δD and δ18O values of paleoprecipitation proxies in the warmed polar regions should have higher values than that of modern precipitation. This hypothesis is supported by paleoclimate proxy δD and δ18O data and climate modeling results regarding the super greenhouse period of the Paleocene-Eocene thermal maximum (PETM) [9,10,11,12]. This view regards increased polar specific humidity as the warming mechanism, with water vapor and related radiative properties playing a passive role in polar warming.
An opposing theory is supported by paleoclimate proxy data and stable isotope mass-balance modeling results indicating much lower proxy paleoprecipitation δ18O values from the Cretaceous Arctic [13,14,15,16,17,18,19]. Similar evidence for much lower proxy paleoprecipitation δ18O values from polar paleoenvironments has been reported from other ancient super greenhouse episodes [20,21]. This oxygen isotope viewpoint concerns mass-balance changes in the hydrologic cycle, with increased subtropical evaporation fluxes and increased temperate-polar precipitation fluxes during meridional water vapor transport from the tropics to the poles. The proposed mechanism posits an active role for the hydrologic cycle with mass transfer of latent heat to the poles [22]. This pattern matches with historic zonal mass-balance changes in the hydrologic cycle during the anthropogenic warming of the late 20th century [23,24].
The initial reports of lower proxy δ18O values from Cretaceous deposits in Arctic Alaska were challenged by Earth system modelling results [25] suggesting that an apparent model–data misfit was related to local orographic complications because of proximity of the first sampling site to the ancestral Brooks Range mountains. Subsequent studies in other areas have supported the idea that low paleoprecipitation δ18O values from the Cretaceous Arctic are a robust result [16,17,18,19].
A recent report on δD values of n-alkane biomarkers extracted from mid-Cretaceous deposits of the Cretaceous Arctic [26] lent support to the idea that Cretaceous Arctic paleoprecipitation had higher δD values than that of modern precipitation. New low δ18O values from pedogenic siderites in a mid-Cretaceous unit in the same area [19] showed that the estimated water δD and δ18O values from these two proxies do not conform to the slope of the Global Meteoric Water Line [27]. Resolution of this apparent paradox requires that new data from δD and δ18O paleoprecipitation proxies of the Cretaceous Arctic are collected from stratigraphic units that are closely associated in space and geologic time. This contribution is directed towards advancing that goal through compilation of δD and δ18O data from terrestrial units of the Cretaceous Arctic. We further note that sampling of multiple paleoprecipitation proxies from terrestrial deposits of the Cretaceous Arctic offers the best chance for independent verification and cross-calibration of proxy results, to begin exploring the expected influences of highly heterogeneous terrestrial paleoenvironments [17,28].
In this paper, we compared new paleoprecipitation data from the n-alkane δD proxy with δ18O data developed from the pedogenic siderite proxy [20,29] and other co-occurring δ18O proxies from Arctic Cretaceous terrestrial deposits. We also further re-evaluated published pedogenic siderite δ18O data in light of new updates on siderite 18O fractionation factors to recalculate their derivative water δ18O values. We then integrated these proxy datasets to further examine conflicting viewpoints on the role of the hydrologic cycle in sustaining Cretaceous polar warmth.

2. Materials and Methods

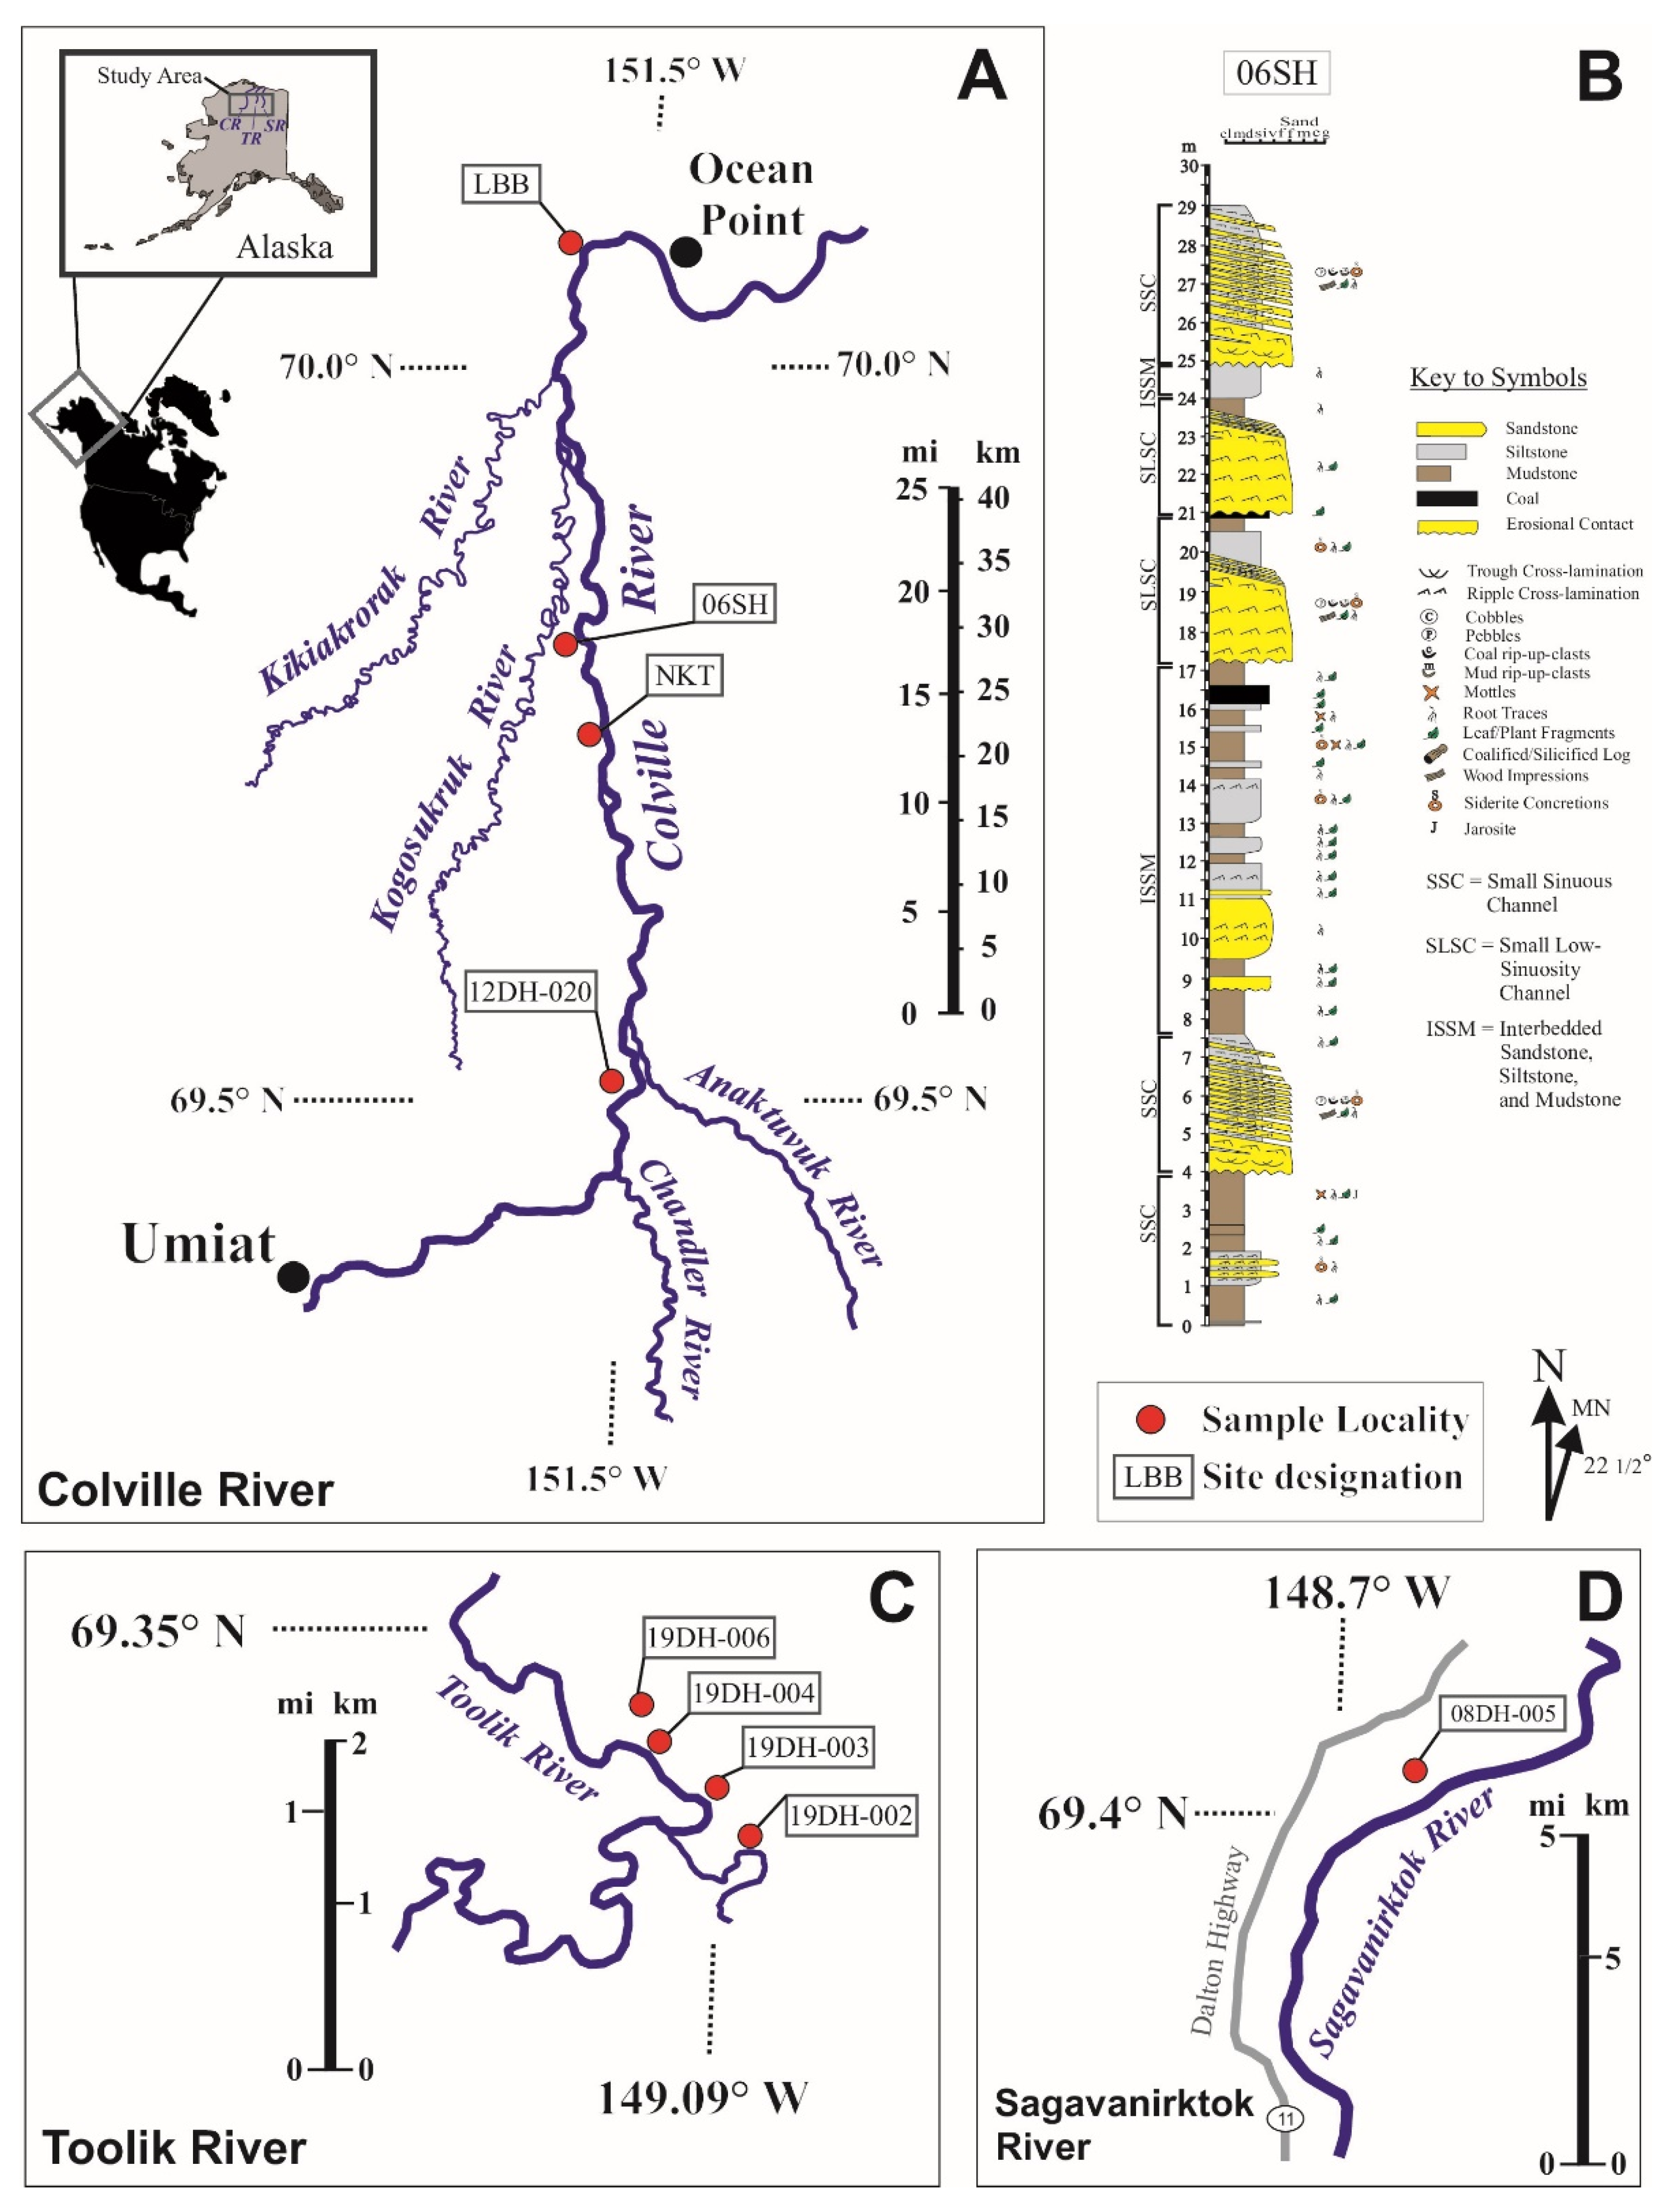
2.1. Sample Materials from the Prince Creek Formation, Colville Basin, Alaska

Samples were collected from organic-rich sediments of the Maastrichtian-Paleocene Prince Creek Formation exposed in bluffs formed by modern river downcutting along the Colville, Toolik, and Sagavanirktok Rivers on the north slope of Alaska. Cretaceous samples are from bluffs located along the Colville River from north of Umiat, Alaska to south of Ocean Point (Figure 1A). A representative stratigraphic section with sedimentologic features and paleoenvironmental interpretations for the 06SH sample locality along the Colville River is shown in Figure 1B. Paleocene samples are from Sagwon Bluffs along the Sagavanirktok River and bluffs along the Toolik River west of, and latitudinally equivalent to, Sagwon Bluffs (Figure 1C,D).
Cretaceous deposits found along the Colville River (Figure 1A) are those meandering to anastomosed river systems and associated floodplain environments [30]. Cretaceous samples are primarily from paleosol horizons, thin lacustrine deposits, or coal. Cretaceous paleosols are weakly developed compound and cumulate soils that formed on the levees, point bars, and crevasse splays of channel systems, and along the margins of lakes, ponds, and swamps [31,32]. Soil development was frequently interrupted by input of sediments during river flooding events, resulting in paleosols that are similar to modern Entisols or Inceptisols [31]. Clay mineralogical and geochemical analyses of some alluvial paleosols indicate that they were heavily influenced by inputs of volcanic ash and developed into Andisol-like soils [33]. Paleoenvironmental reconstructions indicate a coastal plain to lower delta plain setting with polar forests, an angiosperm understory, abundant dinosaur fauna, a seasonally fluctuating water table, and common river floods [30,31,34,35].
Stratigraphic samples from Late Cretaceous portions of the Prince Creek Formation that were analyzed for this study were contributed from the research collections of coauthors McCarthy and Flaig. They are LBB-20; LBB-24; LBB-07; 06SH-16.1; 06SH-16.6; 06SH14.6; 06SH-9.4; 06SH-16; 06SH-2.5; NKT-7; NKT-51; NKT-31; and NKT-32 (see Tables S1–S10).
Paleocene deposits found along the Toolik and Sagavanirktok rivers (Figure 1C,D) are those of river channels and associated crevasse splays, crevasse channels, and levee deposits that alternate with thick lacustrine-palustrine deposits and coals [36]. Paleocene samples are primarily from palustrine to lacustrine deposits and coal (Figure 1C,D). Organic-rich floodplain deposits interbedded with sandier channel deposits are relatively thick and indicate extensively vegetated and commonly wet paleoenvironments with a consistently high water table.
Stratigraphic samples from Paleocene portions of the Prince Creek Formation that were analyzed for this study were contributed from the research collections of coauthors Houseknecht and Sanders. They are 19DH-002; 19DH-003; 19DH-004; 19DH-006; 08DH-005; 10DH-037; and 12DH-020 (see Tables S1–S10).

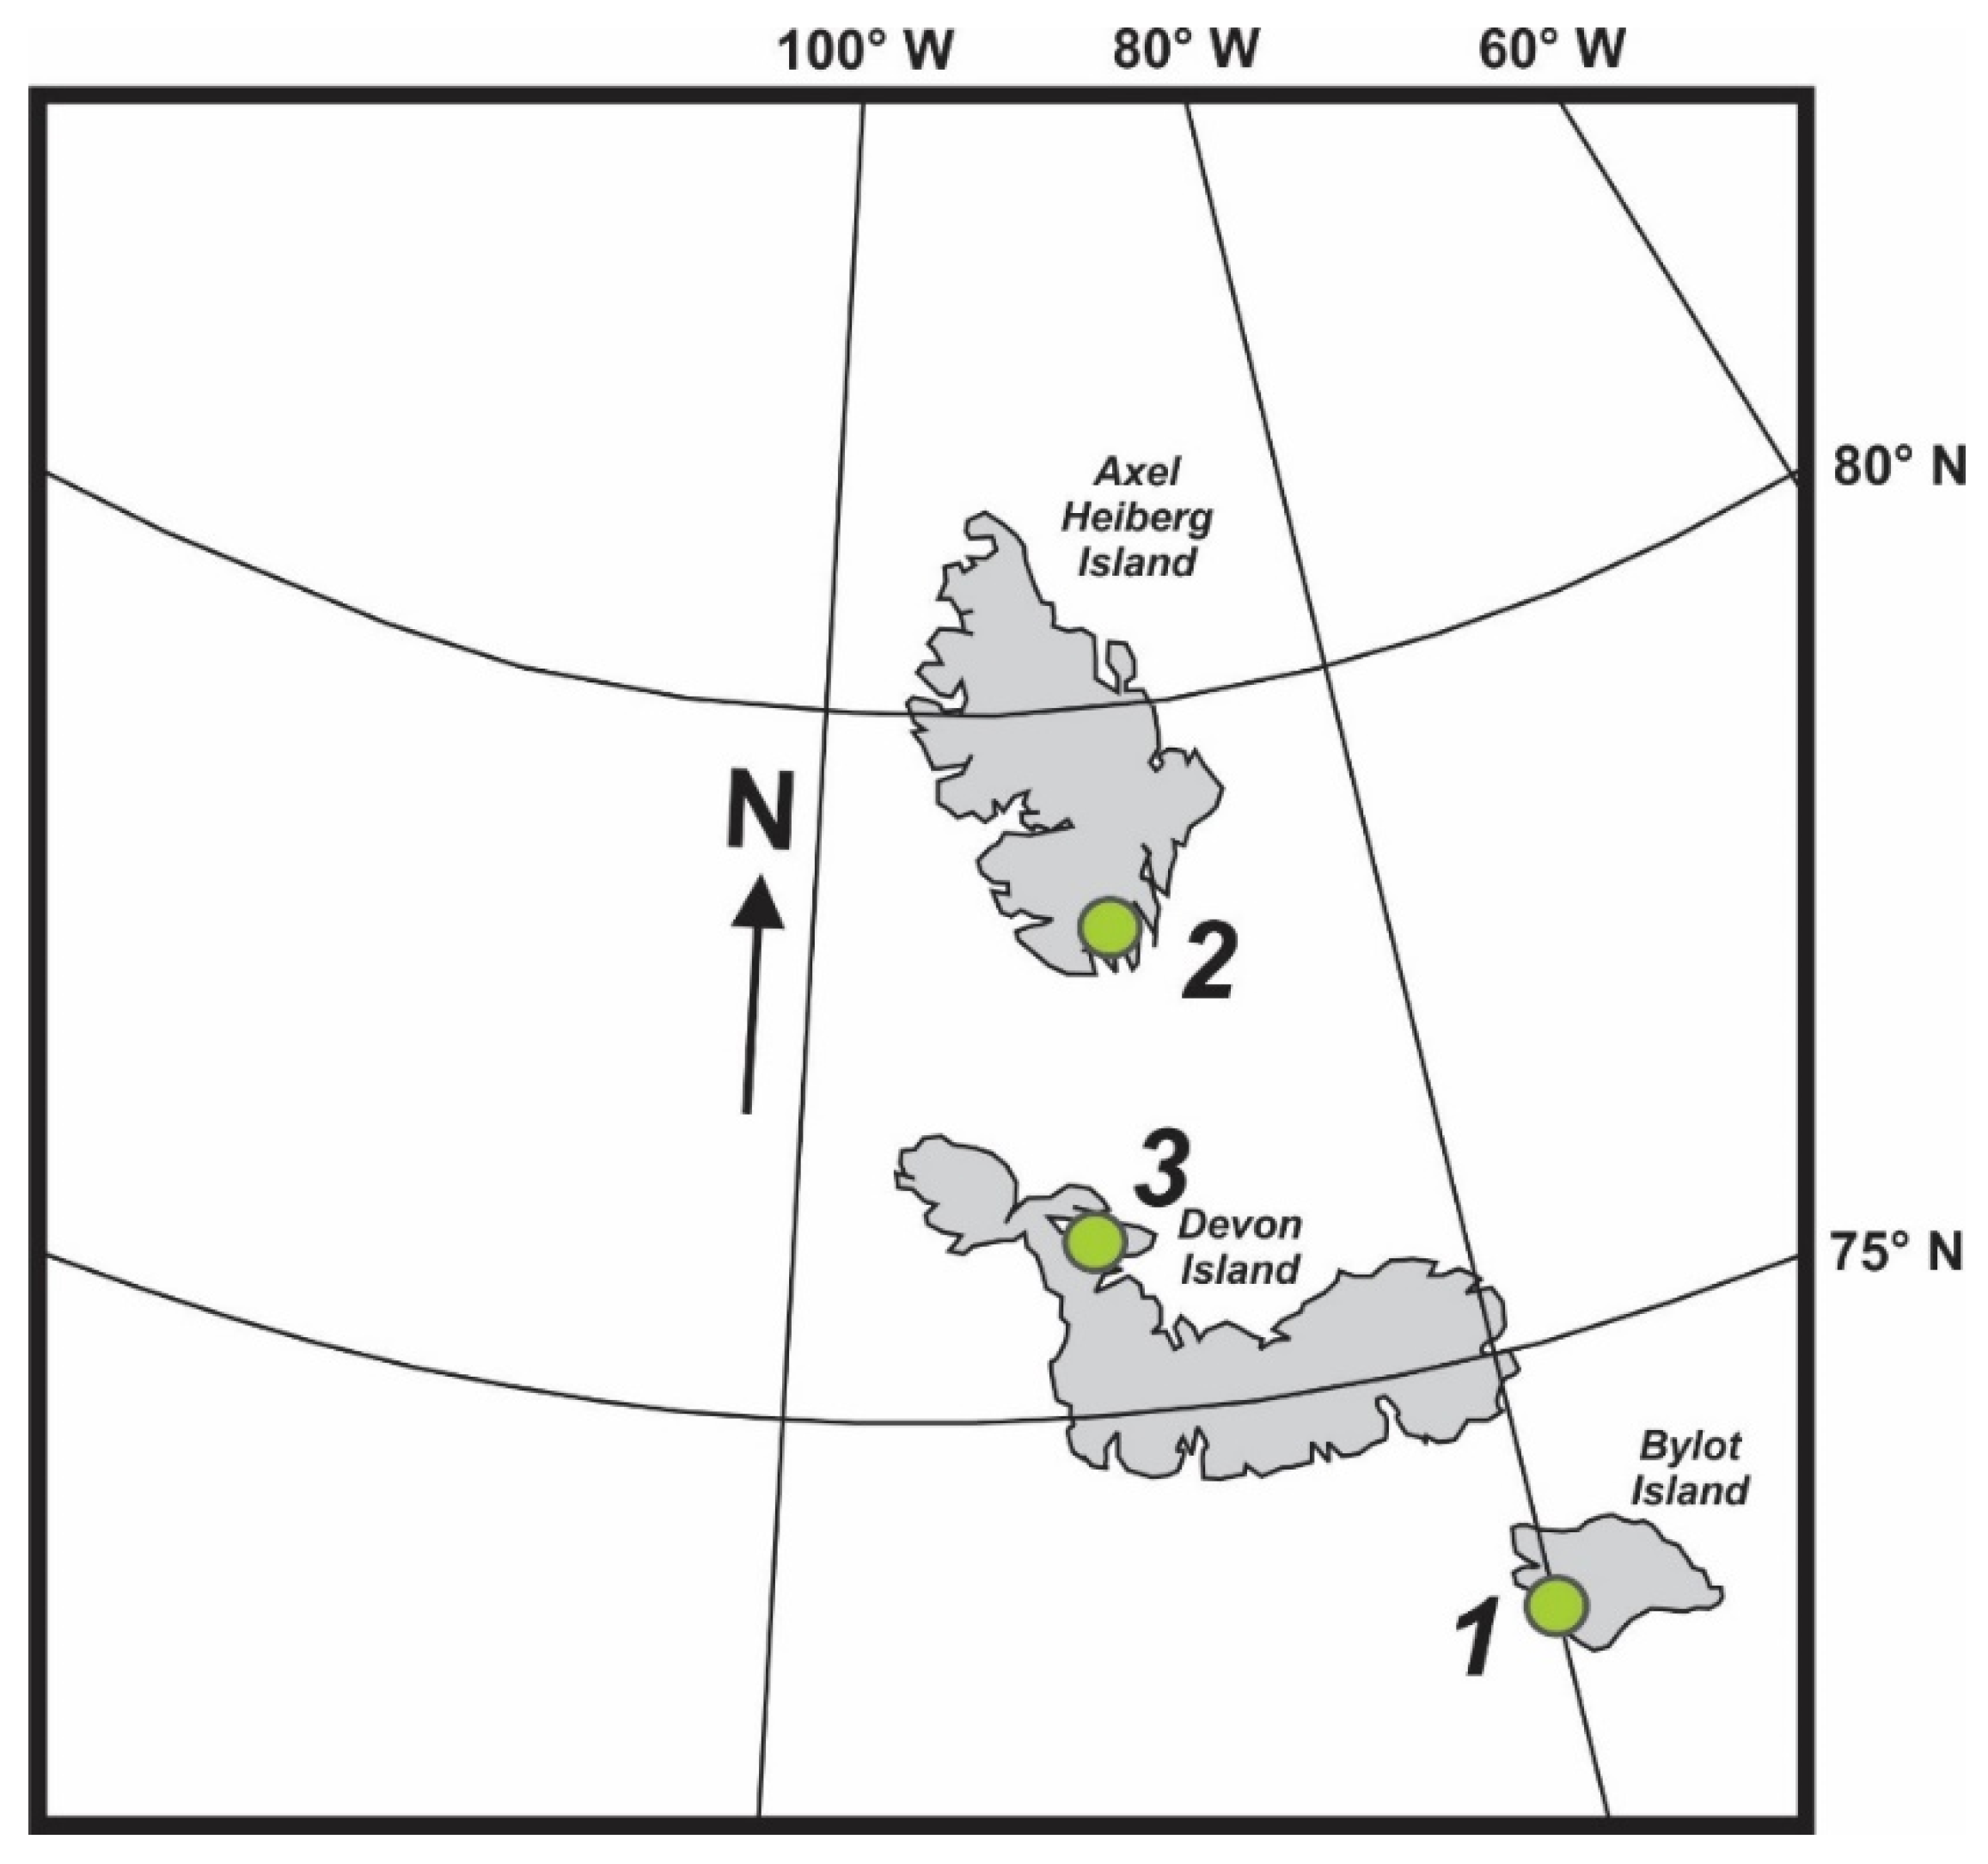
2.2. Sample Materials from the Canadian High Arctic

We collected new stable isotope data from mid-Cretaceous deposits from the Sverdrup Basin and Eclipse Trough of the Canadian High Arctic Archipelago. A coal sample from the Albian-Cenomanian Hassell Formation was collected from the Twosnout Creek section [37] within the Eclipse Trough on Bylot Island (Figure 2(1)) and was used to produce hydrogen isotope data from extracted n-alkanes for this study. Oxygen isotope data from paleosol siderite [20,38] were collected from the Cenomanian Bastion Ridge Formation on Axel Heiberg Island (Figure 2(2)) and were reported earlier [19]. These data were used to recalculate water δ18O values for this study. Carbonaceous mudstones from the Turonian Kanguk Formation on Devon Island (Figure 2(3)) were used to produce hydrogen isotope data from extracted n-alkanes [26]. Those data were further used in this synthesis.
The stratigraphic samples from Axel Heiberg Island [19,39] and Bylot Island [40] that were used for this study were contributed from the research collections of our colleague Claudia Schröder-Adams. Altogether, the stable isotopic datasets from these mid-Cretaceous samples from the Canadian High Arctic were integrated in our analysis of the water isotope values of Cretaceous Arctic paleoprecipitation in the region of the Sverdrup Basin and Eclipse Trough (Figure 2).

2.3. Organic Geochemistry Sample Preparation and Extraction

Rock samples were powdered with a ball mill and an aliquot of powder was reserved for bulk organic analysis (see below). Prior to lipid extraction, 2500 ng of 5α-androstane was added as a recovery standard. Lipids were extracted by sonicating for 15 min with 9:1 (v/v) hexanes/ethyl acetate, centrifuged, and the process was repeated for a total of 3 rounds of extraction. The lipid extract was then separated into apolar and polar fractions on alumina oxide using hexanes/DCM (9:1 v/v) and DCM/MeOH (1:1 v/v), respectively.

2.4. Compound Identification and Quantification

Compounds were identified and quantified using the apolar fraction following prior studies [41]. Samples were quantitatively diluted in hexanes spiked with 25 µg/mL 1,1′-binaphthalene and analyzed on an Agilent 7890A (Agilent, Santa Clara, CA, USA) gas chromatograph (GC) interfaced to an Agilent 5975C quadrupole mass selective detector (MSD) and flame ionization detector (FID). Compounds were separated on a fused silica capillary column (Agilent J&W DB-5 ms; 30 m length, 0.25 mm i.d., and 0.25 μm film thickness). The oven program started with an initial temperature of 60 °C for 1 min followed by a 6 °C/min temperature ramp to 320 °C and held for 15 min. Following the GC separation, the column effluent was split (1:1) between the FID and MSD using a 2-way splitter with constant pressure He makeup gas. A scanning range of m/z 45–700 at 2 scans/s was used with an ionization energy 70 eV. Compounds were identified using n-alkane standards (C7 to C40; Supelco, Bellefonte, PA, USA), fragmentation patterns, retention times, and published spectra. Compounds were quantified on the FID using n-alkane standards ranging in concentration and normalized to the extracted sample mass (μg/g). Additional cleanup steps were required for compound-specific analysis and are reported below.
Thermal maturity of the organic matter was assessed using the homohopane (C31) maturity index for the isomerism at the C-22 position [42]. The 22S (biological) and 22R (geological) isomer abundances were measured on 17α, 21β-homohopane by ion extraction of the m/z 191 and confirmed against the m/z 205 and 426 ions to rule out interferences. Homohopane maturity indices were calculated using the 22S/(22S + 22R) ratio for each sample. Homohopane values > 0.55 are consistent with early oil window thermal maturity [42].

2.5. Compound-Specific Isotope Analysis

Due to the complexity of the samples, additional cleanup steps were required for compound-specific isotope analysis. The apolar fraction was separated into saturated and unsaturated fractions with 5% Ag-impregnated silica gel (w/w) using hexanes and ethyl acetate, respectively. The saturated apolar was further separated using urea adduction to separate n-alkyl compounds from branched and cyclic compounds [41].
Compound-specific isotope analyses were performed when possible, on n-C23 through n-C33 alkanes, diterpenoids, and triterpenoids including hopanes, by GC-combustion (C)-IRMS for δ13C and GC-pyrolysis (Py)-IRMS for hydrogen (δ2H) at the University of Cincinnati. GC-IRMS analyses were performed using a Thermo Trace GC Ultra (ThermoFisher Scientific, Bremen, Germany), an Isolink, and a Thermo Electron Delta V Advantage IRMS. Isotopic abundances were normalized to the VPDB or VSMOW scale using Mix A7 (Arndt Schimmelmann, Indiana University). The pooled δ13C analytical uncertainty was 0.2‰ (1σ, n = 32) and the pooled δ2H uncertainty was 3.6‰ (1σ, n = 161).

2.6. Bulk Sample Organic Carbon Analysis

For bulk sample total organic carbon (TOC) and bulk carbon isotope analysis (δ13CTOC), an aliquot of each sample was decarbonated to remove siderite. Samples were acidified with 6 N HCl for 3 days in a water bath at 50 °C [43]. Samples were subsequently neutralized with DI water rinses and centrifugation. The δ13CTOC and weight percent of total organic carbon (wt. % TOC) were determined via continuous flow (He; 120 mL/min) on a Costech elemental analyzer (EA) coupled to a Thermo Electron Delta V Advantage Isotope Ratio Mass Spectrometer (IRMS) at the University of Cincinnati. δ13CTOC values were corrected for sample size dependency and normalized to the VPDB scale using a two-point calibration with USGS-40 and USGS-41a [44]. Additional independent standards were measured in all EA runs to determine error. Precision and accuracy were 0.1‰ (1σ; n = 16) and 0.2‰ (n = 16), respectively.

3. Results

3.1. Organic Matter Characterization of Carbonaceous Mudstones of the Prince Creek Formation

The thermal maturity values of the Prince Creek Formation, using the homohopane thermal maturity index, averages 0.05 (±0.04, n = 6). The remaining samples had hopane concentrations below detection limits. These values are consistent with very immature thermal maturity and very low burial temperatures [42].
The n-alkanes of the Prince Creek Formation are characterized by n-alkanes ranging in chain length from C16 to C37 with higher concentrations of mid-chain n-alkanes (n-C23 to n-C25), compared to long-chain n-alkanes (≥n-C27) and short-chain n-alkanes (<n-C23) (e.g., Figure 3; Table S2, Supplementary Data File). This is consistent with n-alkanes derived from submerged aquatic plants (mid-chain), emergent aquatic and terrestrial plants (mid- and long-chain), and algae or bacteria (short-chain) [45].
The carbon preference index (CPI) provides an indication of the odd chain length preference in long-chain n-alkanes, where values greater than 1 signify higher odd over even n-alkane abundances [46]. Values greater than 1 are typical for leaf wax n-alkanes in sediments [47,48,49]. In this study, CPI values ranged from 1.6 to 8.4 (mean = 5.0, 1σ = 1.6, n = 20). Although CPI values vary by sample, they are consistent with terrestrial plant origins [50].
Average chain length (ACL) is commonly used to provide relative comparisons between terrestrial plant n-alkane chain length distributions [49]. ACL has been used as a paleovegetation proxy but shows varying degrees of sensitivity to phylogeny, climate, and biome [50]. Average chain lengths were calculated using this Equation [48]:
ACL = ( 25 n - C 25 + 27 n - C 27 + 29 n - C 29 + 31 n - C 31 + 33 n - C 33 + 35 n - C 35 ) ( n - C 25 + n - C 27 + n - C 29 + n - C 31 + n - C 33 + n - C 35 )
While acknowledging that n-C25 alkanes often include submerged aquatic plants [45,49,50], ACL values ranged from 26.2 to 29.2, falling within the range observed in modern tree species (26 through 34) [50]. The range in ACL values likely reflect variations in plant communities (i.e., different representative phylogenies, water use efficiency strategies, and growth forms) among the sample locations. Modern conifer ACL values have a strong phylogenetic signal among most conifer groups. As a consequence, ACL has limited applications for distinguishing between angiosperms and conifers for these samples.
The Prince Creek Formation samples contained many different types of terpenoids, including conifer-derived diterpenoids, rare angiosperm-derived triterpenoids, and bacterially derived hopanes. The conifer-derived diterpenoids (Table S1; Supplementary Data File) were abundant and included pimarane and abietane structures [51]. In some cases, diterpenoid concentrations were higher than the long-chain n-alkanes. However, angiosperm-derived triterpenoids were extremely rare, with detection in only two samples (LBB-20 and LBB-24). Compounds concentrations were below the limit of quantitation used here (≤0.05 µg/mL) and are therefore not reported. Bacterially derived hopanes were also common in these samples but with concentrations much lower than the long-chain n-alkanes (Figure 3 and Tables S2 and S4).

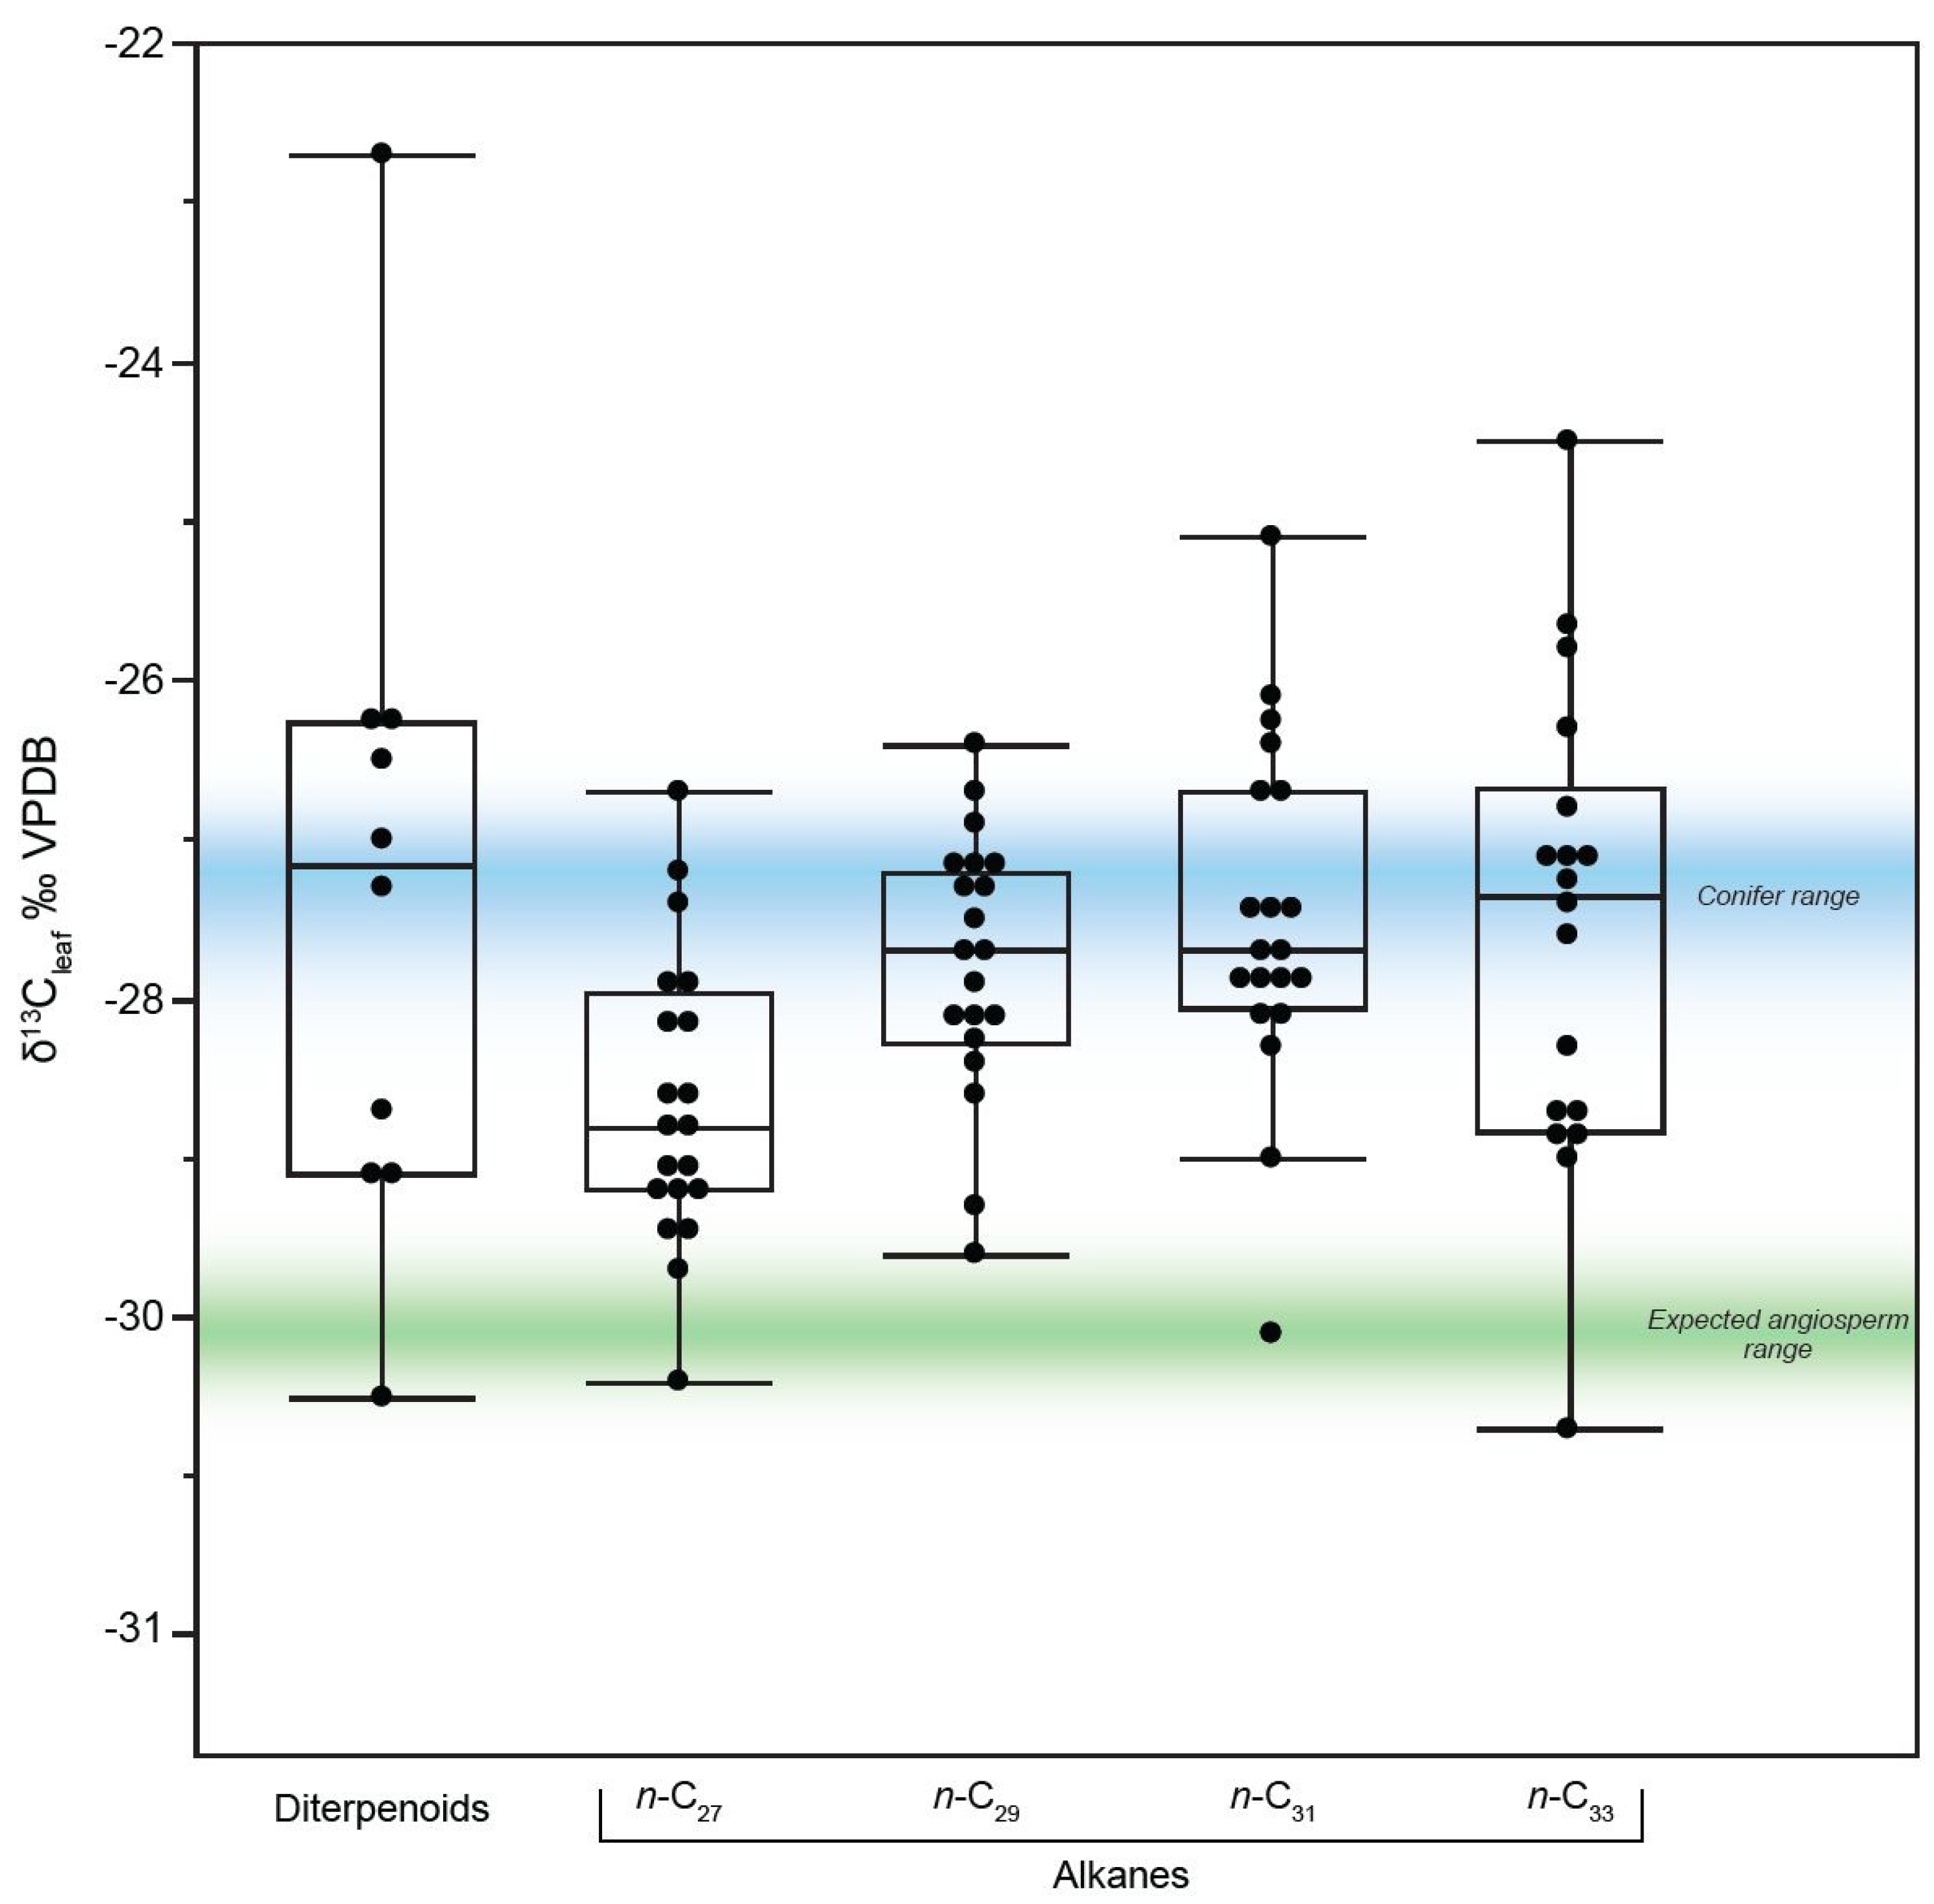
3.2. Carbon Isotopes of n-Alkanes, Diterpenoids, and Hopanes from the Prince Creek Formation

The carbon isotopic compositions of the long-chain n-alkanes were similar for n-C27 to n-C33 (Table S7; Supplementary Data File) with mean values of −28.7, −27.8, −27.5, and −27.6, respectively. To compare these values to the conifer diterpenoids, we converted the n-alkane and diterpenoid δ13C values into leaf δ13C values by accounting for the carbon isotope fractionation between the biomarker and leaf values with ε13Cbiomarker-leaf values [52]. The resulting leaf values derived for n-alkanes (C33 = −27.6‰ VPDB, n = 18) were similar to the conifer derived diterpenoids values (−27.3‰, n = 10). This is consistent with the majority of the n-alkanes being derived from conifers [41].
To compare the Prince Creek Formation leaf δ13C values to other plants including modern plants and to determine water stress [53,54], we calculated leaf carbon isotope fractionation (Δ13Cleaf) where δ13Catm is the δ13C of atmospheric CO2:
Δleaf = (δ13Catm − δ13Cleaf)/(1 + δ13Cleaf)
For the δ13Cleaf values, we used the n-C29 alkane calculated values. For the Maastrichtian δ13Catm, we used a value of −5.8 ± 0.7‰ VPDB [55]. The Δ13Cleaf values for the Prince Creek Formation averaged −22.6‰ VPDB (1σ = 0.9, n = 20).
The bacterially derived hopane δ13C values ranged from −27.5 to −57.1‰ VPDB (Table S8; Supplementary Data File). These values are consistent with heterotrophic bacteria consuming plant or other sediment biomass as well as 13C-depleted carbon sources including methane [56].

3.3. Hydrogen Isotopes of n-Alkanes

The n-alkane δ2H values were more negative for n-C23 and n-C25 than the longer chain lengths n-C27 to n-C33 by ~30 per mil (see Table S10). The n-C29 alkane δ2H values averaged −237‰ VSMOW (1σ = 18, n = 19). These δ2H values are similar to modern observations of high latitude sites [57]. To convert n-C29 alkane values into precipitation δ2H values, we corrected for apparent fractionation (2ε) between the δ2H of n-C29 alkanes and precipitation where:
2εn-C29 alkane/precipitation = (δ2Hn-C29 alkane + 1)/(δ2Hprecipitation + 1) − 1
C3 dicots and gymnosperms have slightly different 2εn-C29 alkane/precipitation [58]. Given that the n-alkanes in the Prince Creek Formation are likely conifer derived (see Discussion), we used the global 2εn-C29 alkane/precipitation value for gymnosperms of –110 ± 24 ‰ (n = 15) [58]. For reference, the global C3 dicot value is −121 ± 30‰ (n = 316) [57,58]. The δ2Hprecipitation values for the Prince Creek Formation average −143 ± 21‰ VSMOW (1σ, n = 19). These values are higher than high latitude sites today [9,59,60]. The range of calculated water δD values from the Prince Creek Formation (−190.5‰ to −86.2‰ VSMOW) are presented in Table S10 (Supplementary Data File).

3.4. Organic Matter from the Hassel Formation of the Canadian High Arctic

The coal sample horizon from the Albian-Cenomanian Hassel Formation of the Eclipse Trough on Bylot Island (Figure 2) is thought to have accumulated at about 73° N paleolatitude [40]. Exploratory data from this deposit are presented in Table 1. The range of calculated water δD values from the Hassel Formation overlap with those presented earlier from Devon Island [26], further confirming that mid-Cretaceous n-alkane data from the High Arctic yield higher water δD values than modern Arctic precipitation.

3.5. Quantitative Re-Evaluation of Paleosol Siderite Oxygen Isotopes

Published oxygen isotope values of depositional waters from the Prince Creek Formation, Alaska were derived from pedogenic siderites, dinosaur tooth enamel phosphates [17], and pedogenic smectites [18]. Published oxygen isotope values of depositional waters from the Bastion Ridge Formation of the Sverdrup Basin, Canada were derived from pedogenic siderites [19]. The water oxygen isotope values estimated from siderites from both of those earlier studies have been recorrected using updated acid fractionation factors [61] for reaction with phosphoric acid at 75 °C (Prince Creek Formation) and at 70 °C (Bastion Ridge Formation). In addition, the water isotope values from these siderites have also been recorrected using updated siderite-water fractionation factors [62]. This allows for a more direct comparison of our Cretaceous water δ18O values with recent Late Paleocene to Early Eocene high latitude siderite-derived water δ18O values [12].
Estimates for the temperatures of siderite formation for the Prince Creek Formation ranged from a cold month mean of −2 °C to a maximum of 14.5 °C for the warm month mean and a mean annual temperature of 6.3 °C, based on paleobotanical CLAMP analysis [63]. The updated water δ18O values for the combined dinosaurian and siderite dataset [17] for the Prince Creek Formation (Figure 4A) ranges from −28.6‰ to −16.9‰ vs. VSMOW and averages −24.1‰ (±2.45‰ 1 s). These results are further verified by the pedogenic smectite isotopic data from the Prince Creek Formation [18], with calculated water δ18O values ranging from about –27‰ to −23‰ vs. VSMOW. The temperature of siderite formation for the Bastion Ridge Formation is estimated to have ranged between 12.6 and 13.7 °C [19]. The revised range in water δ18O values for this unit (Figure 4B) is estimated at −25.1‰ to −21.5‰ vs. VSMOW compared to the earlier estimated range of −23.3‰ to −23.0‰ vs. VSMOW [19].

3.6. Integration of Water Hydrogen and Oxygen Isotopic Values from Cretaceous Units

Our compilation of water isotope data from the Prince Creek Formation (average δ18O = −24.3‰ VSMOW; average δD = −145.2‰ VSMOW) plot in a field above the Global Meteoric Water Line (GMWL; Figure 4A) with a δD value about 40 per mil higher than the average δ18O intercept with the GMWL. Similarly, water isotope data from Cenomanian units in the Canadian High Arctic (average δ18O = −22.1‰ VSMOW; average δD = −106.5‰ VSMOW) also plot in a field above the Global Meteoric Water Line (Figure 4B), with a δD value about 60 per mil higher than the average δ18O intercept with the GMWL. We note that this even higher apparent deuterium excess from mid-Cretaceous units is temporally associated with the peak warming of Cretaceous period [64].

4. Discussion

4.1. The Utility of Isotopic Results from Cretaceous Terrestrial Arctic Organic Matter

As indicated from the hopane thermal maturity index, the Prince Creek Formation organic matter is of very low thermal maturity. This provides confirmation that the n-alkane δD and δ13C values are not thermally altered [65,66] and therefore can be used to infer paleoprecipitation δD and Δ13Cleaf values.
The Prince Creek Formation n-alkane chain length distributions are consistent with multiple origins. These include algae and bacteria, submerged and floating organic matter, and emergent and terrestrial plants. This agrees with the depositional environment and other palaeobotanical studies of this unit [31,32] The terrestrial plants in this unit are likely predominantly conifers. This is based on the abundance of conifer-derived diterpenoid compounds and the near absence of angiosperm-derived triterpenoids. Diterpenoids tend to have enhanced preservation compared to triterpenoids [67], so the lack of triterpenoids is not strong evidence there were no angiosperms present. However, based on the δ13Cleaf values determined from the n-alkanes and the diterpenoids, the n-alkanes appear to be largely conifer-derived [52]. The lack of very long-chain n-alkanes (≥C33) is consistent with taxa that include the taxodioid Cupressaceae such as Metasequoia, Glyptostrobus, and Taxodium that were common in the ancient Arctic [41,63,68].
The Δ13Cleaf values calculated from the n-C29 alkanes are ~2 per mil higher than those calculated for similar aged sites in Wyoming and Colorado [52]. These higher values are consistent with higher water availability and thus higher Δ13Cleaf values [53,54].
The range in hopane δ13Cleaf values are consistent with heterotrophic bacteria consuming plant-derived organic matter as well as 13C-depleted sources of carbon including methane [56]. This is consistent with anoxic conditions.

4.2. Interpretation of Apparent Deuterium Excess in Paleoprecipitation of the Cretaceous Arctic

Proxy-derived water isotope values from the Prince Creek Formation and other mid-Cretaceous units in the Canadian High Arctic consistently showed pairing of δD and δ18O values that plot above the Global Meteoric Water Line (Figure 4), suggesting an apparent Cretaceous deuterium excess (d-excess) in Arctic precipitation. D-excess in precipitation originates from kinetic fractionation during evaporation. The diffusivity of a water molecule with deuterium (mass 19) is greater than a water molecule with 18O (mass 20). This results in water vapor (and resultant precipitation) to have a higher abundance of deuterium than what would otherwise be expected from equilibrium fractionation effects. There is often a strong inverse correlation between relative humidity and d-excess in which decreased relative humidity is correlated with increased d-excess [8,69,70]. The degree to which relative humidity at the vapor source site affects d-excess is revealed in the data resulting from the 2012 Superstorm Sandy event. D-excess in New England exceeded +20‰ as a result of relatively dry continental air interacting with the storm and resulting in evaporation of Atlantic Ocean water at sites with low relative humidity [60,71]. D-excess also appears to be positively correlated with precipitation recycling, though many other factors such as seasonality, vegetation density, and re-evaporation of sub-cloud precipitation appear to complicate this relationship [72].
While significant efforts by various organizations to characterize modern precipitation water isotopes have produced vast amounts of data, less is known about Arctic precipitation. A recent dataset from the Arctic [73] shows d-excess values from −28.8‰ to a high of +16.3‰, much less than the apparent values from the Prince Creek Formation proxy data. Airmass trajectory is one factor that governs d-excess. Strong meridional trends, especially in Eurasia where airmasses travel over the continents, is one explanation for precipitation with high d-excess, along with lowering of δ18O (a feature observed in Cretaceous data as well). A recent 1D steady state model of evaporation and precipitation [74] indicated that precipitation isotope values at latitudes greater than 40° are significantly affected by changes in moisture transport rather than local meteorologic conditions. This may suggest that a significant component to the explanation of Cretaceous Arctic precipitation values (low δ18O and high apparent d-excess) might be related to large-scale variation in evaporation and precipitation equatorward of the poles.

4.3. The Possible Influence of Continuous Transpiration by Cretaceous Arctic Paleofloras

Continuous photosynthetic activity and transpiration during the Arctic growing season should induce a kinetic fractionation that preferentially concentrates deuterium (2H) over protium (1H) in the leaf tissue waters of Cretaceous terrestrial plants. This would produce an apparent deuterium excess in the n-alkanes extracted from Cretaceous Arctic terrestrial deposits. Greenhouse experiments on deciduous conifers grown under continuous light conditions showed deuterium enrichments of up to 40 per mil in leaf n-alkanes compared to those from the same plants grown under diurnal light conditions [75]. Studies of modern Arctic woody plants show δD enrichments of n-alkanes with similar or even greater apparent deuterium excess values [76].

4.4. The Possible Influence of Hydrogenotrophic Methanogenesis in Cretaceous Arctic Soils

The carbon isotopic data for paleosol siderites from the Prince Creek Formation ranges from +3.3 to +6.9‰ VPDB [17]. These δ13C values are characteristic of environments in which hydrogenotrophic methanogenesis (i.e., CO2 reduction) is the dominant anaerobic CH4-producing pathway [77,78]. During hydrogenotrophic methanogenesis, 100% of the CH4 hydrogen is derived from the pore water (groundwater). The δD of hydrogenotrophic CH4 ranges from −250 to −400‰ VSMOW [79,80]. As a result of this preferential uptake of 1H, intense hydrogenotrophic methanogenesis can enrich the source water in deuterium without impacting the oxygen isotopic composition [81,82,83]. Although extreme deuterium enrichment has been mostly documented in landfills or in association with contaminant plumes, deuterium excess in uncontaminated groundwaters has also been documented in several sites including the Los Angeles Basin [84] and bog pore waters from Glacial Lake Agassiz peatlands [85]. Enriched carbonate δ13C values are common for high latitude Cretaceous freshwater siderites [13,14,16,17], suggesting that intense hydrogenotrophic methanogenesis was pervasive in the Cretaceous Arctic and likely contributed to the observed deuterium excess.

4.5. The Path Forward

We verified earlier findings regarding high δD values of n-alkanes from Cretaceous Arctic paleoenvironments [26] while considering that those data came from stratigraphic intervals with strong evidence for much lower δ18O values than would be predicted from a simple intercept with the GMWL. This paradox of apparent deuterium excess should be investigated further. The use of pedogenic clay mineral proxies that simultaneously constrain both δD and δ18O water values [86] would be a logical next step to address this question. Further appraisal of Cretaceous Arctic pedogenic siderites using the clumped isotope technique [29] would add further important constraints on the isotope hydrology of the region.
The results we reported indicate that simplistic assumptions about the meaning of isotopic paleoprecipitation proxies should be viewed with caution, considering the myriad complexities associated with Earth surface processes. The proxies do not directly measure precipitation water isotope values and so must be evaluated in light of the array of critical zone processes that can influence their isotopic compositions. Criticisms of the credibility of very low δ18O values from polar pedogenic siderites have pertained to possible local orographic complications [25] or seasonal biases in groundwater infiltration [21]. It should be noted that if those processes actually did determine the lower proxy δ18O values, they would be even more strongly expressed in producing very low proxy δD values. To this point in our compilation, that has decidedly not been the case. Other explanations are required. Biologic influences that could compromise the reliability of polar n-alkane δD proxies as paleoprecipitation proxies might include the effects of continuous photosynthesis and transpiration during the Arctic growing season. Even more importantly, the 2H-enriched groundwater δD and 13C-enriched dissolved carbonate δ13C effects of high methane fluxes from water-saturated Cretaceous Arctic soils should be considered as another complicating factor. In this paper, we compiled sufficient data to now set the stage for a quantitative evaluation of methane fluxes from Cretaceous Arctic soils, the next step in this journey of discovery.

5. Conclusions

Our compilation of stable isotope proxies of Cretaceous Arctic paleoprecipitation posed a paradox. Results from the Late Cretaceous Prince Creek Formation in Alaska suggested an average water δD of −143‰ VSMOW and an average water δ18O of −24.1‰ VSMOW. Results from mid-Cretaceous units in the Canadian High Arctic yielded an average water δD composition of −106.5‰ VSMOW and an average δ18O composition of −22.1‰ VSMOW. Compositional fields of the distributions of water isotope δD and δ18O values from these Cretaceous Arctic deposits did not intersect with the Global Meteoric Water Line [87]. If taken at face value, they indicate that Cretaceous Arctic groundwaters were characterized by an apparent deuterium excess ranging from about 40 to 60 per mil. The processes responsible for this result are uncertain at this point but might include: (1) Cretaceous changes in the zonal patterns of evaporation and precipitation at lower latitudes, (2) the effects of continuous photosynthesis and transpiration that enriched Cretaceous Arctic leaf tissue waters in deuterium, or (3) the effects of large methane fluxes from Cretaceous Arctic soils that enriched their groundwaters in deuterium. We further suggested several possible scientific approaches to addressing this paradox through use of newer isotopic proxies that uniquely constrain the relevant paleoenvironmental parameters.

Supplementary Materials

The following supporting information can be downloaded at: https://www.mdpi.com/article/10.3390/geosciences12040143/s1, Table S1: Total organic carbon δ13C (TOC, ‰, VPDB) values and weight percent TOC (wt. % TOC); Table S2: n-Alkane concentrations (µg/g) from n-C16 to n-C37 alkane; Table S3: Pristane and phytane concentrations (µg/g); Table S4: Hopane concentrations (µg/g); Table S5: Conifer-derived diterpane and diterpene concentrations (µg/g); Table S6: Biomarker indices and summary concentrations (µg/g); Table S7: n-Alkane δ13C values (‰, VPDB), calculated leaf δ13C values by n-alkane (‰, VPDB), and calculated leaf fractionation (δ13Cleaf) values for n-C29 alkane (‰, VPDB); Table S8: Hopane δ13C values (‰, VPDB); Table S9: Conifer-derived diterpane δ13C values (‰, VPDB), average diterpane δ13C values (‰, VPDB), and calculated conifer leaf δ13C values (‰, VPDB); Table S10: n-Alkane δ2H values (‰, VSMOW) and calculated water δ2H values (‰, VSMOW) for n-C29 alkane.

Author Contributions

Conceptualization, G.A.L. and A.F.D.; methodology, A.F.D.; software, A.F.D.; validation, A.F.D., M.C.C. and K.S.; formal analysis, A.F.D., M.C.C. and K.S.; investigation, P.P.F., P.J.M., D.v.d.K., D.H. and M.S.; resources, A.F.D.; data curation, G.A.L. and A.F.D.; writing—original draft preparation, G.A.L., A.F.D., M.B.S., M.C.C., P.P.F., L.A.G. and P.J.M.; writing—review and editing, D.H. and M.S.; visualization, G.A.L., M.B.S., A.F.D. and P.P.F.; supervision, A.F.D.; project administration, A.F.D.; funding acquisition, A.F.D., P.P.F. and P.J.M. All authors have read and agreed to the published version of the manuscript.

Funding

Acknowledgment is made to the donors of the American Chemical Society Petroleum Research Fund for partial support of the research (PRF #60163-ND2 to Diefendorf).

Data Availability Statement

All new data reported in this article are included in Table 1 and Tables S1–S10. Other data included in this analysis appeared in earlier publications.

Acknowledgments

We dedicate this contribution to the memory of our late colleague Mark Pagani who first suggested the idea of coordinating measurements of hydrogen and oxygen isotopic tracers of Cretaceous Arctic paleoprecipitation in 2004. Field collection of samples from the Prince Creek Formation were supported by the U.S. National Science Foundation Office of Polar Programs grant OPP-4256636 to McCarthy, and BP Exploration Alaska, ConocoPhillips Alaska, The Alaska Division of Geological and Geophysical Surveys, and the Bureau of Economic Geology at the University of Texas in Austin to Flaig. We thank Claudia Schröder-Adams for providing the coal sample from Bylot Island and James Haggart of the Geological Survey of Canada for supporting her field logistics during the summer of 2017. Thanks to Bryan Killingsworth of USGS for technical review of an earlier draft, and two anonymous peer reviewers for constructive review comments and Sorin Petrescu for editorial assistance.

Conflicts of Interest

The authors declare no conflict of interest.

References

  1. Barron, E.J. Warm, equable Cretaceous: The nature of the problem. Earth Sci. Rev. 1983, 19, 305–338. [Google Scholar] [CrossRef]
  2. Ruddiman, W.F. Earth’s Climate: Past and Future, 2nd ed.; W. H. Freeman and Company: New York, NY, USA, 2008. [Google Scholar]
  3. Hay, W.W. Can humans force a return to a ‘Cretaceous’ climate? Sediment. Geol. 2011, 235, 5–26. [Google Scholar] [CrossRef]
  4. Foster, G.L.; Royer, D.L.; Lunte, D.J. Future climate forcing potentially without precedent in the last 420 million years. Nat. Commun. 2017, 8, 14845. [Google Scholar] [CrossRef] [PubMed] [Green Version]
  5. Poulsen, C.J. Palaeoclimate: A balmy Arctic. Nature 2004, 432, 814. [Google Scholar] [CrossRef] [PubMed]
  6. Upchurch, G.R., Jr.; Kiehl, J.; Shields, C.; Scherer, J.; Scotese, C. Latitudinal temperature gradients and high-latitude temperatures during the latest Cretaceous: Congruence of geologic data and climate models. Geology 2015, 43, 683–686. [Google Scholar] [CrossRef]
  7. Poulsen, C.J.; Tabor, C.; White, J.D. Long-term climate forcing by atmospheric oxygen concentrations. Science 2015, 348, 1238–1241. [Google Scholar] [CrossRef]
  8. Dansgaard, W. Stable isotopes in precipitation. Tellus 1964, 16, 436–468. [Google Scholar] [CrossRef]
  9. Pagani, M.; Pedentchouk, N.; Huber, M.; Sluijs, A.; Schouten, S.; Brinkhuis, H.; Damsté, J.S.S.; Dickens, G.R. Arctic hydrology during global warming at the Palaeocene/Eocene thermal maximum. Nature 2006, 442, 671–675. [Google Scholar] [CrossRef]
  10. Speelman, E.N.; Sewall, J.O.; Noone, D.; Huber, M.; Von der Heydt, A.S.; Damste, J.S.; Reichart, G.-J. Modeling the influence of a reduced equator-to-pole sea surface temperature gradient on the distribution of water isotopes in the Early/Middle Eocene. Earth Planet. Sci. Lett. 2010, 298, 57–65. [Google Scholar] [CrossRef] [Green Version]
  11. Winnick, M.J.; Caves, J.K.; Chamberlin, C.P. A mechanistic analysis of early Eocene latitudinal gradients of isotopes in precipitation. Geophys. Res. Lett. 2015, 42, 8216–8224. [Google Scholar] [CrossRef] [Green Version]
  12. Van Dijk, J.; Fernandez, A.; Bernasconi, S.M.; Rugenstein, J.K.C.; Passey, S.R.; White, T. Spatial pattern of super-greenhouse warmth controlled by elevated specific humidity. Nat. Geosci. 2020, 13, 739–744. [Google Scholar] [CrossRef]
  13. Ufnar, D.F.; Gonzalez, L.; Ludvigson, G.A.; Brenner, R.L.; Witzke, B.J. The mid-Cretaceous water bearer: Isotope mass balance quantification of the Albian hydrologic cycle. Palaeogeogr. Palaeoclimatol. Palaeoecol. 2020, 188, 51–71. [Google Scholar] [CrossRef]
  14. Ufnar, D.F.; Ludvigson, G.A.; Gonzalez, L.A.; Brenner, R.L.; Witzke, B.J. High latitude meteoric δ18O compositions: Paleosol siderite in the Middle Cretaceous Nanushuk Formation, North Slope, Alaska. Geol. Soc. Am. Bull. 2004, 116, 463–473. [Google Scholar] [CrossRef]
  15. Suarez, M.B.; González, L.A.; Ludvigson, G.A. Quantification of a Greenhouse Hydrologic Cycle from Equatorial to Polar Latitudes: The Mid-Cretaceous Water Bearer Revisited. Palaeogeogr. Palaeoclimatol. Palaeoecol. 2011, 307, 301–312. [Google Scholar] [CrossRef]
  16. Lollar, C.J. Probing a Paleoclimate Model-Data Misfit in Arctic Alaska from the Cretaceous Greenhouse World. Unpublished Master’s Thesis, University of Kansas, Lawrence, KS, USA, 2011. Available online: https://kuscholarworks.ku.edu/handle/1808/8373 (accessed on 31 January 2022).
  17. Suarez, C.A.; Ludvigson, G.A.; Gonzalez, L.; Fiorillo, A.; Flaig, P.; McCarthy, P.J. Use of Multiple Oxygen Isotope Proxies for Elucidating Arctic Cretaceous Palaeo-Hydrology. In Isotopic Studies in Cretaceous Research; Bojar, A.-V., Melinte-Dobrinescu, M.C., Smit, J., Eds.; Geological Society London, Special Publications: London, UK, 2013; Volume 382, pp. 185–202. [Google Scholar] [CrossRef] [Green Version]
  18. Salazar-Jaramillo, S.; McCarthy, P.J.; Ochoa, A.; Fowell, S.J.; Longstaffe, F.J. Paleoclimate reconstruction of the Prince Creek Formation, Arctic Alaska, during Maastrichtian global warming. Palaeogeogr. Palaeoclimatol. Palaeoecol. 2019, 532, 109265. [Google Scholar] [CrossRef]
  19. Ross, J.B.; Ludvigson, G.A.; Schröder-Adams, C.J.; Suarez, M.B. High Latitude Meteoric δ18O Compositions from the Cenomanian Bastion Ridge Formation, Axel Heiberg Island, Canadian Arctic Archipelago: A Palaeoclimate Proxy from the Sverdrup Basin. In Cretaceous Climate Events and Short-Term Sea-Level Changes; Wagreich, M., Hart, M.B., Sames, B., Yilmaz, I.O., Eds.; Geological Society, London, Special Publications: London, UK, 2020; Volume 498, pp. 57–74. [Google Scholar]
  20. Ludvigson, G.A.; González, L.A.; Metzger, R.A.; Witzke, B.J.; Brenner, R.L.; Murillo, A.; White, T.S. Meteoric sphaerosiderite lines and their use for paleohydrology and paleoclimatology. Geology 1998, 26, 1039–1042. [Google Scholar] [CrossRef]
  21. Richard, Z.D.; Pollard, D.; Kump, L.R.; White, T.S. Anomalously low δ18O values of high-latitude Permo-Triassic paleosol siderite. Palaeogeogr. Palaeoclimatol. Palaeoecol. 2018, 492, 26–40. [Google Scholar] [CrossRef]
  22. Ufnar, D.; González, L.; Ludvigson, G.; Brenner, R.; Witzke, B. Evidence for increased latent heat transport during the Cretaceous (Albian) greenhouse warming. Geology 2004, 32, 1049–1052. [Google Scholar] [CrossRef] [Green Version]
  23. Zhang, X.; Zwiers, F.W.; Hegerl, G.C.; Lambert, F.H.; Gillett, N.P.; Solomon, S.; Stott, P.A.; Nozawa, T. Detection of human influence on twentieth-century precipitation trends. Nature 2007, 448, 461–466. [Google Scholar] [CrossRef]
  24. Curry, R.; Dickson, B.; Yashayaev, I. A change in the freshwater balance of the Atlantic Ocean over the past four decades. Nature 2003, 426, 826–829. [Google Scholar] [CrossRef]
  25. Poulsen, C.J.; Pollard, D.; White, T.S.; Poulsen, C. General circulation model simulation of the δ18O content of continental precipitation in the middle Cretaceous: A model–proxy comparison. Geology 2007, 35, 199–202. [Google Scholar] [CrossRef]
  26. Super, J.R.; Chin, K.; Pagani, M.; Li, H.; Tabor, C.; Harwood, D.M.; Hull, P.M. Late Cretaceous climate in the Canadian Arctic: Multi-proxy constraints from Devon Island. Palaeogeogr. Palaeoclimatol. Palaeoecol. 2018, 504, 1–22. [Google Scholar] [CrossRef]
  27. Craig, H. Isotopic Variations in Meteoric Waters. Science 1961, 133, 1702–1703. [Google Scholar] [CrossRef] [PubMed]
  28. Suarez, C.A.; Gonzalez, L.A.; Ludvigson, G.A.; Kirkland, J.I.; Cifelli, R.L.; Kohn, M.J. Multi-taxa isotopic investigation of paleohydrology in the Lower Cretaceous Cedar Mountain Formation, eastern Utah, U.S.A.: Deciphering effects of the Nevadaplano plateau on regional climate. J. Sediment. Res. 2014, 84, 975–987. [Google Scholar] [CrossRef] [Green Version]
  29. Van Dijk, J.; Fernandez, A.; Storck, J.C.; White, T.S.; Lever, M.; Müller, I.A.; Bishop, S.; Seifert, R.F.; Driese, S.G.; Krylov, A.; et al. Experimental calibration of clumped isotopes in siderite between 8.5 and 62 °C and its application as paleo-thermometer in paleosols. Geochim. Cosmochim. Acta 2019, 254, 1–20. [Google Scholar] [CrossRef]
  30. Flaig, P.P.; McCarthy, P.J.; Fiorillo, A.R. A Tidally Influenced, High-Latitude Coastal-Plain: The Upper Cretaceous (Maastrichtian) Prince Creek Formation, North Slope, Alaska. In From River to Rock Record: The Preservation of Fluvial Sediments and Their Subsequent Interpretation; Davidson, S., Leleu, S., North, C., Eds.; SEPM Special Publication: Broken Arrow, OK, USA, 2011; Volume 97, pp. 233–264. [Google Scholar]
  31. Flaig, P.P.; McCarthy, P.J.; Fiorillo, A.E. Anatomy, Evolution, and Paleoenvironmental Interpretation of an Ancient Arctic Coastal Plain: Integrated Paleopedology and Palynology from the upper Cretaceous (Maastrichtian) Prince Creek Formation, North Slope, Alaska, USA. In New Frontiers in Paleopedology and Terrestrial Paleoclimatology, Paleosols and Soil Surface Analogue Systems; Driese, S.G., Nordt, L.C., Eds.; SEPM Special Publication: Broken Arrow, OK, USA, 2013; Volume 114, pp. 179–230. [Google Scholar]
  32. Bonelli, J.R.; Flaig, P.P. Quantitative biofacies analysis to identify relationships and refine controls on paleosol development, Prince Creek Formation, North slope Alaska, USA. Geosciences 2021, 11, 460. [Google Scholar] [CrossRef]
  33. Jaramillo, S.S.; McCarthy, P.J.; Trainor, T.P.; Fowell, S.J.; Fiorillo, A.R. Origin of clay minerals in alluvial paleosols, Prince Creek Formation, North Slope, Alaska, U.S.A.: Influence of volcanic ash on pedogenesis in the Late Cretaceous Arctic. J. Sediment. Res. 2015, 85, 192–208. [Google Scholar] [CrossRef]
  34. Flaig, P.; Fiorillo, A.; McCarthy, P.J. Dinosaur-bearing hyperconcentrated flows of Cretaceous Arctic Alaska: Recurring catastrophic event beds on a distal paleopolar coastal plain. PALAIOS 2014, 29, 594–611. [Google Scholar] [CrossRef]
  35. Van der Kolk, D.; Flaig, P.; Hasiotis, S.T. Paleoenvironmental reconstruction of a Late Cretaceous, muddy, river-dominated polar deltaic system: Schrader Bluff—Prince Creek Formation transition, Shivugak Bluffs, North Slope of Alaska, U.S.A. J. Sediment. Res. 2015, 85, 903–936. [Google Scholar] [CrossRef]
  36. Flaig, P.P.; Van der Kolk, D.A. Depositional Environments of the Prince Creek Formation along the East Side of the Toolik River, Sagavanirktok Quadrangle, North Slope, Alaska. Alaska Division of Geological & Geophysical Surveys Preliminary Interpretive Report; DGGS PIR 2015-4; Alaska Division of Geological & Geophysical Surveys: Fairbanks, AK, USA, 2015. [Google Scholar] [CrossRef] [Green Version]
  37. Miall, A.D.; Balkwill, H.R.; Hopkins, W.S., Jr. Cretaceous and Tertiary Sediments of Eclipse trough, Bylot Island Area, Arctic Canada, and Their Regional Settings: Geological Survey of Canada; Paper 79–23; Energy, Mines and Resources Canada: Nunavut, NC, Canada, 1980; 20p. [Google Scholar]
  38. Ludvigson, G.A.; González, L.A.; Fowle, D.A.; Roberts, J.A.; Driese, S.G.; Villarreal, M.A.; Smith, J.J.; Suarez, M.B. Paleoclimatic applications and modern process studies of pedogenic siderite. In New Frontiers in Paleopedology and Terrestrial Paleoclimatology; Driese, S.G., Nordt, L.C., McCarthy, P.J., Eds.; SEPM Special Publication: Broken Arrow, OK, USA, 2013; Volume 104, pp. 79–87. [Google Scholar] [CrossRef] [Green Version]
  39. Schröder-Adams, C.; Herrle, J.O.; Embry, A.F.; Haggart, J.W.; Galloway, J.; Pugh, A.T.; Harwood, D.M. Aptian to Santonian foraminiferal biostratigraphy and paleoenvironmental change in the Sverdrup Basin as revealed at Glacier Fiord, Axel Heiberg Island, Canadian Arctic Archipelago. Palaeogeogr. Palaeoclimatol. Palaeoecol. 2014, 413, 81–100. [Google Scholar] [CrossRef] [Green Version]
  40. Galloway, J.M.; Sweet, A.R.; Pugh, A.; Schröder-Adams, C.J.; Swindles, G.T.; Haggart, J.W.; Embry, A.F. Correlating middle Cretaceous palynological records from the Canadian High Arctic based on a section from the Sverdrup Basin and samples from the Eclipse Trough. Palynology 2012, 36, 277–302. [Google Scholar] [CrossRef]
  41. SSchlanser, K.M.; Diefendorf, A.F.; West, C.K.; Greenwood, D.R.; Basinger, J.F.; Meyer, H.W.; Lowe, A.J.; Naake, H.H. Conifers are a major source of sedimentary leaf wax n-alkanes when dominant in the landscape: Case studies from the Paleogene. Org. Geochem. 2020, 147, 104069. [Google Scholar] [CrossRef]
  42. Peters, K.E.; Walters, C.C.; Moldowan, J.M. The Biomarker Guide. In Biomarkers and Isotopes in Petroleum Exploration and Earth History, 2nd ed.; Cambridge University Press: Cambridge, UK, 2005; Volume 2. [Google Scholar]
  43. Larson, T.E.; Heikoop, J.M.; Perkins, G.; Chipera, S.J.; Hess, M.A. Pretreatment technique for siderite removal for organic carbon isotope and C:N ratio analysis in geological samples. Rapid Commun. Mass Spectrom. 2008, 22, 865–872. [Google Scholar] [CrossRef] [PubMed]
  44. Coplen, T.B.; Brand, W.A.; Gehre, M.; Gröning, M.; Meijer, H.A.J.; Toman, B.; Verkouteren, R.M. New guidelines for δ13C measurements. Anal. Chem. 2006, 78, 2439–2441. [Google Scholar] [CrossRef] [PubMed] [Green Version]
  45. Ficken, K.J.; Li, B.; Swain, D.L.; Eglinton, G. An n-alkane proxy for the sedimentary input of submerged/floating freshwater aquatic macrophytes. Org. Geochem. 2000, 31, 745–749. [Google Scholar] [CrossRef]
  46. Marzi, R.; Torkelson, B.E.; Olson, R.K. A revised carbon preference index. Org. Geochem. 1993, 20, 1303–1306. [Google Scholar] [CrossRef]
  47. Bray, E.E.; Evans, E.D. Distribution of n-paraffins as a clue to recognition of source beds. Geochim. Cosmochim. Acta 1961, 22, 2–15. [Google Scholar] [CrossRef]
  48. Eglinton, G.; Hamilton, R.J. Leaf epicuticular waxes. Science 1967, 156, 1322–1335. [Google Scholar] [CrossRef]
  49. Freeman, K.H.; Pancost, R.D. 12.15—Biomarkers for terrestrial plants and climate. In Treatise on Geochemistry, 2nd ed.; Holland, H.D., Turekian, K.K., Eds.; Elsevier: Oxford, UK, 2014; pp. 395–416. [Google Scholar]
  50. Diefendorf, A.F.; Freimuth, E.J. Extracting the most from terrestrial plant-derived n-alkyl lipids and their carbon isotopes from the sedimentary record: A review. Org. Geochem. 2017, 103, 1–21. [Google Scholar] [CrossRef] [Green Version]
  51. Diefendorf, A.F.; Leslie, A.B.; Wing, S.L. A phylogenetic analysis of conifer diterpenoids and their carbon isotopes for chemotaxonomic applications. Org. Geochem. 2019, 127, 50–58. [Google Scholar] [CrossRef]
  52. Schlanser, K.; Diefendorf, A.F.; Greenwood, D.; Mueller, K.E.; West, C.K.; Lowe, A.J.; Basinger, J.F.; Currano, E.D.; Flynn, A.G.; Fricke, H.C.; et al. On geologic timescales, plant carbon isotope fractionation responds to precipitation similarly to modern plants and has a small negative correlation with pCO2. Geochim. Cosmochim. Acta 2020, 270, 264–281. [Google Scholar] [CrossRef]
  53. Diefendorf, A.F.; Mueller, K.E.; Wing, S.L.; Koch, P.L.; Freeman, K.H. Global patterns in leaf 13C discrimination and implications for studies of past and future climate. Proc. Natl. Acad. Sci. USA 2010, 107, 5738–5743. [Google Scholar] [CrossRef] [PubMed] [Green Version]
  54. Kohn, M.J. Carbon isotope compositions of terrestrial C3 plants as indicators of (paleo)ecology and (paleo)climate. Proc. Natl. Acad. Sci. USA 2010, 107, 19691–19695. [Google Scholar] [CrossRef] [PubMed] [Green Version]
  55. Barral, A.; Gomez, B.; Legendre, S.; Lécuyer, C. Evolution of the carbon isotope composition of atmospheric CO2 throughout the Cretaceous. Palaeogeogr. Palaeoclimatol. Palaeoecol. 2017, 471, 40–47. [Google Scholar] [CrossRef]
  56. Inglis, G.N.; Naafs, B.D.A.; Zheng, Y.; Schellekens, J.; Pancost, R.D. δ13C values of bacterial hopanoids and leaf waxes as tracers for methanotrophy in peatlands. Geochim. Cosmochim. Acta 2019, 260, 244–256. [Google Scholar] [CrossRef] [Green Version]
  57. McFarlin, J.M.; Axford, Y.; Masterson, A.L.; Osburn, M.R. Calibration of modern sedimentary δ2H plant wax-water relationships in Greenland lakes. Quat. Sci. Rev. 2019, 225, 105978. [Google Scholar] [CrossRef]
  58. Sachse, D.; Billault, I.; Bowen, G.J.; Chikaraishi, Y.; Dawson, T.E.; Feakins, S.J.; Freeman, K.H.; Magill, C.R.; McInerney, F.A.; Van der Meer, M.T.; et al. Molecular paleohydrology: Interpreting the hydrogen-isotopic composition of lipid biomarkers from photosynthesizing organisms. Annu. Rev. Earth Planet. Sci. 2012, 40, 221–249. [Google Scholar] [CrossRef] [Green Version]
  59. Bowen, G.J. The Online Isotopes in Precipitation Calculator, Version 2.2. 2009. Available online: https://wateriso.utah.edu/waterisotopes/pages/data_access/oipc_citation.html (accessed on 6 June 2021).
  60. Bowen, G.J.; Cai, Z.; Fiorella, R.P.; Putman, A.L. Isotopes in the Water Cycle: Regional- to Global-Scale Patterns and Applications. Annu. Rev. Earth Planet. Sci. 2019, 47, 453–479. [Google Scholar] [CrossRef] [Green Version]
  61. Fernandez, A.; Van Dijk, J.; Müller, I.A.; Bernasconi, S.M. Siderite acid fractionation factors for sealed and open vessel digestions at 70 and 100 °C. Chem. Geol. 2016, 444, 180–186. [Google Scholar] [CrossRef] [Green Version]
  62. Van Dijk, J.; Fernandez, A.; Müller, I.A.; Lever, M.A.; Bernasconi, S.M. Oxygen isotope fractionation in the siderite-water system between 8.5 and 62 °C. Geochim. Cosmochim. Acta 2018, 220, 535–551. [Google Scholar] [CrossRef]
  63. Spicer, R.A.; Herman, A.B. The Late Cretaceous environment of the Arctic: A quantitative reassessment based on plant fossils. Palaeogeogr. Palaeoclimatol. Palaeoecol. 2010, 295, 423–442. [Google Scholar] [CrossRef] [Green Version]
  64. Forster, A.; Schouten, S.; Baas, M.; Damste, J.S. Mid-Cretaceous (Albian–Santonian) sea surface temperature record of the tropical Atlantic Ocean. Geology 2007, 35, 919–922. [Google Scholar] [CrossRef]
  65. Diefendorf, A.F.; Sberna, D.T.; Taylor, D.W. Effect of thermal maturation on plant-derived terpenoids and leaf wax n-alkyl components. Org. Geochem. 2015, 89–90, 61–70. [Google Scholar] [CrossRef] [Green Version]
  66. Schimmelmann, A.; Sessions, A.L.; Mastalerz, M. Hydrogen Isotopic (D/H) Composition of Organic Matter During Diagenesis and Thermal Maturation. Annu. Rev. Earth Planet. Sci. 2006, 34, 501–533. [Google Scholar] [CrossRef] [Green Version]
  67. Diefendorf, A.F.; Freeman, K.H.; Wing, S.L. A comparison of terpenoid and leaf fossil vegetation proxies in Paleocene and Eocene Bighorn Basin sediments. Org. Geochem. 2014, 71, 30–42. [Google Scholar] [CrossRef]
  68. Diefendorf, A.F.; Leslie, A.B.; Wing, S. Leaf wax composition and carbon isotopes vary among major conifer groups. Geochim. Cosmochim. Acta 2015, 170, 145–156. [Google Scholar] [CrossRef] [Green Version]
  69. Craig, H.; Gordon, L.I. Deuterium and Oxygen-18 Variations in the Ocean and the Marine Atmosphere; Tongiorgi, E. Ed. In Proceedings of the Conference on Stable Isotopes in Oceanographic Studies and Paleotemperatures, Pisa, Italy, 26–30 July 1965; pp. 9–130. [Google Scholar]
  70. Gat, J.R.; Bowser, C.J.; Kendall, C. The contribution of evaporation from the Great Lakes to the continental atmosphere: Estimate based on stable isotope data. Geophys. Res. Lett. 1994, 21, 557–560. [Google Scholar] [CrossRef]
  71. Good, S.P.; Mallia, D.V.; Lin, J.C.; Bowen, G.J. Stable isotope analysis of precipitation samples obtained via crowdsourcing reveals the spatiotemporal evolution of Superstorm Sandy. PLoS ONE 2014, 9, e91117. [Google Scholar] [CrossRef] [Green Version]
  72. Cropper, S.; Solander, K.; Newman, B.D.; Tuinenburg, O.A.; Staal, A.; Theeuwen, J.J.E.; Xu, C. Comparing deuterium excess to large-scale precipitation recycling models in the tropics npj. Clim. Atmos. Sci. 2021, 4, 60. [Google Scholar] [CrossRef]
  73. Mellat, M.; Bailey, H.; Mustonen, K.-R.; Marttila, H.; Klein, E.S.; Gribanov, K.; Bret-Harte, M.S.; Chupakov, A.V.; Divine, D.V.; Else, B.; et al. Hydroclimate controls on the isotopic (d18O, d2H, d-excess) traits of Pan Arctic summer rainfall events. Front. Earth Sci. 2021, 9, 651731. [Google Scholar] [CrossRef]
  74. Bailey, A.; Posmentier, E.; Feng, X. Patterns of Evaporation and Precipitation Drive Global Isotopic Changes in Atmospheric Moisture. Geophys. Res. Lett. 2018, 45, 7093–7101. [Google Scholar] [CrossRef] [Green Version]
  75. Yang, H.; Pagani, M.; Briggs, D.E.G.; Equiza, M.A.; Jagels, R.; Leng, Q.; Lepage, B.A. Carbon and hydrogen isotope fractionation under continuous light: Implications for paleoenvironmental interpretations of the High Arctic during Paleogene warming. Oecologia 2009, 160, 461–470. [Google Scholar] [CrossRef] [PubMed]
  76. Yang, H.; Liu, W.; Leng, Q.; Hren, M.T.; Pagani, M. Variation in n-alkane δD values from terrestrial plants at high latitude: Implications for paleoclimate reconstruction. Org. Geochem. 2011, 42, 283–288. [Google Scholar] [CrossRef]
  77. Talbot, M.R.; Kelts, K. Primary and diagenetic carbonates in the anoxic sediments of Lake Bosumtwi, Ghana. Geology 1986, 14, 912–916. [Google Scholar] [CrossRef]
  78. Mozley, P.S.; Wersin, P. Isotopic composition of siderite as an indicator of depositional environment. Geology 1992, 20, 817–820. [Google Scholar] [CrossRef]
  79. Whiticar, M.J. Carbon and hydrogen isotope systematics of bacterial formation and oxidation of methane. Chem. Geol. 1999, 161, 291–314. [Google Scholar] [CrossRef]
  80. Schoell, M. The hydrogen and carbon isotopic composition of methane from natural gases of various origins. Geochim. Cosmochim. Acta 1980, 44, 649–661. [Google Scholar] [CrossRef]
  81. North, J.C.; Frew, R.D.; Van Hale, R. Can stable isotopes be used to monitor landfill leachate impact on surface waters? J. Geophys. Explor. 2006, 88, 49–53. [Google Scholar] [CrossRef]
  82. Andrei, F.; Barbieri, M.; Sappa, G. Application of 2H and 18O isotopes for tracing municipal solid waste landfill contamination of groundwater: Two Italian case histories. Water 2021, 13, 1065. [Google Scholar] [CrossRef]
  83. Castañeda, S.; Sucgang, R.; Almoneda, R.; Mendoza, N.; David, C. Environmental isotopes and major ions for tracing leachate contamination from a municipal landfill in Metro Manila, Philippines. J. Environ. Radioact. 2012, 110, 20–37. [Google Scholar] [CrossRef]
  84. Kulongoski, J.T.; McMahon, P.B.; Land, M.T.; Wright, M.T.; Johnson, T.A.; Landon, M.K. Origin of methane and sources of high concentrations in Los Angeles groundwater. J. Geophys. Res. Biogeosci. 2018, 123, 818–831. [Google Scholar] [CrossRef]
  85. Siegel, D.I.; Chanton, J.R.; Glaser, P.H.; Chasar, L.S.; Rosenberry, D. Estimating methane production rates in bogs and landfills by deuterium enrichment of pore water: Global Biogeochem. Cycles 2001, 15, 967–975. [Google Scholar] [CrossRef]
  86. Andrzejewski, K.; Tabor, N.J. Paleoenvironmental and paleoclimatic reconstruction of Cretaceous (Aptian-Cenomanian) terrestrial formations of Texas and Oklahoma using phyllosilicates. Palaeogeogr. Palaeoclimatol. Palaeoecol. 2020, 543, 109491. [Google Scholar] [CrossRef]
  87. Rozanski, K.; Araguás-Araguás, L.; Gonfiantini, R. Isotopic patterns in modern global precipitation. Climate Change in Continental Isotopic Records. Am. Geophys. Union Monogr. 1993, 78, 1–36. [Google Scholar]
Figure 1. Sample locations and stratigraphic features of sample horizons from the Prince Creek Formation in Alaska. (A) Sample locations in bluffs along the Colville River. (B) Representative stratigraphic column and paleoenvironmental interpretations for the 06SH sample locality along the Colville River. (C) Sample locations in bluffs along the Toolik River. (D) Sample locations in bluffs along the Sagavanirktok River. Figure modified from [31,32].
Geosciences 12 00143 g001
Figure 2. Sample locations from selected islands in the Canadian High Arctic Archipelago. (1) Coal sample from the Cenomanian Hassel Formation from the Twosnout Creek section [37,40] on Bylot Island. (2) Paleosol siderite sample from the Cenomanian Bastion Ridge Formation from the Glacier Fiord section [19,39] on Axel Heiberg Island. (3) Carbonaceous mudstone samples of the Turonian Kanguk Formation from the Eidsbotn and Viks Fiord graben sections [26] on Devon Island. Graphic adapted from [40].
Geosciences 12 00143 g002
Figure 3. Ranges of carbon isotopic compositions of n-alkanes extracted from carbonaceous mudstones of the Prince Creek Formation in Alaska. Box and whisker diagram shows the mean, standard deviation, and full range of δ13C values from individual biomarkers. See Tables S7–S9.
Geosciences 12 00143 g003
Figure 4. Hydrogen and oxygen isotope plot of estimated ranges of meteoric water isotope compositions from super greenhouse worlds of the ancient High Arctic. (A) Results compiled for this study from the Prince Creek Formation. The single dot represents the average composition of δ18O (estimated from dinosaur tooth enamel phosphate, pedogenic siderite, and pedogenic smectite clays) and of δD (estimated from n-alkanes extracted from carbonaceous mudstones). The open green box surrounding the dot is the 1 sigma of the dataset and the whiskers are the full range of δ18O and δD data. The modern Global Meteoric Water Line (black line) and local meteoric water line for Alaska Rozanski, K. et al., 1993 are shown. (B) Results from the Prince Creek Formation were compared with other Arctic Cretaceous units from Axel Heiberg Island [19] and Bylot Island of the Canadian High Arctic (Sverdrup Basin and Eclipse Trough) represented by the dark green filled box, and with δD-only data from the Kanguk Formation on Devon Island represented by the gray double-sided arrow [26]. These Cretaceous data ranges were compared with δD and δ18O data compiled from Late Paleocene to Early Eocene Arctic localities [12] represented by the orange filled box.
Geosciences 12 00143 g004
Table 1. Hydrogen isotope data from organic biomarkers from the Hassel Formation on Bylot Island.
Organic CompoundOrganic δD vs. VSMOWWater δD vs. VSMOW
n-C25−227.1 ± 3.1‰−119.1 ± 25‰
n-C27−221.4 ± 3.1‰−113.4 ± 25‰
n-C29−202.7 ± 3.1‰−94.7 ± 25‰
n-C31−195.0 ± 3.1‰−87 ± 25‰
n-C33−226.4 ± 3.1‰−118.4 ± 25‰
Publisher’s Note: MDPI stays neutral with regard to jurisdictional claims in published maps and institutional affiliations.

