Article

Mechanics of Rainfall-Induced Landslides after a Prolonged Dry Period Based on Laboratory Tests and Numerical Models Incorporating Soil-Water Characteristic Curves

by
Kishan Bhadiyadra
* and
Dominic E. L. Ong
School of Engineering and Built Environment, Griffith University, Brisbane, QLD 4111, Australia
*
Author to whom correspondence should be addressed.
Geosciences 2024, 14(7), 174; https://doi.org/10.3390/geosciences14070174
Submission received: 27 March 2024 / Revised: 2 June 2024 / Accepted: 17 June 2024 / Published: 24 June 2024
(This article belongs to the Section Geomechanics)

Abstract

:
In India, particularly within its Northeastern territories, landslides triggered by rainfall following dry periods are a major concern, consistently causing extensive damage to both life and infrastructure. This study focuses on mitigating their impact through preemptive measures, with an emphasis on analyzing slope stability to determine critical intervention points. The investigation includes experimental tests on soil samples to assess key parameters, such as soil matric suction and unconfined compressive strength, alongside an analysis of slope failures during the 2017 monsoon in Mizoram’s Lunglei district. Employing Soil-Water Characteristic Curves (SWCC) derived from ASTM D5298-10 standards and a microwave drying technique for preparing soil samples, the research evaluates the condition of the slopes before and after monsoonal rains. This study utilizes a blend of numerical modeling and empirical laboratory investigations to explore the factors contributing to slope instability. The findings underscore the necessity of advanced landslide warning systems, suggesting that a deeper understanding of rainfall-induced slope failures could significantly enhance disaster preparedness and reduce potential damages.

1. Introduction

Research in geomorphology shows that soil does not need to be fully saturated to trigger landslides or dam failures, challenging the belief that saturation increases failure risks [1,2]. Landslides are common in the Himalayas and Northeast India, posing serious threats to both infrastructure and lives due to their sudden and rapid movement [3,4,5]. Notably, the 2012 landslides in Rohtang Pass and the 2017 events in Mizoram caused significant damage, highlighting the urgent need for improved understanding and mitigation strategies for these natural hazards [6,7,8,9].
Changes in soil parameters like matric suction due to moisture are crucial for understanding rainfall-induced slope failures [10,11]. This study emphasizes the role of unsaturated soil mechanics in assessing factors that influence slope stability and its importance in slope engineering practices [8].
Figure 1a defines the vadose zone, which extends from the earth’s surface to the water table, as crucial for measuring the SWCC in labs and applying them in engineering. This zone experiences varying moisture levels due to weather changes, affecting soil mechanics. Figure 1b illustrates how factors like evaporation and rainfall influence soil moisture movements, altering pore water pressure and creating a trumpet-shaped curve representing soil suction changes over time.
The SWCC illustrates the relationship between soil water content and suction, typically displayed on a graph with water content (gravimetric, volumetric, or saturation degree) on the vertical axis and matric suction on the logarithmic horizontal axis, clarifying their relationship [12,13].
Figure 2 shows the water retention curve, illustrating the relationship between soil saturation and negative pore water pressure from studies on unsaturated soils. This curve is essential for understanding changes in soil volume, strength, and hydraulic properties.
Landslides, driven by gravity, rapidly move soil and rock downhill, often triggered by rainfall, especially during monsoons in North-East India [7,11,14]. Rainwater increases pore pressure, reducing soil strength and causing slope failures. Treatments like microbial-induced calcite precipitation can stabilize slopes [14,15]. Mizoram’s terrain, climate, and human activities contribute to frequent landslides, causing significant damage and disruptions [7,16].
Soil characteristics greatly affect groundwater levels and stability, particularly in unsaturated soils [17,18]. Uniform drying techniques, like microwave drying, are essential for accurate research [12]. Rainfall intensity and soil properties impact slope stability, highlighting the importance of predictive modeling [19,20]. Setting rainfall thresholds and using stabilization measures are vital for slope integrity [21,22]. Continuous monitoring and real-time assessments are crucial for managing construction and environmental risks [19,23].
Mizoram, part of the Tripura-Mizoram Miogeosyncline in the Assam-Arakan basin, has rock formations from the Palaeogene-Neogene period, trending North–South with dips of 20° to 50°. Rock slope stability is evaluated using graphical charts derived from field surveys, sampling, and geotechnical tests, incorporating geotechnical indices, weathering effects, and in situ stress conditions [5,7,11,15,16].
Table 1 shows the landslide hazard classes based on severity and their corresponding area of Mizoram.
In Mizoram, the primary causes of slope failures are predominantly associated with surface factors and hydro-environmental conditions rather than subsurface factors, seismic activities, or volcanic events, which are rare or non-existent in this region of India [9,24].
Mizoram, part of the Himalayan mobile belt, experiences significant neo-tectonic activity, making it prone to slope failures, especially near active fault zones [3,4]. The region’s young geological setting consists mainly of unstable, soft sedimentary rocks, which are susceptible to landslides during intense rainfall [6,16]. Figure 3a shows that the Northeast region of India has the highest number of landslides [7,15]. Figure 3b maps landslides in Mizoram, highlighting the Lunglei district as being particularly affected. Steep slopes and poor land use practices further increase landslide frequency in the region [9].
Landslide susceptibility mapping (LSM) is vital for risk assessment and prevention due to the increasing frequency of landslides globally [8,25]. However, refined LSM at the township level faces challenges like limited recorded landslides and varying factors [25]. Remote sensing (RS) techniques are crucial for studying landslides, enabling large-scale monitoring and data capture [25]. The literature highlights their use in detecting, monitoring, and predicting landslides through various instruments and image analysis techniques, including optical and microwave sensing, to quantify geological and geotechnical changes. These methods are essential for disaster management [9,25].
Mizoram, known as India’s landslide capital, frequently experiences landslides, especially in Lunglei and Aizawl [9,11]. These districts are vulnerable due to steep slopes, fragile geology, and heavy monsoonal rains. In 2017, intense rainfall caused about 600 deaths and damaged over 5000 homes, emphasizing the need for effective land management and preparedness strategies [9,11].
Rain-induced debris flows cause 93.19% of landslides, highlighting the need for targeted mitigation [5,26]. Key strategies include better drainage systems, strict land use policies, and slope stabilization [24,27]. Advancements in remote sensing and GIS can improve early warning systems and disaster response [25,26].
Figure 4 shows conditions before and after shallow transitional landslides around Lunglei district, Mizoram, captured by the RESOURCESAT 2 LISS IV Mx satellite in 2013 and 2017 [9]. This case study analyzes the connection between substantial monsoonal rainfall and landslides using comprehensive rainfall data from the Mizoram Meteorological Department [9].
This study investigates the SWCC of natural CI soils by measuring matric suction with the contact filter paper technique across different densities and saturation levels. It aims to enhance understanding of unsaturated soil behavior, particularly in slope stability contexts. The research will also evaluate shear strength parameters through unconfined compressive tests on microwave-dried samples, as per ASTM standards, to establish relationships amongst soil unsaturated shear strength, density, and saturation levels.

2. Material Properties

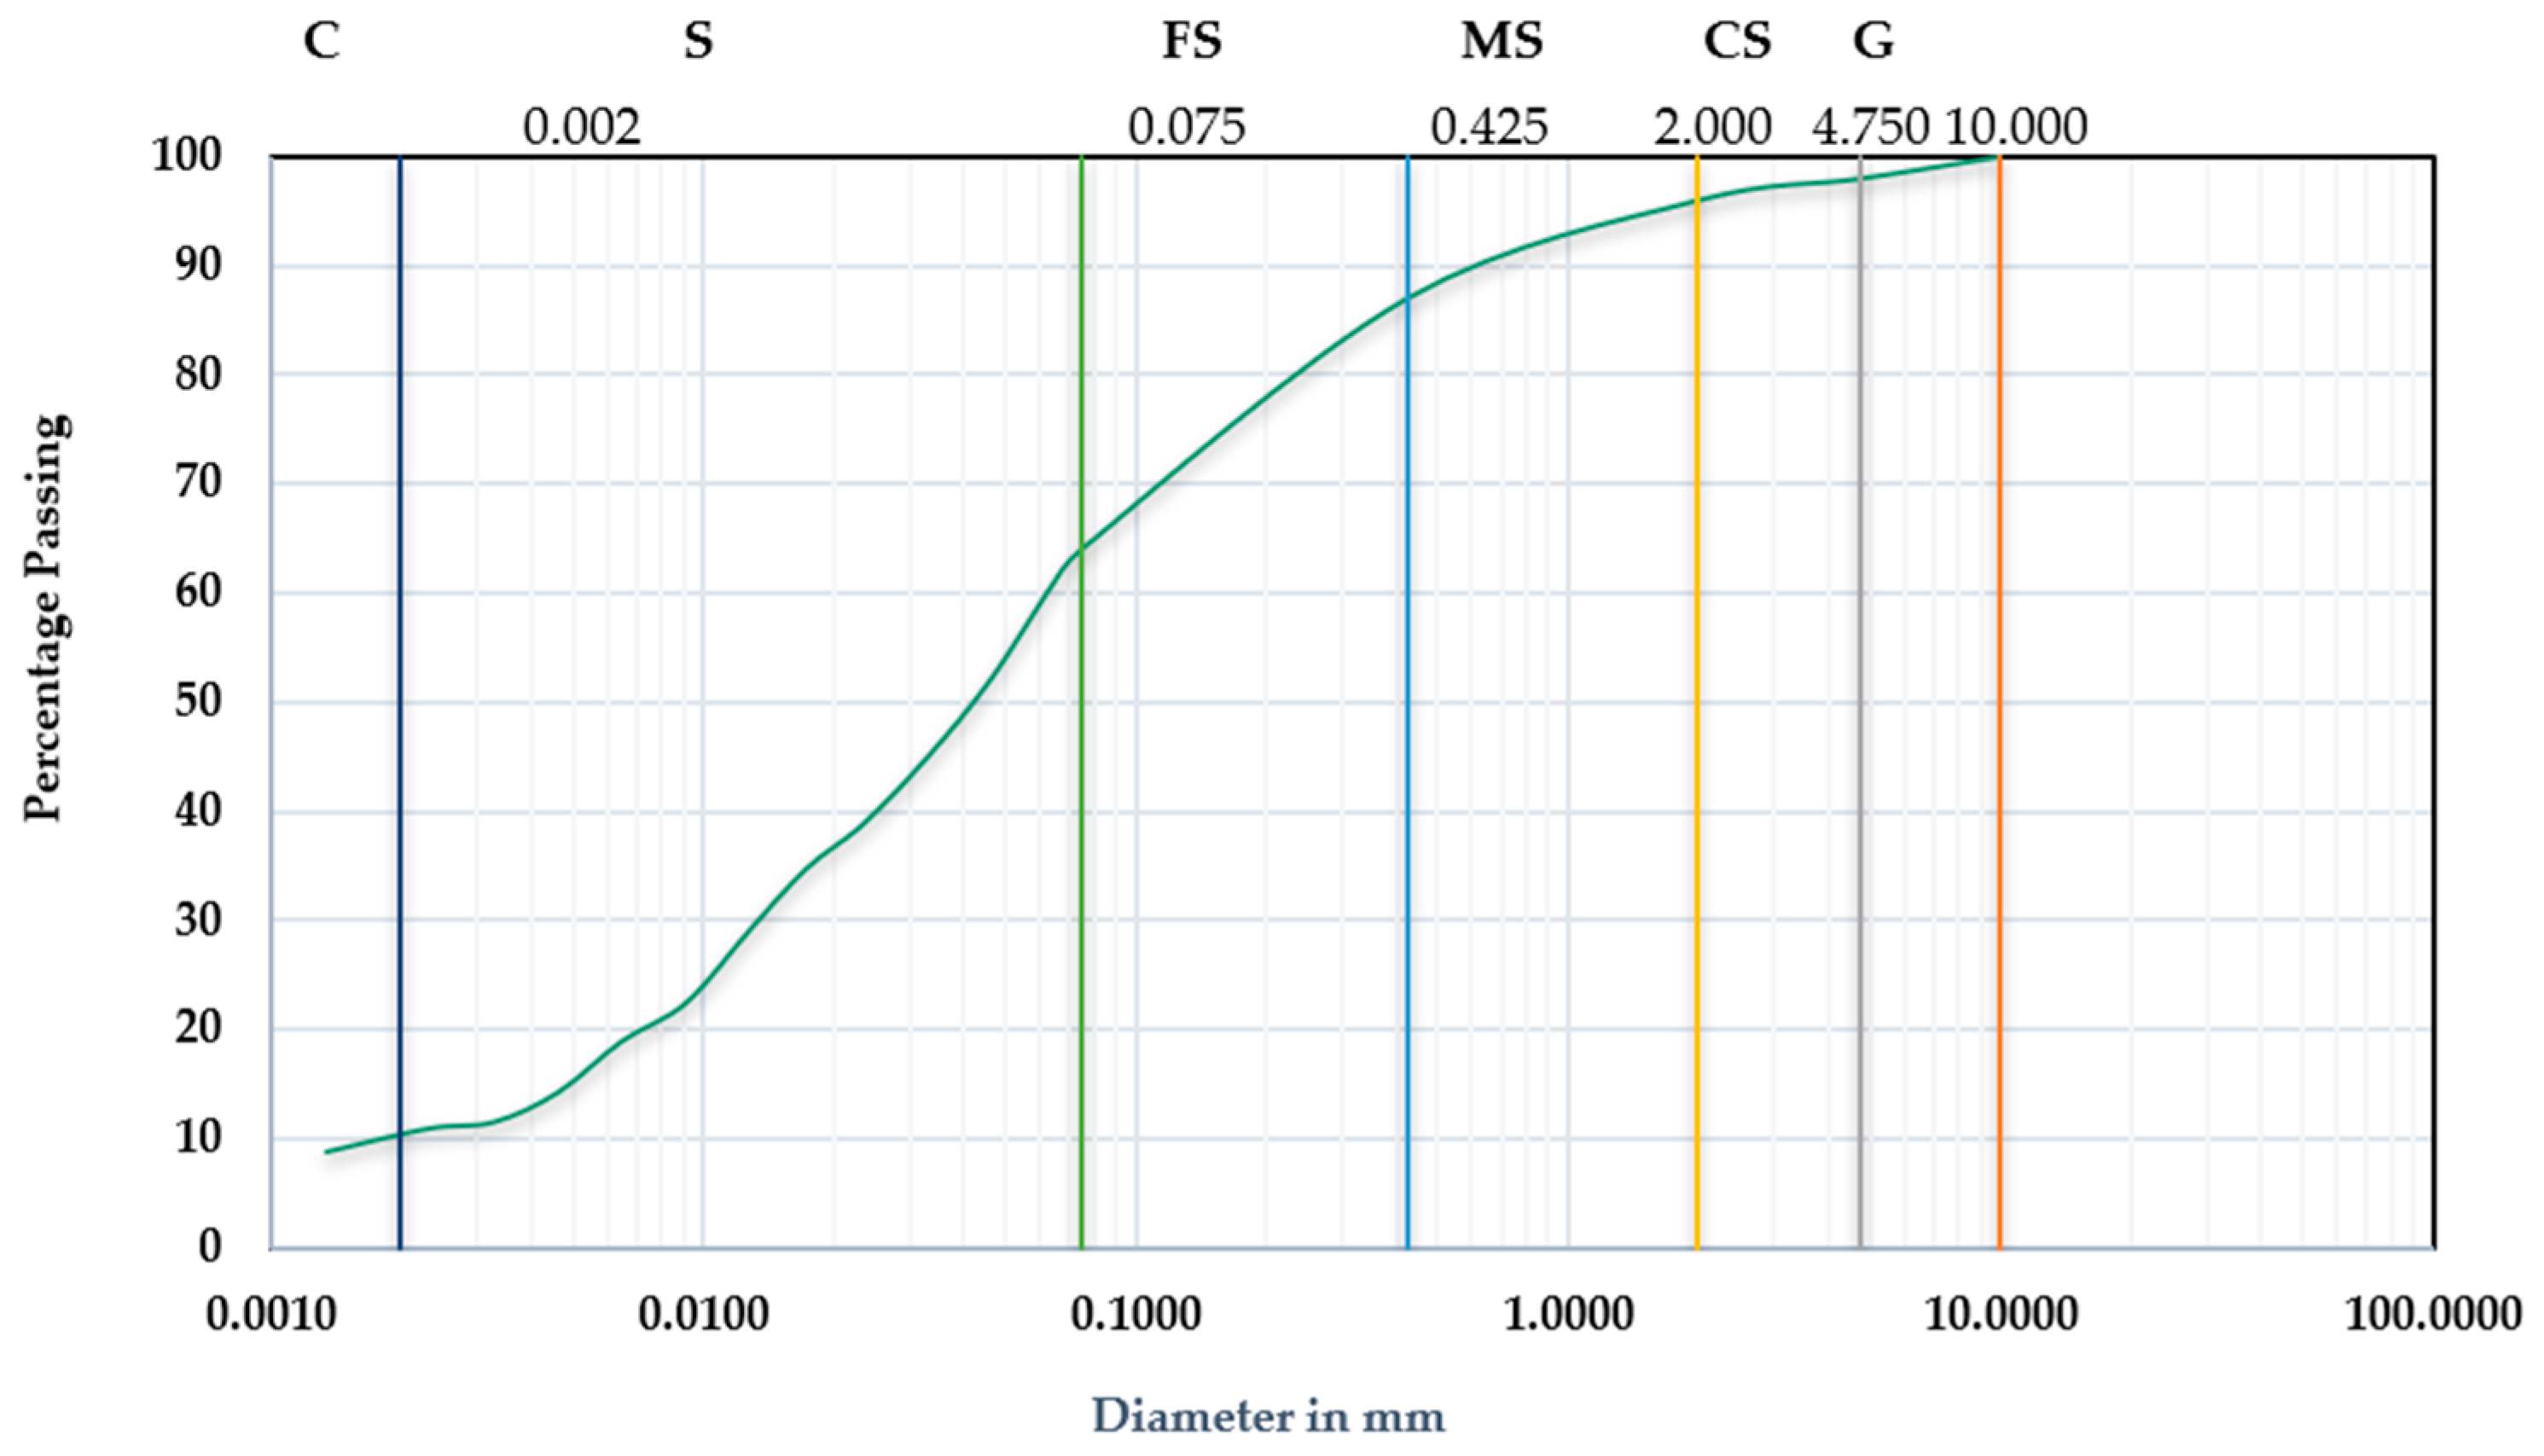
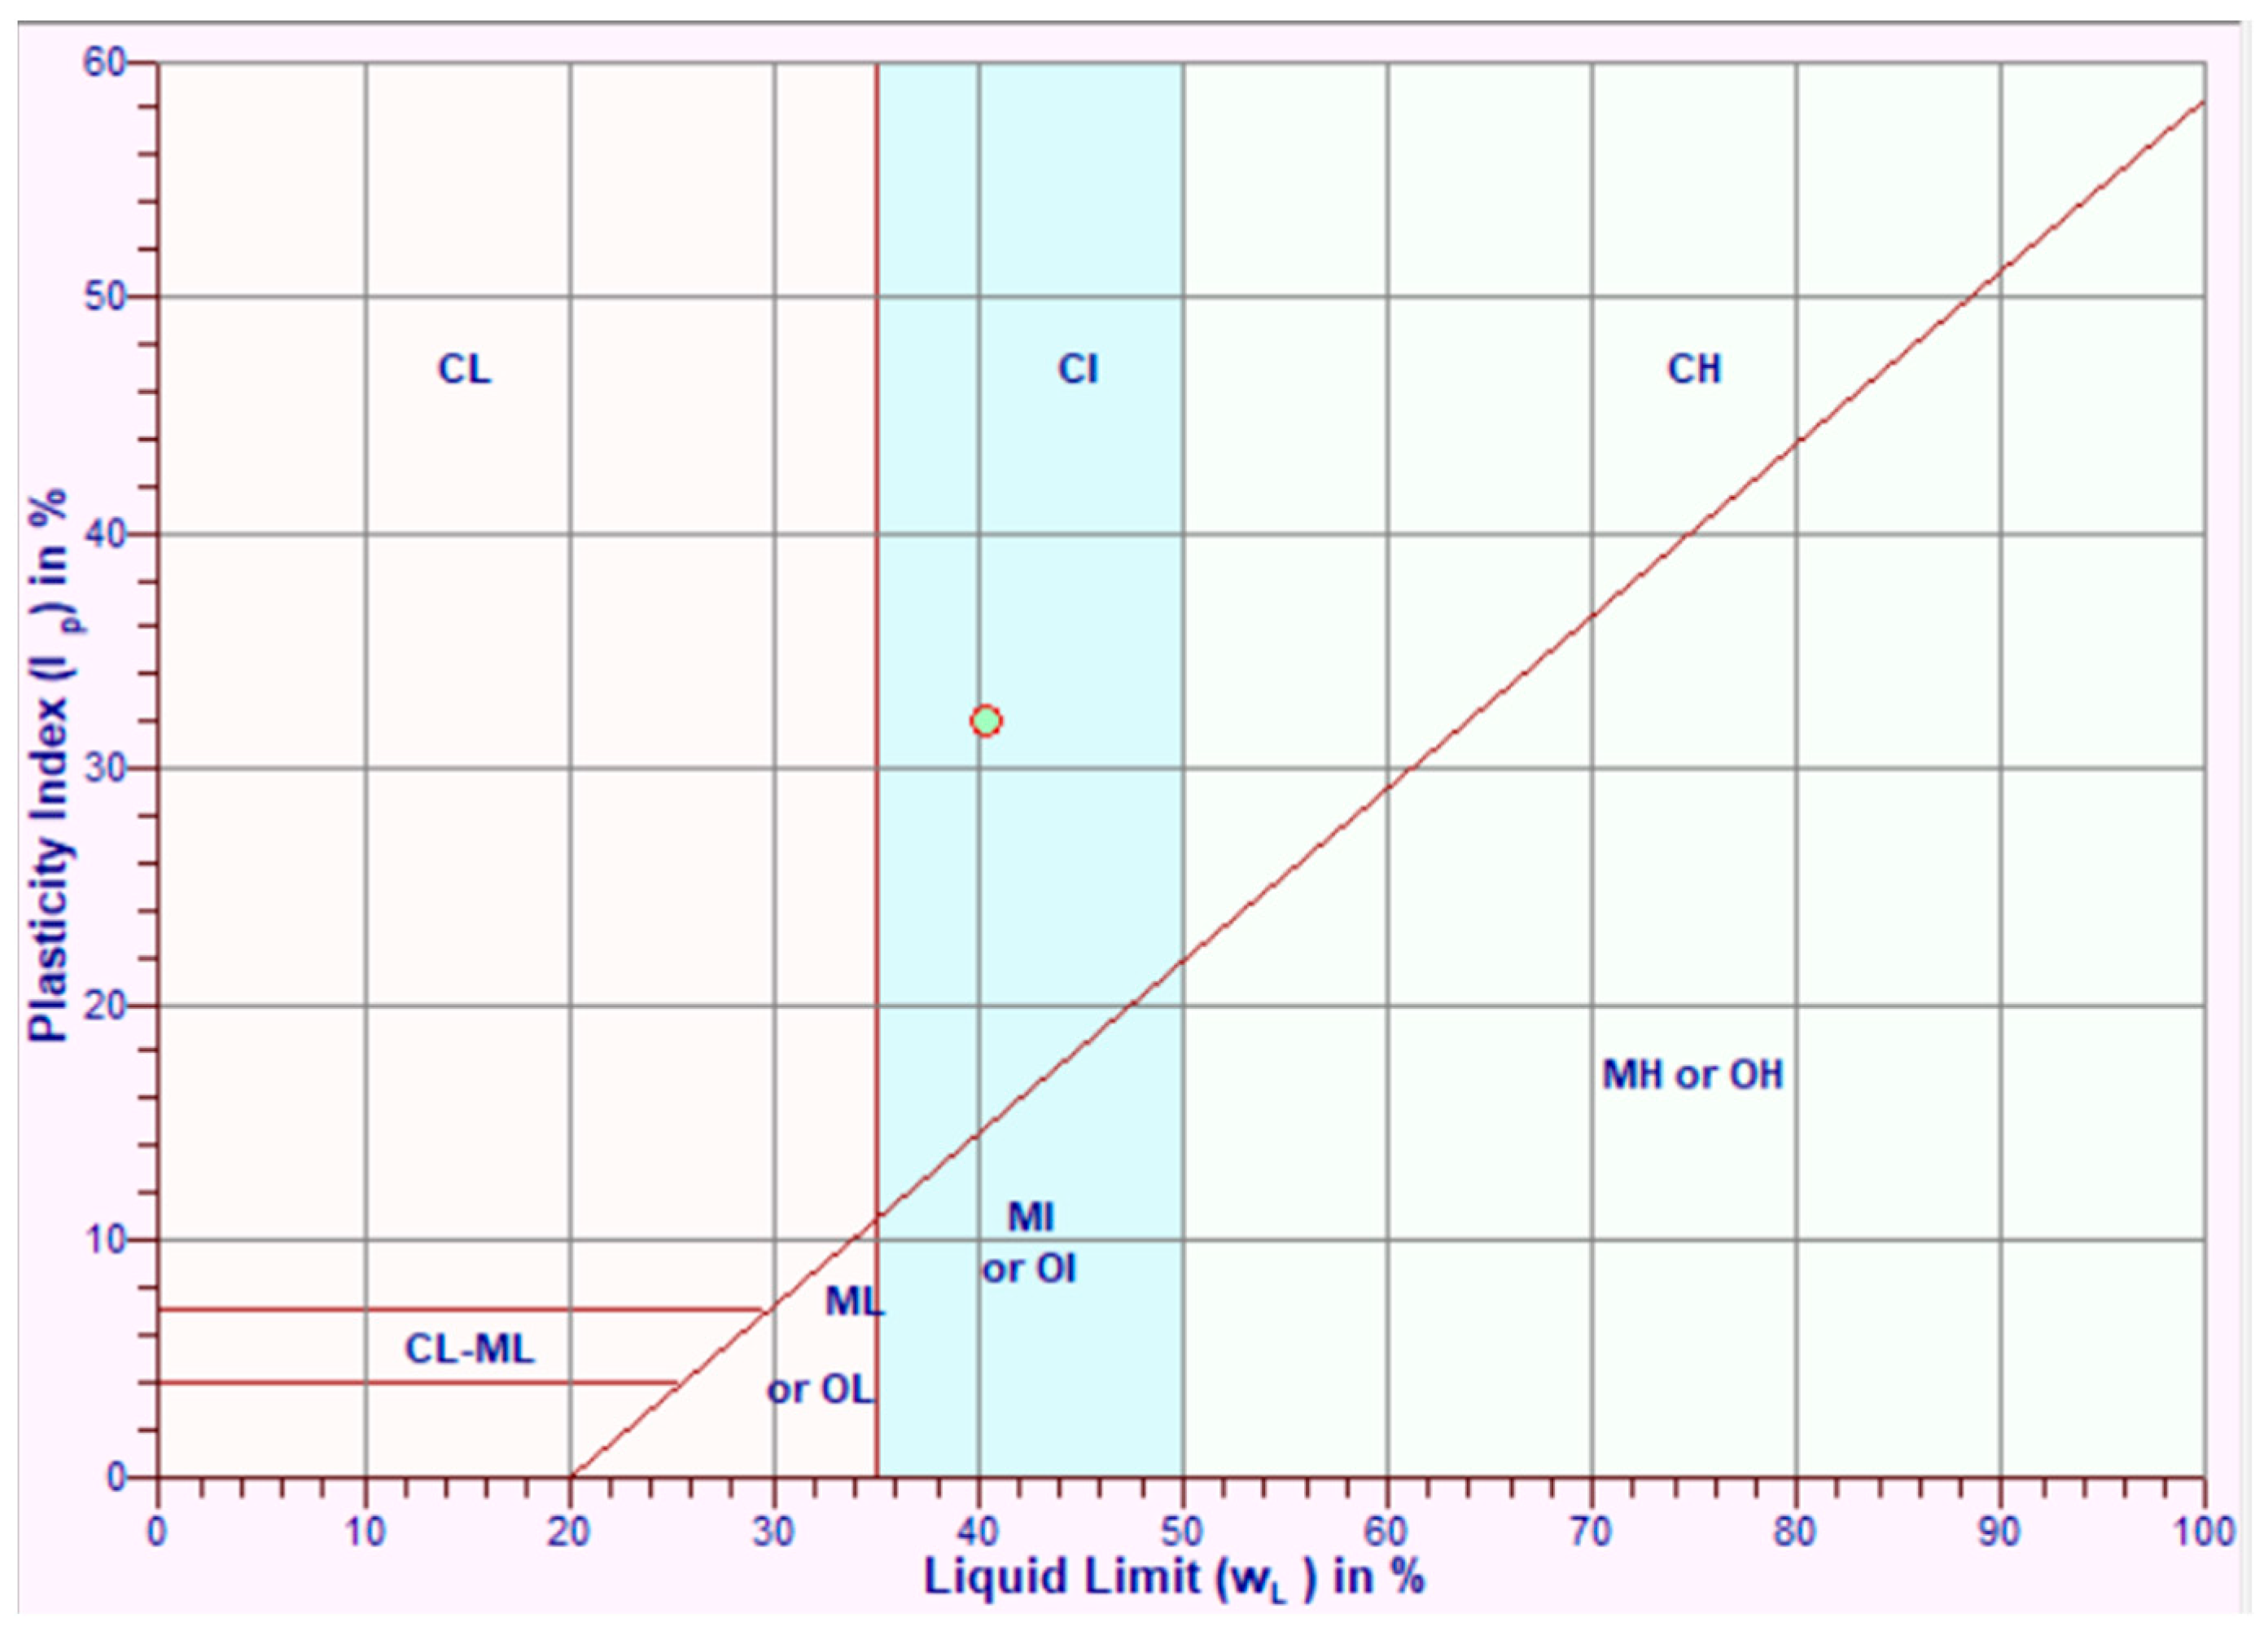
2.1. Index Properties of the Soil Sample

A site with a history of landslides in Lunglei and Aizwal districts, Mizoram, India, was selected using historical data on land use and terrain morphology. Soil samples were collected from trial pits to evaluate their physical and mechanical properties, as detailed in Table 2 and Table 6.
The model assumes a homogeneous slope with consistent properties like elastic modulus, cohesion, and friction angle to focus on soil suction effects. This simplification aids in understanding general behavior but may miss local variations. Stability is assessed using average mechanical properties, simplifying the process while highlighting the fundamental behavior of soil suction.
Soil samples from the landslide site were collected from the upper, middle, and lower sections at depths of 0.5 m, 1 m, and 1.5 m using the core cutter method. Various tests, including index properties, compaction, unconfined compressive strength, and oedometer tests, were performed [28,29,30,31,32,33,34,35,36]. Table 2 shows the soil index properties. Figure 5 displays the particle size distribution curve, and Figure 6 presents the A-line curve for Atterberg’s limits, classifying the soil as clay with intermediate plasticity and silt loam texture.

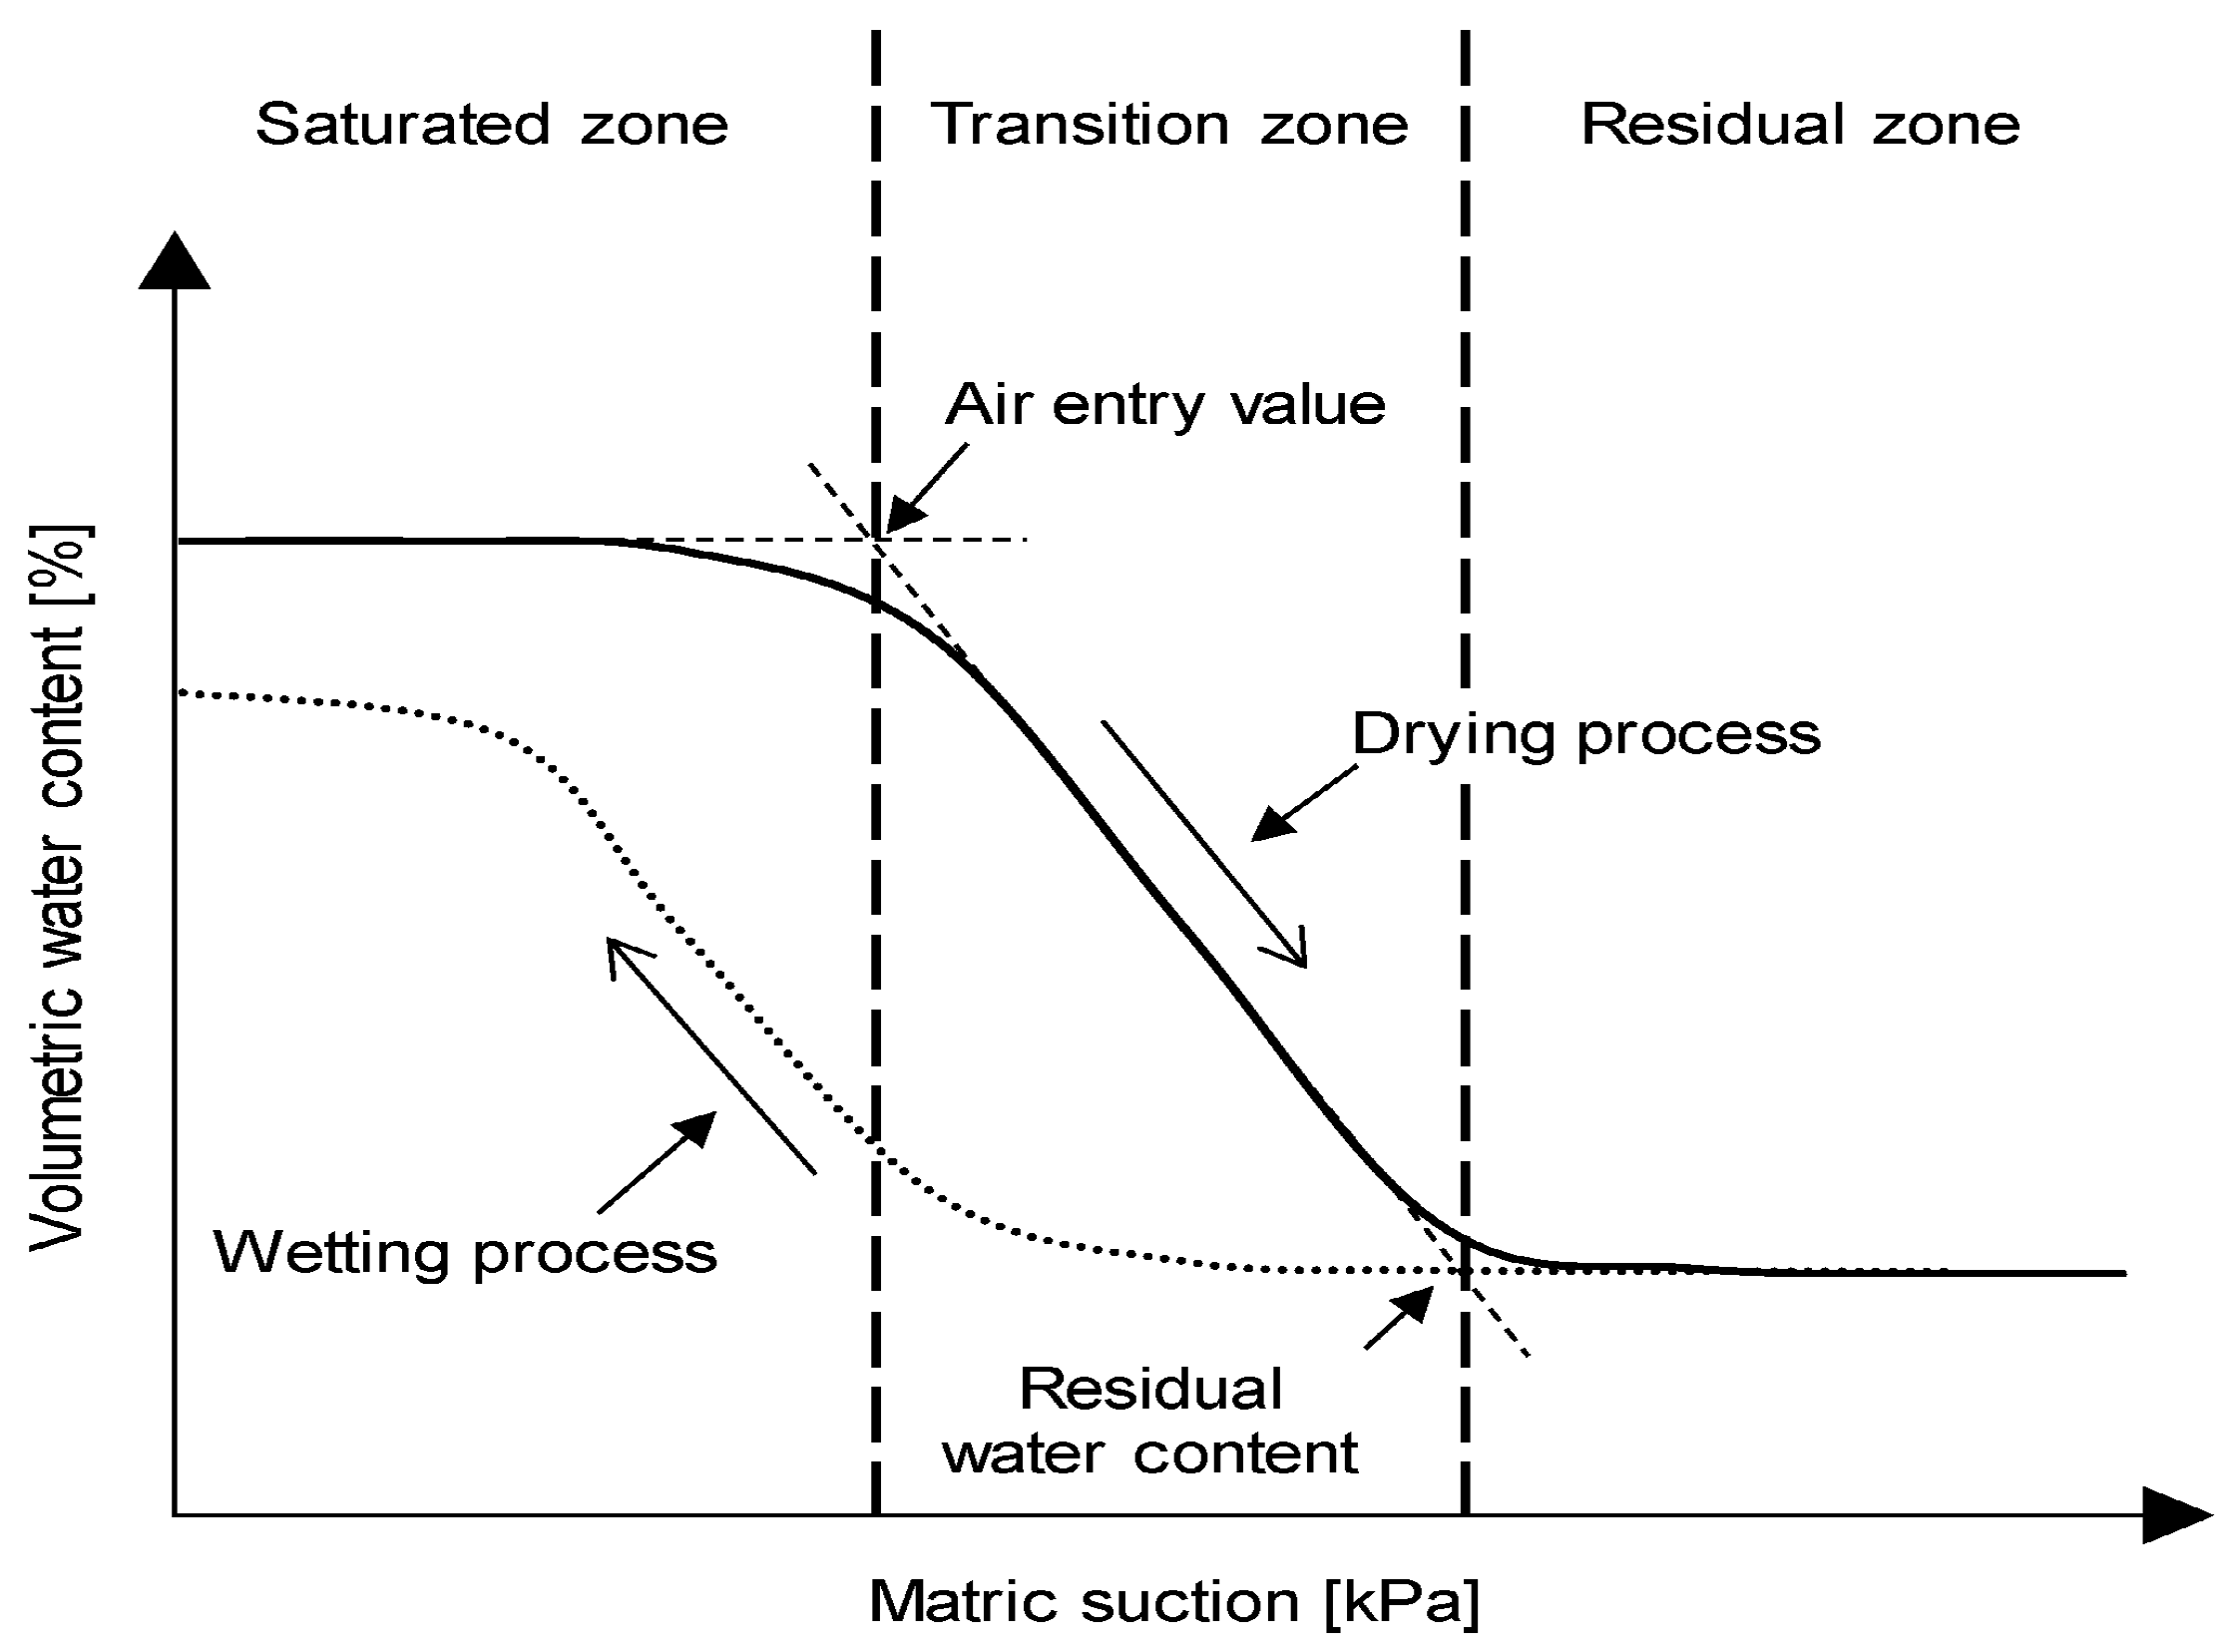
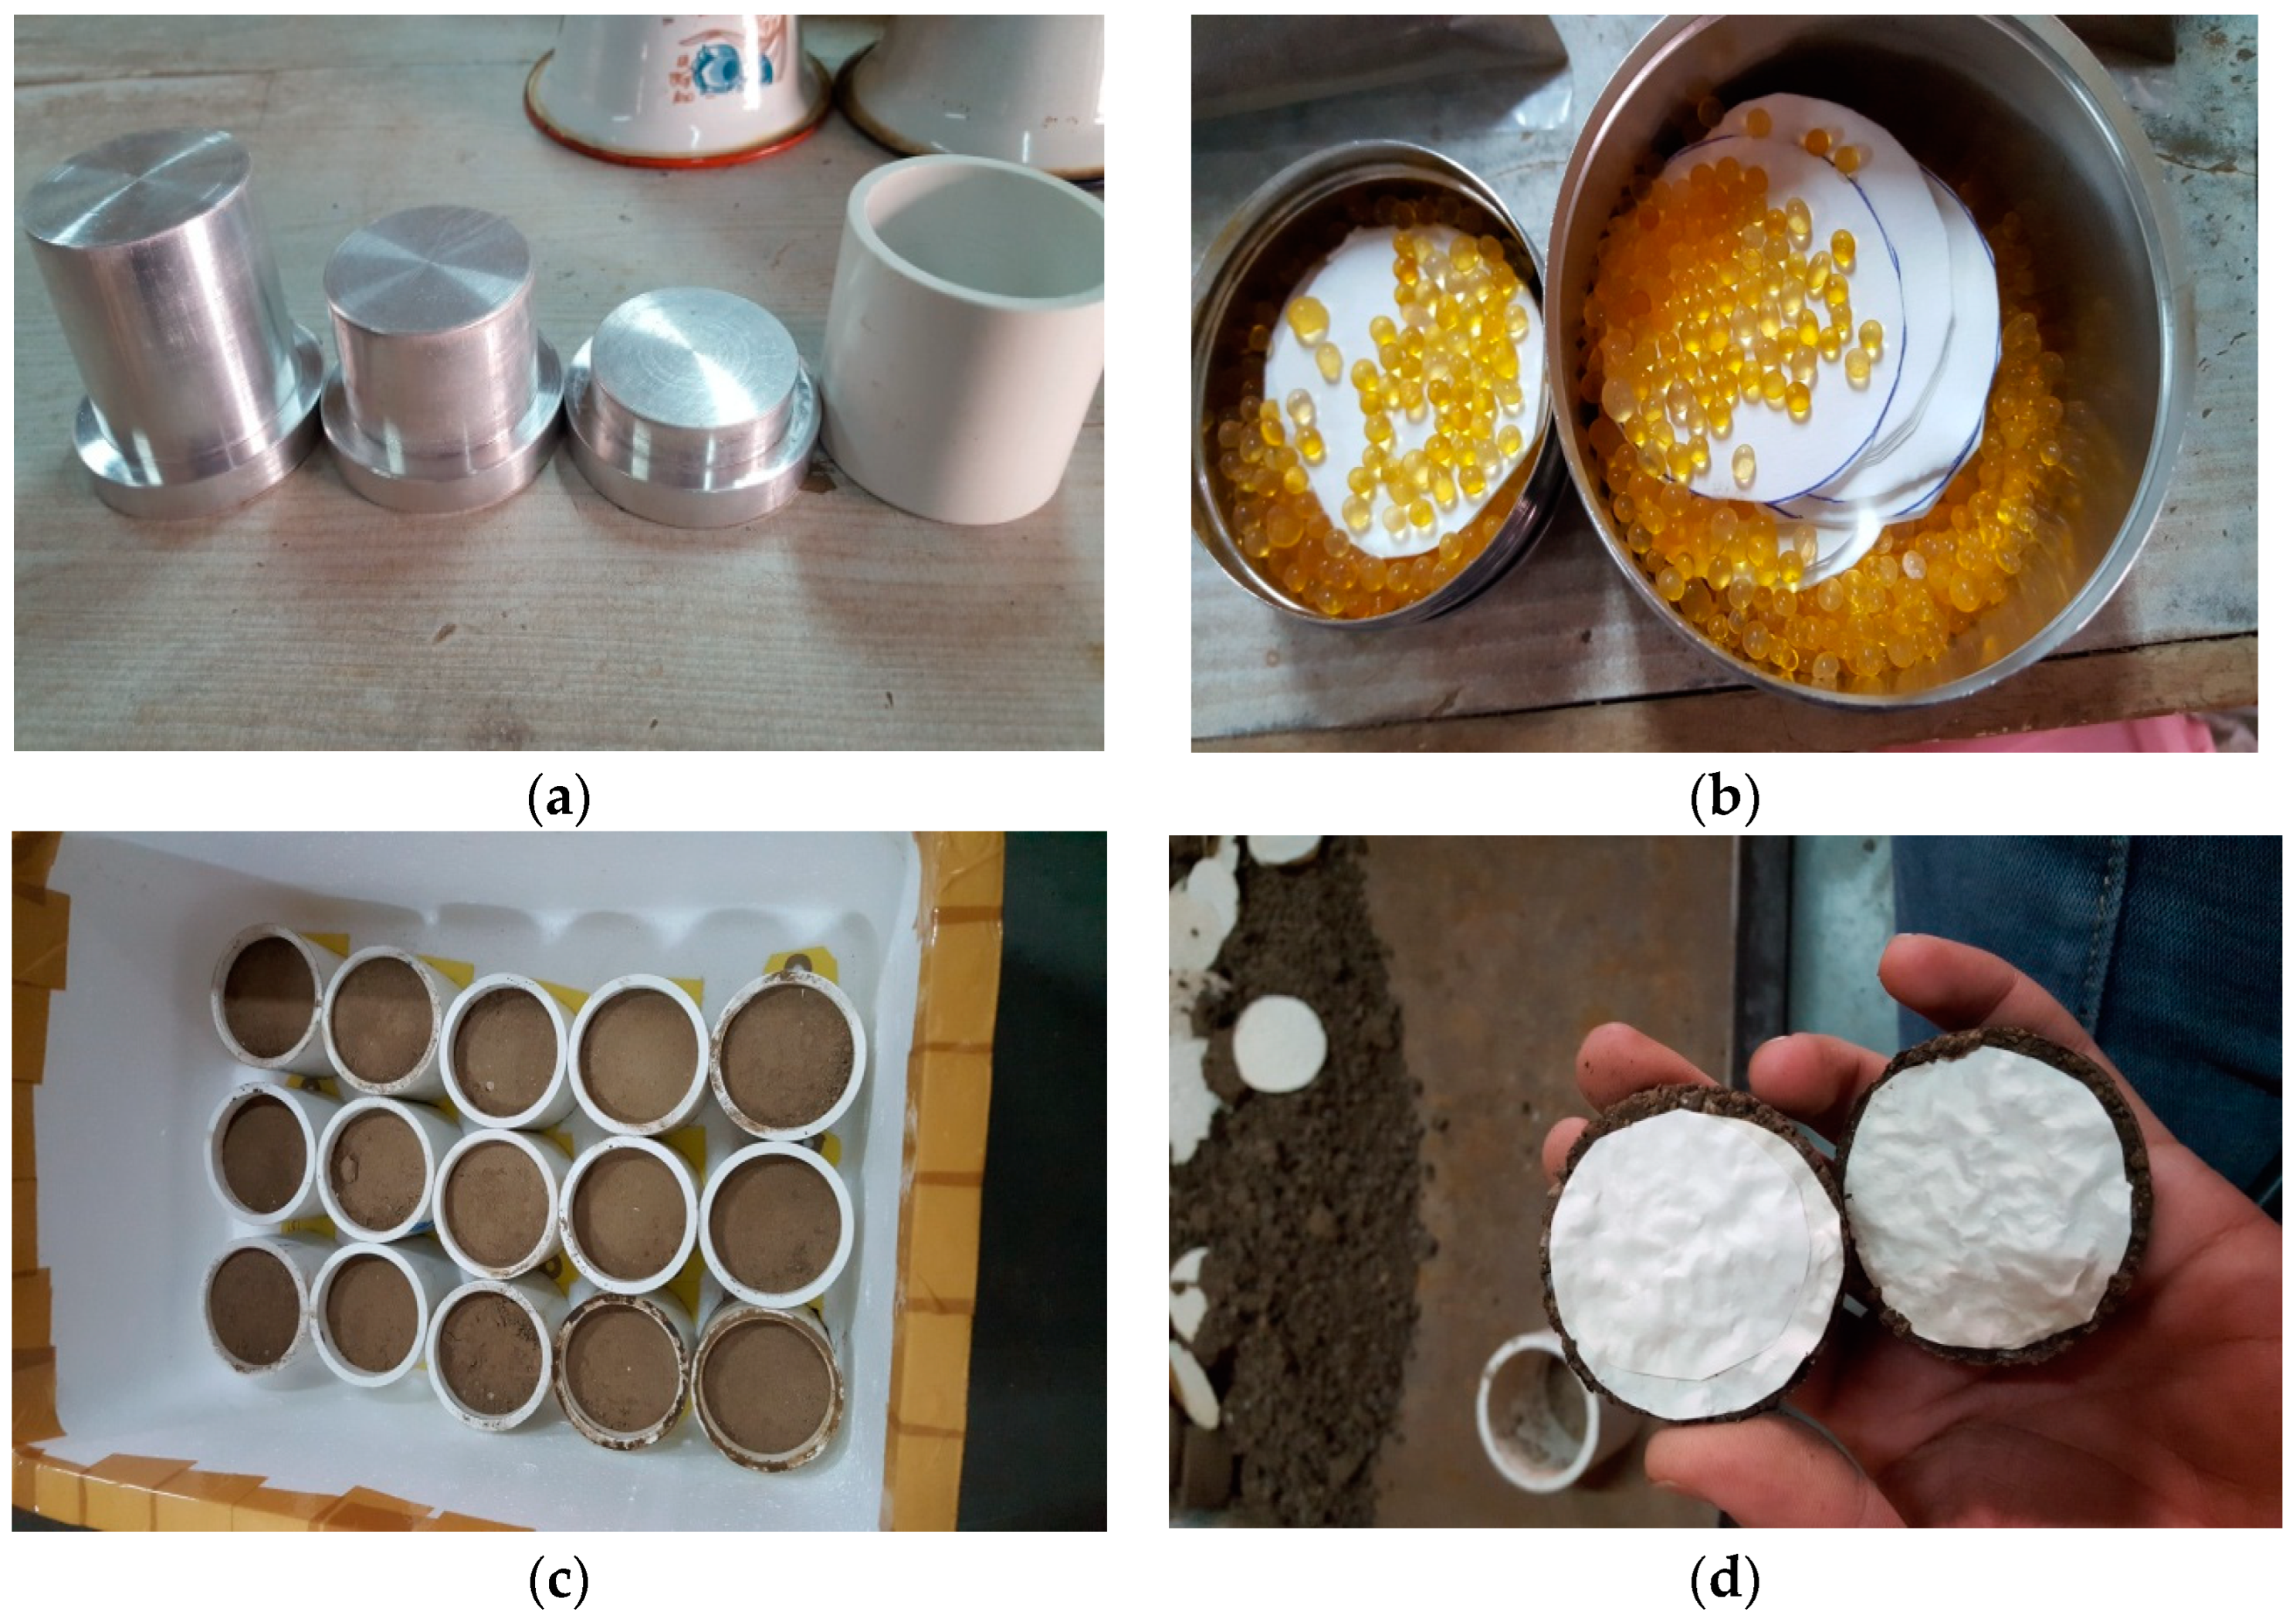
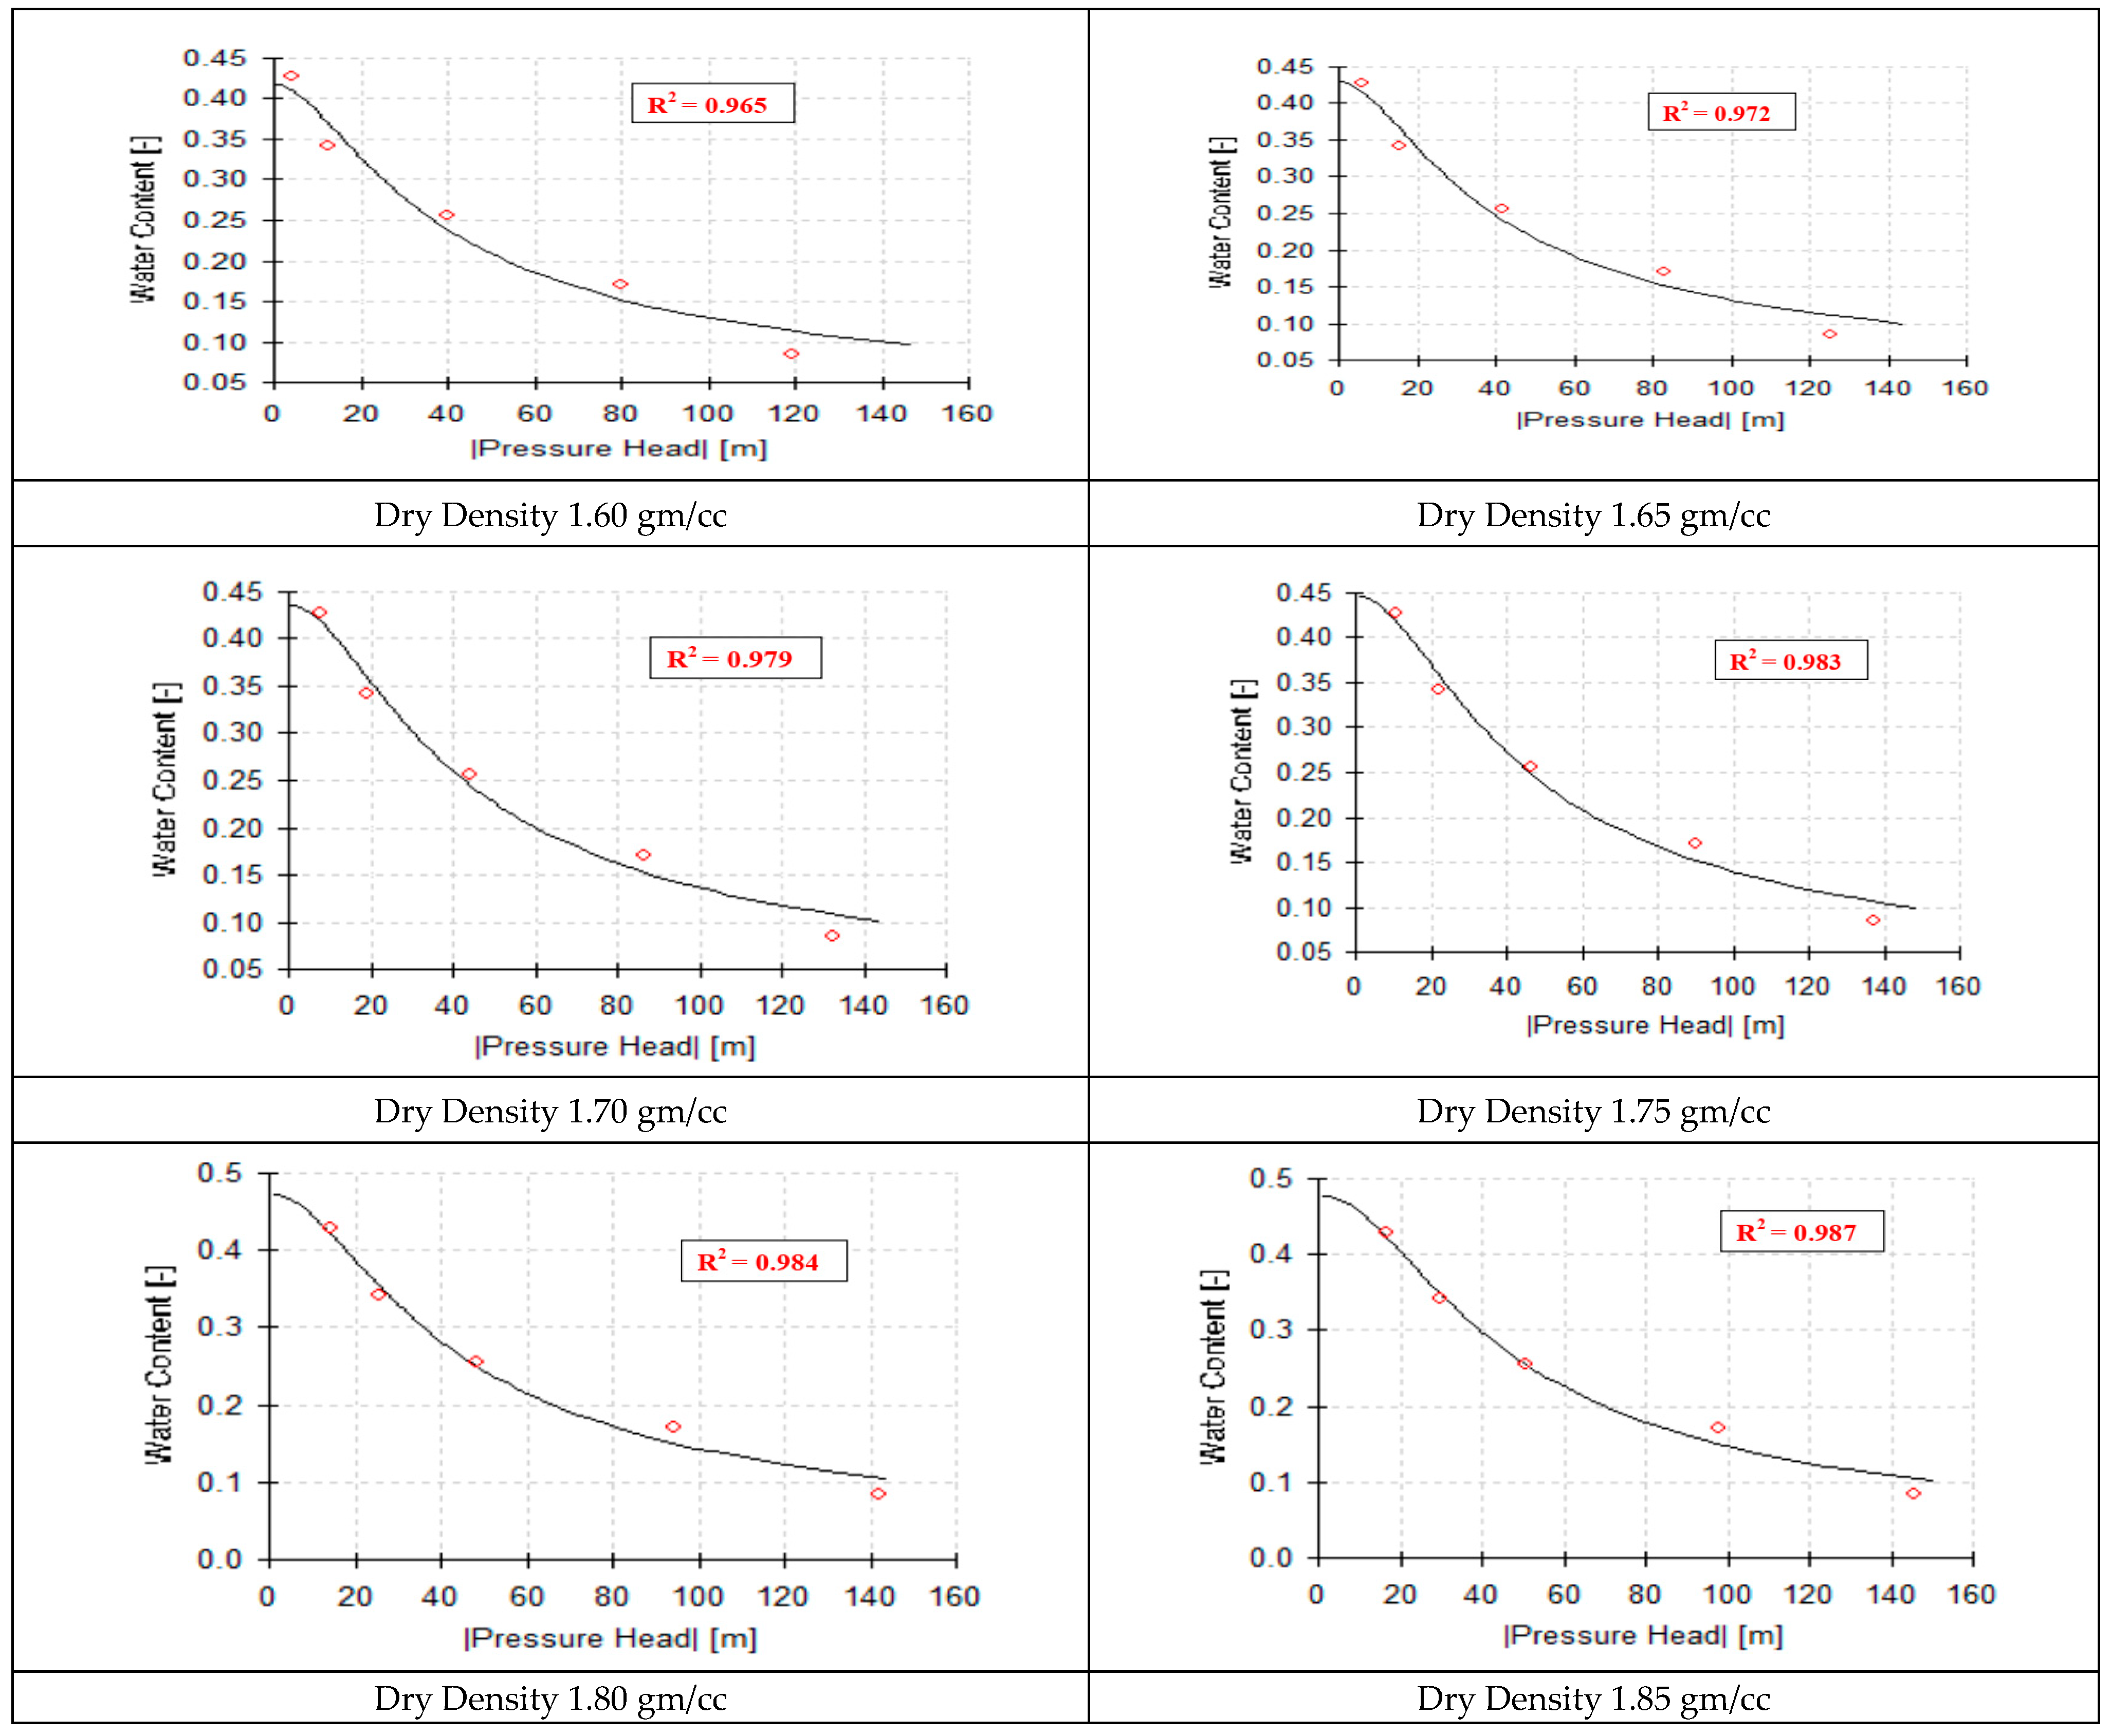
2.2. Soil Suction Measurement for SWCC Curves and Results

Soil matric suction is measured for varying dry density and degree of saturation. Aluminum plungers are used for compaction, ensuring no impact on soil and water mixture. Two-layered soil samples are compacted in PVC molds with dimensions designed to accommodate sufficient soil samples according to ASTM 5298-10 [37].
Figure 7a shows corrosion-resistant aluminum plungers and PVC molds used for soil suction tests. These materials ensure no chemical interference, maintaining measurement accuracy. Figure 7b shows the storage of Whatman No. 42 filter paper with silica pearls to keep it dry. Figure 7c depicts prepared remolded soil samples resting, and Figure 7d illustrates the moisture content measurement in filter paper following ASTM D5298-10 guidelines [37]. Table 3 presents matric suction results obtained by the contact filter paper method at different soil densities and saturations.
Figure 8 shows how CI soil’s hydraulic characteristics are influenced by dry density, moisture content, temperature, and water retention capacity. Matric suction levels depend on the soil’s cohesiveness, index properties, degree of saturation, and dry density [17]. Higher cohesion and density increase matric suction due to the greater pressure required to extract water. This analysis highlights the interplay between CI soil’s physical and chemical properties and its water retention capabilities [17].
The contact filter paper method for measuring soil matric suction requires meticulous quality control and continuous monitoring. Preparing PVC molds with soil samples at 20% and 40% saturation requires extra care due to lower moisture content compared to samples at higher saturation. Maintaining constant temperature and humidity for 7 days with control sensors is crucial. Measuring the filter paper’s moisture content at the test’s end is delicate; improper handling can compromise results and may require retesting.
This study used the contact filter paper method to measure soil matric suction and SWCC curves. Due to its delicacy and uncertainties, the SWCC results need validation. RETC software (Version 6.02) was used to validate the SWCC obtained from these measurements [13,38].
RETC is a computer program for analyzing the hydraulic properties of unsaturated soils, which is crucial for modeling water flow. It uses Brooks–Corey and Van Genuchten models for soil water retention curves and Mualem and Burdine’s theories to estimate unsaturated hydraulic conductivity [39]. The program optimizes parameters using a nonlinear least-squares method and can predict hydraulic conductivity with one measurement. Developed by Van Genuchten, RETC applies his models for soil properties like water content, diffusivity, suction, and conductivity, requiring minimal input and using soil retention curve data categorized by soil texture [13,38,39].
S = 1 ( 1 + ( a Ѱ ) ( 1 1 n )
In Equation (1) for SWCC curve, parameter “a” is restricted to 0.000001 (1/kPa) to 0.1 (1/kPa), “n” is between 1.05 to maximum 20.0, and the value of the “m” parameter is restricted to 0.5 to 10.0 (m = 1 − 1/n), parameter “m” and “n” are limited like a vG model, and ψ is from 103 kPa to 106 kPa [39]. The high effectiveness of R2 values for different soil densities makes them a valuable design parameter for future research. RETC is particularly useful for validating soil-specific SWCC curves using neural prediction [18]. Below are the user interface and steps of the RETC software and SWCC validation inputs [38].
Figure 9 shows the validation results with R2 values for SWCC curves at different densities and saturations. R2 values close to 1.0 indicate high precision. The graphs reveal R2 values from 0.96 to 0.98, indicating that the SWCC derived from soil suction tests are 96–98% precise. These graphs provide reliable SWCC curves for unsaturated soil mechanics analysis.

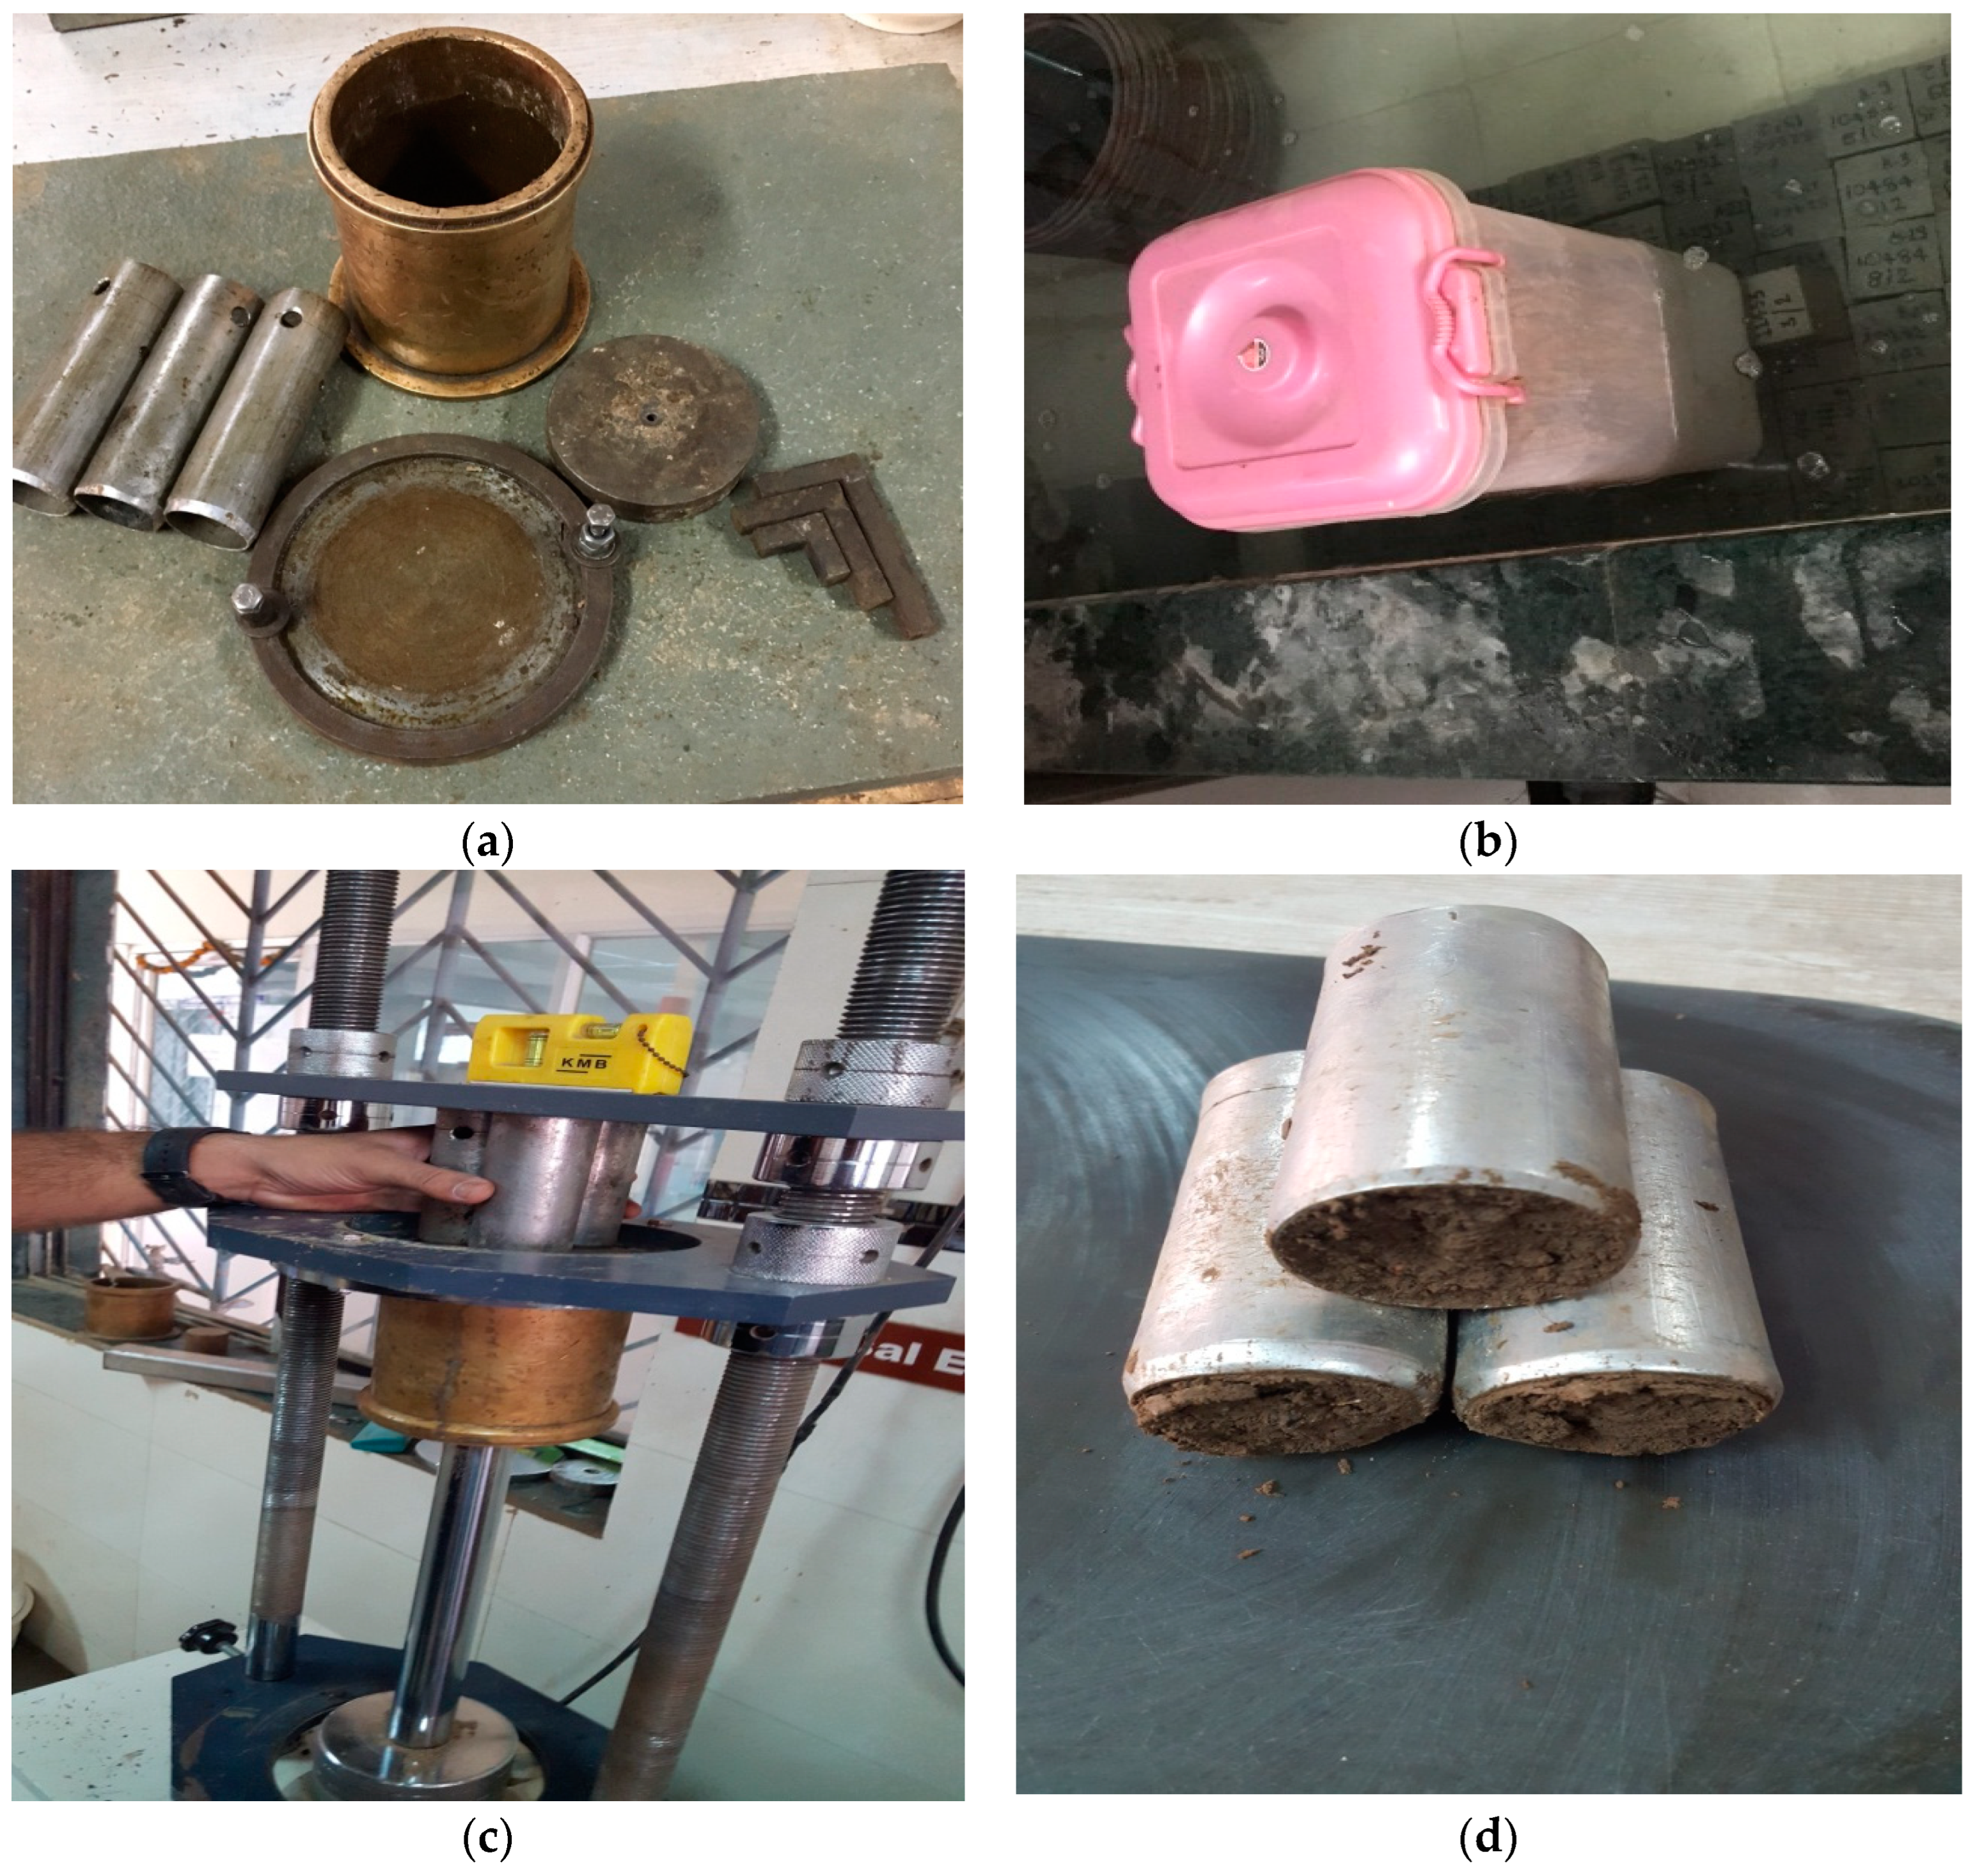
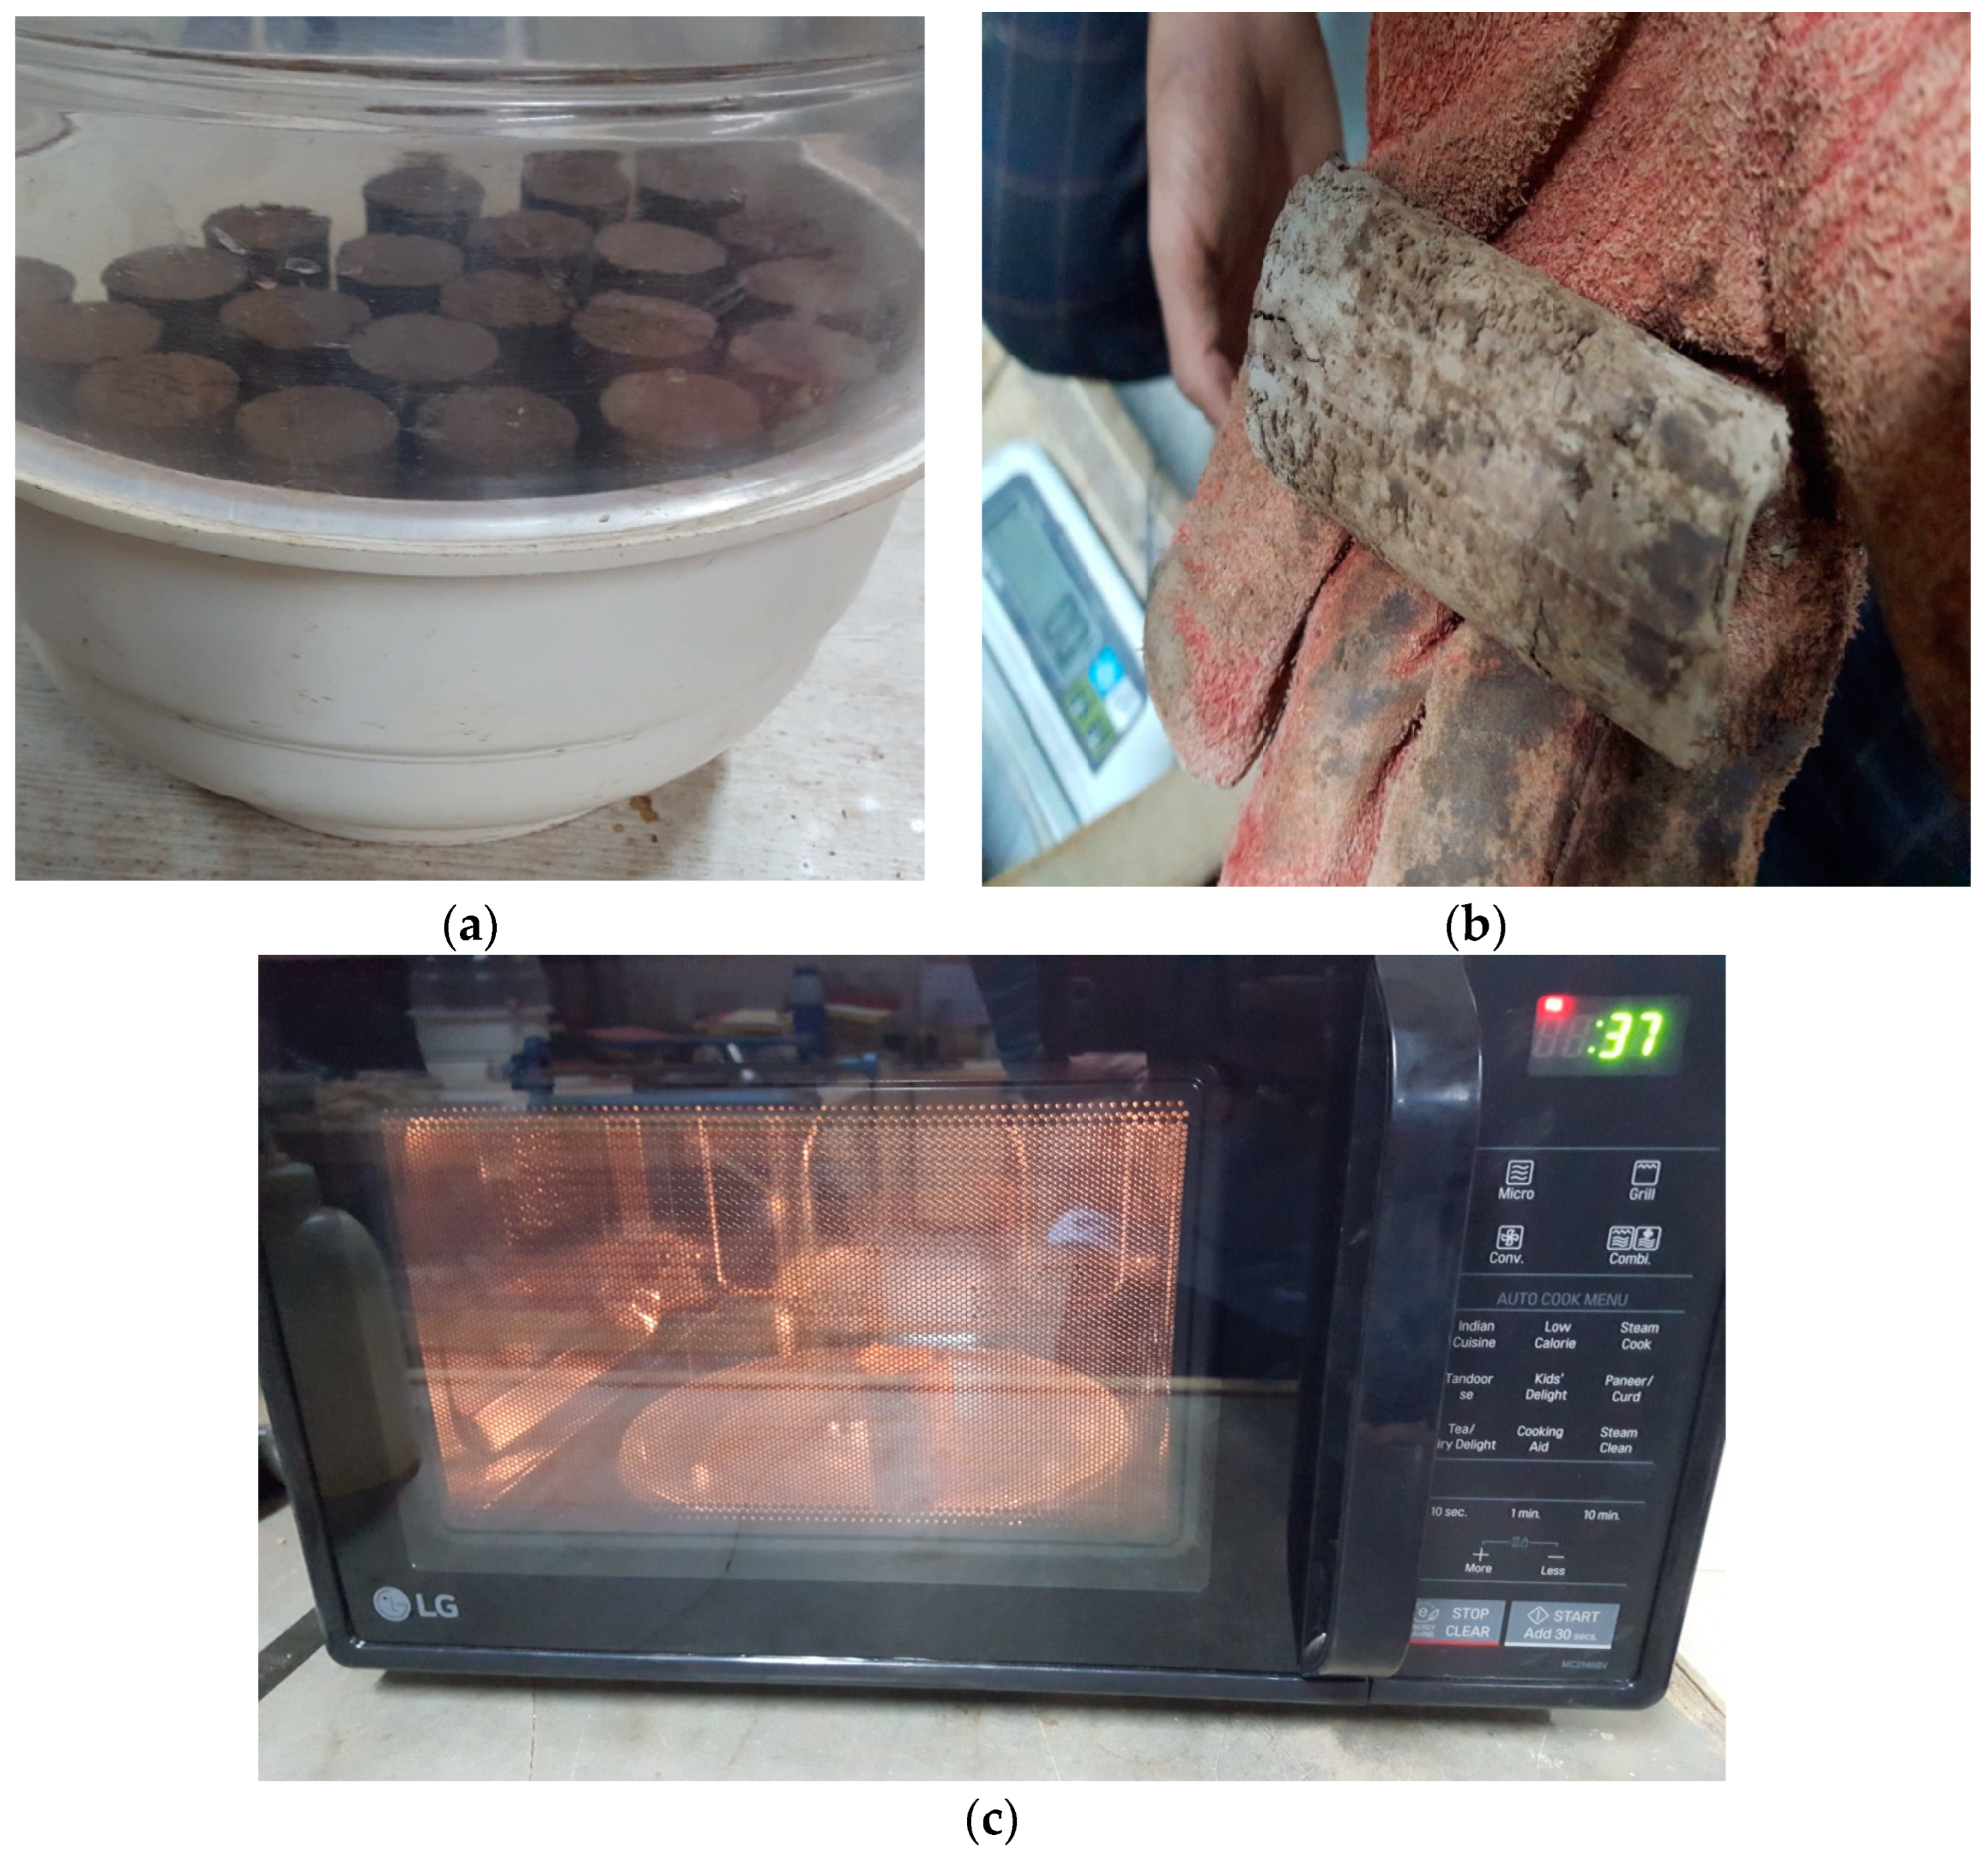
2.3. Preparation of a Saturated UCS Specimen for the Microwave Drying Process

Figure 10a details the tools used: a 100 mm diameter, 125 mm height mold; three sample tubes (38 mm diameter, 130 mm height); a shorter sampler (38 mm diameter, 76 mm height); and a 20 mm thick, 98 mm diameter plunger. Figure 10b shows soil samples mixed with water to achieve 100% saturation in a constant temperature chamber. Figure 10c features a hydraulic sample extractor for compressing and extracting samples. Figure 10d displays three specimens in tubes, later dried to the desired saturation in a microwave. For testing, specimens were extracted from molds at 100% saturation, placed in a desiccator for 24 h, and soaked in a water tank at 27 °C [30].
Unconfined compressive strength tests on soil specimens at 20% and 40% saturation require meticulous handling due to lower moisture content compared to those at 60% and 80% saturation. Samples microwaved to reduce moisture from 100% to 40% and 20% also need careful handling to maintain test accuracy. Three identical specimens were tested to ensure reliable results.
Tests were conducted on samples heated at different temperatures (40 °C, 100 °C, 140 °C, 180 °C) and some without preheating to study the impact of microwave drying on soil. Initial experiments used ceramic cups with soil to simulate field moisture. Further tests involved remolded soil specimens (38 mm diameter, 76 mm height) mixed with water, stabilized at 27 °C for 24 h, and weighing 172–190 g. The goal was to link microwave exposure duration to the desaturation process.
Figure 11a shows soil specimens in a desiccator for moisture control before microwave drying. Figure 11b displays dried specimens. Figure 11c shows a specimen in the microwave. Tests on about 2000 triaxial specimens found centering them on the turntable ensures uniform drying, preparing them for shear tests.
The study measured weight loss from desaturation to establish the required drying time and explored how the specimen’s dimensions affect microwave effectiveness, enhancing understanding of microwave soil drying.
The study used two microwaving techniques: one-point (preset duration) and cumulative (progressive drying to desaturation). The cumulative method proved more effective, linking microwaving duration to soil desaturation, which is important for shear strength analysis. Figure 12 shows the correlation between moisture loss and drying time, validated by SWCC curves and RETC, confirming the accuracy for unconfined compressive strength tests.
The relationship mentioned above was established under the operating conditions specified in Table 4 of the microwave oven in accordance with ASTM D4643-08 [40].
The results in terms of unconfined compressive strengths are evaluated as mentioned in Table 5.

3. Typical Slope Geometry Used for Explaining the Lunglei Slope Behavior

PLAXIS 2D analysis (Bentley Systems, Exton, PA, USA) with a flow-deformation approach was performed to study natural unsaturated soil slope failures in Lunglei [41,42]. Shear strength was characterized using the Hardening Soil model in PLAXIS V20.02, and transient flow was modeled with Richard’s equation. An idealized 30° slope represented Lunglei sites, demonstrating the impact of unsaturated soil matric suction on slope stability [41,42].
A simple slope geometry was used to demonstrate the failure mechanism and evaluate the factor of safety of an unsaturated soil slope during Lunglei’s monsoon season after prolonged dryness. This geometry, with predetermined dimensions and a slope angle, is shown in Figure 13.
Figure 13 shows the slope geometry and the typical mesh used for finite element analysis. The slope angle was considered 30° since numerous slopes around the Lunglei district are the same. The coarseness factor while generating medium coarse mesh was considered 0.1 and 0.5 for the slope area and the part of the slope, respectively. The reason behind the 0.1 coarseness factor for slope area is to obtain a better and more accurate numerical analysis.

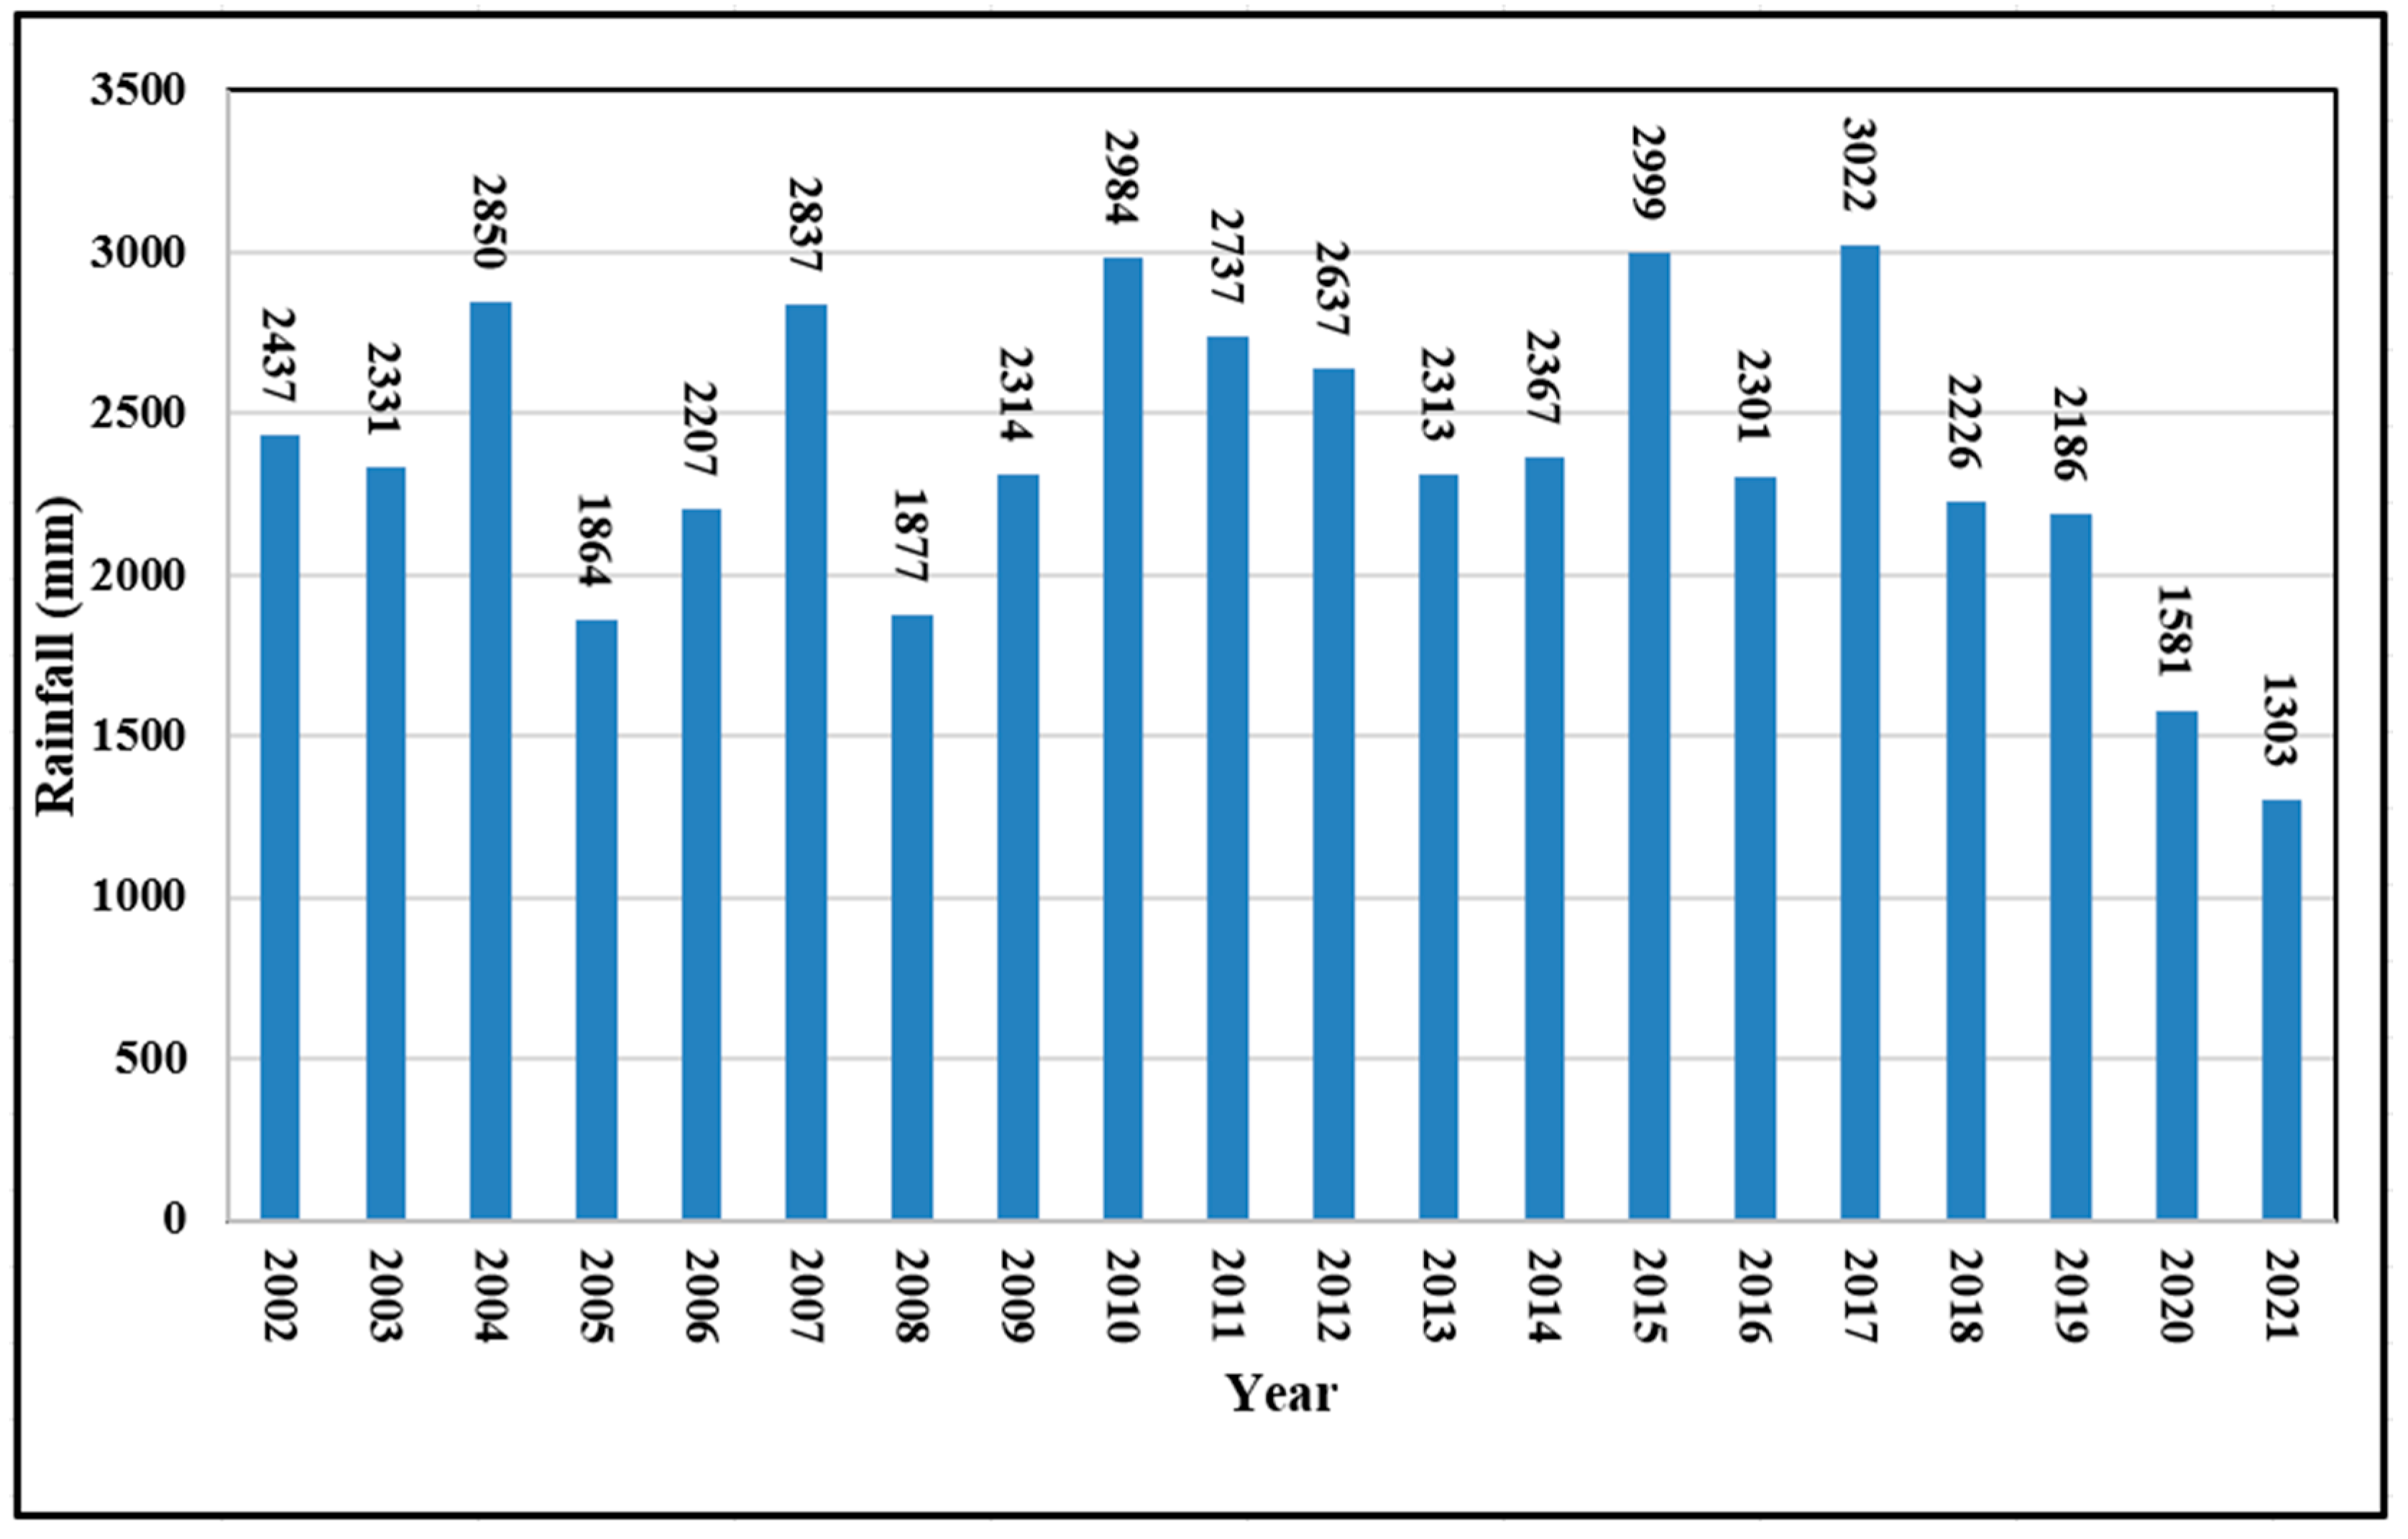
4. Rainfall Characteristics

The rainfall in this research area is predominantly attributed to the southwest monsoon, a consequence of orographic precipitation conditions. This monsoon season takes place from June to September each year, reaching its peak in June and July. Figure 14 shows the annual rainfall trend for Lunglei district for the past 20 years (2002–2021) [11].
Simulations used two rainfall intensities to model slope conditions during the monsoon season: 80 mm/day (average maximum daily rainfall) and 190 mm/day (highest recorded rainfall). An 80 mm/day intensity is considered low, while 190 mm/day is high for the Lunglei district. Maximum rainfall typically occurs in July [11].

5. Methodology

Soil matric suction was evaluated using the ASTM D5298-10 contact filter paper technique to study natural soil slope behavior [37]. Laboratory tests on unsaturated clay samples measured unconfined compressive strength at various saturation levels per IS 2720 (Part X)-2006 [30]. Results in Table 5 and Figure 15 show that the strength increased with saturation up to a point, then decreased. Specimens had saturation levels of 20%, 40%, 60%, and 80%, with dry densities per standard and modified Proctor densities. CI soils, common in the Lunglei district, were used.
For numerical analysis, PLAXIS 2D software (Version V20.02) was used for fully coupled flow-deformation analysis, considering actual permeabilities, soil suction, and time [42]. This approach allows for a dynamic understanding of groundwater flow and changes in pore pressures. The Hardening Soil model was chosen for its effectiveness in considering soil suction, which is crucial for understanding interactions between soil deformation, pore pressure, and groundwater flow. Including soil suction ensures a precise representation of unsaturated soil behavior, providing accurate and reliable results [43].
In PLAXIS 2D, fully coupled flow-deformation analysis integrates hydraulic and mechanical behaviors to model interactions such as soil stiffness changes due to pore water pressure variations [41]. This method is essential for scenarios like consolidation under load, slope stability during rainfall, and excavations near water tables. It involves solving coupled equations with detailed parameters, offering realistic but computationally intensive simulations for complex geotechnical issues [41,42].
This ensures a comprehensive evaluation of the soil behavior, where suction plays a pivotal role in the interaction between these factors.
Table 6 shows the parameters that were used for numerical simulations. These parameters were derived from various soil tests in accordance with Indian standards [29].
The model assumes a homogeneous slope with consistent properties like elastic modulus, cohesion, and friction angle to focus on soil suction effects. This simplification aids in understanding general behavior but may miss local variations. Stability is assessed using average mechanical properties, simplifying the process while highlighting the fundamental behavior of soil suction effects.
The Hardening Soil model was used to define soil shear strength under unsaturated conditions, simulating stress-dependent stiffness and dilatancy effects to assess slope stability [43]. Transient flow through unsaturated soil was simulated using Richard’s equation, based on Raynold’s transport theorem and the continuity equation [42].
In terms of groundwater flow boundary conditions for the slope model, the top surface was set to simulate infiltration due to rainfall; the side boundaries were designated for seepage, and the bottom of the slope was considered impervious [43,44].
Richards’ equation can be presented in various forms: water content, mixed water content and capillary head, and head form. In one-dimensional contexts, the “mixed water content form” combines water content (θ) with capillary head (ψ(θ)), as shown in Equation (2) [42].
Ə θ Ə t = Ə Ə z [ K ( θ ) ( Ə Ѱ ( θ ) Ə z 1 ]
where, z is the vertical coordinate (positive downward) [L]; t is time [T]; q equals q(z,t) equals volumetric soil moisture content [-]; y(q) is empirical soil hydraulic capillary head function [L]; K(q) = empirical unsaturated hydraulic conductivity function [L T–1] [44].
The analysis used the Mohr-Coulomb soil strength model and Van Genuchten hydraulic model for CI clay, with a standardized 24 h rainfall duration. The groundwater table was 15 m below the slope top. The six-stage analysis included two dry stages for the baseline factor of safety, followed by two stages with 80 mm/day rainfall, and two stages with 190 mm/day rainfall to assess safety. Rainfall data was based on 2017 figures from the Lunglei district, as shown in Figure 14.

6. Results and Discussion

6.1. Soil Suction and the Properties of the Soil

Considering the SWCC curve generated from measurements of soil suction, validated further by RETC software, and the established correlation between moisture loss and drying time, the precision of the resulting drying SWCC curve is effectively affirmed. The drying time in a microwave is longer for specimens of heavier density compared to those of lighter-density soil. Soil matric suction is primarily influenced by the soil properties, such as its water retention capacity, cohesion, index properties of soil, soil mineral composition and temperature conditions, but it also varies with the soil density and saturation levels. It has been noted that soils with higher plasticity require greater pressure to remove water from the soil mass, resulting in more soil suction.

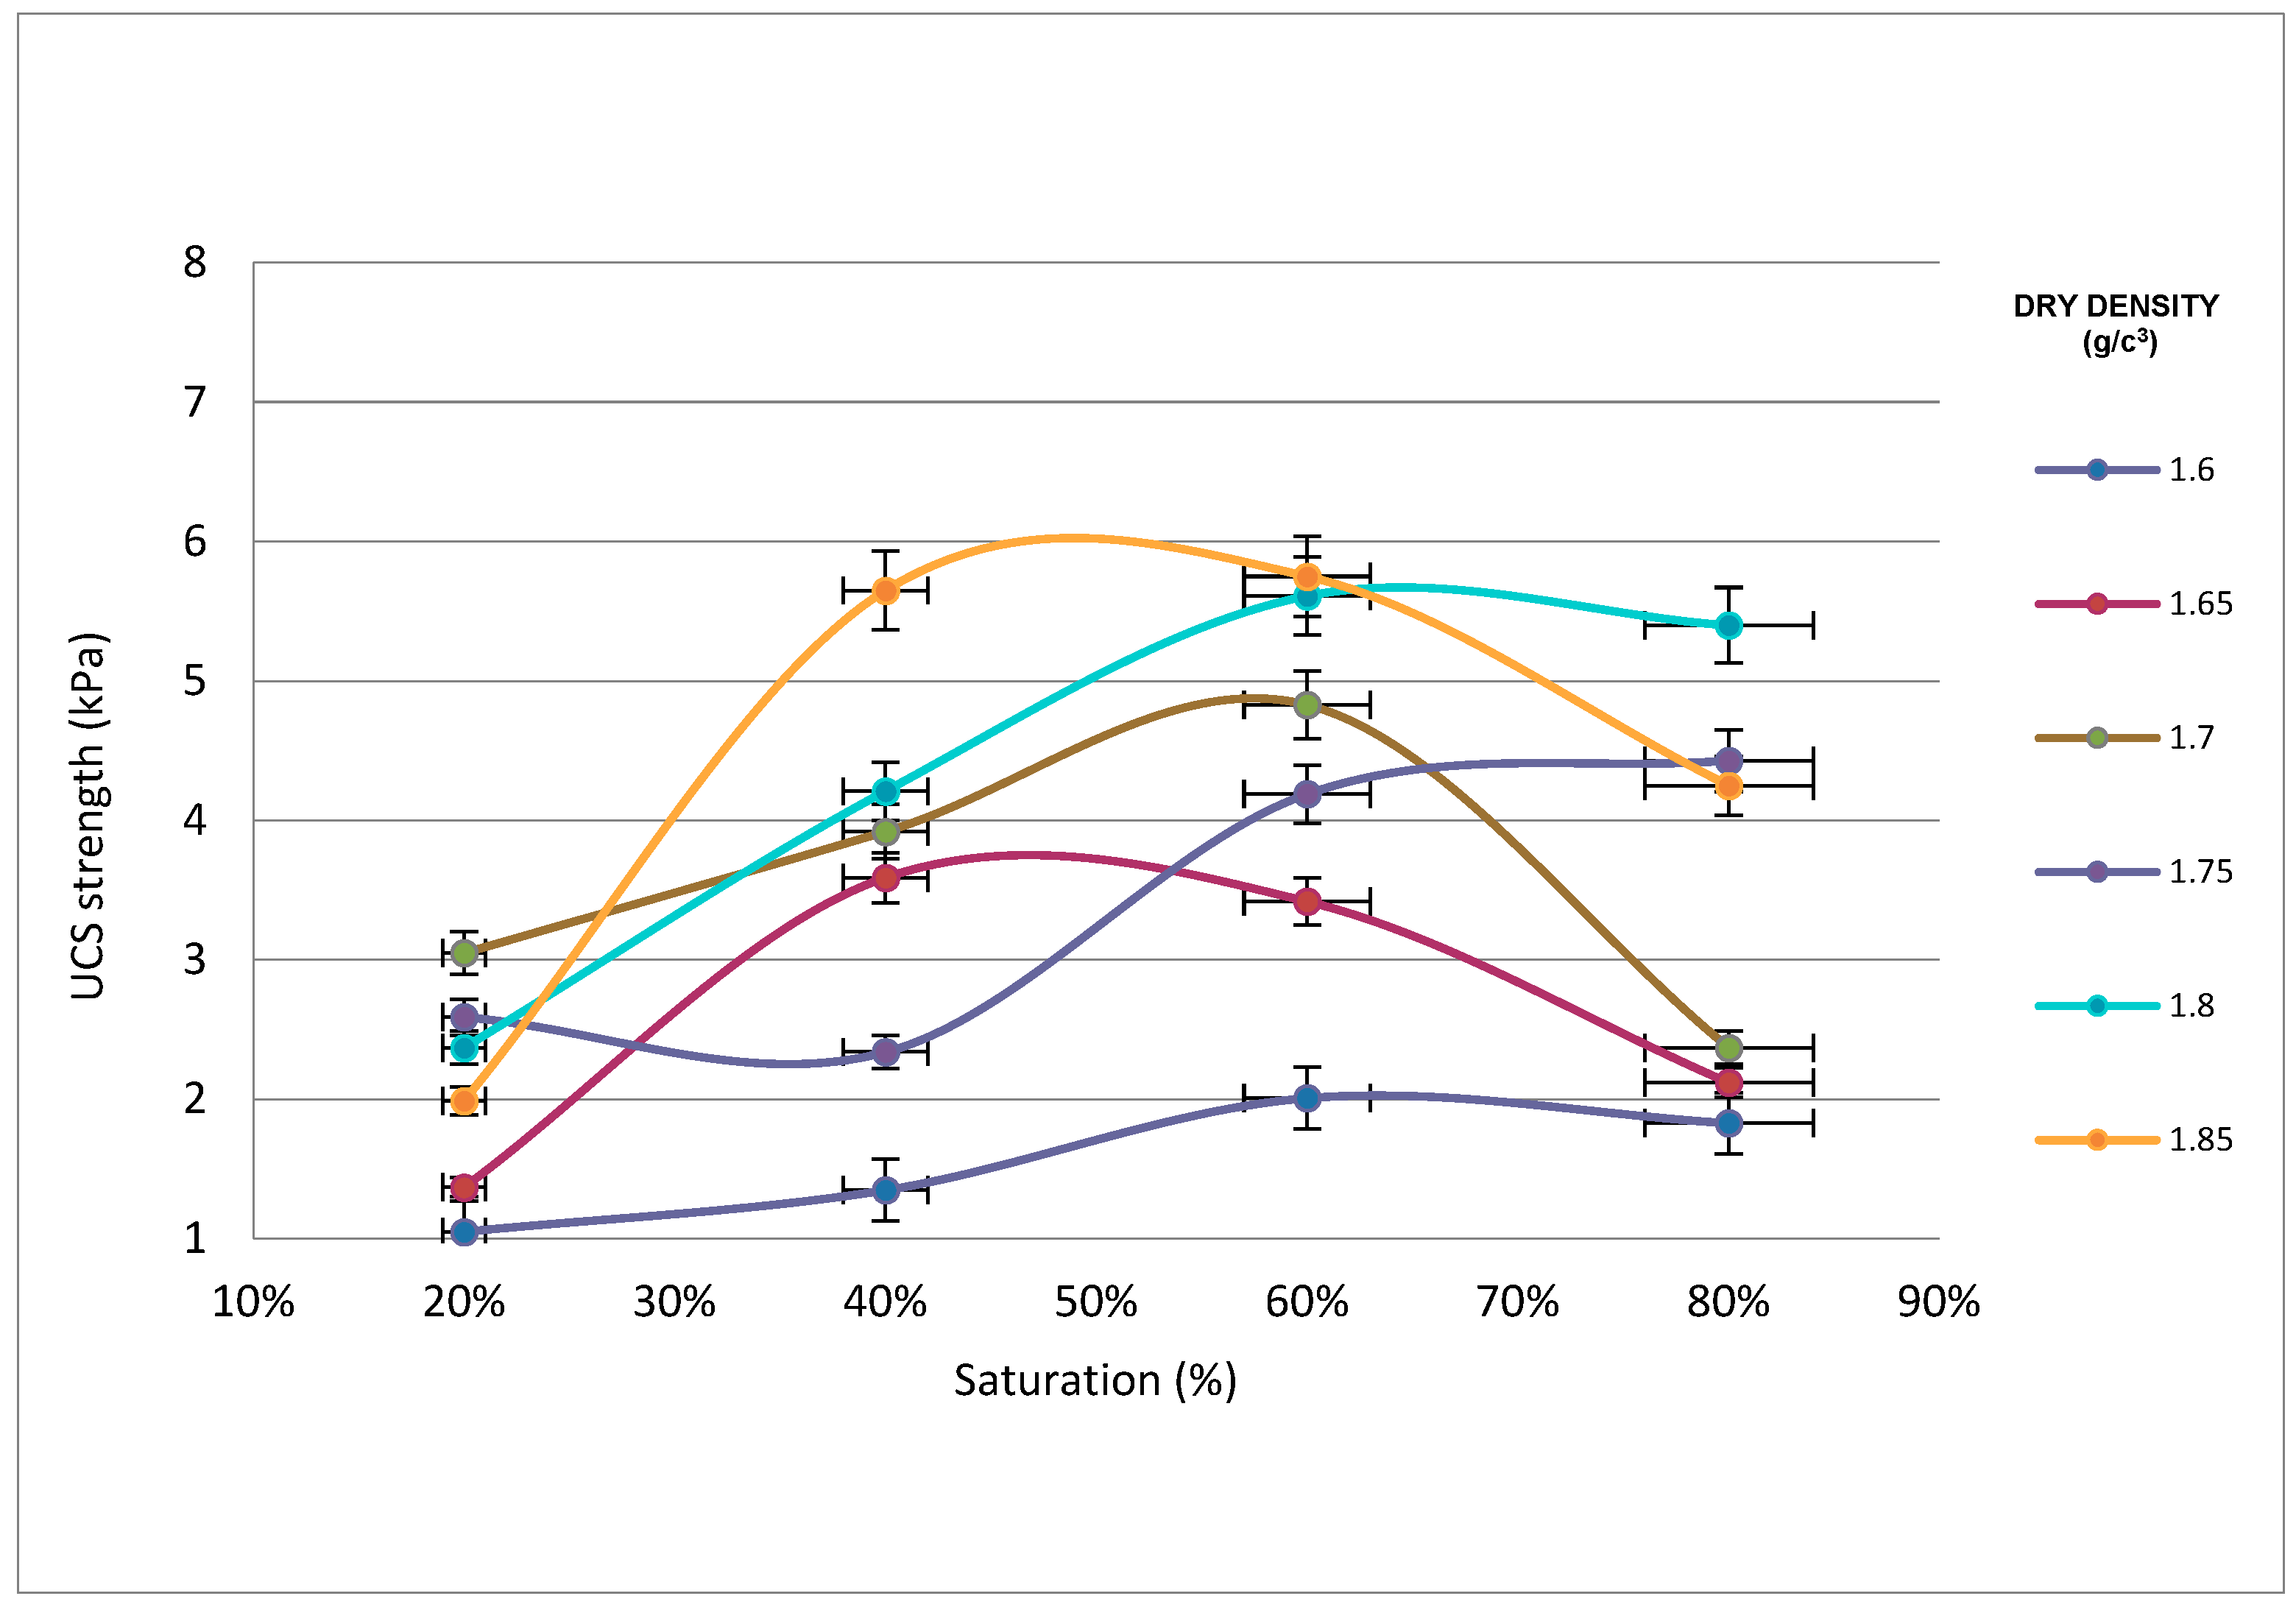
6.2. Unconfined Compressive Strength Test Results

Figure 15 shows UCS strengths at different densities and variations of unsaturated soil samples. At a modified Proctor density, the CI soil reaches its peak UCS value when the moisture content is at 40% saturation. This level of moisture optimizes the soil’s structural arrangement and cohesion, thereby enhancing its load-bearing capacity. The presence of water at this specific saturation level contributes positively to the soil matrix, facilitating particle cohesion and improving the overall strength of the soil.
However, when the saturation level drops to 20%, CI soil shows a significant decrease in strength. At lower moisture levels, there is insufficient water to facilitate optimal particle bonding, leading to weaker soil cohesion and, consequently, reduced UCS values. This illustrates that overly dry conditions can compromise the structural integrity of CI soil, making it unsuitable for supporting loads and increasing the risk of slope instability.
Conversely, as the saturation level increases beyond the optimal 40%—at 60% and 80% saturation—the UCS strength of CI soil begins to decline gradually. This reduction in strength with increasing moisture content beyond the optimal point is attributed to the lubricating effect of excess water, which causes soil particles to slide past each other more easily under load, reducing the soil’s overall strength and stability. This phenomenon highlights that fully saturated conditions, where soil suction approaches zero, also pose a risk to slope stability, as the increased water content compromises the soil shear strength.
The implications of these findings are significant for the understanding of natural slope failures. They indicate that not only are fully saturated conditions hazardous for slopes due to the elimination of soil suction and the resultant decrease in shear strength, but conditions of under-saturation (below 40%) also pose a threat. In such dry conditions, the lack of adequate moisture leads to reduced particle cohesion and soil strength, making slopes vulnerable to failure. This underscores the importance of maintaining an optimal moisture level in CI soil, not only to enhance its load-bearing capacity but also to ensure the stability of natural slopes and prevent failure under varying moisture conditions.

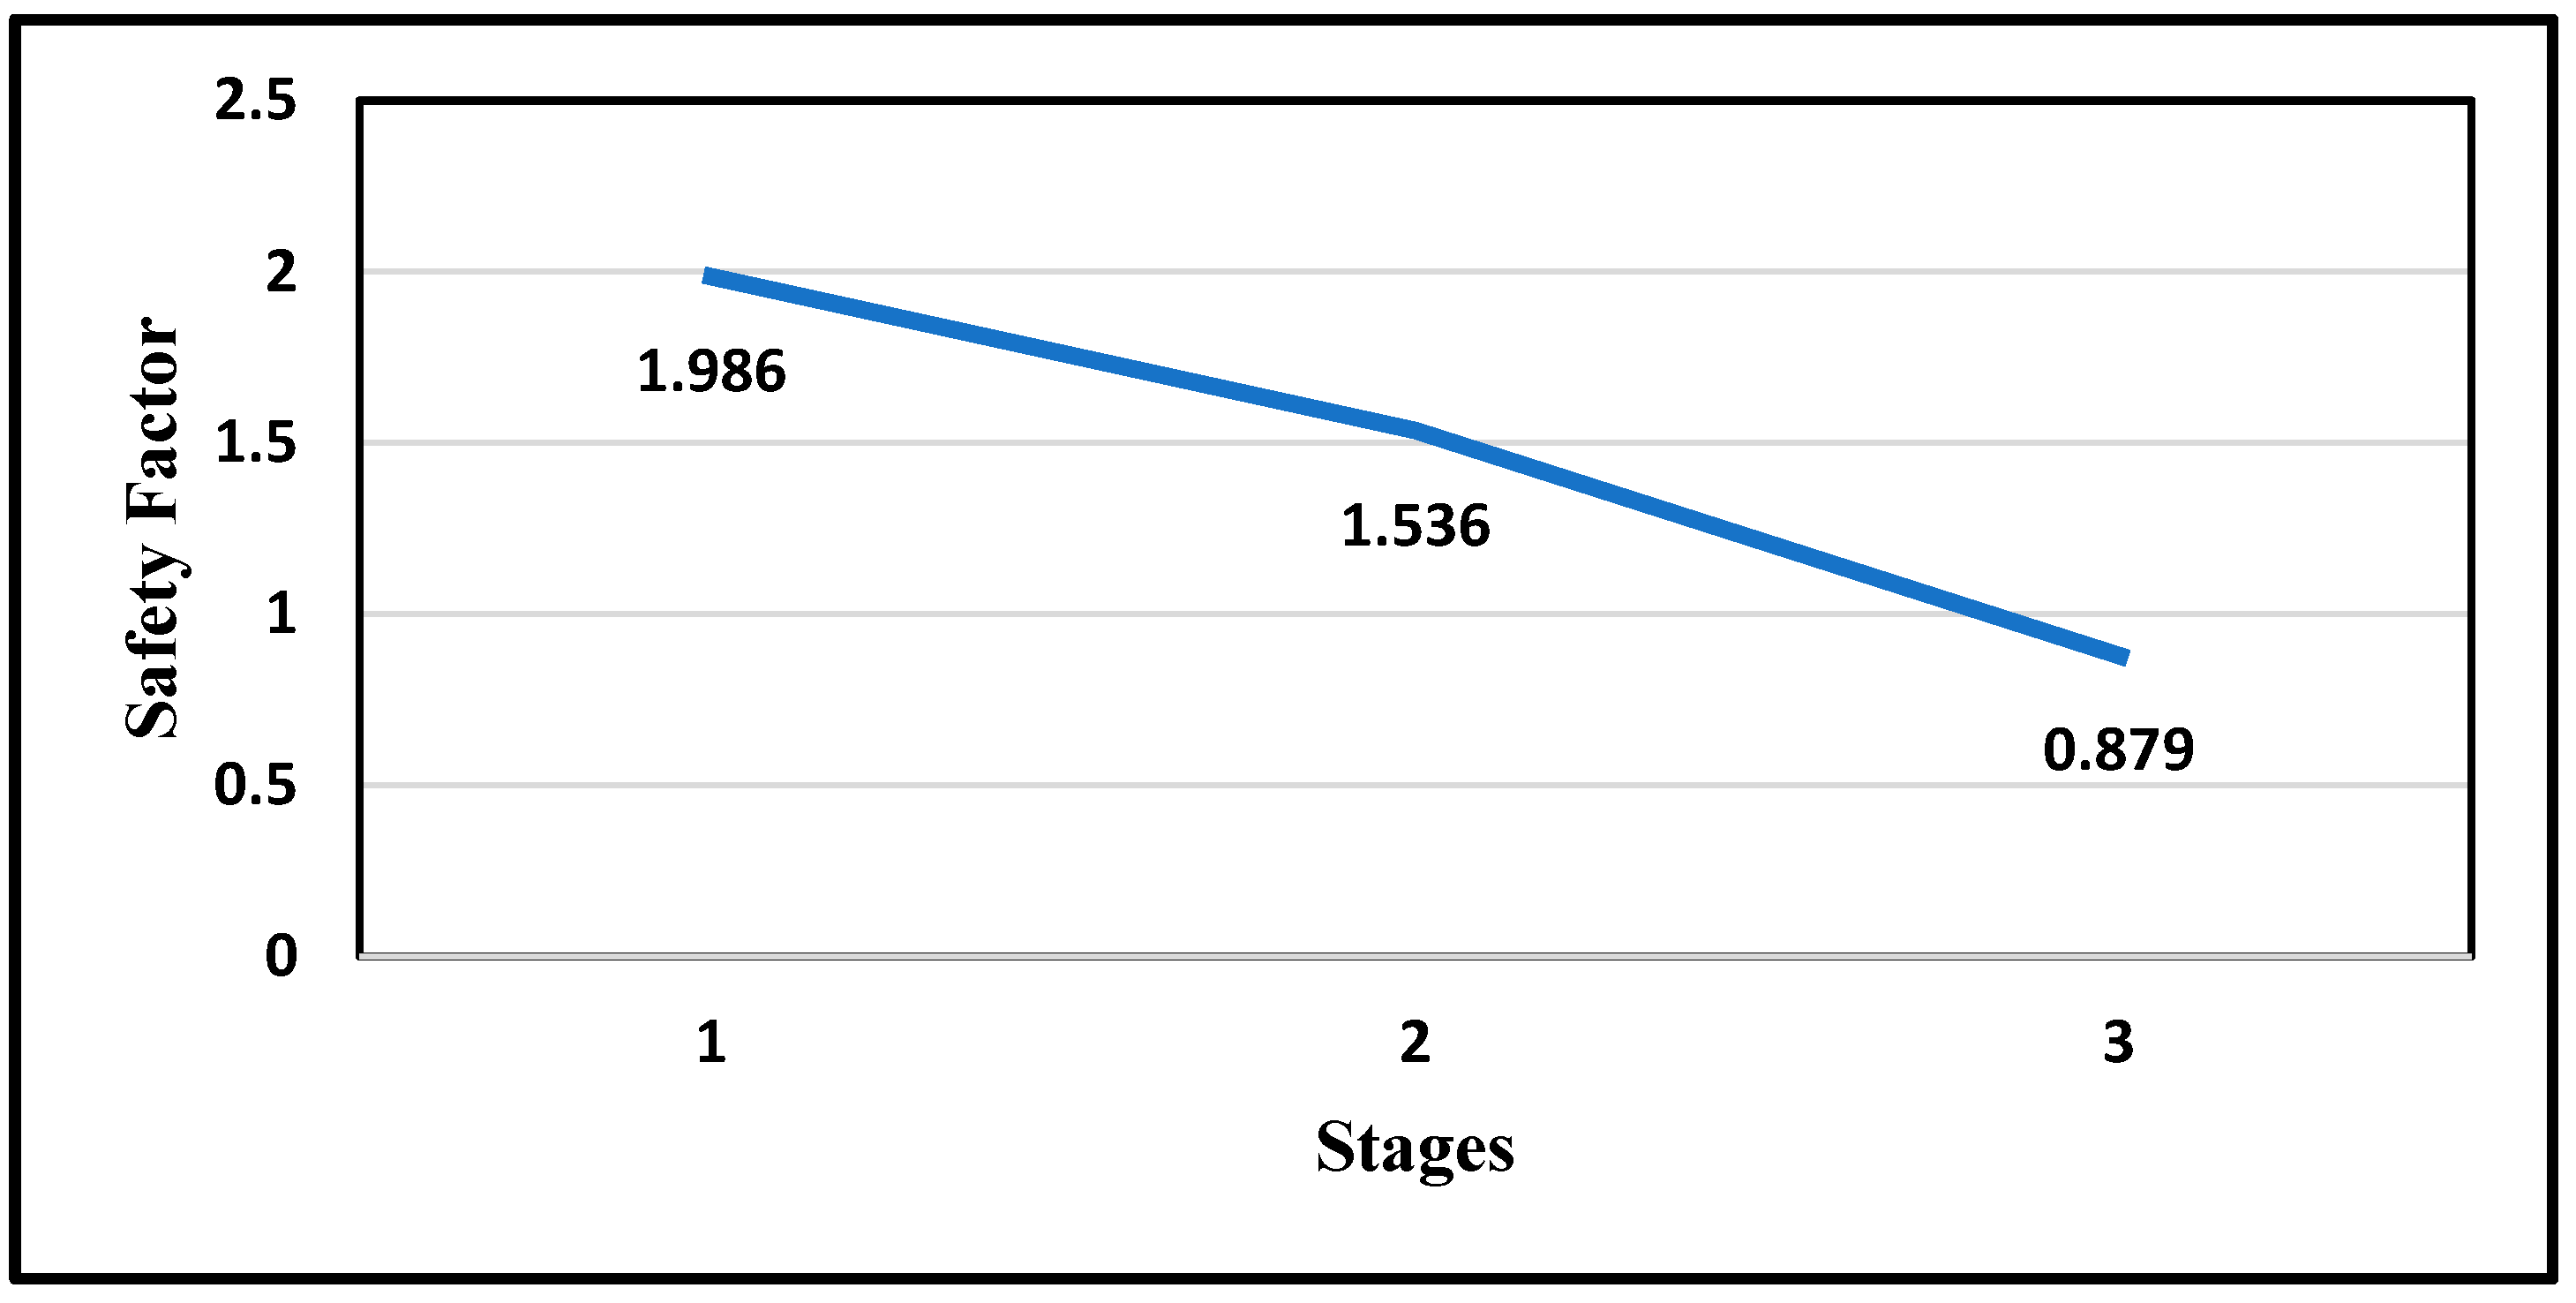
6.3. Reduction in Factor of Safety during Numerical Analysis

The critical factors influencing slope failures triggered by rainfall are the intensity and duration of the rainfall. The conventional and uniform slope inclined at 30 degrees was examined under various rainfall intensities over a 24 h period. Figure 16 illustrates the applied rainfall intensity on the slope for 24 h and the corresponding variations in the factor of safety. These values are derived from daily rainfall data sourced from the meteorological records of Mizoram for the year 2002–2022, provided by the Government of Mizoram. The average of the maximum daily rainfall is 80 mm/day, while the highest recorded rainfall in a single day reached 190 mm/day in the years 2002–2022. Rainfall intensity of 80 mm/day is considered low, while 190 mm/h is classified as high intensity. Prolonged rainfall reduces the factor of safety to a critical condition, mainly due to soil permeability facilitating water infiltration into the slope. The initial factor of safety was close to 2.0.
Figure 17a shows the initial factor of safety before rainfall, which is close to 2.0. Figure 17b shows that in the case of 80 mm/day rainfall intensity, it was found to be crucial for slope stability, as the safety factor decreased to 1.536, approaching the point of failure. Figure 17c shows that a rainfall intensity of 190 mm/day for 24 h induces excess pore water pressure, significantly reducing the safety factor to 0.879. The infiltration of rainfall into the soil leads to a decrease in the factor of safety, attributed to the reduction in matric suction and an increase in pore water pressure [18,45].
From Figure 17b,c, displacement contours effectively show how sections of a slope move under heavy rainfall of 80 mm/day and 190 mm/day, respectively, highlighting areas with significant movement near the surface where failures are likely to initiate. These areas, showing larger displacements, indicate critical zones where shear stresses approach or exceed the soil’s shear strength, suggesting the development of failure mechanisms. The analysis demonstrates that the upper layers of the slope are particularly vulnerable to rainfall infiltration, leading to potential shallow slope failures exacerbated by reduced effective stress and increased lubrication. This underscores the importance of monitoring and stabilizing slopes, especially in adverse weather conditions.

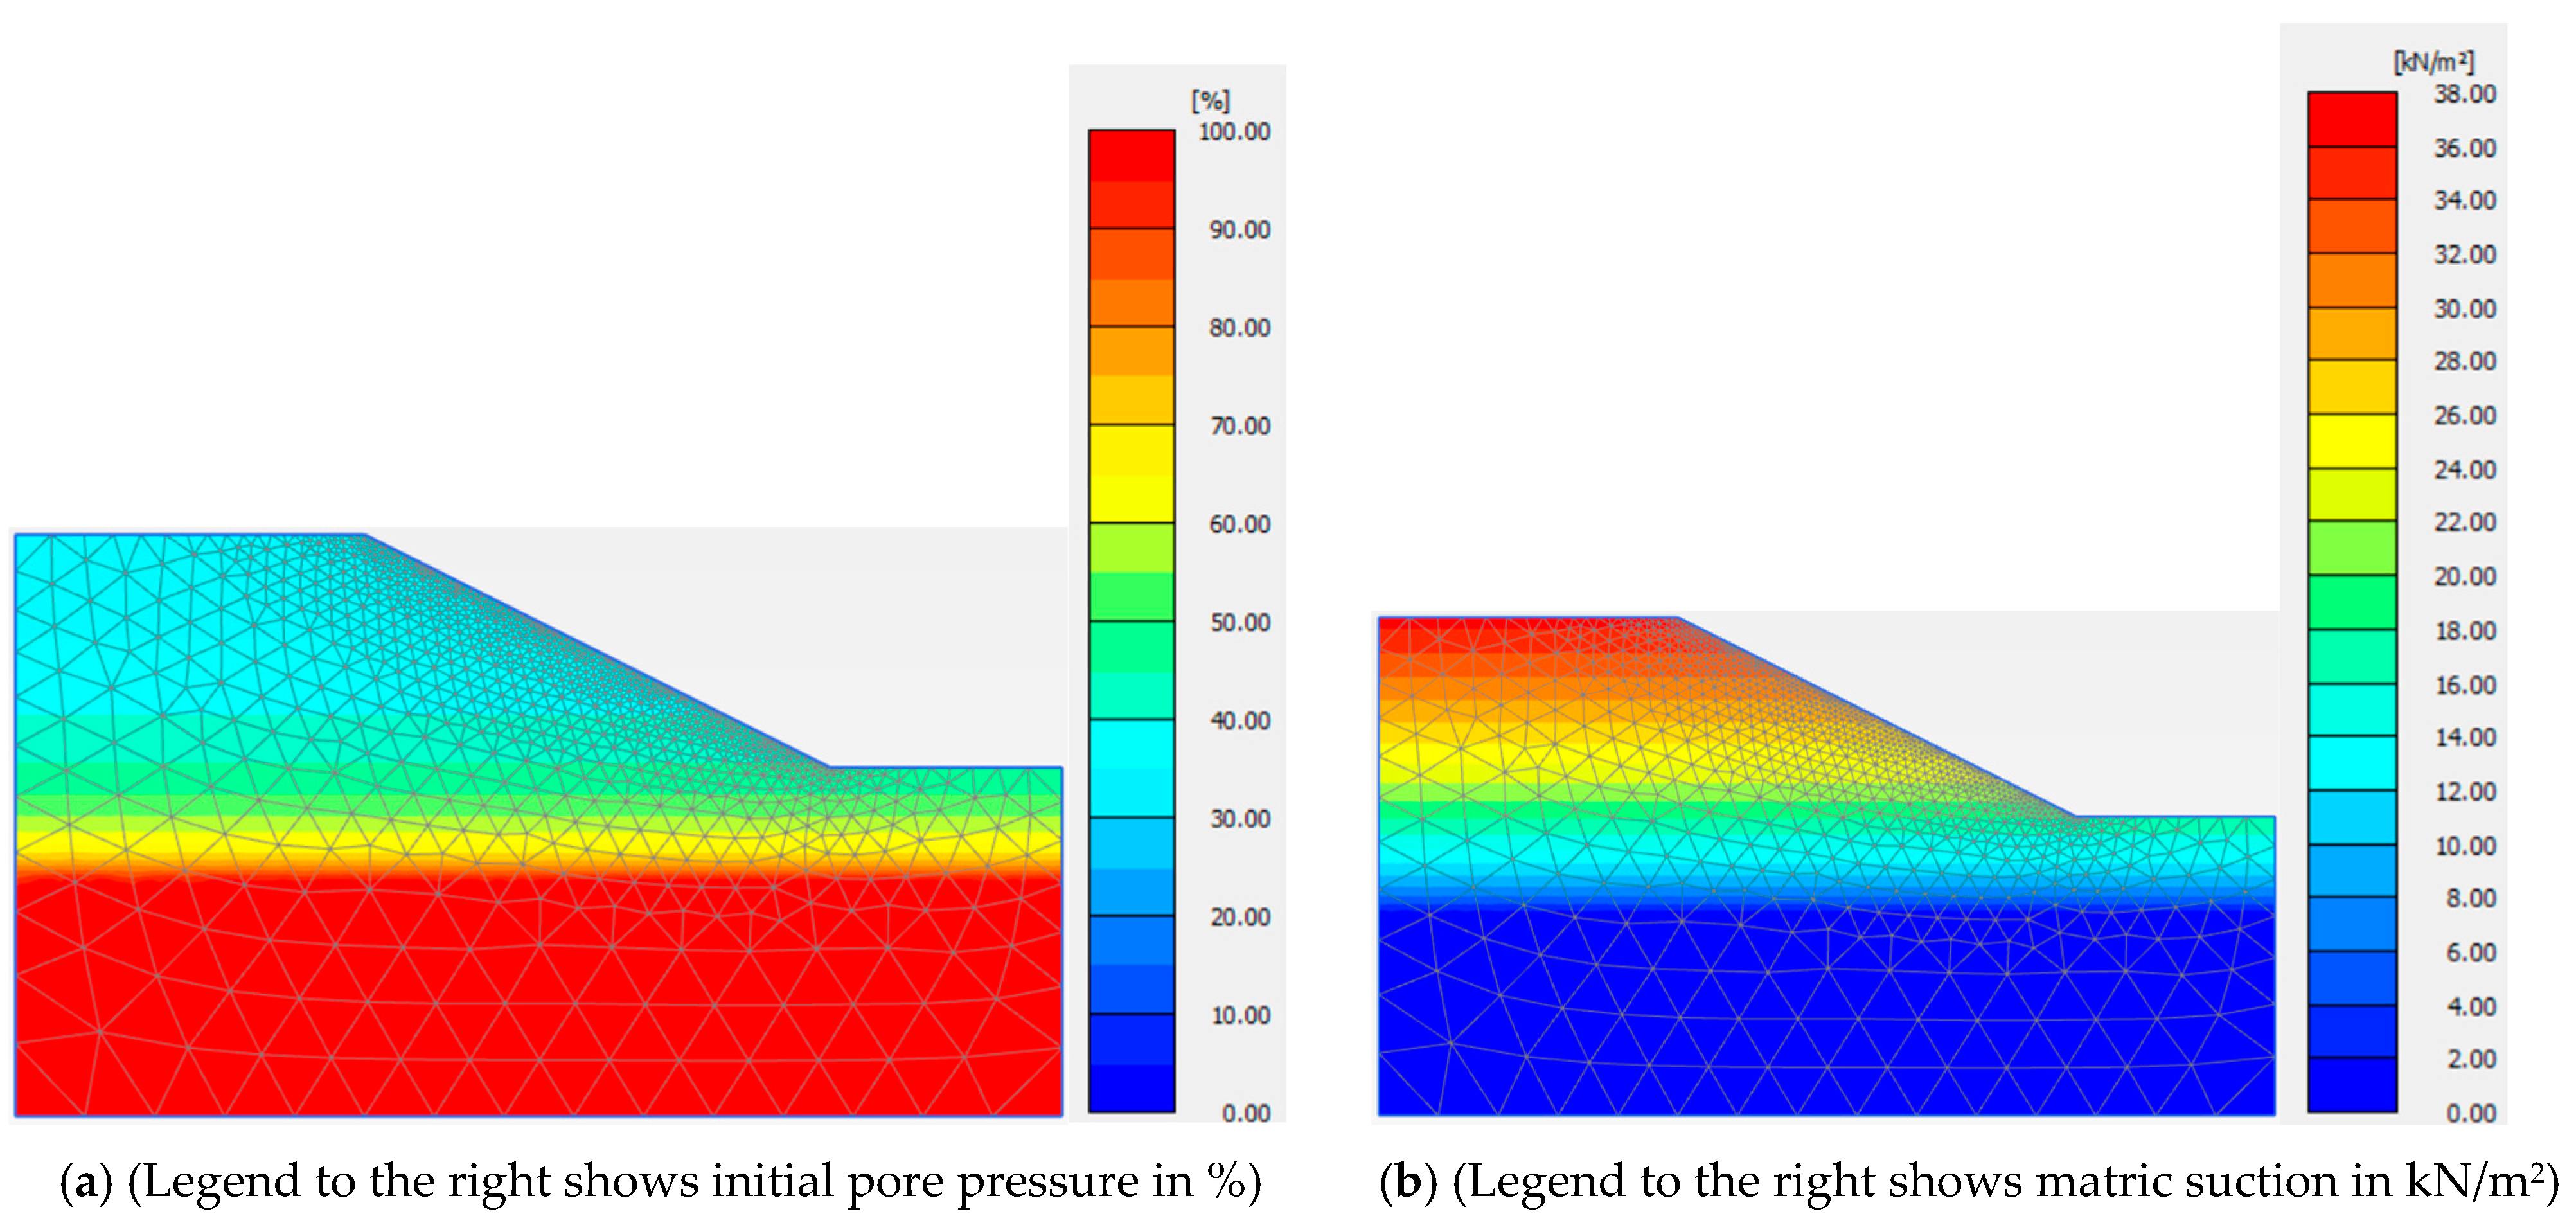
6.4. Variation in Pore Water Pressure and Matric Suction

The existing evidence strongly supports the notion that slope failure stems from a decrease in matric suction and the subsequent increase in pore water pressure. Matric suction emerges as the critical variable essential for evaluating the susceptibility of slope failures induced by rainfall [18]. The likelihood of slope failure is notably tied to the initial matric suction conditions of soils, both at the surface and subsurface. As illustrated in Figure 17, observable fluctuations in pore water pressure and matric suction due to rainfall infiltration reveal significant patterns. Notably, rainfall with a longer-duration rainfall and more intensity have a more pronounced influence [46,47].
Collectively, Figure 17 and Figure 18 show after the 80 mm/day rainfall for 24 h matric suction along the slope surface started to reduce significantly after the 190 mm/day rainfall. On the other hand, excess pore pressure started to increase along the slope surface after 80 mm/day and 190 mm/day rainfall infiltration, respectively [18]. Moreover, the reduction in matric suction becomes less prominent with increasing slope depth. The maximum reduction of suction is observed near the slope’s face, gradually diminishing with greater depth, a phenomenon associated with the presence of a groundwater table at elevated depths [48,49].
Additionally, the seismic response of Hyderabad’s primary soils is Black Cotton Soil, which swells and shrinks dramatically, and sandier Red Soil. Black Cotton Soil’s poor drainage and high swell-shrink behavior increase slope failure risks during earthquakes, potentially leading to liquefaction-like conditions. Red Soil, though better draining, has lower cohesion and is vulnerable to slope failures under seismic stress, especially in loose or steep areas. Even low-magnitude earthquakes can induce significant changes in pore water pressure due to the existing high saturation of soils. This makes even small seismic events capable of triggering liquefaction, thereby leading to failures.

7. Conclusions

The aims of this study are to (i) develop the SWCC curve for the sampled soils, (ii) reliably measure the UCS strength of the soils, and (iii) evaluate numerically the influences of both rainfall duration and intensity on slopes characterized by initially elevated soil matric suction resulting from an extended dry period. Soil suction measurement, its validation and microwave drying have been demonstrated to be reliable in developing the SWCC curves at different densities and degrees of saturation. A numerical analysis, utilizing finite element methods, was conducted on an idealized slope with a 30° angle. The analysis involved a coupled flow-deformation approach, enabling simultaneous examination of seepage and deformation behaviors. From the outcomes of this investigation, the following conclusions can be drawn:
  • Microwave drying times vary based on soil density, with specimens of higher density taking longer to dry than those with lower density. Based on soil type and compaction levels, Figure 12 indicates that specimens used in this study with reduced saturation levels—80%, 60%, 40%, and 20% from an initial 100%—can be achieved through microwave drying for durations of 70, 110, 140, and 180 s, respectively.
  • Matric suction in the soil is primarily determined by several soil properties, including water retention capacity, cohesion, mineral composition, temperature conditions and index properties of soil such as Atterberg’s limit, free swell index, and specific gravity.
  • Soils with higher plasticity are observed to require more pressure for water extraction, leading to increased soil suction. This highlights the relationship between soil plasticity and the effort needed to reduce moisture content, directly impacting the soil’s suction capabilities.
  • CI soil attains its highest Unconfined Compressive Strength (UCS) which is 564 kPa at a moisture saturation of 60% when compacted to its modified Proctor density. This moisture level is key to optimizing the soil structure and cohesion, enhancing its ability to support loads.
  • A decline in moisture content to 20% leads to a notable drop in CI soil strength ranges between 103 kPa to 299 kPa for different compactions. This decrease is due to inadequate water for proper particle bonding, resulting in weaker cohesion and lower UCS values, showing how dry conditions undermine the soil’s integrity.
  • Beyond the optimal saturation of 60%, at level 80% saturation, there is a progressive weakening of CI soil’s UCS up to 417 kPa. The additional moisture lubricates the soil particles, easing their movements under pressure and thus diminishing the soil strength and stability, especially as soil suction is reduced.
  • The findings reveal that extreme moisture conditions—both overly saturated and significantly under-saturated—threaten slope stability. While saturated conditions decrease soil suction and shear strength, insufficient moisture undermines particle cohesion and overall soil strength, increasing the risk of slope failure.
  • Maintaining CI soil around the 40% to 60% saturation level is crucial for maximizing its load-bearing properties and ensuring slope stability. This balance is vital for preventing slope failures, emphasizing the importance of monitoring and managing soil moisture levels in geotechnical engineering and construction projects.
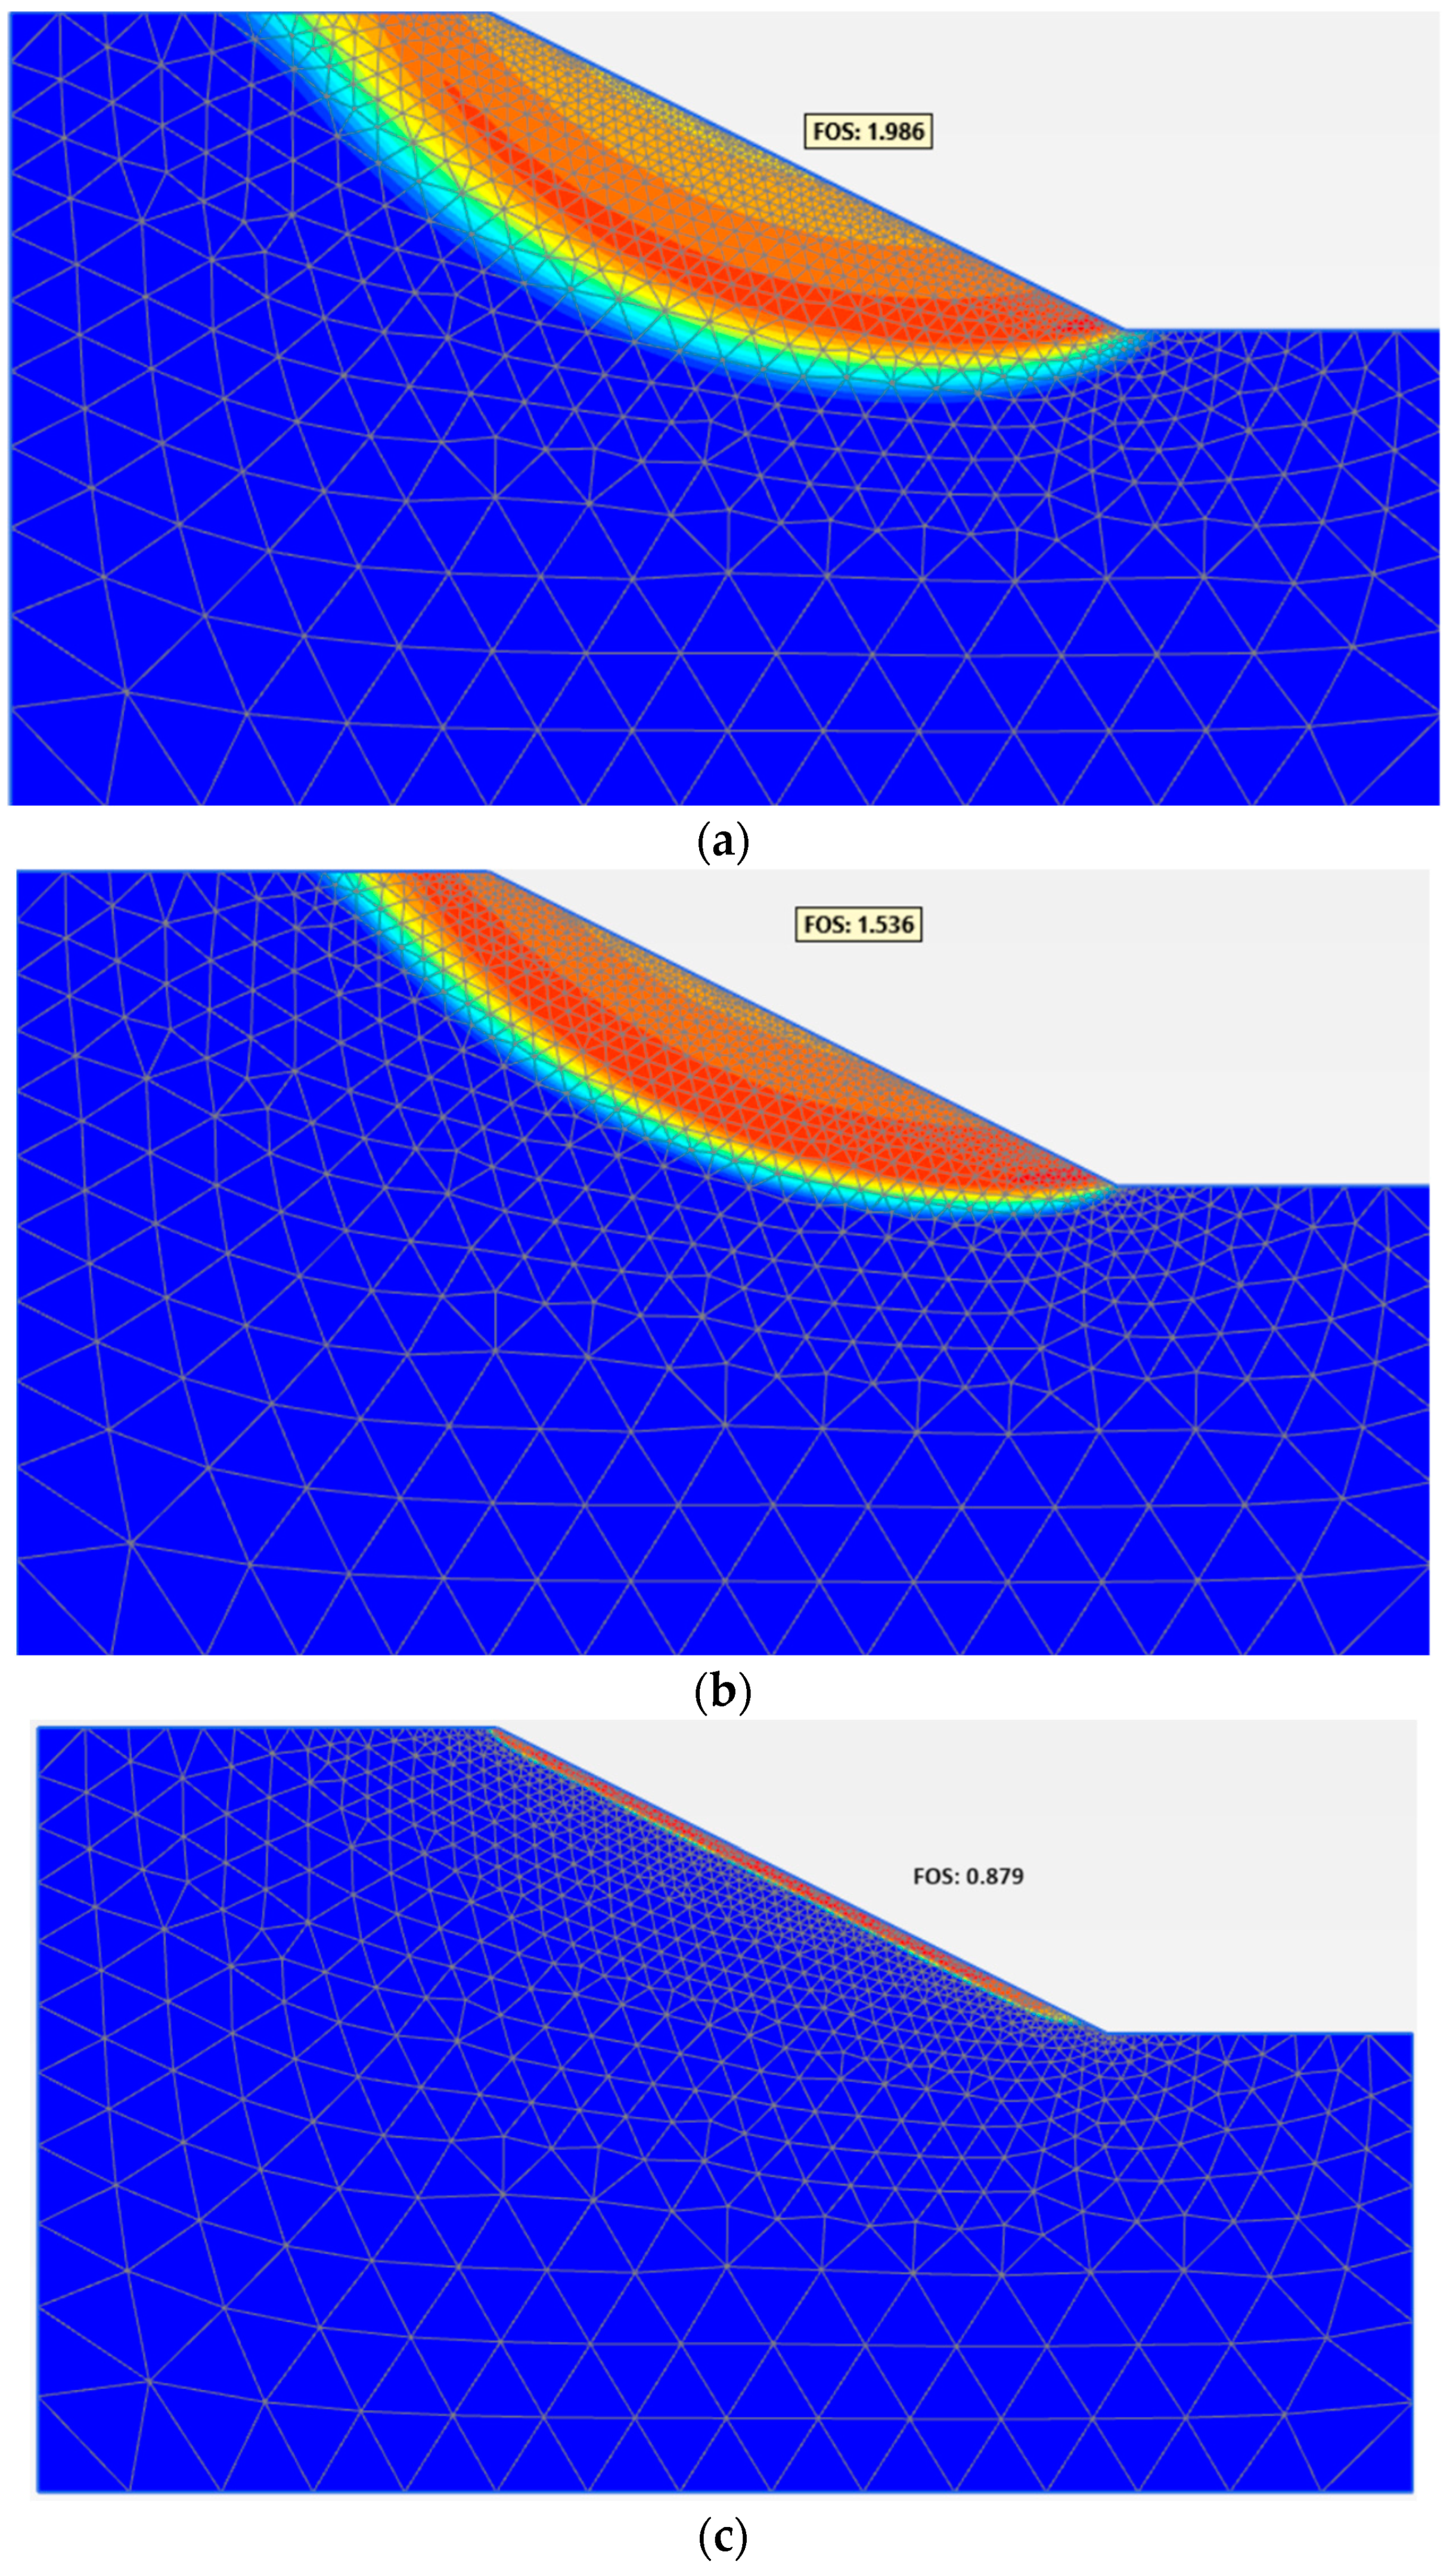
  • Apart from soil strength properties and slope geometry, the stability of slopes is significantly influenced by the duration and intensity of rainfall. The extent of infiltration is contingent upon the hydraulic characteristics of the soil. The fluctuation in simulated climate led to changes in the matric suction profile over different time periods. At the initial stage, the factor of safety was close to 2.0. During a 24 h period with rainfall intensity of 80 mm/day, the factor of safety decreased from 1.986 to 1.536, approaching a critical point. In a similar period with a higher rainfall intensity of 190 mm/day, the factor of safety further dropped to 0.879, creating a very critical condition.
  • Rainfall characterized by low intensity and extended duration is more critical when compared to high intensity and short-duration rainfall.
  • Slope failure originates from a decline in matric suction followed by an increase in pore water pressure. Matric suction becomes the crucial variable necessary for assessing the vulnerability of slope failures induced by rainfall.
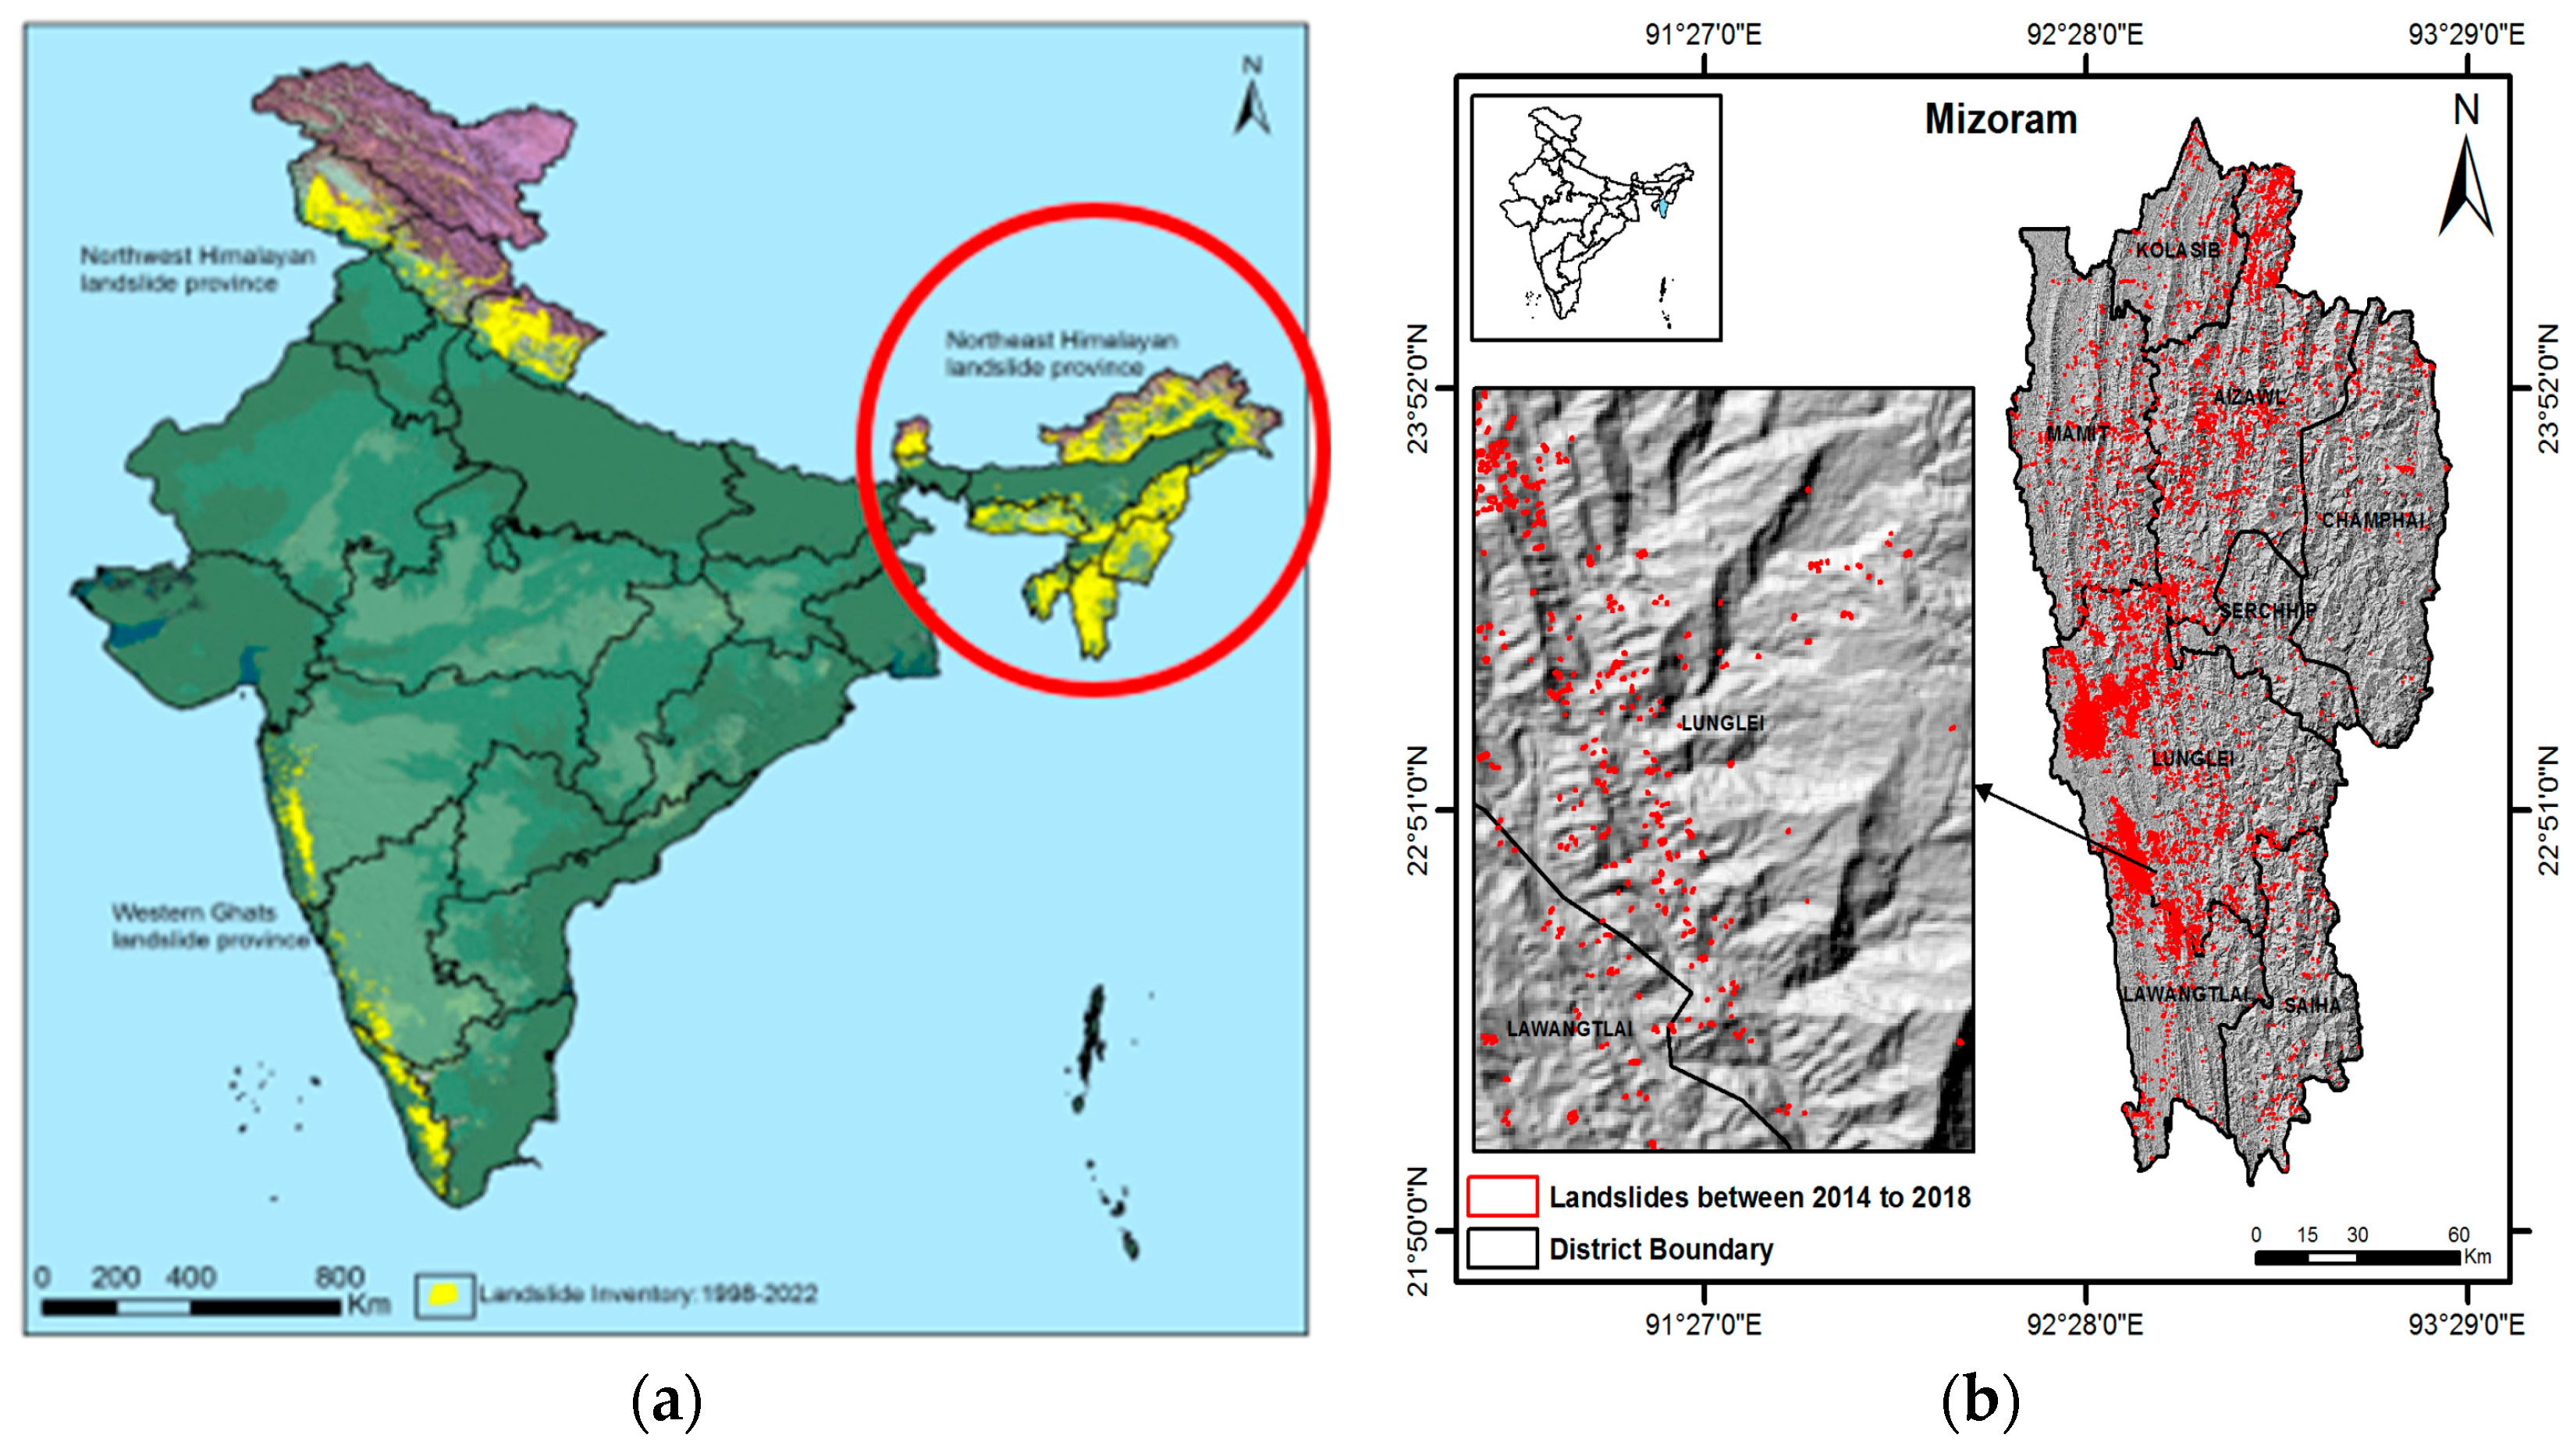
  • In regions such as Mizoram, a six-to-eight-month dry season induces substantial soil matric suction. Subsequently, heavy monsoonal activity reduces matric suction, and rainfall infiltration leads to an increase in pore water pressure. This increase in pore water pressure results in a notable mobilization of shear strength. Ultimately, the mobilized shear strength surpasses the resisting shear strength, particularly during the monsoon season, leading to the occurrence of shallow transitional landslides widely observed in the Lunglei district.
The study conducted in Peringavu, Kerala, India, where daily rainfall reached 84.5 mm/day, demonstrated a critical decrease in the factor of safety, dropping from an initial 1.459 to 0.582. This sharp decline was due to the intense rainfall saturating the soil, significantly lowering matric suction, and increasing positive pore water pressure [50,51]. These changes diminished the soil’s effective stress and shear strength at the slip surface, leading to a vertical cut failure and the collapse of a building [52,53]. This numerical analysis not only underscores the progressive deterioration of slope stability under different rainfall conditions but also aligns closely with the actual failure events observed in the field, offering crucial insights into the mechanics of slope failure and the management of effective stress [54,55].
It has been observed that soil failures can occur not only from the increase in positive pore water pressure in saturated soils due to rising groundwater levels but also from the loss of unsaturated shear strength resulting from the dissipation of matric suction [56,57]. The dissipation of matric suction in unsaturated soil can induce soil failure, influencing not only the occurrence of shallow landslides but also affecting the depth of failure and the timing, with these factors heavily dependent on rainfall conditions [20,58].
The current study offers a foundation for further exploration into predicting and analyzing factors like rainfall intensity, duration, and frequency, as well as antecedent soil conditions that impact slope stability.
Maintaining an appropriate level of soil moisture becomes essential for ensuring the stability of structures, especially during extreme conditions characterized by pore fluid fluctuation zones. Consequently, assessing the soil structure interaction necessitates a comprehensive understanding of saturation conditions. By prioritizing the evaluation of saturation conditions, we can effectively address the challenges posed by climate change and altered environmental loading, thereby promoting the stability and resilience of various structures.
Therefore, matric suction plays a crucial role in the stability of slopes, particularly following an extended dry period. This research can be utilized to develop real-time early warning systems employing soil matric suction reduction sensors and pore pressure sensors. Implementing such systems allows for proactive measures to be taken before landslides and slope failures, thereby minimizing potential damage, loss of property, and casualties [59].

8. Future Scope

The current study offers a foundation for further exploration into predicting and analyzing factors like rainfall intensity, duration, and frequency, as well as antecedent soil conditions that impact slope stability. This research can also aid in developing real-time technologies for sensing transitions in pore water pressure, utilizing sensors. By using laboratory data on soil matric suction at varying saturations (20%, 40%, 60%, and 80%) and different compaction levels, it is possible to model these pressure transitions effectively [48,59]. This approach can lead to the development of an early warning system or sensors designed to maintain optimal soil moisture, preventing slope failures. Additionally, the numerical analysis could be extended to perform forensic investigations of specific landslide incidents, enhancing our understanding of past failures and informing future preventative strategies [45,60].
Strategic partnerships are essential for construction safety to develop real-time early warning systems and sensors for monitoring pore water transitions [24,49]. Collaboration with the Mizoram government and the Mizoram Meteorological Department is crucial for accessing rainfall data and landslide hazard records. For effective landslide modeling and monitoring, a partnership with the Department of Space and the Indian Space Research Organization (ISRO) is necessary [61]. Additionally, alliances with institutes specializing in electrical and communication research are needed to analyze data and develop the necessary prototypes. These partnerships will facilitate the comprehensive development and deployment of advanced technologies for landslide risk management.

Author Contributions

Conceptualization, K.B. and D.E.L.O.; methodology, K.B. and D.E.L.O.; software, K.B.; validation, D.E.L.O.; formal analysis, K.B.; investigation, KB.; resources, K.B.; data curation, K.B.; writing—original draft preparation, K.B.; writing—review and editing, D.E.L.O.; visualization, K.B. and D.E.L.O.; supervision, D.E.L.O.; project administration, D.E.L.O. All authors have read and agreed to the published version of the manuscript.

Funding

This research received no external funding.

Data Availability Statement

The data presented in this study are available on request from the corresponding author due to (specify the reason for the restriction).

Conflicts of Interest

The authors declare no conflict of interest.

References

  1. Sorbino, G.; Nicotera, M. Unsaturated Soil Mechanics in Rainfall-Induced Flow Landslides. Eng. Geol. 2013, 165, 105–132. [Google Scholar] [CrossRef]
  2. Acharya, K.P.; Bhandary, N.P.; Dahal, R.K.; Yatabe, R. Seepage and Slope Stability Modelling of Rainfall-Induced Slope Failures in Topographic Hollows. Geomat. Nat. Hazards Risk 2014, 7, 721–746. [Google Scholar] [CrossRef]
  3. Sarkar, K.; Singh, A.K.; Niyogi, A.; Behera, P.K.; Verma, A.K.; Singh, T.N. The Assessment of Slope Stability along NH-22 in Rampur-Jhakri Area, Himachal Pradesh. J. Geol. Soc. India 2016, 88, 387–393. [Google Scholar] [CrossRef]
  4. Singh, A.K.; Kundu, J.; Sarkar, K. Stability Analysis of a Recurring Soil Slope Failure along NH-5, Himachal Himalaya, India. Nat. Hazards 2018, 90, 863–885. [Google Scholar] [CrossRef]
  5. Barman, J.; Biswas, B.; Das, J. Mizoram, the Capital of Landslide: A Review of Articles Published on Landslides in Mizoram, India; Springer: Cham, Switzerland, 2022; pp. 97–104. [Google Scholar] [CrossRef]
  6. Santhosh Kumar, V.; Sennimalai Chandrasekaran, S. Analysis of Failure of High Slope Subjected to Rainfall Infiltration at Peringavu in Kerala, India. Eng. Fail. Anal. 2022, 138, 106423. [Google Scholar] [CrossRef]
  7. Pachuau, L. Zonation of Landslide Susceptibility and Risk Assessment in Serchhip Town, Mizoram. J. Indian Soc. Remote Sens. 2019, 47, 1587–1597. [Google Scholar] [CrossRef]
  8. Lallianthanga, R.; Laltanpuia, Z. Landslide Hazard Zonation Mapping of Hnahthial Town, Mizoram, India Using Remote Sensing & GIS. Int. J. Eng. Tech. Res. 2014, 2, 56–63. [Google Scholar]
  9. Jain, N.; Martha, T.R.; Jalan, P.; Nanda, A. Landslide Atlas of India; National Remote Sensing Centre, ISRO, Department of Space, Government of India: Telangana, India, 2023.
  10. Talukdar, P.; Bora, R.; Dey, A. Numerical Investigation of Hill Slope Instability Due to Seepage and Anthropogenic Activities. Indian Geotech. J. 2018, 48, 585–594. [Google Scholar] [CrossRef]
  11. Government of Mizoram. Meteorological Data of Mizoram, 2021; Directorate of Economics & Statistics, Planning & Programme Implementation Department, Government of Mizoram: Guwahati, India, 2021.
  12. Rahardjo, H.; Kim, Y.; Satyanaga, A. Role of Unsaturated Soil Mechanics in Geotechnical Engineering. Int. J. Geo-Eng. 2019, 10, 8. [Google Scholar] [CrossRef]
  13. Fredlund, D.G.; Morgenstern, N.R.; Widger, R.A. The Shear Strength of Unsaturated Soils. Can. Geotech. J. 1978, 15, 313–321. [Google Scholar] [CrossRef]
  14. Lallianthanga, R.K.; Lalbiakmawia, F.; Lalramchuana, F. Landslide Hazard Zonation of Mamit Town, Mizoram, India Using Remote Sensing and GIS Techniques. Int. J. Geol. Earth Environ. Sci. 2013, 3, 184–194. [Google Scholar]
  15. Sanga, J.L.T. Mizoram State Disaster Management Plan 2021; Government of Mizoram: Aizwal, India, 2021; pp. 1–251.
  16. Lallianthanga, R.; Laltanpuia, Z.D. Landslide Hazard Zonation of Lunglei Town, Mizoram, India Using High Resolution Satellite Data. Int. J. Adv. Remote Sens. GIS 2013, 2, 148–159. [Google Scholar]
  17. Bhadiyadra, K.; Desai, N.; Sheth, K. Evaluation of SWCC Curves and Undrained Shear Parameters at Different Densities and Saturations of Unsaturated Clay; Springer: Singapore, 2021; pp. 533–542. [Google Scholar] [CrossRef]
  18. Zhang, L.L.; Fredlund, D.G.; Zhang, L.M.; Tang, W.H. Numerical Study of Soil Conditions under Which Matric Suction Can Be Maintained. Can. Geotech. J. 2004, 41, 569–582. [Google Scholar] [CrossRef]
  19. Merat, S.; Djerbal, L.; Bahar, R. Numerical Analysis of Climate Effect on Slope Stability. In PanAm Unsaturated Soils 2017; American Society of Civil Engineers: Dallas, TX, USA, 2018; pp. 308–318. [Google Scholar] [CrossRef]
  20. Omoregie, A.I.; Khoshdelnezamiha, G.; Senian, N.; Ong, D.E.L.; Nissom, P.M. Experimental Optimisation of Various Cultural Conditions on Urease Activity for Isolated Sporosarcina Pasteurii Strains and Evaluation of Their Biocement Potentials. Ecol. Eng. 2017, 109, 65–75. [Google Scholar] [CrossRef]
  21. Ng, L.T.; Ong, D.E.L.; Wong, W.S.H.; Gannilegedera, D.A.; Jong, B.F.; Chua, H.S. Real-time monitoring and assessment of groundwater responses due to dewatering of an abandoned 7m deep excavation pit in Kuching City. In Proceedings of the 14th International Conference of International Association for Computer Methods and Recent Advances in Geomechanics, 2014 (IACMAG 2014), Kyoto, Japan, 22–25 September 2014; pp. 1205–1211. [Google Scholar]
  22. Albanwan, H.; Qin, R.; Liu, J.-K. Remote Sensing-Based 3D Assessment of Landslides: A Review of the Data, Methods, and Applications. Remote Sens. 2024, 16, 455. [Google Scholar] [CrossRef]
  23. Kim, J.; Hwang, W.; Kim, Y. Effects of Hysteresis on Hydro-Mechanical Behavior of Unsaturated Soil. Eng. Geol. 2018, 245, 1–9. [Google Scholar] [CrossRef]
  24. Anderson, M.G.; Howes, S. Development and Application of a Combined Soil Water-Slope Stability Model. Q. J. Eng. Geol. 1985, 18, 225–236. [Google Scholar] [CrossRef]
  25. Zhao, F.; Miao, F.; Wu, Y.; Ke, C.; Gong, S.; Ding, Y. Refined Landslide Susceptibility Mapping in Township Area Using Ensemble Machine Learning Method under Dataset Replenishment Strategy. Gondwana Res. 2024, 131, 20–37. [Google Scholar] [CrossRef]
  26. Dutta, P.; Sarma, S. Landslide Susceptibility Zoning Of The Kalapahar Hill, Guwahati, Assam State, (India), Using A Gis-Based Heuristic Technique. Int. J. Remote Sens. Geosci. 2013, 2, 49–55. [Google Scholar]
  27. Leong, H.Y.; Ong, D.; Sanjayan, J.; Nazari, A. A Genetic Programming Predictive Model for Parametric Study on Factors Affecting Strength of Geopolymers. RSC Adv. 2015, 5, 85630–85639. [Google Scholar] [CrossRef]
  28. IS-2720-6; Methods of Test for Soils, Part VI: Determination of Shrinakge Factor. Bureau of Indian Standards: New Delhi, India, 1972.
  29. IS 2720-11; Methods of Test for Soils, Part 11: Determination of the Shear Strength Parameters of a Specimen Tested in Unconsolidated Undrained Triaxial Compression without the Measurement of Pore Water Pressure. Bureau of Indian Standards: New Delhi, India, 1993.
  30. IS 2720-10; Methods of Test for Soils, Part 10: Determination of Unconfined Compressive Strength. Bureau of Indian Standards: New Delhi, India, 1991. Available online: http://archive.org/details/gov.in.is.2720.10.1991 (accessed on 12 August 2023).
  31. IS 2720-7; Methods of Test for Soils, Part 7: Determination of Water Content-Dry Density Relation Using Light Compaction. Bureau of Indian Standards: New Delhi, India, 1980.
  32. IS 2720-8; Methods of Test for Soils, Part 8: Determination of Water Content-Dry Density Relation Using Heavy Compaction. Bureau of Indian Standards: New Delhi, India, 1983.
  33. IS 2720-5; Methods of Test for Soils, Part 5: Determination of Liquid and Plastic Limit. Bureau of Indian Standards: New Delhi, India, 1985.
  34. IS 2720-3-1; Methods of Test for Soils, Part 3: Determination of Specific Gravity, Section 1: Fine Grained Soils. Bureau of Indian Standards: New Delhi, India, 1980.
  35. IS 2720-2; Methods of Test for Soils, Part 2: Determination of Water Content. Bureau of Indian Standards: New Delhi, India, 1973.
  36. IS 2720-4; Methods of Test for Soils, Part 4: Grain Size Analysis. Bureau of Indian Standards: New Delhi, India, 1985.
  37. ASTM D5298-03; Test Method for Measurement of Soil Potential (Suction) Using Filter Paper. ASTM: West Conshohocken, PA, USA, 2003. [CrossRef]
  38. Van Genuchten, M.; Leij, F.; Yates, S.; Williams, J. The RETC Code for Quantifying Hydraulic Functions of Unsaturated Soils; U.S. Environmental Protection Agency: Washington, DC, USA, 1991; Volume 83, EPA/600/2-91/065 (NTIS 92-119668).
  39. Choudhury, C.; Tadikonda, B. Soil-Water Characteristic Curve Models For Clays. In Proceedings of the Indian Geotechnical Conference IGC-2014, Kakinada, India, 18–20 December 2014. [Google Scholar]
  40. ASTM D4643-08; Test Method for Determination of Water (Moisture) Content of Soil by Microwave Oven Heating. ASTM: West Conshohocken, PA, USA, 2017. [CrossRef]
  41. Brinkgreve, R.B.; Engin, J.E.; Swolfs, W.M. Plaxis 2D User Manual. Plaxis bv (2010). Bentaly Systems. Plaxis Groundwater Theory Manual, Note—PLAXIS LE Groundwater 1D/2D/3D Saturated/Unsaturated. Available online: https://communities.bentley.com/cfs-file/__key/communityserver-wikis-components-files/00-00-00-05-58/3113.PLAXIS2DCE_2D00_V20.02_2D00_2_2D00_Reference.pdf (accessed on 16 June 2024).
  42. Ong, D.; Yang, D.; Phang, S. Comparison of Finite Element Modelling of a Deep Excavation Using SAGE-CRISP and PLAXIS. In Proceedings of the International Conference on Deep Excavations, Singapore, 28–30 June 2006; pp. 28–30. [Google Scholar]
  43. Farthing, M.; Ogden, F. Numerical Solution of Richards’ Equation: A Review of Advances and Challenges. Soil. Sci. Soc. Am. J. 2017, 81, 1257–1269. [Google Scholar] [CrossRef]
  44. Cai, F.; Ugai, K. Numerical Analysis of Rainfall Effects on Slope Stability. Int. J. Geomech. 2004, 4, 69–78. [Google Scholar] [CrossRef]
  45. Chinkulkijniwat, A.; Horpibulsuk, S.; Semprich, S. Modeling of Coupled Mechanical-Hydrological Processes in Compressed-Air-Assisted Tunneling in Unconsolidated Sediments. Transp. Porous Media 2015, 108, 105–129. [Google Scholar] [CrossRef]
  46. Tinjum, J.M.; Benson, C.H.; Blotz, L.R. Soil-Water Characteristic Curves for Compacted Clays. J. Geotech. Geoenviron. Eng. 1997, 123, 1060–1069. [Google Scholar] [CrossRef]
  47. Zhou, J.-W.; Haibo, L.; Lu, G.; Zhou, Y.; Zhang, J.-Y.; Fan, G. Initiation Mechanism and Quantitative Mass Movement Analysis of the 2019 Shuicheng Catastrophic Landslide. Q. J. Eng. Geol. Hydrogeol. 2020, 54, qjegh2020-052. [Google Scholar] [CrossRef]
  48. Chong, E.E.-M.; Ong, D.E.-L. Data-Driven Field Observational Method of a Contiguous Bored Pile Wall System Affected by Accidental Groundwater Drawdown. Geosciences 2020, 10, 268. [Google Scholar] [CrossRef]
  49. Kramarenko, V.; Nikitenkov, A.; Matveenko, I.; Molokov, V.; Vasilenko, Y. Determination of Water Content in Clay and Organic Soil Using Microwave Oven. IOP Conf. Ser. Earth Environ. Sci. 2016, 43, 012029. [Google Scholar] [CrossRef]
  50. Naseer, S.; Evans, R. Effect of Rainfall Intensity and Duration on Stability of Natural Slopes of Unsaturated Fine Soils. In CSCE 31st August 2022: Proceedings Book; Shah, M., Ed.; Capital University of Science and Technology: Islamabad, Pakistan, 2022; pp. 405–411. [Google Scholar]
  51. Simeoni, L.; Tarantino, A.; Mongiovi, L. Effects of Unsaturation on the Stability of a Moraine Slope. In Unsaturated Soils: Experimental Studies; Schanz, T., Ed.; Springer: Berlin/Heidelberg, Germany, 2005; pp. 497–508. [Google Scholar] [CrossRef]
  52. Yubonchit, S.; Chinkulkijniwat, A.; Jothityangkoon, C.; Arulrajah, A.; Suddeepong, A. Influence Factors Involving Rainfall-Induced Shallow Slope Failure: Numerical Study. Int. J. Geomech. 2016, 17, 04016158. [Google Scholar] [CrossRef]
  53. Coates, D.R. Environmental Geology, 1st ed.; Wiley: Hoboken, NJ, USA, 1981. [Google Scholar]
  54. Ikeagwuani, C.C.; Nwonu, D.C. Emerging Trends in Expansive Soil Stabilisation: A Review. J. Rock. Mech. Geotech. Eng. 2019, 11, 423–440. [Google Scholar] [CrossRef]
  55. Azarafza, M.; Hajialilue Bonab, M.; Derakhshani, R. A Novel Empirical Classification Method for Weak Rock Slope Stability Analysis. Sci. Rep. 2022, 12, 14744. [Google Scholar] [CrossRef]
  56. Omoregie, A.I.; Palombo, E.A.; Ong, D.E.L.; Nissom, P.M. Biocementation of Sand by Sporosarcina Pasteurii Strain and Technical-Grade Cementation Reagents through Surface Percolation Treatment Method. Constr. Build. Mater. 2019, 228, 116828. [Google Scholar] [CrossRef]
  57. Travis, Q.; Houston, S.; Marinho, F.; Schmeeckle, M. Unsaturated Infinite Slope Stability Considering Surface Flux Conditions. Eng. J. Geotech. Geoenviron. Eng. 2009, 136, 963–974. [Google Scholar] [CrossRef]
  58. Omoregie, A.I.; Palombo, E.A.; Ong, D.E.L.; Nissom, P.M. A Feasible Scale-up Production of Sporosarcina Pasteurii Using Custom-Built Stirred Tank Reactor for in-Situ Soil Biocementation. Biocatal. Agric. Biotechnol. 2020, 24, 101544. [Google Scholar] [CrossRef]
  59. Hill, A. Microwave Ovens; ILSI Europe: Brussels, Belgium; ILSI Press: Washington, DC, USA, 1998. [Google Scholar]
  60. Leung, C.; Chow, K.; Shen, R. Behavior of Pile Subject to Excavation-Induced Soil Movement. J. Geotech. Geoenviron. Eng. J. Geotech. Geoenviron. Eng. 2000, 126, 947–954. [Google Scholar] [CrossRef]
  61. Pitchai, K.; Birla, S.L.; Subbiah, J.; Jones, D.; Thippareddi, H. Coupled Electromagnetic and Heat Transfer Model for Microwave Heating in Domestic Ovens. J. Food Eng. 2012, 112, 100–111. [Google Scholar] [CrossRef]
Figure 1. (a) Definition of the Vadose or Unsaturated Soil Zone; (b) Moisture flux components associated with the calculation of net moisture flux at ground surface.
Geosciences 14 00174 g001
Figure 2. Typical Soil-Water Characteristic Curve.
Geosciences 14 00174 g002
Figure 3. (a) Landslide inventory of India. (b) Landslides mapped using high-resolution satellite data in Mizoram, which occurred between 2014–2018. (National Remote Sensing Centre, ISRO, Hyderabad, India).
Geosciences 14 00174 g003
Figure 4. (a) Pre-image: RESOURCESAT 2 LISS IV Mx (7 December 2013), (b) Post-image: RESOURCESAT 2 LISS IV Mx (5 January 2017). Landslide locations from Lunglei, Mizoram. Landslide was triggered in the Lunglei of Mizoram due to heavy monsoonal rain in 2017. The landslide is a shallow transitional failure.
Geosciences 14 00174 g004
Figure 5. Particle size distribution curve of soil.
Geosciences 14 00174 g005
Figure 6. A-line curve for Atterberg’s limit which shows the soil sample is classified as clay with intermediate plasticity (CI).
Geosciences 14 00174 g006
Figure 7. (a) Aluminum plungers and PVC mold; (b) Whatman No. 42 filter papers; (c) Prepared assembly for soil suction measurement; (d) Moisture content of filter paper measurement.
Geosciences 14 00174 g007
Figure 8. (a) 2-dimensional and (b) 3-dimensional plots of soil suction at different dry density and saturation conditions for CI Soil (SWCC curve).
Geosciences 14 00174 g008
Figure 9. SWCC Validation on RETC Software at Different Densities of Soil Samples.
Geosciences 14 00174 g009
Figure 10. (a) Remolding assembly with layer measurement tool; (b) 24 h soaking of sample prior to casting of specimens under temperature-controlled condition; (c) Specimen extraction by mechanical sample extractor; (d) Three identical soil specimens tested.
Geosciences 14 00174 g010
Figure 11. (a) Prepared soil specimens (38 mm dia. and 76 mm height) in desiccator; (b) Dried soil specimens after microwave process; (c) Soil specimens being dried in the microwave oven according to ASTM 4643-8:2008 [1].
Geosciences 14 00174 g011
Figure 12. Reduction in moisture content vs. time relation for soil specimen dried in microwave oven according to ASTM 4643-8: 2008.
Geosciences 14 00174 g012
Figure 13. Slope geometry and typical mesh for finite element analysis.
Geosciences 14 00174 g013
Figure 14. Annual Rainfall Trend for the Past 20 Years (2002–2021), Lunglei district (Mizoram Meteorological Department).
Geosciences 14 00174 g014
Figure 15. Unconfined compressive strength at different density and saturation levels.
Geosciences 14 00174 g015
Figure 16. Variation in factor of safety with different rainfall intensities.
Geosciences 14 00174 g016
Figure 17. (a) Deep critical failure surface without rainfall, (b) Deep critical failure surface after 80 mm/day rainfall for 24 h, (c) Critical shallow transitional failure surface after 190 mm/day rainfall for 24 h.
Geosciences 14 00174 g017
Figure 18. (a,b) are the initial pore water pressure and matric suction condition, respectively, (c,d) are the pore pressure and matric suction condition after 80 mm/day rainfall, respectively, (e,f) are the pore pressure and matric suction conditions after 190 mm/day rainfall respectively.
Geosciences 14 00174 g018aGeosciences 14 00174 g018b
Table 1. Landslide hazard class and their corresponding area [16].
Hazard ClassArea (Sq. km)Percentage (%)
Very high1822.488.65
High4263.7920.22
Moderate8903.4742.24
Low5011.5723.77
Very low968.724.60
Water body111.970.53
Table 2. Index properties of the soil used for this study.
Index Properties of Soil
Gravel %1.5
Coarse Sand %1.5
Medium Sand %5
Fine Sand %22
Silt + Clay %70
Silt %59.72
Clay %10.28
Liquid Limit %40
Plastic Limit %08
Plasticity Index %32
Specific Gravity2.794
Free Swell Index15
Standard Proctor Optimum Moisture Content (%)17.50
Standard Proctor Maximum Dry Density (g/cm3)1.755
Modified Proctor Optimum Moisture Content (%)16.82
Modified Proctor Optimum Dry Density (g/cm3)1.853
IS ClassificationCI
Textural ClassificationSilt Loam
Table 3. Matric Suction at Different Density and Saturation of Soil sample.
Dry Density (g/cm3)Saturation (%)Water Content (%)VWCMatric Suction (kPa)
1.6205.3420.0851170
4010.6840.171784
6016.0250.256389
8021.3670.342123
10026.7090.42737
1.65204.9630.0821227
409.9260.164812
6014.8890.246407
8019.8520.328152
10024.8150.40959
1.7204.6070.0781296
409.2130.157849
6013.8200.235432
8018.4260.313184
10023.0330.39276
1.75204.2700.0751342
408.5410.149881
6012.8110.224456
8017.0820.299217
10021.3520.374101
1.8203.9530.0711389
407.9060.142823
6011.8590.213471
8015.8120.285249
10019.7650.356139
1.85203.6530.0681427
407.3050.135959
6010.9580.203497
8014.6100.270289
10018.2630.338161
Table 4. Microwave operating conditions as per ASTM D4643-08.
Method AdoptedCumulative Drying Using Single Specimen
Soil TypeCI Soil
Dry Density:1.60 g/cm3 to 1.85 g/cm3
Initial Saturation (%)100%
Diameter of Specimens38 mm
Height of Specimens76 mm
Average Weight of SpecimenRanges between 172 to 190 g
Microwave ConditionMicrowaving without preheat and power saving mode (At 700 w) [6]
Table 5. Unconfined Compressive Strength of CI Soil at Different Degrees of Saturation and Different Compactions.
Dry Density (g/cm3)1.601.651.701.751.801.85
Degree of Saturation (%)Unconfined Compressive Strength (kPa)
20103134299254232195
40132352384229413554
60197335474411550564
80179208232434530417
Table 6. Shear Strength and unsaturated soil parameters of the soil used in numerical analysis.
ParametersYoung’s Modulus (kN/m2)Effective Cohesion (kN/m2)Effective Friction Angle (°)Poisson’s RatioDilatancy Angle (°)Eoedref (kN/m2)Eurref (kN/m2)
Results20,0000.5300.20060,00020,000
Disclaimer/Publisher’s Note: The statements, opinions and data contained in all publications are solely those of the individual author(s) and contributor(s) and not of MDPI and/or the editor(s). MDPI and/or the editor(s) disclaim responsibility for any injury to people or property resulting from any ideas, methods, instructions or products referred to in the content.

