
Portable Dynamic Chest Radiography: Literature Review and Potential Bedside Applications

 ,
, 
Abstract
:1. Introduction
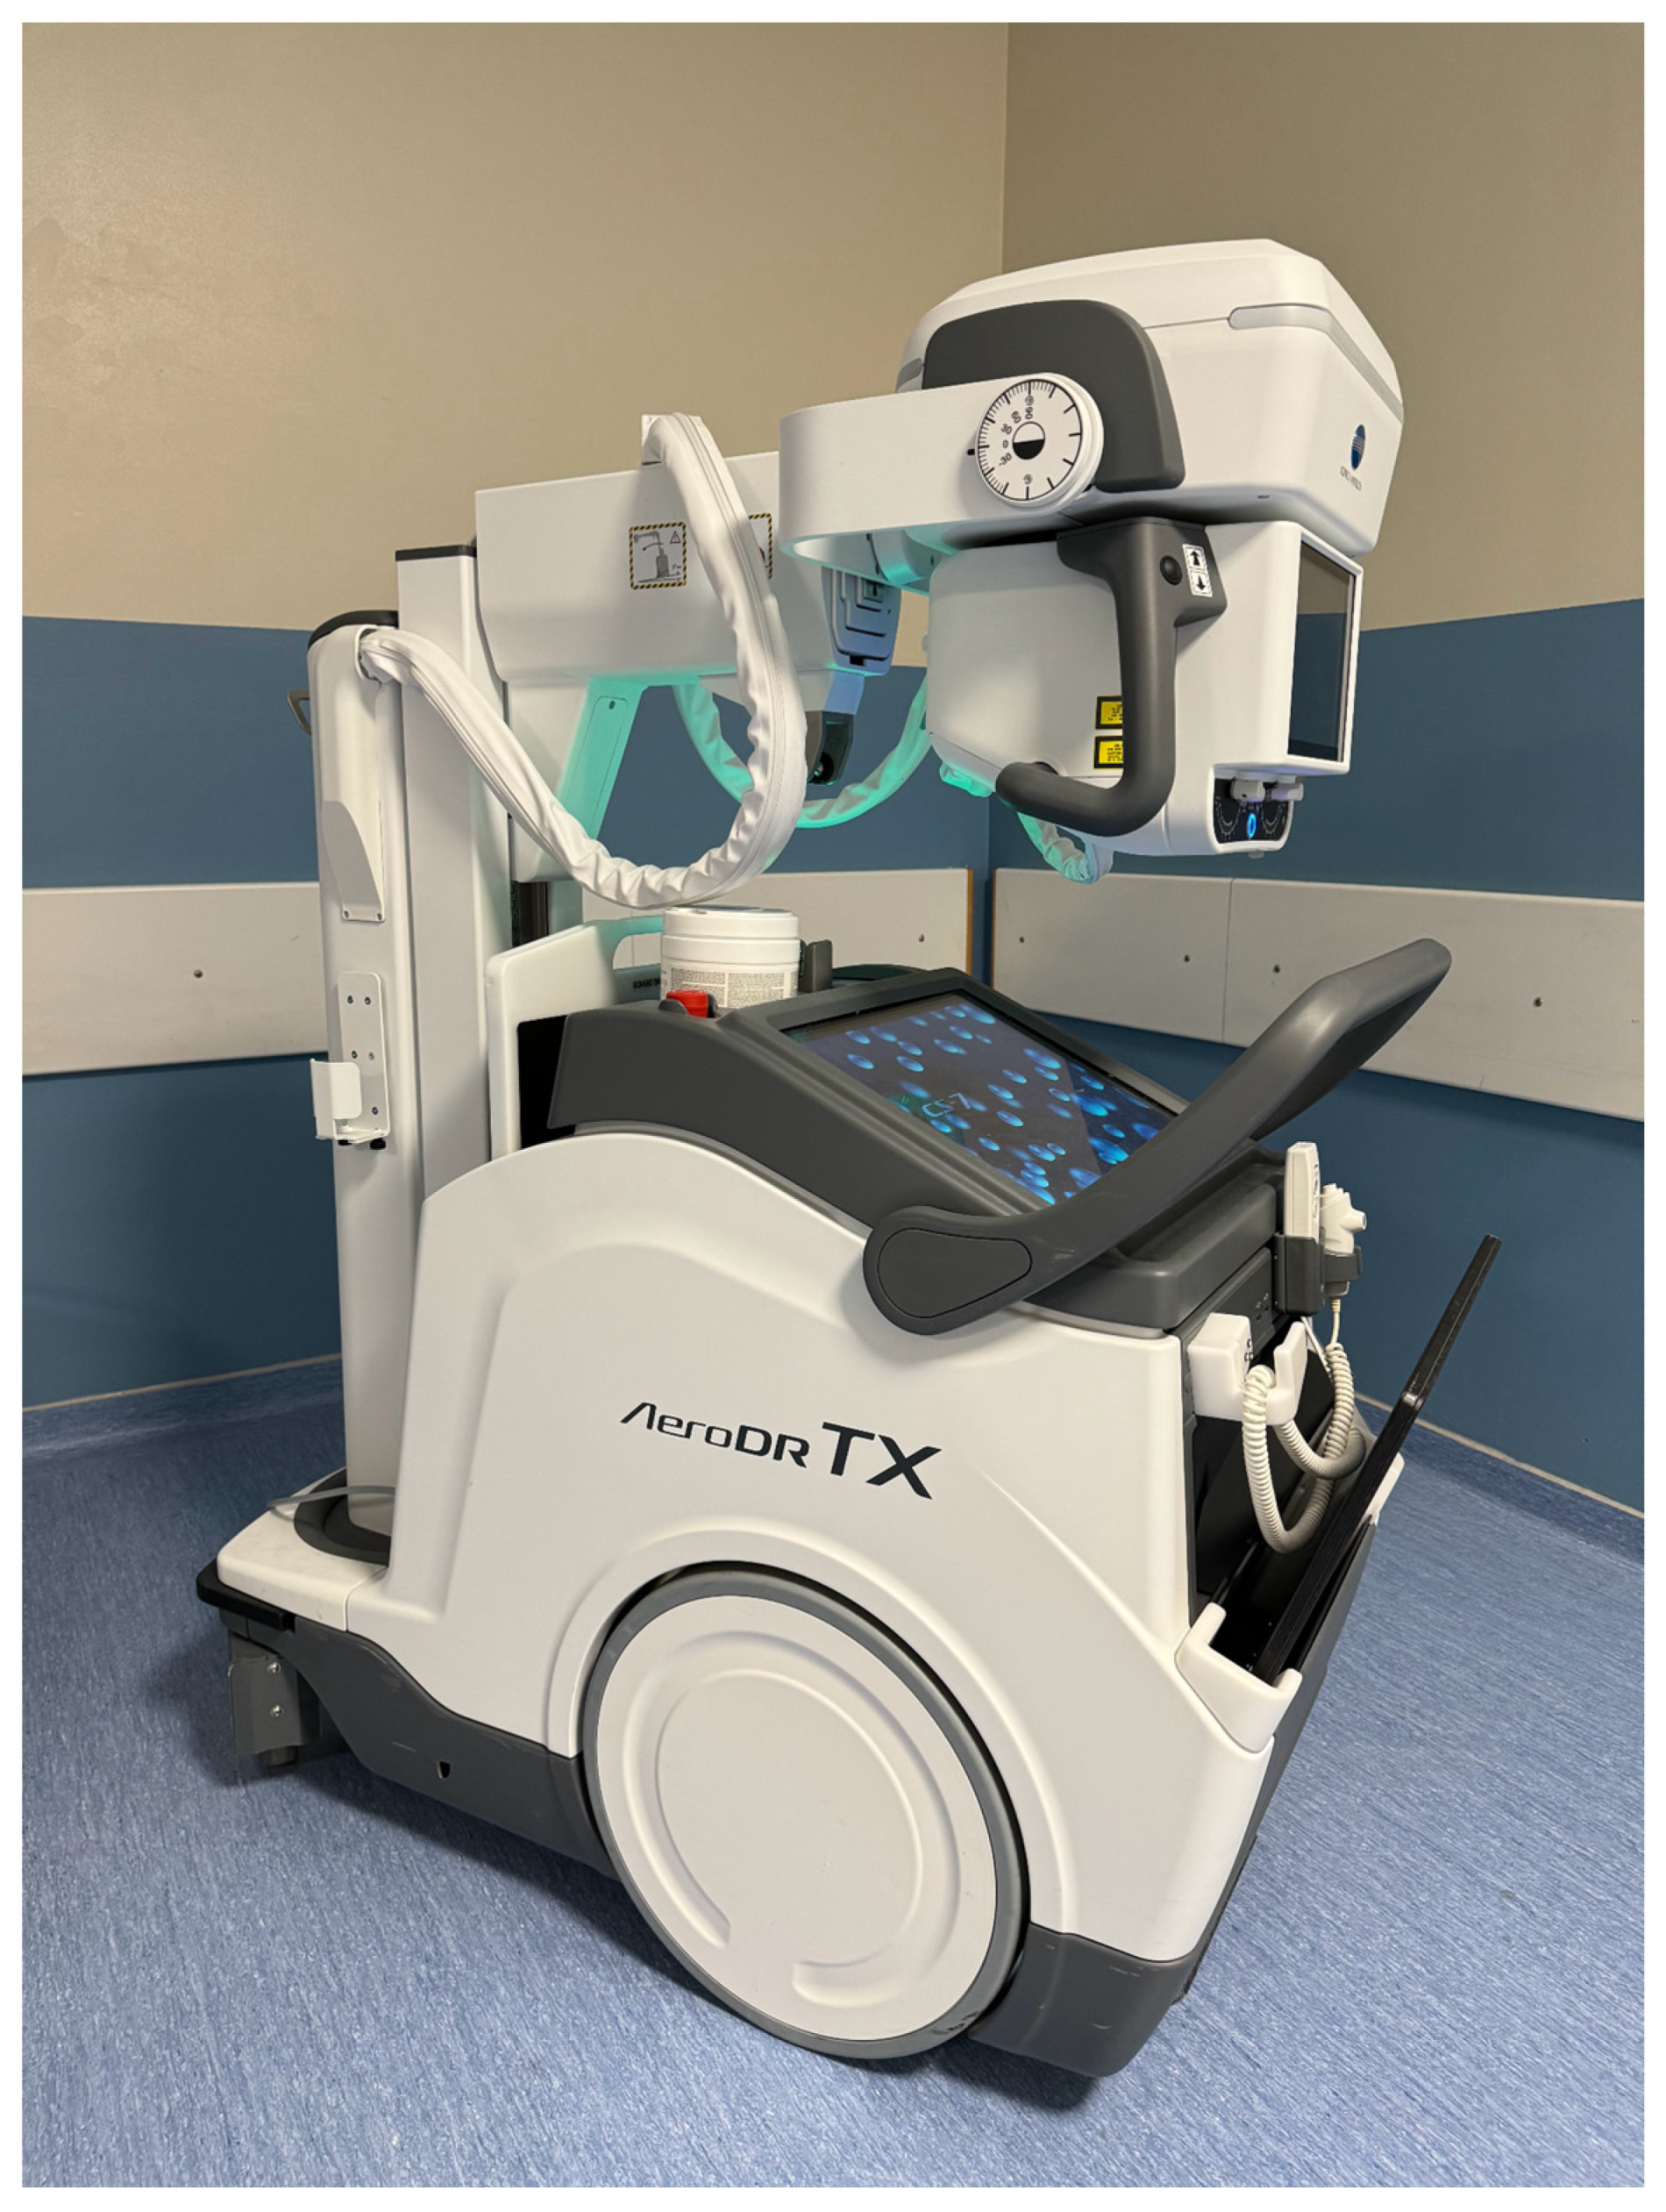
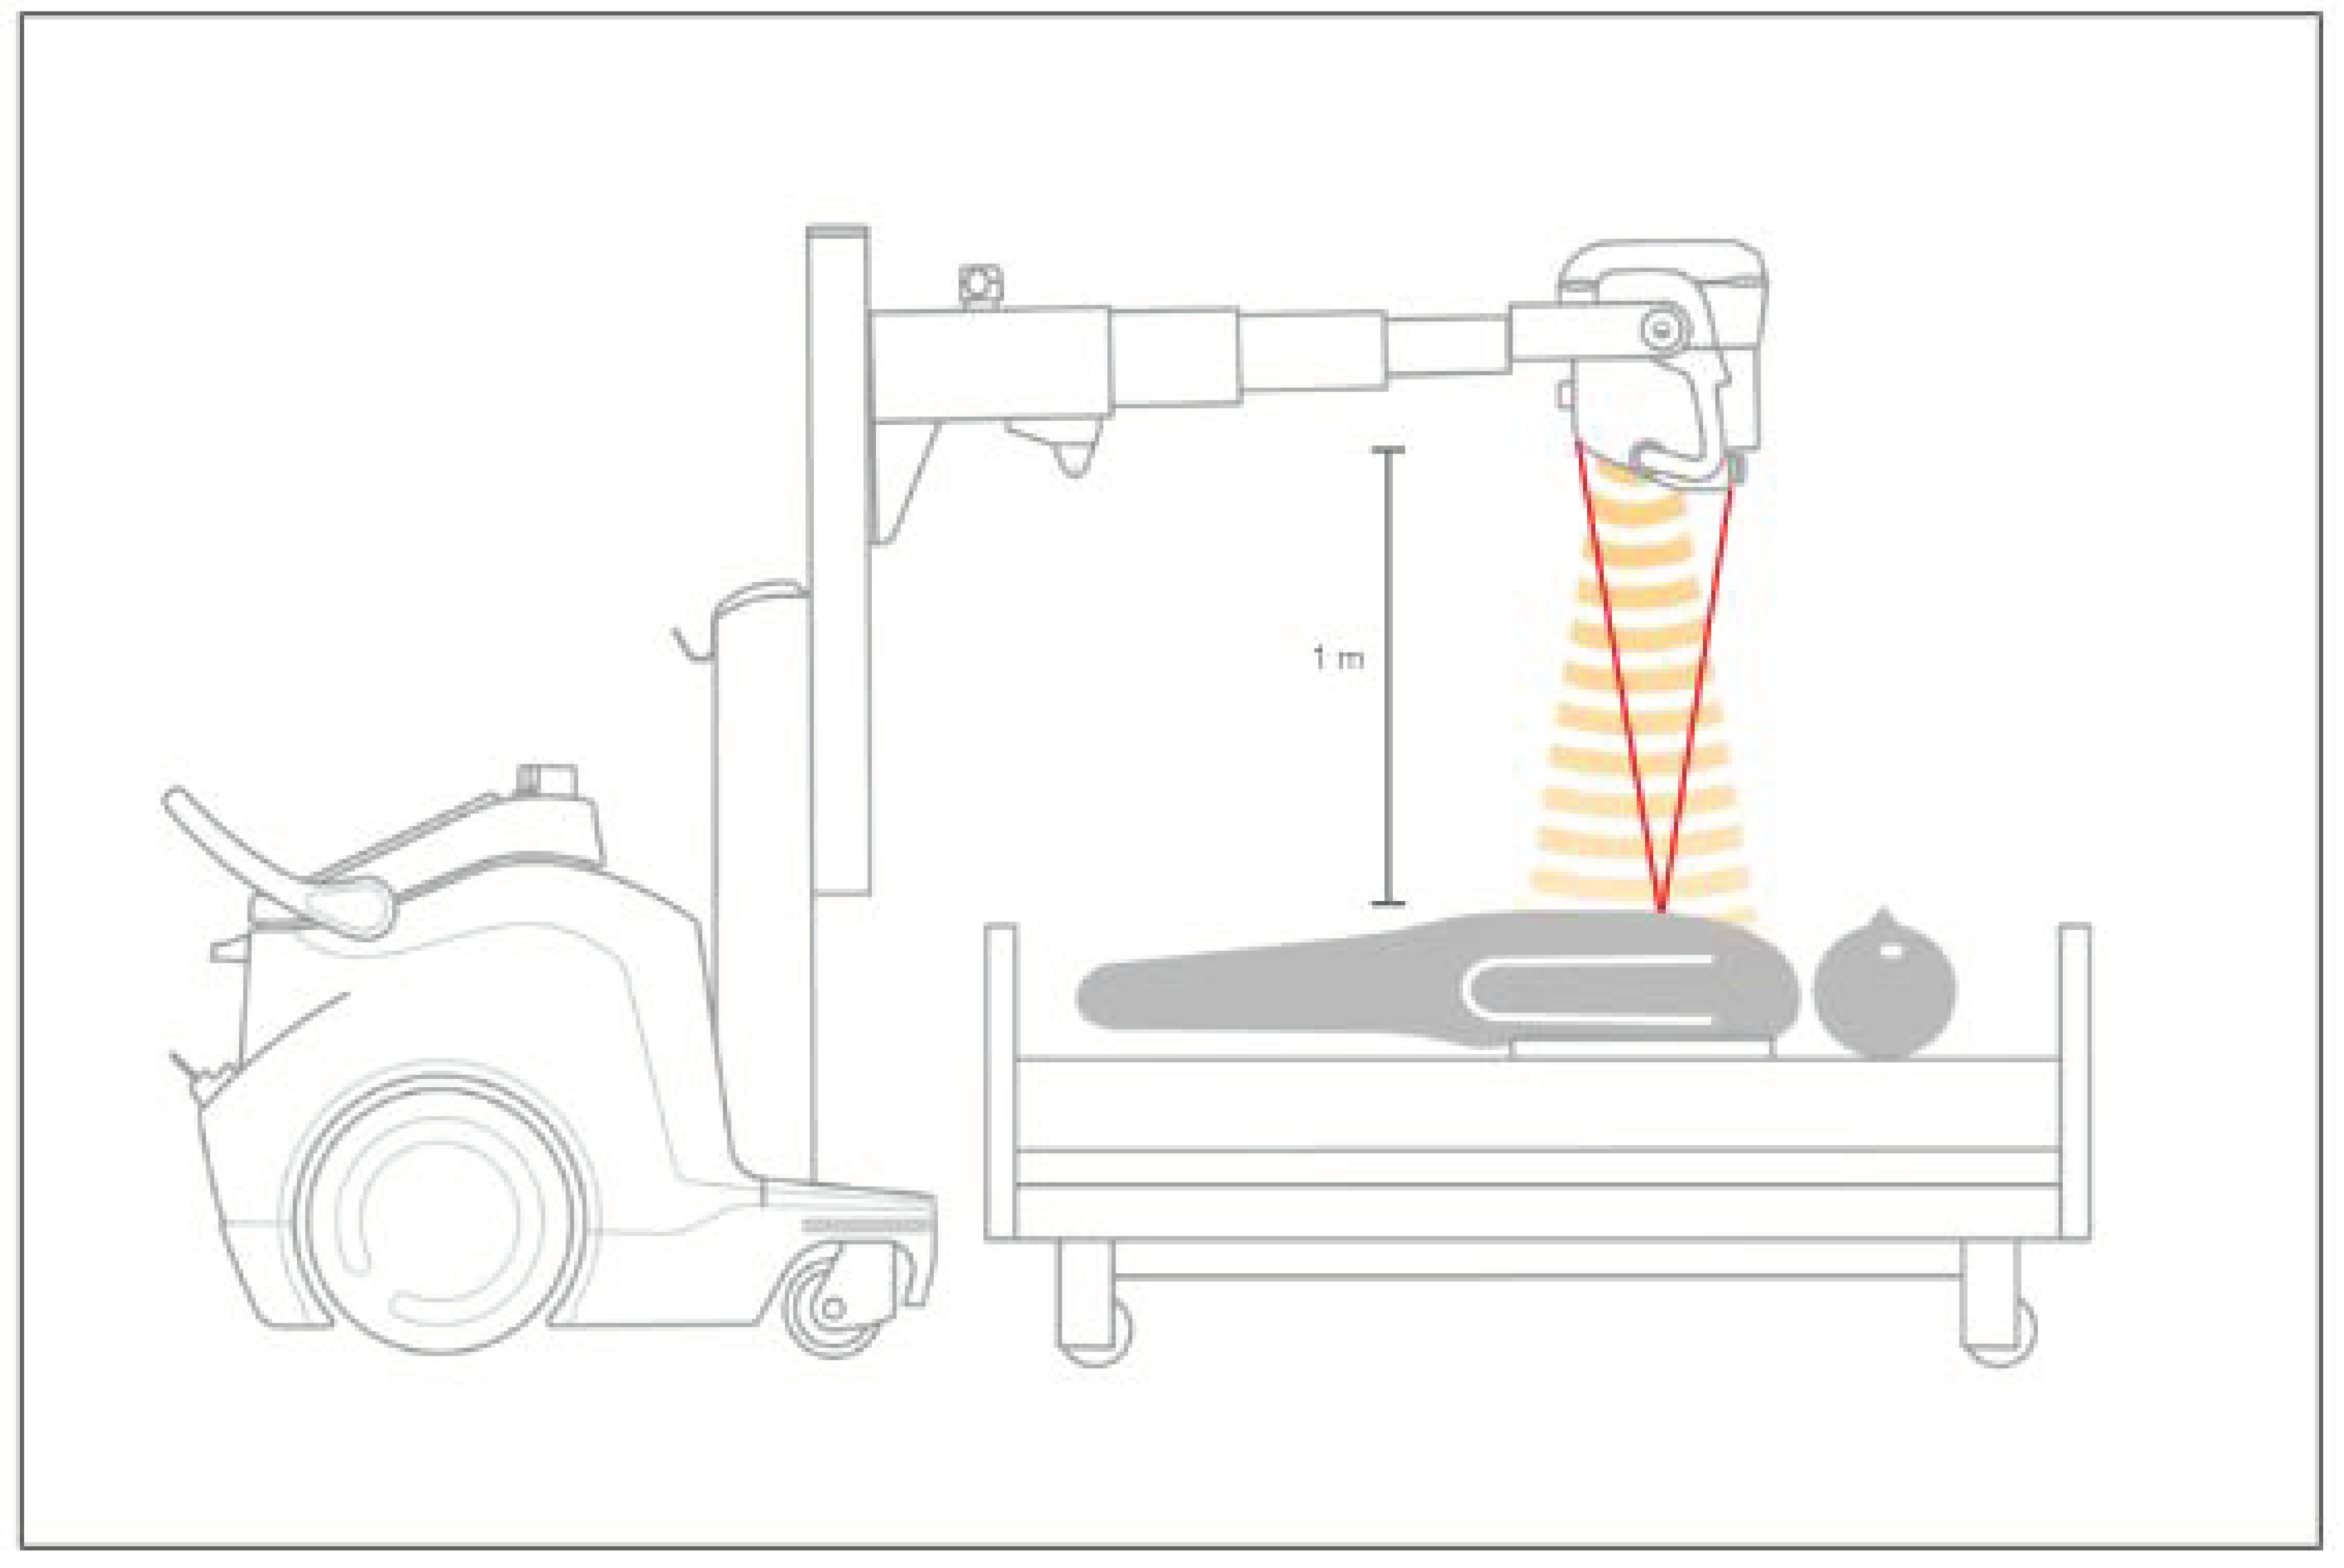
2. The Equipment
3. Diaphragm Motion Analysis
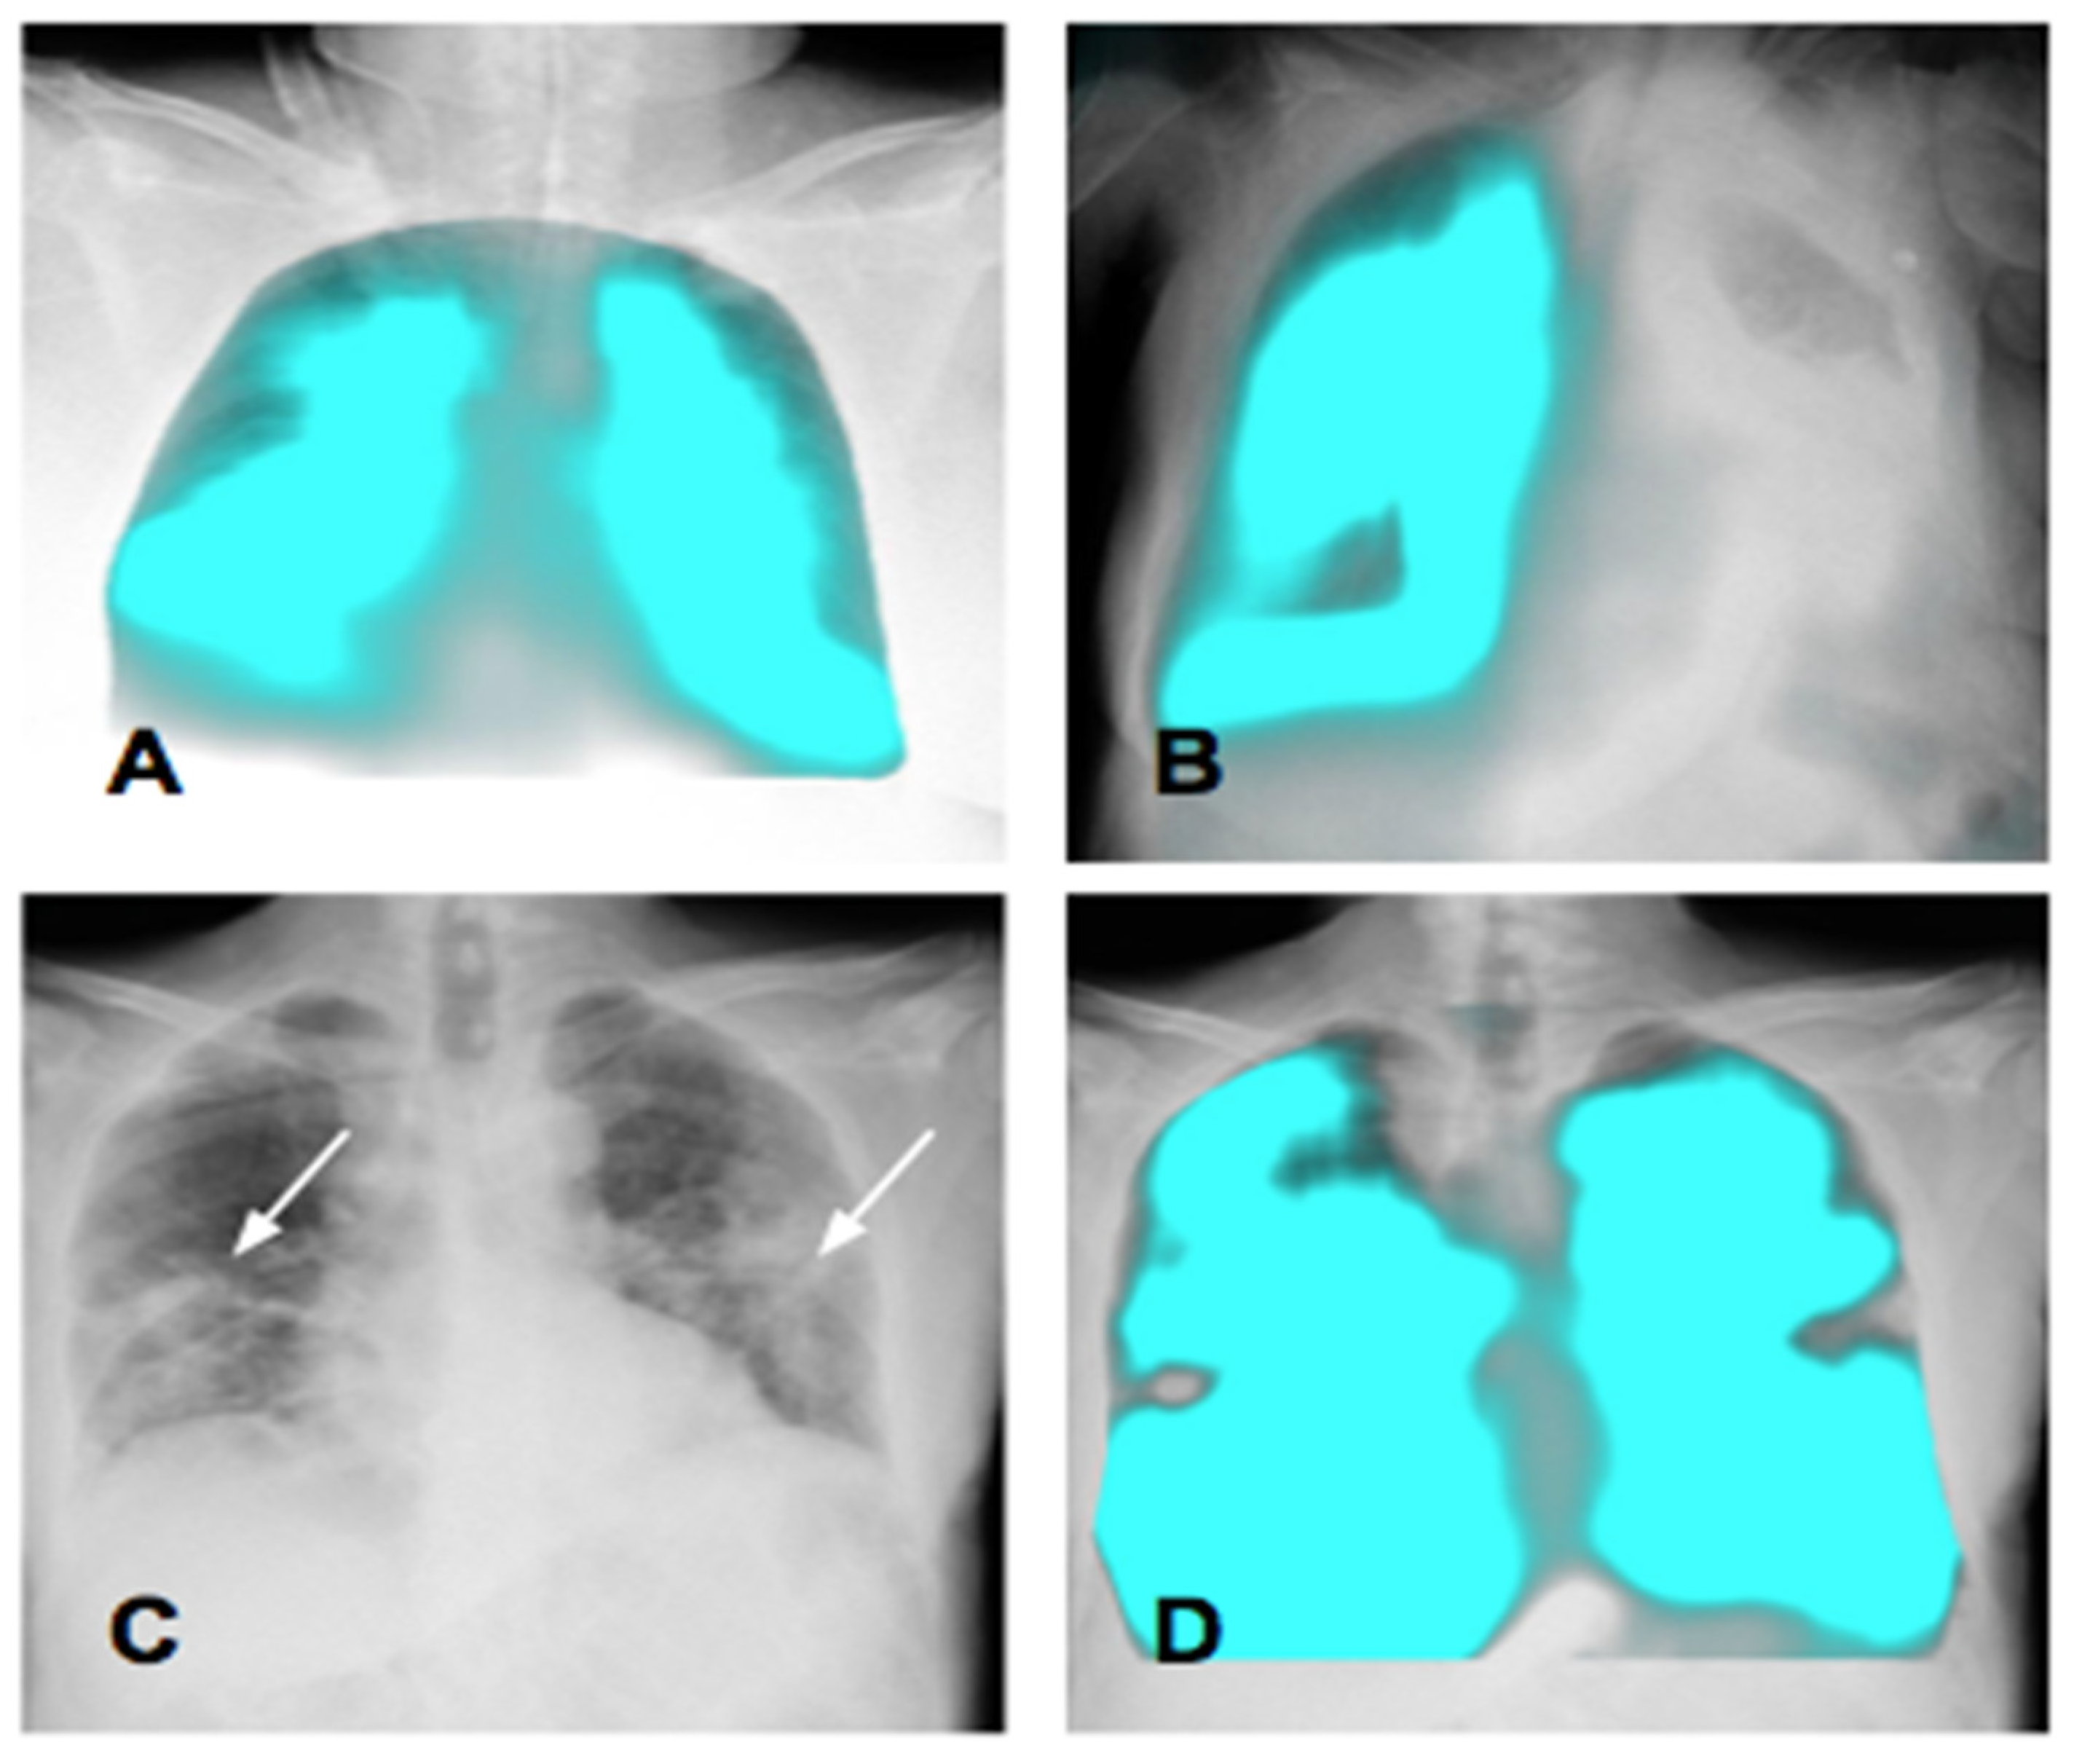
4. Calculation of the Lung Area
5. Lung Movement
6. Lung Ventilation
7. Lung Perfusion Assessment
8. Post-Procedural Follow-Up
9. Challenges
10. Future Directions
11. Conclusions
Supplementary Materials
Author Contributions
Funding
Institutional Review Board Statement
Informed Consent Statement
Data Availability Statement
Conflicts of Interest
References
- Fyles, F.; FitzMaurice, T.S.; Robinson, R.E.; Bedi, R.; Burhan, H.; Walshaw, M.J. Dynamic Chest Radiography: A State-of-the-Art Review. Insights Imaging 2023, 14, 107. [Google Scholar] [CrossRef]
- Canadian Agency for Drugs and Technologies in Health. Portable versus Fixed X-ray Equipment: A Review of the Clinical Effectiveness, Cost-Effectiveness and Guidelines; Canadian Agency for Drugs and Technologies in Health: Ottawa, ON, Canada, 2016.
- Tanaka, R.; Sanada, S.; Suzuki, M.; Kobayashi, T.; Matsui, T.; Inoue, H.; Yoshihisa, N. Breathing Chest Radiography Using a Dynamic Flat-Panel Detector Combined with Computer Analysis. Med. Phys. 2004, 31, 2254–2262. [Google Scholar] [CrossRef] [PubMed]
- Hata, A.; Yamada, Y.; Tanaka, R.; Nishino, M.; Hida, T.; Hino, T.; Ueyama, M.; Yanagawa, M.; Kamitani, T.; Kurosaki, A.; et al. Dynamic Chest X-ray Using a Flat-Panel Detector System: Technique and Applications. Korean J. Radiol. 2021, 22, 634. [Google Scholar] [CrossRef] [PubMed]
- Tanaka, R.; Sanada, S.; Fujimura, M.; Yasui, M.; Tsuji, S.; Hayashi, N.; Nanbu, Y.; Matsui, O. Pulmonary Blood Flow Evaluation Using a Dynamic Flat-Panel Detector: Feasibility Study with Pulmonary Diseases. Int. J. CARS 2009, 4, 449–455. [Google Scholar] [CrossRef] [PubMed]
- Dubé, B.-P.; Dres, M. Diaphragm Dysfunction: Diagnostic Approaches and Management Strategies. JCM 2016, 5, 113. [Google Scholar] [CrossRef] [PubMed]
- Chetta, A.; Rehman, A.K.; Moxham, J.; Carr, D.H.; Polkey, M.I. Chest Radiography Cannot Predict Diaphragm Function. Respir. Med. 2005, 99, 39–44. [Google Scholar] [CrossRef] [PubMed]
- Harper, C.J.; Shahgholi, L.; Cieslak, K.; Hellyer, N.J.; Strommen, J.A.; Boon, A.J. Variability in Diaphragm Motion During Normal Breathing, Assessed With B-Mode Ultrasound. J. Orthop. Sports Phys. Ther. 2013, 43, 927–931. [Google Scholar] [CrossRef] [PubMed]
- Boussuges, A.; Finance, J.; Chaumet, G.; Brégeon, F. Diaphragmatic Motion Recorded by M-Mode Ultrasonography: Limits of Normality. ERJ Open Res. 2021, 7, 00714–02020. [Google Scholar] [CrossRef]
- Yamada, Y.; Ueyama, M.; Abe, T.; Araki, T.; Abe, T.; Nishino, M.; Jinzaki, M.; Hatabu, H.; Kudoh, S. Time-Resolved Quantitative Analysis of the Diaphragms During Tidal Breathing in a Standing Position Using Dynamic Chest Radiography with a Flat Panel Detector System (“Dynamic X-ray Phrenicography”). Acad. Radiol. 2017, 24, 393–400. [Google Scholar] [CrossRef]
- Hida, T.; Yamada, Y.; Ueyama, M.; Araki, T.; Nishino, M.; Kurosaki, A.; Jinzaki, M.; Honda, H.; Hatabu, H.; Kudoh, S. Time-Resolved Quantitative Evaluation of Diaphragmatic Motion during Forced Breathing in a Health Screening Cohort in a Standing Position: Dynamic Chest Phrenicography. Eur. J. Radiol. 2019, 113, 59–65. [Google Scholar] [CrossRef]
- Yamada, Y.; Ueyama, M.; Abe, T.; Araki, T.; Abe, T.; Nishino, M.; Jinzaki, M.; Hatabu, H.; Kudoh, S. Difference in Diaphragmatic Motion during Tidal Breathing in a Standing Position between COPD Patients and Normal Subjects: Time-Resolved Quantitative Evaluation Using Dynamic Chest Radiography with Flat Panel Detector System (“Dynamic X-ray Phrenicography”). Eur. J. Radiol. 2017, 87, 76–82. [Google Scholar] [CrossRef]
- Hino, T.; Hata, A.; Hida, T.; Yamada, Y.; Ueyama, M.; Araki, T.; Kamitani, T.; Nishino, M.; Kurosaki, A.; Jinzaki, M.; et al. Projected Lung Areas Using Dynamic X-ray (DXR). Eur. J. Radiol. Open 2020, 7, 100263. [Google Scholar] [CrossRef] [PubMed]
- Ueyama, M.; Hashimoto, S.; Takeda, A.; Maruguchi, N.; Yamamoto, R.; Matsumura, K.; Nakamura, S.; Terada, S.; Inao, T.; Kaji, Y.; et al. Prediction of Forced Vital Capacity with Dynamic Chest Radiography in Interstitial Lung Disease. Eur. J. Radiol. 2021, 142, 109866. [Google Scholar] [CrossRef]
- FitzMaurice, T.S.; McCann, C.; Nazareth, D.S.; McNamara, P.S.; Walshaw, M.J. Use of Dynamic Chest Radiography to Assess Treatment of Pulmonary Exacerbations in Cystic Fibrosis. Radiology 2022, 303, 675–681. [Google Scholar] [CrossRef]
- Ohkura, N.; Tanaka, R.; Watanabe, S.; Hara, J.; Abo, M.; Nakade, Y.; Horii, J.; Matsuura, Y.; Inoue, D.; Takata, M.; et al. Chest Dynamic-Ventilatory Digital Radiography in Chronic Obstructive or Restrictive Lung Disease. COPD 2021, 16, 1393–1399. [Google Scholar] [CrossRef]
- Ohkura, N.; Kasahara, K.; Watanabe, S.; Hara, J.; Abo, M.; Sone, T.; Kimura, H.; Takata, M.; Tamura, M.; Matsumoto, I.; et al. Dynamic-Ventilatory Digital Radiography in Air Flow Limitation: A Change in Lung Area Reflects Air Trapping. Respiration 2020, 99, 382–388. [Google Scholar] [CrossRef] [PubMed]
- Tanaka, R.; Matsumoto, I.; Takayama, T.; Ohkura, N.; Inoue, D. Preoperative Assessment of Pleural Adhesions in Patients with Lung Cancer Based on Quantitative Motion Analysis with Dynamic Chest Radiography: A Retrospective Study. J. Applied Clin. Med. Phys. 2023, 24, e14036. [Google Scholar] [CrossRef] [PubMed]
- Sakai, S.; Murayama, S.; Murakami, J.; Hashiguchi, N.; Masuda, K. Bronchogenic carcinoma invasion of the chest wall: Evaluation with dynamic cine MRI during breathing. J. Comput. Assist. Tomogr. 1997, 21, 595–600. [Google Scholar] [CrossRef]
- Tanaka, R.; Sanada, S.; Kobayashi, T.; Suzuki, M.; Matsui, T.; Matsui, O. Computerized Methods for Determining Respiratory Phase on Dynamic Chest Radiographs Obtained by a Dynamic Flat-Panel Detector (FPD) System. J. Digit. Imaging 2006, 19, 41–51. [Google Scholar] [CrossRef]
- Tanaka, R.; Sanada, S.; Okazaki, N.; Kobayashi, T.; Fujimura, M.; Yasui, M.; Matsui, T.; Nakayama, K.; Nanbu, Y.; Matsui, O. Evaluation of Pulmonary Function Using Breathing Chest Radiography with a Dynamic Flat Panel Detector: Primary Results in Pulmonary Diseases. Investig. Radiol. 2006, 41, 735–745. [Google Scholar] [CrossRef]
- Tanaka, R.; Sanada, S.; Tsujioka, K.; Matsui, T.; Takata, T.; Matsui, O. Development of a Cardiac Evaluation Method Using a Dynamic Flat-Panel Detector (FPD) System: A Feasibility Study Using a Cardiac Motion Phantom. Radiol. Phys. Technol. 2008, 1, 27–32. [Google Scholar] [CrossRef]
- Yamasaki, Y.; Kamitani, T.; Sagiyama, K.; Hino, T.; Kisanuki, M.; Tabata, K.; Isoda, T.; Kitamura, Y.; Abe, K.; Hosokawa, K.; et al. Dynamic Chest Radiography for Pulmonary Vascular Diseases: Clinical Applications and Correlation with Other Imaging Modalities. Jpn. J. Radiol. 2023, 42, 1–19. [Google Scholar] [CrossRef]
- Kim, N.H.; Delcroix, M.; Jais, X.; Madani, M.M.; Matsubara, H.; Mayer, E.; Ogo, T.; Tapson, V.F.; Ghofrani, H.-A.; Jenkins, D.P. Chronic Thromboembolic Pulmonary Hypertension. Eur. Respir. J. 2019, 53, 1801915. [Google Scholar] [CrossRef] [PubMed]
- Lang, I. Chronic Thromboembolic Pulmonary Hypertension: A Distinct Disease Entity. Eur. Respir. Rev. 2015, 24, 246–252. [Google Scholar] [CrossRef] [PubMed]
- Pepke-Zaba, J.; Delcroix, M.; Lang, I.; Mayer, E.; Jansa, P.; Ambroz, D.; Treacy, C.; D’Armini, A.M.; Morsolini, M.; Snijder, R.; et al. Chronic Thromboembolic Pulmonary Hypertension (CTEPH): Results from an International Prospective Registry. Circulation 2011, 124, 1973–1981. [Google Scholar] [CrossRef] [PubMed]
- Humbert, M.; Kovacs, G.; Hoeper, M.M.; Badagliacca, R.; Berger, R.M.F.; Brida, M.; Carlsen, J.; Coats, A.J.S.; Escribano-Subias, P.; Ferrari, P.; et al. 2022 ESC/ERS Guidelines for the Diagnosis and Treatment of Pulmonary Hypertension. Eur. Respir. J. 2023, 61, 2200879. [Google Scholar] [CrossRef] [PubMed]
- Yamasaki, Y.; Abe, K.; Hosokawa, K.; Kamitani, T. A Novel Pulmonary Circulation Imaging Using Dynamic Digital Radiography for Chronic Thromboembolic Pulmonary Hypertension. Eur. Heart J. 2020, 41, 2506. [Google Scholar] [CrossRef] [PubMed]
- Yamasaki, Y.; Kamitani, T.; Abe, K.; Hosokawa, K.; Sagiyama, K.; Hida, T.; Matsuura, Y.; Kitamura, Y.; Maruoka, Y.; Isoda, T.; et al. Diagnosis of Pulmonary Hypertension Using Dynamic Chest Radiography. Am. J. Respir. Crit. Care Med. 2021, 204, 1336–1337. [Google Scholar] [CrossRef]
- Yamasaki, Y.; Abe, K.; Kamitani, T.; Hosokawa, K.; Hida, T.; Sagiyama, K.; Matsuura, Y.; Baba, S.; Isoda, T.; Maruoka, Y.; et al. Efficacy of Dynamic Chest Radiography for Chronic Thromboembolic Pulmonary Hypertension. Radiology 2023, 306, e220908. [Google Scholar] [CrossRef]
- Konstantinides, S.V.; Meyer, G.; Becattini, C.; Bueno, H.; Geersing, G.-J.; Harjola, V.-P.; Huisman, M.V.; Humbert, M.; Jennings, C.S.; Jiménez, D.; et al. 2019 ESC Guidelines for the Diagnosis and Management of Acute Pulmonary Embolism Developed in Collaboration with the European Respiratory Society (ERS): The Task Force for the Diagnosis and Management of Acute Pulmonary Embolism of the European Society of Cardiology (ESC). Eur. Respir. J. 2019, 54, 1901647. [Google Scholar] [CrossRef]
- Freund, Y.; Cohen-Aubart, F.; Bloom, B. Acute Pulmonary Embolism: A Review. JAMA 2022, 328, 1336. [Google Scholar] [CrossRef]
- Gupta, R.T.; Kakarla, R.K.; Kirshenbaum, K.J.; Tapson, V.F. d-Dimers and Efficacy of Clinical Risk Estimation Algorithms: Sensitivity in Evaluation of Acute Pulmonary Embolism. Am. J. Roentgenol. 2009, 193, 425–430. [Google Scholar] [CrossRef] [PubMed]
- Kearon, C.; de Wit, K.; Parpia, S.; Schulman, S.; Afilalo, M.; Hirsch, A.; Spencer, F.A.; Sharma, S.; D’Aragon, F.; Deshaies, J.-F.; et al. Diagnosis of Pulmonary Embolism with d-Dimer Adjusted to Clinical Probability. N. Engl. J. Med. 2019, 381, 2125–2134. [Google Scholar] [CrossRef] [PubMed]
- Yamasaki, Y.; Hosokawa, K.; Tsutsui, H.; Ishigami, K. Pulmonary Ventilation–Perfusion Mismatch Demonstrated by Dynamic Chest Radiography in Giant Cell Arteritis. Eur. Heart J. 2021, 42, 208–209. [Google Scholar] [CrossRef] [PubMed]
- Manhire, A. Guidelines for Radiologically Guided Lung Biopsy. Thorax 2003, 58, 920–936. [Google Scholar] [CrossRef]
- Schnell, J.; Beer, M.; Eggeling, S.; Gesierich, W.; Gottlieb, J.; Herth, F.J.F.; Hofmann, H.-S.; Jany, B.; Kreuter, M.; Ley-Zaporozhan, J.; et al. Management of Spontaneous Pneumothorax and Post-Interventional Pneumothorax: German S3 Guideline. Respiration 2019, 97, 370–402. [Google Scholar] [CrossRef]
- Liu, Y.; Zeng, F.; Ma, M.; Zheng, B.; Yun, Z.; Qin, G.; Yang, W.; Feng, Q. Bone suppression of lateral chest x-rays with imperfect and limited dual-energy subtraction images. Comput. Med. Imaging Graph. 2023, 105, 102186. [Google Scholar] [CrossRef]
- Manji, F.; Wang, J.; Norman, G.; Wang, Z.; Koff, D. Comparison of dual energy subtraction chest radiography and traditional chest X-rays in the detection of pulmonary nodules. Quant. Imaging Med. Surg. 2016, 6, 1–5. [Google Scholar] [CrossRef] [PubMed]
- Cellina, M.; Cè, M.; Irmici, G.; Ascenti, V.; Khenkina, N.; Toto-Brocchi, M.; Martinenghi, C.; Papa, S.; Carrafiello, G. Artificial Intelligence in Lung Cancer Imaging: Unfolding the Future. Diagnostics 2022, 12, 2644. [Google Scholar] [CrossRef] [PubMed]


| Modality | Function | Mechanism | Potential Clinical Applications |
|---|---|---|---|
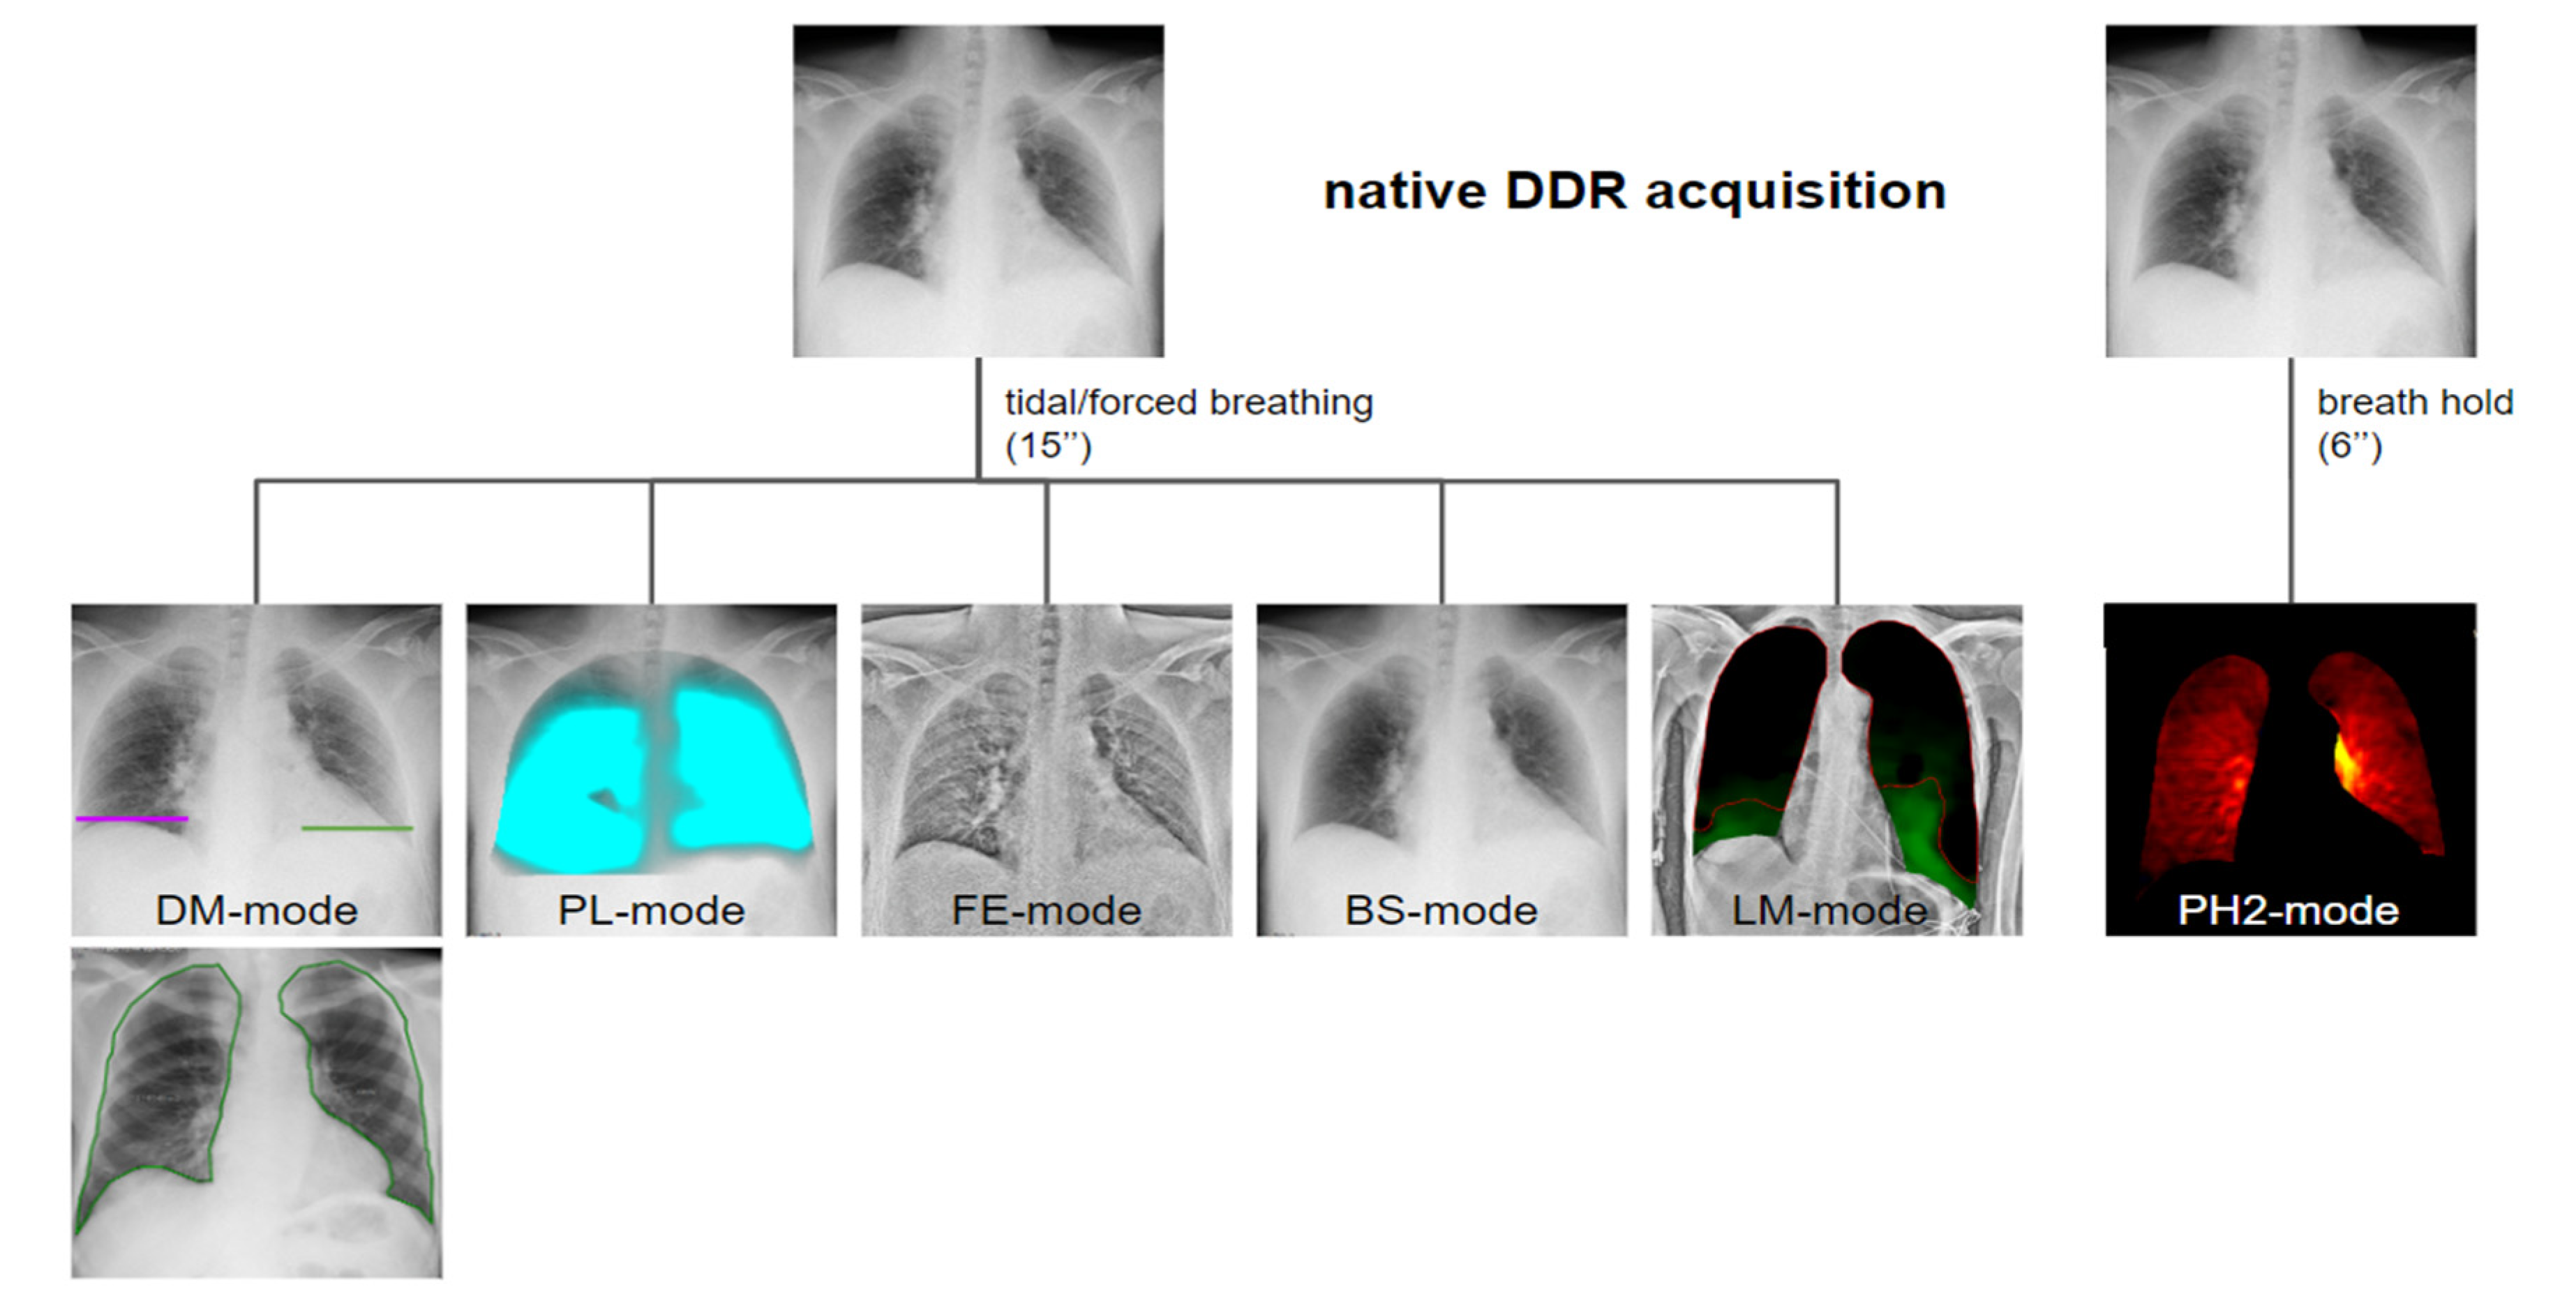
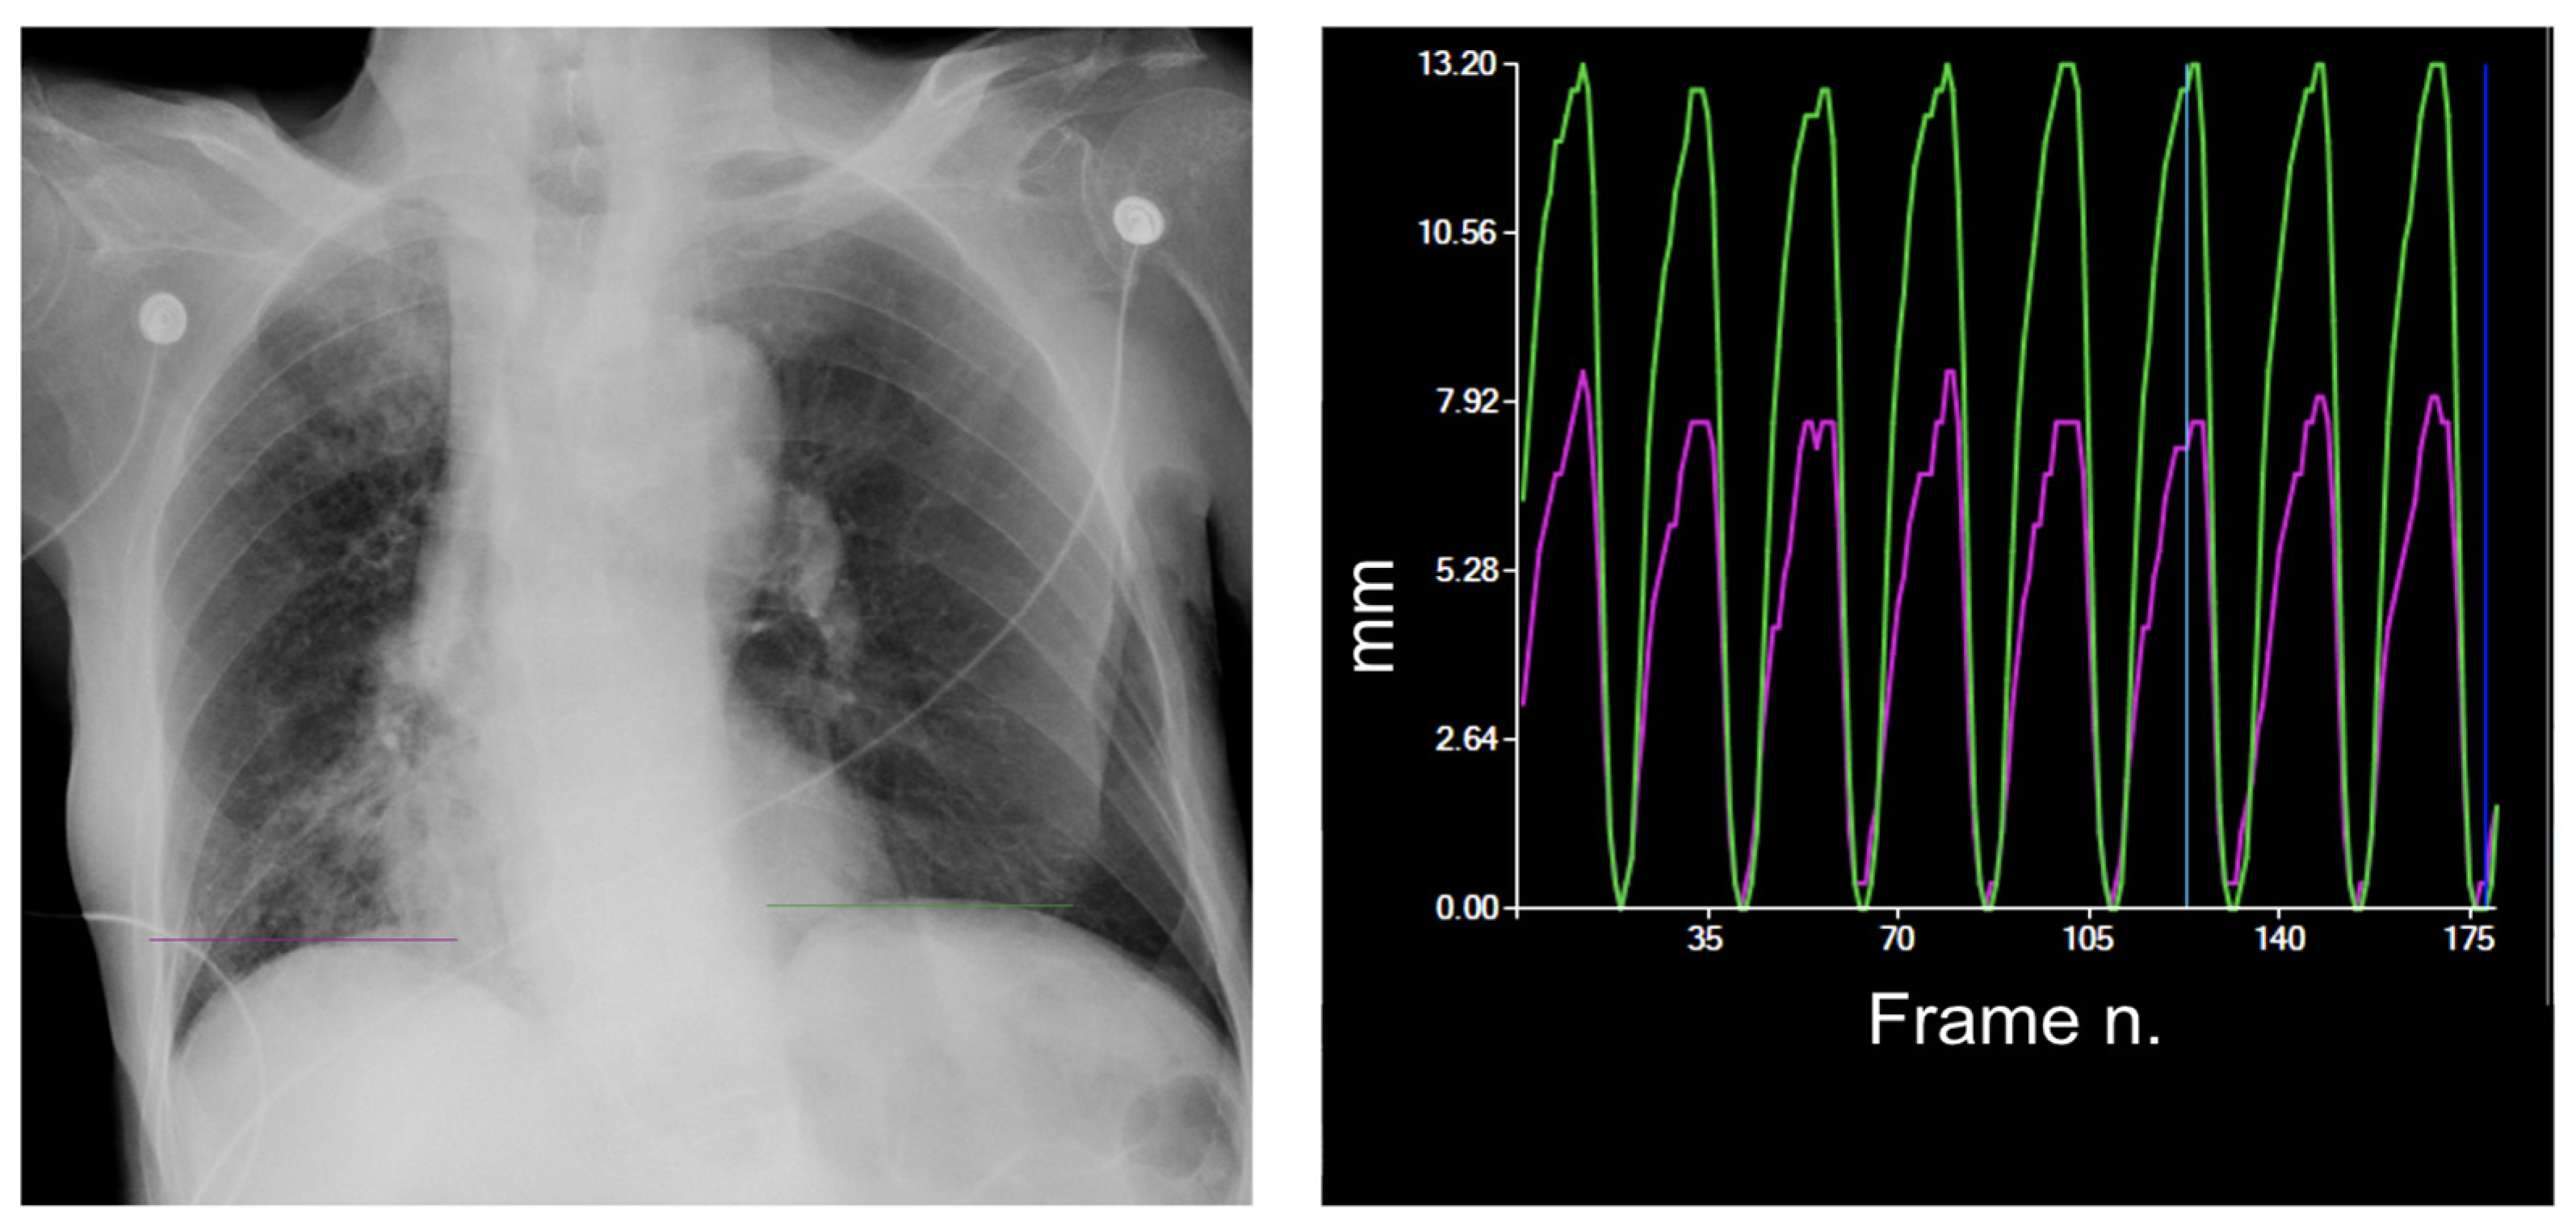
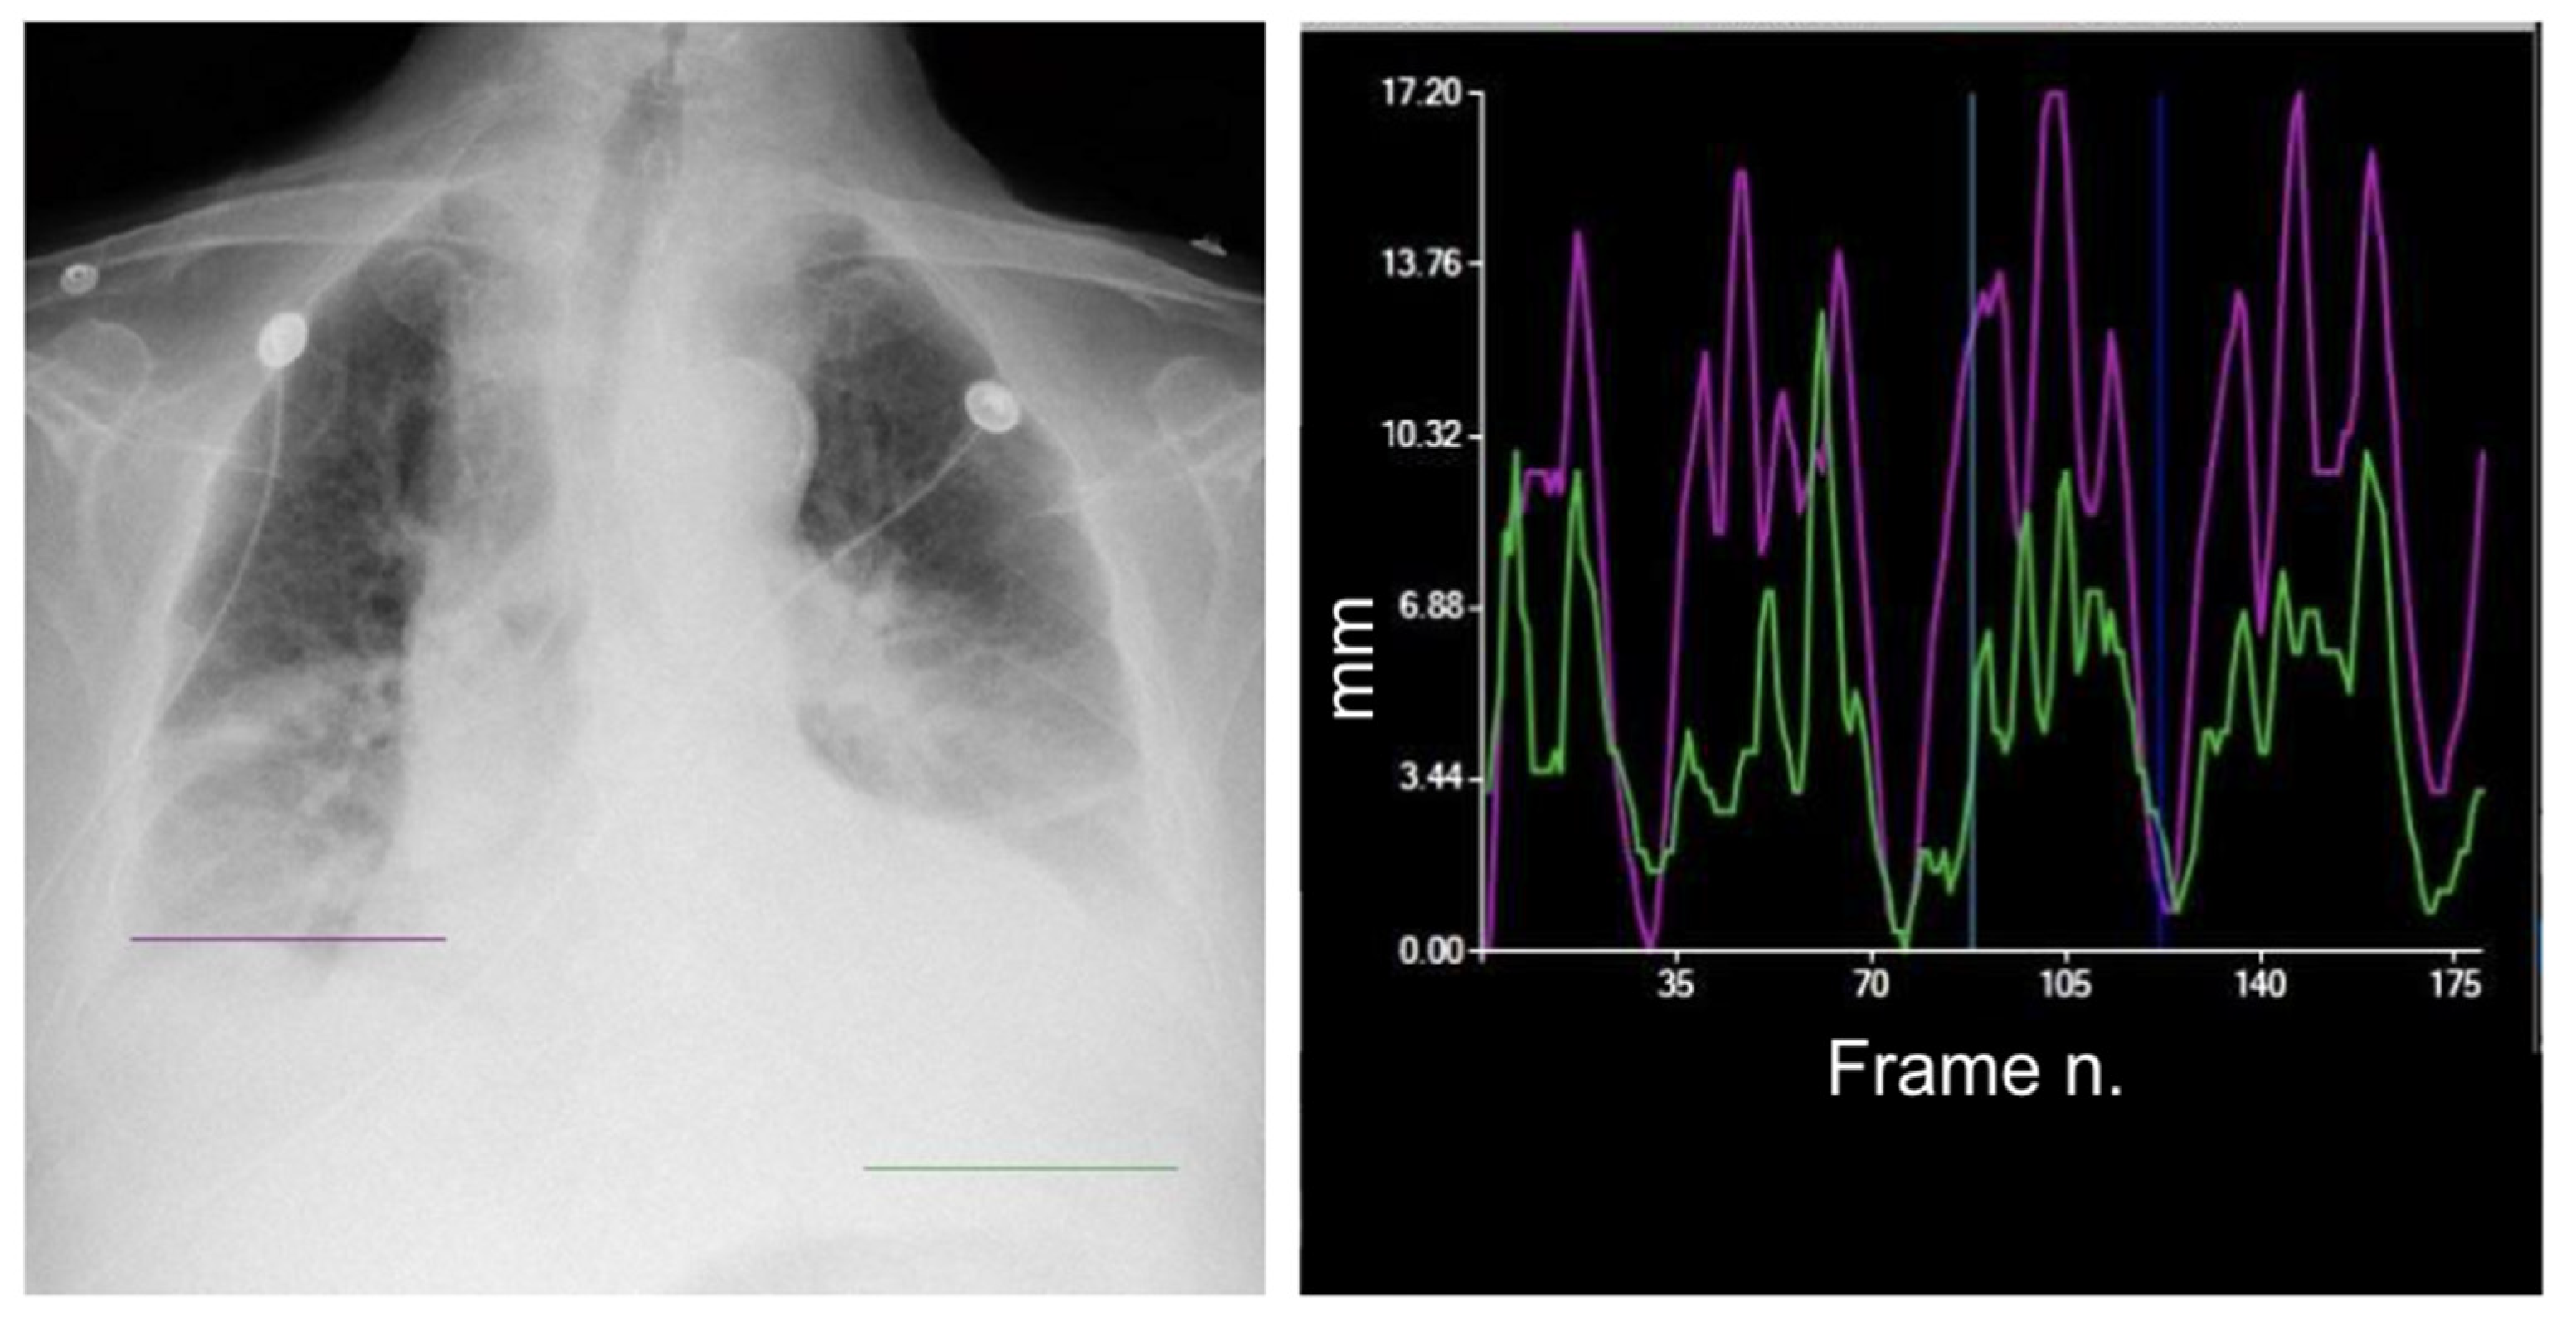
| DM-mode | Tracking diaphragm motion. Automatic calculation of the lung area and the relative changing rate (%). | Tracking of diaphragmatic domes represented in a motion–time graph. Area detection through an edge detection method in the post processing phase. | Diagnosis of diaphragm motion impairment and palsy. Automatic calculation of the respiratory rate. Analysis of lung dynamics in patients with restrictive/obstructive diseases. Follow-up of patients in pulmonary rehabilitation. |
| LM-mode | Vector field representing the movement of different lung areas. | Pixel-by-pixel analysis and tracking in consecutive frames resulting in a two-dimensional vector field. Uses BS-images. | Differential motion analysis of different lung areas; useful for the detection of adhesions and preoperative planning. |
| PL-mode | Color-coded map of the lung ventilation in different areas. | Analysis of the pixel values variations during the breath cycle. | Detection of regional differences in ventilation. Useful for the follow-up of therap, especially in Intensive Care Units. |
| FE-mode | Improve visualization of soft-tissues density components. | Post-processing enhancing high-spatial frequencies. | Better visualization of soft tissue alterations. |
| BS-mode | Bone suppression. | Signal attenuation of costal and clavicular bones within the lung field. Preliminary to LM analysis. | Better visualization of tissues other than bone, with better detection of lung nodules and consolidations. |
| PH2-mode | Color-coded map representing lung perfusion. | Analysis of pixel value changes from the baseline timing (end diastolic phase). | Analysis of the pulmonary perfusion, diagnosis of pulmonary embolism. |
Disclaimer/Publisher’s Note: The statements, opinions and data contained in all publications are solely those of the individual author(s) and contributor(s) and not of MDPI and/or the editor(s). MDPI and/or the editor(s) disclaim responsibility for any injury to people or property resulting from any ideas, methods, instructions or products referred to in the content. |
© 2024 by the authors. Licensee MDPI, Basel, Switzerland. This article is an open access article distributed under the terms and conditions of the Creative Commons Attribution (CC BY) license (https://creativecommons.org/licenses/by/4.0/).
Share and Cite
Cè, M.; Oliva, G.; Rabaiotti, F.L.; Macrì, L.; Zollo, S.; Aquila, A.; Cellina, M. Portable Dynamic Chest Radiography: Literature Review and Potential Bedside Applications. Med. Sci. 2024, 12, 10. https://doi.org/10.3390/medsci12010010
Cè M, Oliva G, Rabaiotti FL, Macrì L, Zollo S, Aquila A, Cellina M. Portable Dynamic Chest Radiography: Literature Review and Potential Bedside Applications. Medical Sciences. 2024; 12(1):10. https://doi.org/10.3390/medsci12010010
Chicago/Turabian StyleCè, Maurizio, Giancarlo Oliva, Francesca Lucrezia Rabaiotti, Laura Macrì, Sharon Zollo, Alessandro Aquila, and Michaela Cellina. 2024. "Portable Dynamic Chest Radiography: Literature Review and Potential Bedside Applications" Medical Sciences 12, no. 1: 10. https://doi.org/10.3390/medsci12010010
APA StyleCè, M., Oliva, G., Rabaiotti, F. L., Macrì, L., Zollo, S., Aquila, A., & Cellina, M. (2024). Portable Dynamic Chest Radiography: Literature Review and Potential Bedside Applications. Medical Sciences, 12(1), 10. https://doi.org/10.3390/medsci12010010