Article

The Response of Denitrification to Increasing Water Temperature and Nitrate Availability: The Case of a Large Lowland River (Po River, Northern Italy) under a Climate Change Scenario

by
Maria Pia Gervasio
,
Giuseppe Castaldelli
* and
Elisa Soana
Department of Environmental and Prevention Sciences, University of Ferrara, Via Luigi Borsari 46, 44121 Ferrara, Italy
*
Author to whom correspondence should be addressed.
Environments 2024, 11(8), 179; https://doi.org/10.3390/environments11080179
Submission received: 3 July 2024 / Revised: 7 August 2024 / Accepted: 14 August 2024 / Published: 20 August 2024
(This article belongs to the Special Issue Hydrological Modeling and Sustainable Water Resources Management)

Abstract

:
Water warming and nutrient pulses following extreme rainfall events, both consequences of climate change, may have a profound impact on the biogeochemical dynamics of large temperate rivers, such as the Po River (Northern Italy), affecting denitrification capacity and the delivery of N loads to terminal water bodies. Manipulative experiments on denitrification kinetics were carried out using dark laboratory incubations of intact sediment cores collected from the lower Po River. Denitrification was measured along temperature and NO3 concentration gradients using 15N additions, in summer and autumn, the two seasons when climate change-induced warming has been shown to be higher. The combination of increased temperatures and pulsed NO3-enhanced denitrification, suggesting that electron acceptor availability limits the process. The direct link between climate change-induced effects and the positive response of denitrification may have implications for the improvement of water quality in the coastal zone, as it may help to partially buffer N export, especially in summer, when the risk of eutrophication is higher. Further research is needed to investigate the quality and quantity of sediment organic matter as important drivers regulating river denitrification.

1. Introduction

As a result of human-induced climate change, extreme weather events are predicted to increase in frequency and intensity over the coming decades [1]. Precipitation and temperature anomalies are expected to alter both the magnitude and the timing of nutrient delivery from the watersheds to the coastal systems, as well as the biogeochemical dynamics of inland waters [2,3,4]. Intense rainfall generates large runoff and can mobilize and transport high amounts of nutrients, mostly as nitrate (NO3) from agricultural fields, resulting in large pulses to aquatic ecosystems [5,6,7]. Rivers are highly dynamic ecosystems located at the interface between terrestrial and marine systems acting as nutrient filters and buffering the anthropogenic impacts on coastal zones. Through a variety of biogeochemical mechanisms, they determine the transformation, retention, or removal of nutrient loads before they reach the open sea [8,9,10]. Denitrification is considered to be a key anaerobic respiration leading to the permanent removal of bioavailable nitrogen (N) [11], and freshwater systems are estimated to account for about 20% of total global denitrification [12]. The process is carried out by a group of heterotrophic bacteria using NO3 as a terminal electron acceptor and reducing it to gaseous end-products (N2 and N2O) which diffuse into the atmosphere [13]. It occurs mainly in hypoxic-anoxic sediments and is supplied by NO3 diffusing from the water column or produced in the oxic layer by nitrification [14,15]. Water temperature and NO3 availability appear to be the main factors controlling denitrification, but little research has examined them together even though aquatic ecosystems, especially rivers, are increasingly subject to NO3 pulse inputs and are gradually warming [6,16,17].
The Po River is the largest river in Italy (Northern Italy) and the third Mediterranean river whose waters are subject to climate warming, especially in summer and fall [17]. The Po basin is one of the most intensively farmed and densely populated areas in Europe and a hot spot for NO3 pollution. In recent years, the effects of climate change have been observed in the basin, including an increase in the frequency of intense rainfall events with consequent sudden changes in runoff [18,19,20] and in the delivery and transformation of N loads. While short-term heavy precipitation events may dramatically increase the mobilization of NO3, the progressive warming of the waters of the Po River may stimulate N dissipation processes and partially buffer the export of N to the coastal zones of the Adriatic Sea. These intertwined effects on the processing and transport of riverine N loads remain unexplored.
The aim of this work was to assess the combined effect of water temperature warming and NO3 pulse addition on N removal via denitrification in the Po River through controlled laboratory incubations of intact sediment cores. Summer and autumn were selected being the seasons when the effects of climate change are most evident in terms of temperature warming [18] and occurrence of extreme storm events [19,20]. In particular, the Po River water temperature has warmed over the last three decades, with the most pronounced signals in summer (+0.13 °C yr−1) and autumn (+0.16 °C yr−1), together with the strongest increase in the number of warm days (+70–80%) [17].

2. Materials and Methods

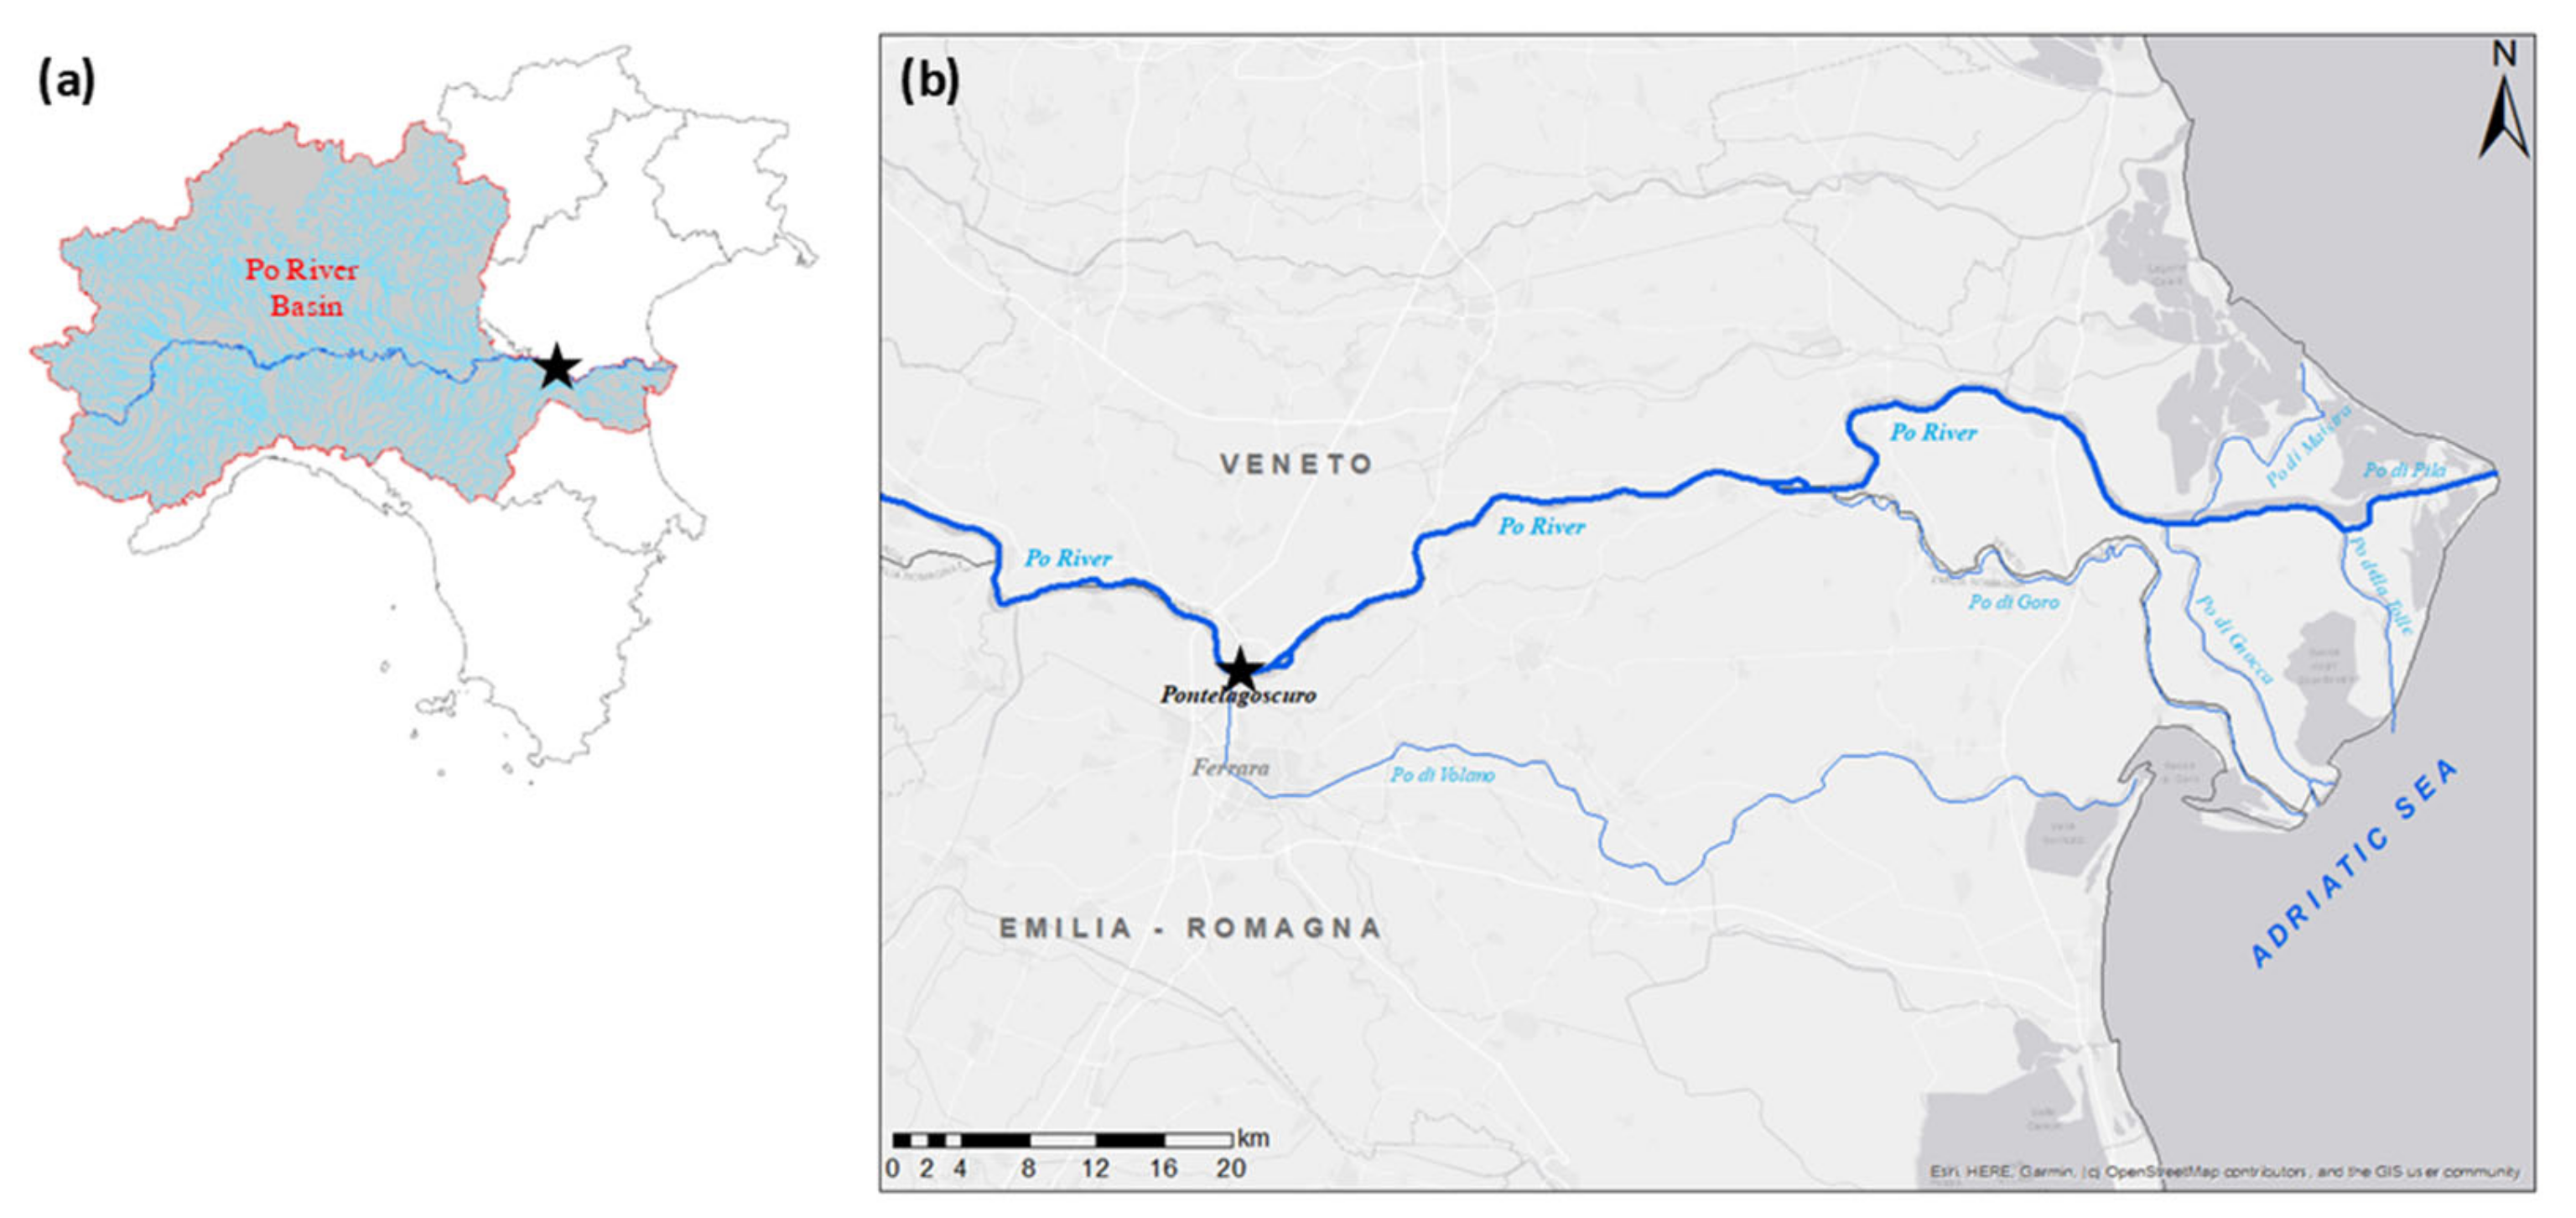
2.1. Study Area and Sampling Procedure

The Po River is the biggest Italian river flowing, with an average discharge of 1500 m3 s−1, from the Alps to the Adriatic Sea in Northern Italy (Figure 1) and has more than 140 tributaries and a capillary network of artificial canals [21]. The Po River basin is the largest cultivated area in Italy accounting for 35% of national agricultural production and the main source of nutrient inputs to the northern Adriatic Sea [22,23,24], making its coastal waters sensitive to eutrophication risk. The hydrological regime is characterized by two flood periods (spring and autumn) and two low-water periods (winter and summer). However, in recent decades, climate change affected this area with extreme events, such as the increase in heat wave frequency, the warming of water temperature, and the occurrence of prolonged drought periods [17,25]. In particular, the 2022 Po River hydrological drought was the worst in the last two centuries. The average daily discharge at the closing section was for more than three weeks below 168 m3 s−1, i.e., the historical minimum recorded in the 1961–2021 period, and reached a new record of 104 m3 s−1 on 24 July [25,26,27].
The study site was the closing section of the Po River basin, i.e., in the Pontelagoscuro locality (Ferrara province), right upstream of the deltaic system. Two sampling campaigns were carried out on 20 July and 15 November 2022, representative of summer and autumn conditions, respectively. In situ physicochemical parameters (temperature, oxygen concentration) were monitored using a multi-parameter probe (YSI 106 Model 85-Handheld Dissolved Oxygen, Conductivity, Salinity and Temperature System, Yellow Springs, OH, 107 USA), at the time of sediment sampling (Table 1).
In each season, 60 intact sediment cores (internal diameter 4.5 cm, length 20 cm) were sampled for the measurement of denitrification rates along the temperature gradient (15 cores were used for each of the 4 temperature treatments) and around 60 L of water were collected for core maintenance, pre- and incubation procedures. Additional cores (n = 5 for each season) were used for sediment characterization. Sediment samples were transported to the laboratory submerged in four tanks, corresponding to the four temperature treatments of each season, with site water continuously aerated using aquarium pumps. Each target temperature was set in the early afternoon of the day before incubation began to allow for acclimatization. The experimental temperatures were controlled in the incubation tanks by a thermostat and continuously monitored by a multi-parameter probe.
The experimental temperatures were controlled in the incubation tanks by a thermostat and continuously monitored using a multi-parameter probe [28]. Four different temperature treatments were applied in each seasonal incubation, i.e., 21, 25, 28, and 32 °C in summer and 9, 12, 16, and 20 °C in autumn. These threshold values were established based on historical temperature data for the Po River in the last three decades [17; 18; 28] and future predictions in the period of 2041–2070 [29]. The year 2022 was characterized by strong temperature anomalies. The water temperature of the Po River was constantly higher than the monthly mean values of the 2000–2021 period, with an average positive anomaly of 2.5 °C throughout the summer and until mid-autumn [18; 27].

2.2. Measurement of Benthic Oxygen Fluxes along Temperature Gradients

Benthic oxygen flux (sediment oxygen demand, SOD) was measured according to standardized protocols [30,31]. A Teflon-coated magnet driven by an external motor (40 rpm) was inserted into each core and suspended a few centimeters above the sediment–water interface to gently mix the water column. Sediments were incubated in the dark to simulate in situ conditions where the turbidity limits the light penetration to the benthic compartment [32]. Before incubation started, the water in the tanks was replaced with fresh water to maintain dissolved nutrient concentrations close to those found in the field. The water level in the tanks was lowered to a few centimeters below the top of the cores. Oxygen concentration was measured inside each core using a multi-parameter probe and each liner was then sealed with a gas-tight Plexiglass lid. Incubation lasted from 2 (summer experiment) to 4 h (autumn experiment), and at the end of the incubation period, the O2 concentration in each core was measured again. These durations have been established on the basis of pilot tests as the minimum time required to detect significant changes in solute concentrations and to keep O2 concentrations at the end of the incubation within 20% of the initial value, according to standard protocols [30].
The dark flux of O2 (sediment oxygen demand, SOD; µmol O2 m2 h1) was calculated according to the following equation [31]:
S O D = | O 2 f O 2 i | × V A   ×   t
where the brackets indicate the O2 concentration (μM) at the end (f) and at the beginning (i) of the incubation; V (L) is the water column volume; A (m2) is the sediment surface; and t (h) is the incubation time.

2.3. Measurement of Denitrification along Temperature and NO3 Gradients

After the SOD measurement, the water in the tanks was replaced with fresh water, and the intact cores were re-submerged for around 2 h to stabilize before the following incubation. The Isotope Pairing Technique (IPT; [33]) was applied to measure denitrification rates under increasing NO3 concentrations at the four temperature treatments tested in each season. The water level in the tanks was lowered to a few centimeters below the top of the cores to isolate them. To obtain final 15NO3 concentrations of 50, 100, 150, 200, and 250 µM, variable amounts of labeled NO3 (20 mM Na15NO3 stock solution, 98%, Sigma Aldrich, Inc. St. Louis, MO, USA) were added to the water phase of three replicates for each NO3 level. To simulate extreme storm events, which have become more frequent in the Po basin in recent decades, an enrichment of almost 40% of the in situ NO3 concentration was established [34,35].
To calculate the 15N- enrichment of the NO3 pool, a water sample was collected from each core before and after (5 min) the labeled NO3 addition. Water samples were collected from each core using a 60 mL glass syringe, filtered through Whatman GF/F glass fiber filters (pore size of 0.45 µm), transferred to 20 mL polyethylene scintillation vials, and analyzed with a Technicon AutoAnalyser II using the cadmium reduction method (detection limit of 0.4 µM; [36]). After the water sampling, the cores were capped with gas-tight Plexiglass lids and incubated in the dark for 2 h and 4 h during the summer and autumn experiments, respectively. The incubations were set to ensure the O2 consumption was less than 20% of the initial concentration, a requirement for IPT application [33]. At the end of the incubation, the sediment and water phases of each core were mixed to homogenize the dissolved N2 pools in the aqueous phase and pore water. An aliquot of the slurry was transferred to glass-tight vials (12 mL, Exetainer®, Labco Limited, Lampeter, UK) and fixed with 200 µL of ZnCl2 (7 M) to stop microbial activity. The slurry samples were analyzed by Membrane Inlet Mass Spectrometry (MIMS; Bay Instruments, Easton, MD, USA; [37]) to determine the abundance of 29N2 and 30N2. The IPT is one of the most widely used techniques for the measurement of denitrification in aquatic ecosystems [38,39,40]. The measured production of 29N2 (p29) and 30N2 (p30) was used to calculate the denitrification rates (µmol N m−2 h−1) according to principles and equations reported by Nielsen [33] and reviewed by Steingruber et al. [39]. The denitrification of labeled 15NO3 (D15) was calculated from p29 and p30, as follows:
D 15 = p 29 + 2 × p 30
Assuming a binomial distribution of 28N2, 29N2 and 30N2, Nielsen ([33]) derived the following equations for the calculation of denitrification of unlabeled 14NO3 (D14) and of total denitrification (Dtot):
D 14 = D 15 × p 29 2 × p 30
D t o t = D 14 + D 15
Denitrification of the 14NO3/15NO3 mixture diffusing from the water column into the sediment (DWtot) was calculated as follows:
D w t o t = D 15 ε
where ε is the isotopic NO3 enrichment, calculated as:
ε = N O 3 a N O 3 b N O 3 a
In Equation (6), the brackets indicate concentrations (µM), and the subscripts a and b refer to after and before the 15NO3 tracer addition, respectively.
Denitrification of NO3 produced within the sediment by nitrification, i.e., coupled nitrification-denitrification (Dn), was obtained by difference:
D n = D t o t D w t o t
Under the assumption that DWtot follows a linear increase with higher 15NO3 tracer concentrations, the rate can be extrapolated back to tracer-free conditions in order to obtain the denitrification rate (DW) of ambient nitrate (14NO3) diffusing from the water column to the sediment:
D w = D w t o t · 1 ε

2.4. Sediment Characterization

The additional sediment cores were used to determine sediment features at each seasonal sampling. The upper 0–1 cm sediment layer was extracted, homogenized, and analyzed for bulk density (g mL−1), measured as the weight of a known volume of fresh aliquot (5 mL), and porosity (%) after oven drying at 50 °C for 72 h. Powered aliquots of the dried sediment were transferred to a muffle furnace at 350 °C for 3 h to determine the organic matter content (OM, %) as loss on ignition.

2.5. Statistical Analysis

Linear regression was applied to determine the relation between water temperature and SOD and between 15NO3 and D15, using the software SigmaPlot 15.0 (Systat Software, Inc., San Jose, CA, USA). Denitrification rates of 15NO3 were analyzed using linear mixed-effect (LME) models to detect differences in applied temperature [28] and NO3 level in each seasonal experiment. In the LME test, a random effect was applied to consider all replicate samples at each temperature and nitrate gradient. The sample size was equal in all tests. The LME test was run in rStudio (rStudio-2023.06.0-421) using the nlme package [41]. The focus of the test was to compare the differences in process rates at different temperatures and 15NO3 concentrations and the correlation between the two factors by considering the season as a fixed factor. For all tests, the overall significance level was set at p ≤ 0.05.
The response of Dwtot to increasing NO3 concentrations was fitted to a linear model or a non-linear model representing an exponential curve or the Michaelis–Menten kinetic [42]:
D w t o t = D w t o t m a x · N O 3 K m + N O 3
where Dwtot max (µmol N m2 h1) is the maximum denitrification rate, [NO3] is the sum of ambient 14NO3 and added 15NO3 (µM), and Km is the Michaelis–Menten or half-saturation constant (i.e., the NO3 concentration at which Dwtot = 1/2 Dwtot max).

3. Results and Discussion

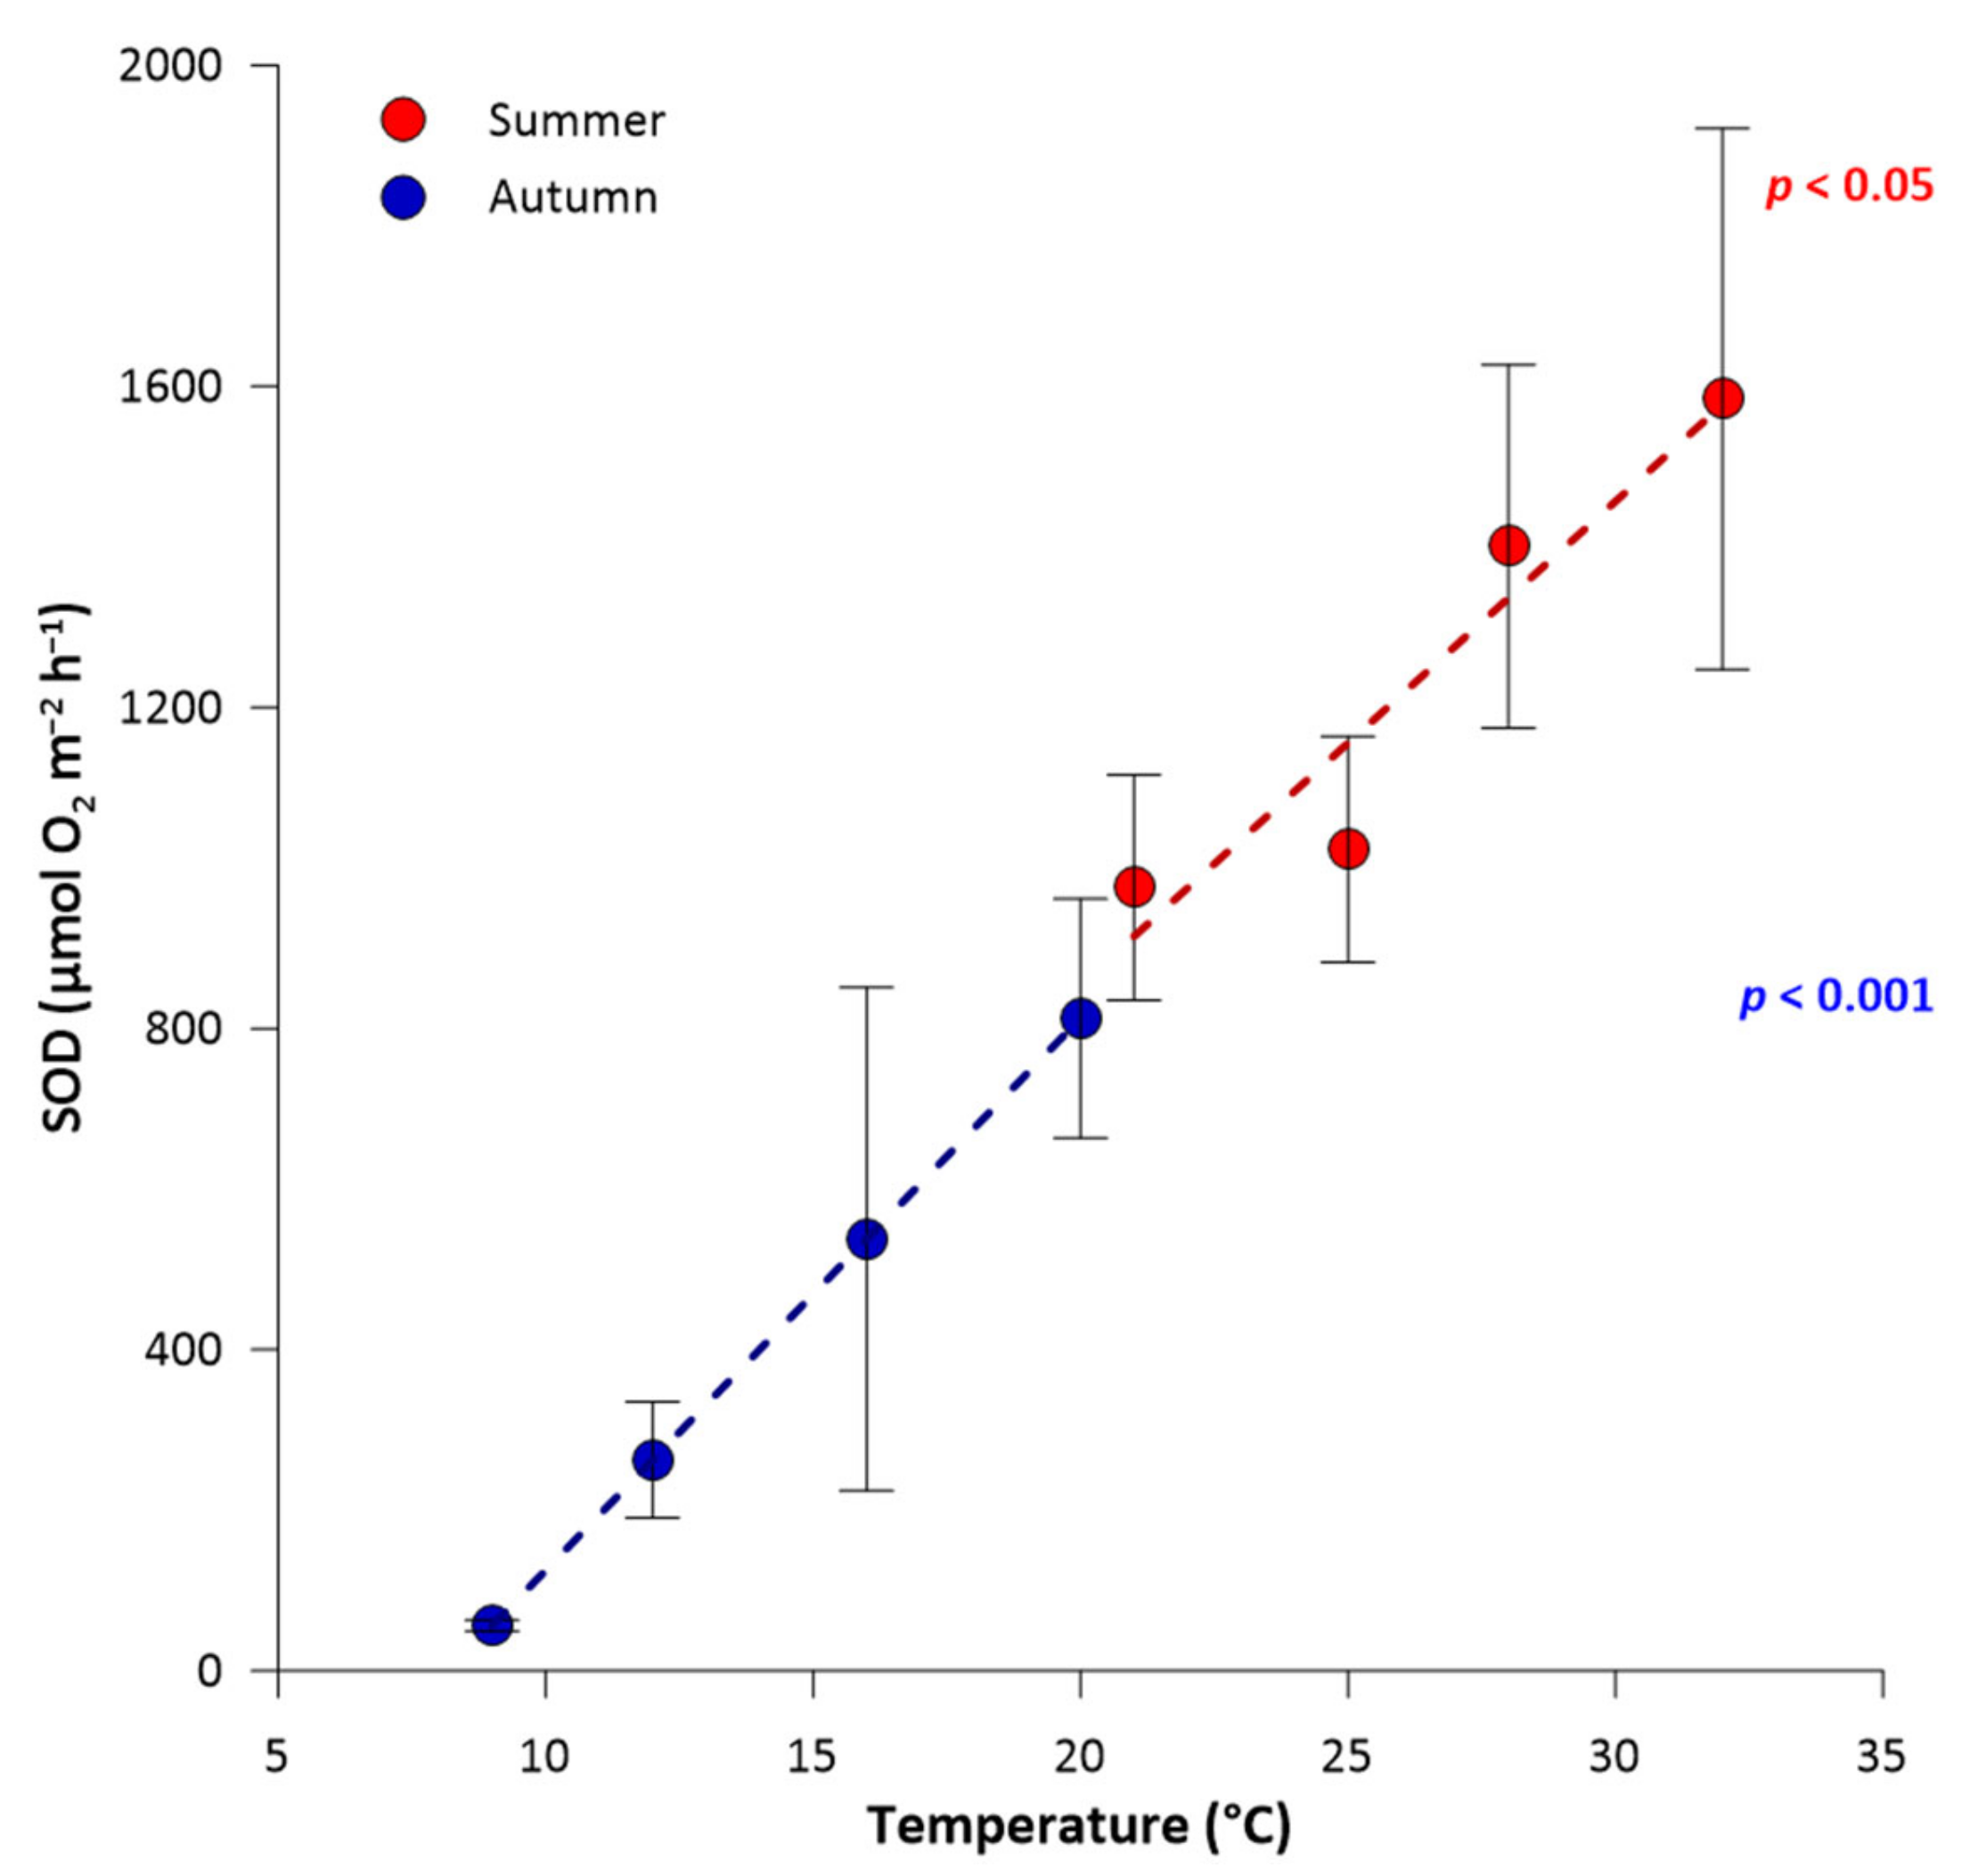
3.1. River Sediment Oxygen Demand along Seasonal Temperature Gradients

Water temperature warming significantly affected the benthic metabolism of the Po River, mainly by stimulating oxygen consumption because of increased respiration activity at higher temperatures, which agrees with previous outcomes in freshwater sediments [7,43,44]. In situ O2 concentrations were different in summer and autumn sampling, with higher values in autumn than in summer (8.3 and 10.2 mg L−1, respectively; Table 1), reflecting differences in gas solubility in relation to water temperature. The water of the Po River is well mixed in the section studied and along the whole of its upstream course, due to the high energy of the flow and its tortuous course. In fact, the O2 concentrations measured at the time of sediment sampling, as in other seasons [18], were close to 100% saturation. Along the experimental temperature gradients, the SOD ranged between 56 ± 7 and 813 ± 149 µmol O2 m−2 h−1 and between 926 ± 141 and 1584 ± 337 µmol O2 m−2 h−1 in autumn and summer, respectively. In both seasons, the sediment oxygen demand followed a linear trend with temperature (p < 0.05 in summer, p < 0.001 in autumn; Figure 2), with a rise of ~55 and ~69 µmol O2 m−2 h−1 for an increase of one degree of temperature in summer and autumn, respectively, highlighting a temperature dependence for microbial respiration [45].

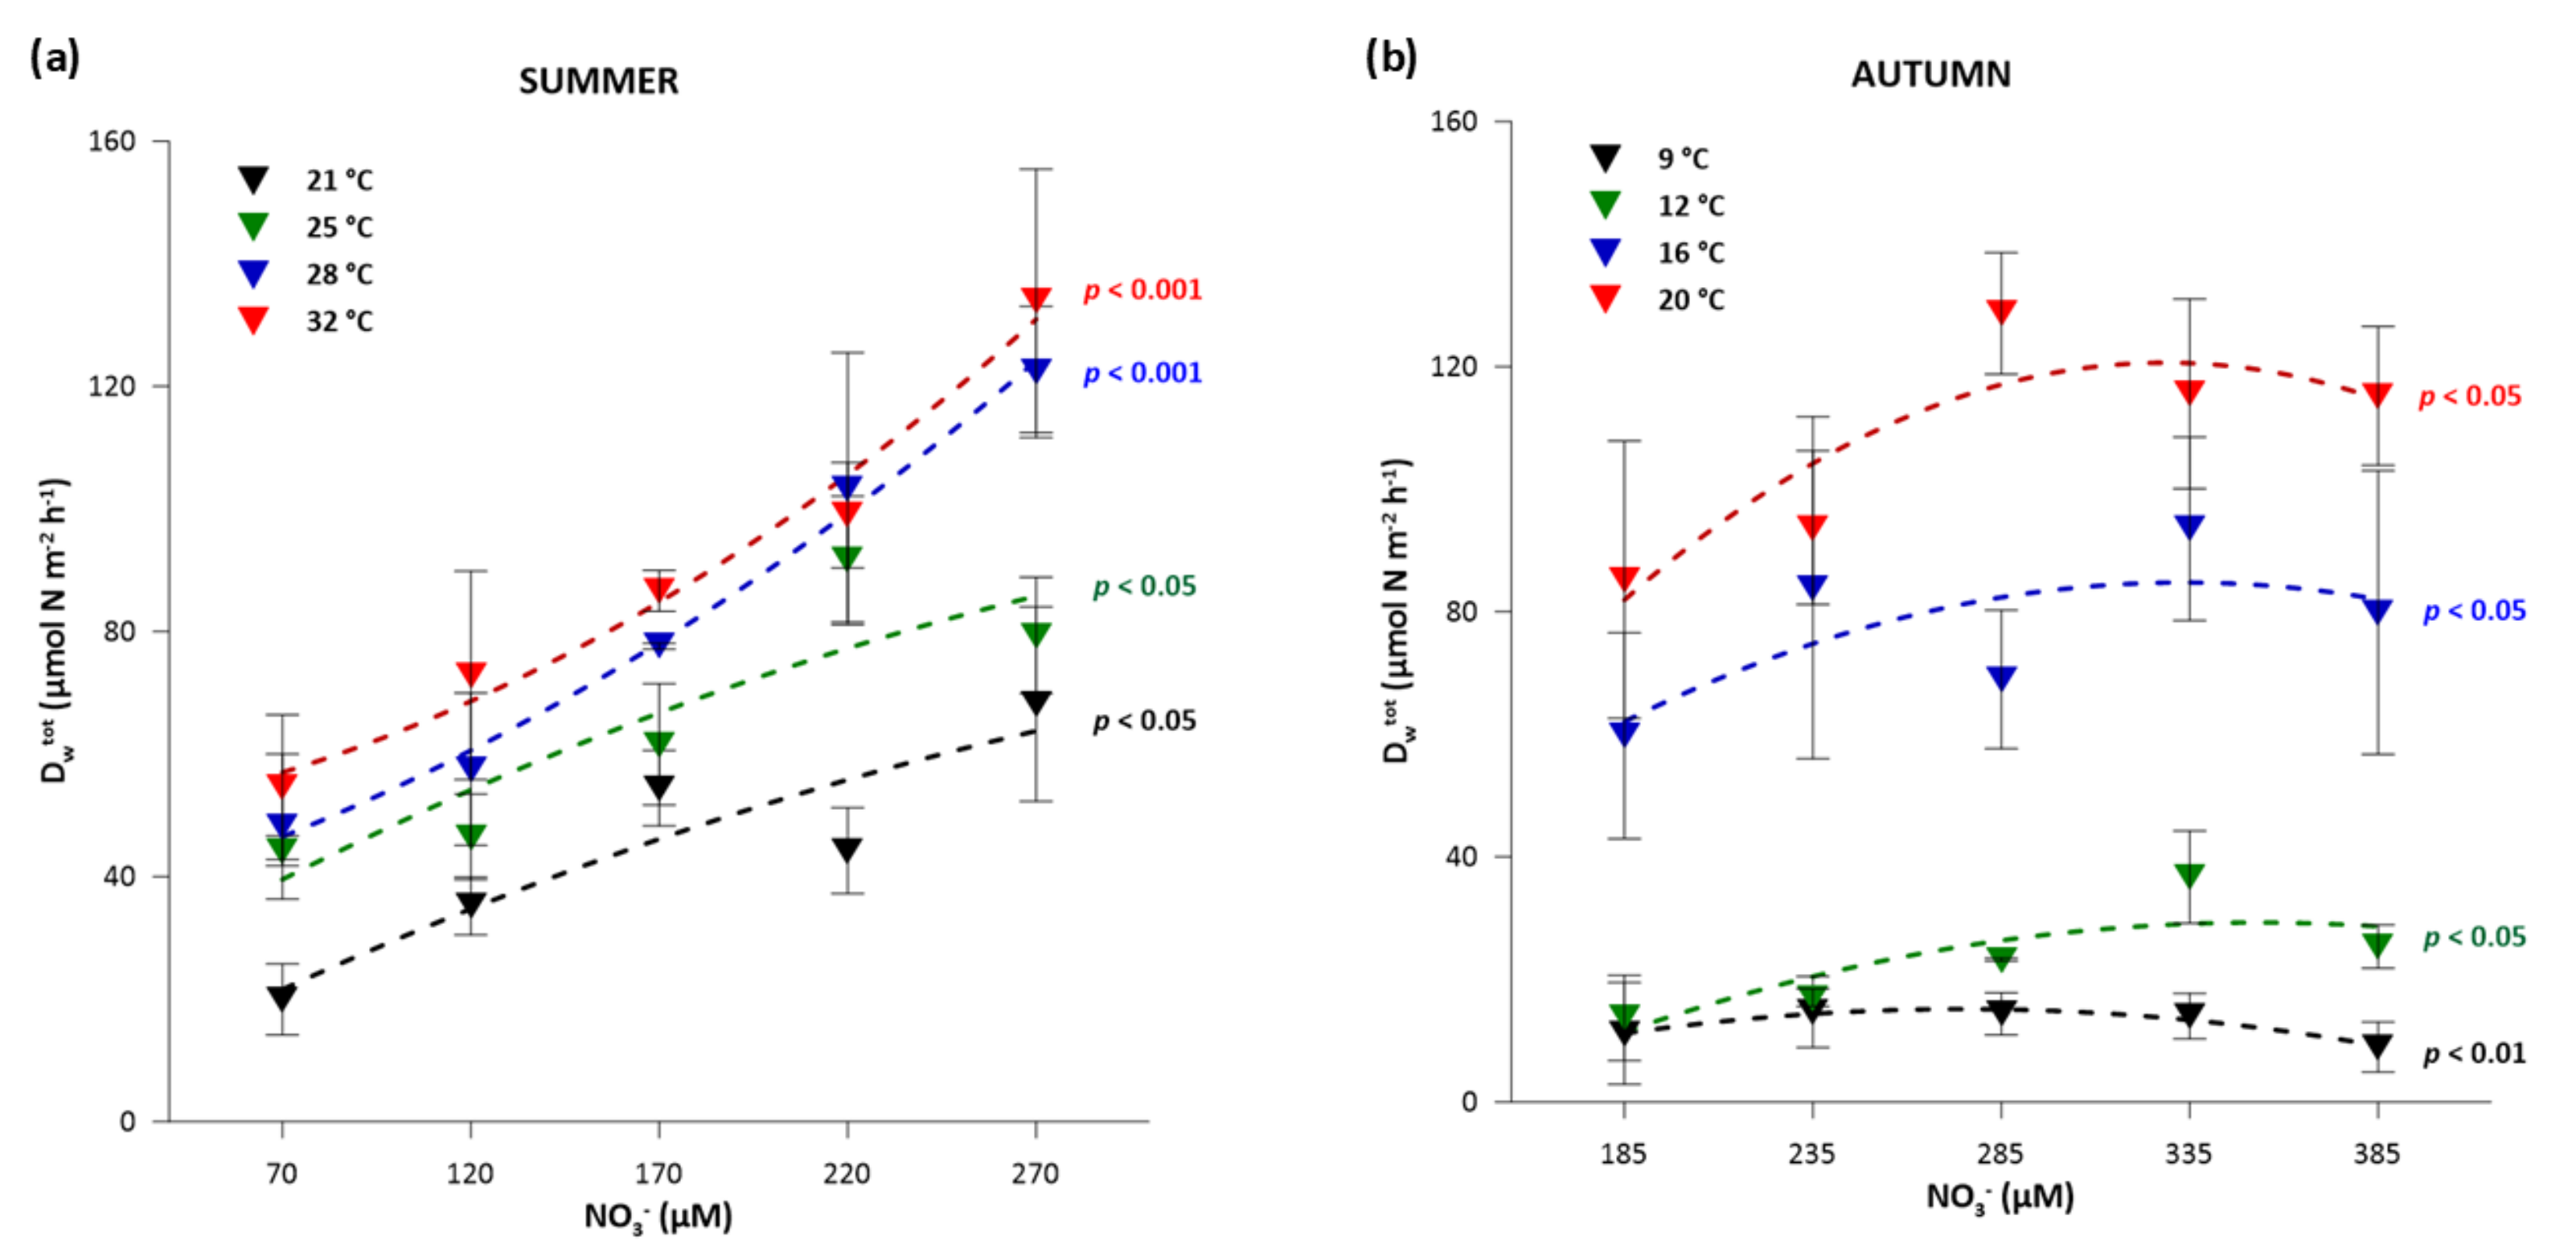
3.2. Influence of Water Temperature and NO3 Concentration on Partitioning between Dw and Dn

Denitrification rates increased significantly along the experimental temperature gradients set in the two seasons, with the magnitude and partitioning between Dw and Dn strongly determined by NO3 availability in the water column (Figure 3), similar to the previous results for the Po River sediments [28]. Summer denitrification rates measured at in situ NO3 concentration ranged between 15 ± 7 µmol N m−2 h−1 (at 21 °C) and 49 ± 7 µmol N m−2 h −1 (at 32 °C), with Dw contributing to a minor fraction of the overall rate (18–38%) due to low NO3 availability in water (~20 µM). In contrast, higher water NO3 concentrations in autumn (~135 µM) resulted in a dominance of Dw (77–95%) to total denitrification rates, which varied between 9 ± 4 µmol N m−2 h−1 (at 9 °C) and 65 ± 12 µmol N m−2 h−1 (at 20 °C). Dn showed a positive response along the temperature gradient in summer, varying from 10 ± 7 to 40 ± 7 µmol N m−2 h−1 and accounting for 62–82% of the total rates, while Dw did not exhibit the same upward trajectory and remained below 10 µmol N m−2 h−1 across the whole temperature gradient. In contrast, in the autumn experiment, Dw was systematically higher than Dn, increasing 7-fold with an 11 °C warming of water temperature.
The positive effect of temperature on denitrification is well known for various aquatic ecosystems, including riverbed sediments [46,47]. The biological reaction rate generally increases by two or three times for each 10 °C increase in temperature, as was also found in the present work. Water warming affects N removal via denitrification both as a direct effect on enzyme activity and as an indirect effect on sediment redox conditions [14,48,49]. Thus, higher water temperatures may reduce both O2 solubility and increase sedimentary O2 consumption, limiting O2 penetration and extending the hypoxic-anoxic layer suitable for denitrifying bacteria [43,50]. As temperature increases, microbial activity accelerates consuming all available O2, resulting in the use of other electron acceptors to degrade organic matter [11,14]. The warming of the water increased sediment respiration and anaerobic processes and this, together with high NO3 concentrations in the water column, played an important role in enhancing denitrification, specifically favoring the prevalence of Dw over Dn. Increasing temperature may have also triggered the enzyme kinetics of nitrifying bacteria. The ammonia required for this process is derived from the mineralization of organic N, which is stimulated at higher temperatures [15,51].

3.3. Climate Change-Related Factors Controlling Denitrification

A collective study of several aquatic ecosystems confirmed the importance of temperature in controlling denitrification, but several other environmental factors have been shown to modulate its seasonal patterns [8]. Many studies have investigated the drivers of denitrification in isolation by manipulating temperature, NO3, organic carbon, and other temperature-sensitive variables in laboratory assays [13]. However, climate change is expected to simultaneously alter several environmental factors that regulate denitrification. This highlights the need for studies that examine the effects of multiple controls, especially in large eutrophic rivers subject to extreme weather events.
The results of the present experiment showed that the combination of warmer temperatures and increased NO3 availability enhanced denitrification rates demonstrating that the process was not saturated along the 15NO3 gradient. Rates of 15NO3 consumption measured in summer (Figure 4a) ranged between 15 ± 5 (50 µM, 21 °C) and 125 ± 20 µmol N m−2 h−1 (250 µM, 32 °C). Summer rates were generally higher than the autumn rates (Figure 4b) measured along the same NO3 gradient but at lower temperatures. Indeed, D15 measured in autumn varied from 4 ± 3 (50 µM, 14 °C) to 74 ± 7 µmol N m−2 h−1 (250 µM, 20 °C). The response of D15 to increasing labeled 15NO3 concentrations followed a linear relation for all the temperature treatments tested in summer. It can be inferred that in lowland river stretches, during summer and autumn, denitrification may be constrained by the availability of electron acceptors. The sole exception to this trend was the highest temperature (32 °C) when the pattern along the NO3 gradient was more erratic despite the highest rates being measured at the maximum NO3 concentration (250 µM) (Figure 4). The addition of 15NO3 also stimulated D15 in autumn; in fact, the reduction rates increased linearly along the 15NO3 gradient for all temperatures, except at the lowest one (9 °C), confirming a microbial limitation at colder temperatures [52,53]. A breakpoint in the temperature response of denitrification may occur, reflecting the fact that rates decrease non-linearly at lower temperatures [11,54]. The LME statistical test (Table 2) showed the dependence of D15 from both temperature (p < 0.001) and NO3 availability in the Po River (p < 0.001), both in summer and in autumn. Moreover, there was a significant interaction between NO3 treatment and temperature, suggesting that the effect of substrate availability on denitrification was dependent on temperature as a key regulator of the enzymatic activity and of redox conditions [13,48].
The lowest temperature treatment tested in summer (21 °C) was only one degree different from the highest temperature tested in autumn (20 °C). However, in autumn D15 rates were slightly higher, on average, under non-limiting NO3 concentrations (250 µM) (Figure 4). This underlines that other factors affecting denitrification may have varied seasonally. Sediment organic matter was more available in autumn (Table 1), which may have promoted denitrification. Sediment organic matter stimulates the process directly by providing substrate (i.e., electron donors) to heterotrophic denitrifiers, and indirectly by increasing O2 consumption, reducing the thickness of the oxic zone [11].
In autumn, over the whole temperature gradient, the response of Dwtot (i.e., denitrification of the 14NO3/15NO3 mixture diffusing from the water column into the sediment) to total NO3 availability (ambient 14NO3 + added 15NO3) showed asymptotic rates. This indicates the saturation of denitrification capacity, as shown by Michaelis–Menten curves (Figure 5). The kinetics of denitrification at high NO3 concentrations are quite uncertain, where either electron acceptor saturation or limitation by other controlling factors may occur [8,13], such as organic matter in sandy sediments of the Po River (Table 1). At the lower summer temperature (21 and 25 °C), a saturation over 220 µM was observed, while the increase in denitrification was exponential at the highest temperatures (28 and 32 °C). With increased electron acceptor availability, denitrification is released from substrate limitation, potentially allowing a greater response to temperature increase. The linear positive response may also be due to increased mineralization rates. This would release organic compounds and create a temperature-induced O2 deficiency, which in turn may reduce the width of the oxic layer, resulting in a thinner diffusion path length for NO3 [14,43].
The observed denitrification rates compare well to those previously reported for several aquatic ecosystems of the Po River Basin [27]. Pulse NO3 additions resulted in an immediate stimulation of denitrification rates in the Po River sediments suggesting that the denitrification potential was only partially expressed. These results are consistent with other studies describing the dependence of denitrification on NO3 availability in freshwater sediments [55,56], as well as its control by other factors, such as organic matter content in sediments [43,57,58,59,60,61].
In the context of climate change, the sensitivity of denitrification to NO3 concentrations has important effects on water quality. The river self-depuration capacity supported by sediment denitrification appeared to be highly responsive to both temperature and NO3 availability with implications for water quality improvement in the Adriatic Sea, due to the potential reduction in N loads especially when riverine nutrients trigger the most eutrophication.

4. Conclusions

Manipulative laboratory experiments demonstrated that water warming and pulse NO3 addition resulted in a stimulation of denitrification leading to permanent N removal in the Po River sediments. The direct link between climate-induced water temperature increase and the positive response of denitrification may have implications for the improvement of water quality in the Adriatic Sea, as it may contribute to partially buffer N loads, especially in summer when the eutrophication risk is higher. Challenges remain in scaling up NO3 removal via denitrification from sediment cores to ecosystems, and future studies are needed to explore the natural heterogeneity influencing the spatial and temporal variation of N cycling in river sediments. Interactions among NO3 availability, temperature, organic carbon, and discharge are important to consider when assessing the changes in river self-depuration capacity under future climate scenarios. Exploring these might provide a more nuanced understanding of the river’s response to environmental changes. The efficiency of rivers as nutrient filters depends on factors other than the kinetics of denitrifiers, such as water residence time, which decreases during high-flow events. Finally, comprehensive experiments should be planned to fully understand the role of carbon limitation in controlling nitrous oxide production via incomplete denitrification.

Author Contributions

Conceptualization, M.P.G., G.C. and E.S.; methodology, E.S. and G.C.; investigation, M.P.G., E.S. and G.C.; formal analysis, M.P.G.; writing—original draft preparation, M.P.G. and E.S.; writing—review and editing, G.C.; visualization, M.P.G.; funding acquisition, G.C.; supervision, G.C. and E.S. All authors have read and agreed to the published version of the manuscript.

Funding

This study was financially supported by the Consorzio di Bonifica Pianura di Ferrara (Ferrara Plain Reclamation Consortium) as part of a long-term collaboration aimed at defining management strategies to control eutrophication in the Po Delta region. This research was also funded by the Emilia-Romagna Region, in the framework of the project “Assessment and mapping of the productivity of the bivalve mollusc aquaculture in the Sacca di Goro lagoon and the coastal stretch from Lido di Volano to Lido delle Nazioni, Ferrara, Emilia-Romagna” (Hunting and Fisheries Di-vision) and by the EcosistER Project, under the National Recovery and Resilience Plan (NRRP), within WP3—Biotic and abiotic marine resources of the Spoke 5—Circular economy and blue economy.

Data Availability Statement

The raw data supporting the conclusions of this article will be made available by the authors upon request.

Acknowledgments

The authors are grateful to Anna Gavioli (University of Ferrara) for her valuable advice on statistics and to Fabio Vincenzi (University of Ferrara) for his help with sampling.

Conflicts of Interest

The authors declare no conflicts of interest.

References

  1. IPCC. IPCC, 2021: Climate Change 2021: The Physical Science Basis. Contribution of Working Group I to the Sixth Assessment Report of the Intergovernmental Panel on Climate Change; Cambridge University Press: Cambridge, UK, 2021. [Google Scholar]
  2. Whitehead, P.G.; Wilby, R.L.; Battarbee, R.W.; Kernan, M.; Wade, A.J. A Review of the Potential Impacts of Climate Change on Surface Water Quality. Hydrol. Sci. J. 2009, 54, 101–123. [Google Scholar] [CrossRef]
  3. Zhao, G.; Merder, J.; Ballard, T.C.; Michalak, A.M. Warming May Offset Impact of Precipitation Changes on Riverine Nitrogen Loading. Proc. Natl. Acad. Sci. USA 2023, 120, e2220616120. [Google Scholar] [CrossRef] [PubMed]
  4. Liu, S.; Hu, K.; Xie, Z.; Wang, Y. Seasonal Constraint of Dynamic Water Temperature on Riverine Dissolved Inorganic Nitrogen Transport in Land Surface Modeling. Atmos. Ocean. Sci. Lett. 2024, 17, 100485. [Google Scholar] [CrossRef]
  5. Gao, Y.; Zhu, B.; Yu, G.; Chen, W.; He, N.; Wang, T.; Miao, C. Coupled Effects of Biogeochemical and Hydrological Processes on C, N, and P Export during Extreme Rainfall Events in a Purple Soil Watershed in Southwestern China. J. Hydrol. 2014, 511, 692–702. [Google Scholar] [CrossRef]
  6. Ballard, T.C.; Sinha, E.; Michalak, A.M. Long-Term Changes in Precipitation and Temperature Have Already Impacted Nitrogen Loading. Environ. Sci. Technol. 2019, 53, 5080–5090. [Google Scholar] [CrossRef]
  7. Van Vliet, M.T.H.; Thorslund, J.; Strokal, M.; Hofstra, N.; Flörke, M.; Ehalt Macedo, H.; Nkwasa, A.; Tang, T.; Kaushal, S.S.; Kumar, R.; et al. Global River Water Quality under Climate Change and Hydroclimatic Extremes. Nat. Rev. Earth Environ. 2023, 4, 687–702. [Google Scholar] [CrossRef]
  8. Piña-Ochoa, E.; Álvarez-Cobelas, M. Denitrification in Aquatic Environments: A Cross-System Analysis. Biogeochemistry 2006, 81, 111–130. [Google Scholar] [CrossRef]
  9. Birgand, F.; Skaggs, R.W.; Chescheir, G.M.; Gilliam, J.W. Nitrogen Removal in Streams of Agricultural Catchments—A Literature Review. Crit. Rev. Environ. Sci. Technol. 2007, 37, 381–487. [Google Scholar] [CrossRef]
  10. Zhao, S.; Zhang, B.; Sun, X.; Yang, L. Hot Spots and Hot Moments of Nitrogen Removal from Hyporheic and Riparian Zones: A Review. Sci. Total Environ. 2021, 762, 144168. [Google Scholar] [CrossRef]
  11. Knowles, R. Denitrification. Microbiol. Rev. 1982, 46, 43–70. [Google Scholar] [CrossRef]
  12. Seitzinger, S.; Harrison, J.A.; Böhlke, J.K.; Bouwman, A.F.; Lowrance, R.; Peterson, B.; Tobias, C.; Drecht, G.V. Denitrification across landscapes and waterscapes: A synthesis. Ecol. Appl. 2006, 16, 2064–2090. [Google Scholar] [CrossRef] [PubMed]
  13. Wallenstein, M.D.; Myrold, D.D.; Firestone, M.; Voytek, M. Environmental controls on denitrifying communities and denitrification rates: Insights from molecular methods. Ecol. Appl. 2006, 16, 2143–2152. [Google Scholar] [CrossRef] [PubMed]
  14. Silvennoinen, H.; Liikanen, A.; Torssonen, J.; Stange, C.F.; Martikainen, P.J. Denitrification and N2O Effluxes in the Bothnian Bay (Northern Baltic Sea) River Sediments as Affected by Temperature under Different Oxygen Concentrations. Biogeochemistry 2008, 88, 63–72. [Google Scholar] [CrossRef]
  15. Jickells, T.D.; Weston, K. Nitrogen Cycle—External Cycling. In Treatise on Estuarine and Coastal Science; Elsevier: Amsterdam, The Netherlands, 2011; pp. 261–278. ISBN 978-0-08-087885-0. [Google Scholar]
  16. Lu, C.; Zhang, J.; Tian, H.; Crumpton, W.G.; Helmers, M.J.; Cai, W.-J.; Hopkinson, C.S.; Lohrenz, S.E. Increased Extreme Precipitation Challenges Nitrogen Load Management to the Gulf of Mexico. Commun. Earth Environ. 2020, 1, 21. [Google Scholar] [CrossRef]
  17. Soana, E.; Gervasio, M.P.; Granata, T.; Colombo, D.; Castaldelli, G. Climate Change Impacts on Eutrophication in the Po River (Italy): Temperature-Mediated Reduction in Nitrogen Export but No Effect on Phosphorus. J. Environ. Sci. 2024, 143, 148–163. [Google Scholar] [CrossRef]
  18. Gervasio, M.P.; Soana, E.; Granata, T.; Colombo, D.; Castaldelli, G. An Unexpected Negative Feedback between Climate Change and Eutrophication: Higher Temperatures Increase Denitrification and Buffer Nitrogen Loads in the Po River (Northern Italy). Environ. Res. Lett. 2022, 17, 084031. [Google Scholar] [CrossRef]
  19. Pavan, V.; Antolini, G.; Barbiero, R.; Berni, N.; Brunier, F.; Cacciamani, C.; Cagnati, A.; Cazzuli, O.; Cicogna, A.; De Luigi, C.; et al. High Resolution Climate Precipitation Analysis for North-Central Italy, 1961–2015. Clim. Dyn. 2019, 52, 3435–3453. [Google Scholar] [CrossRef]
  20. Persiano, S.; Ferri, E.; Antolini, G.; Domeneghetti, A.; Pavan, V.; Castellarin, A. Changes in Seasonality and Magnitude of Sub-Daily Rainfall Extremes in Emilia-Romagna (Italy) and Potential Influence on Regional Rainfall Frequency Estimation. J. Hydrol. Reg. Stud. 2020, 32, 100751. [Google Scholar] [CrossRef]
  21. Soana, E.; Bartoli, M.; Milardi, M.; Fano, E.A.; Castaldelli, G. An Ounce of Prevention Is Worth a Pound of Cure: Managing Macrophytes for Nitrate Mitigation in Irrigated Agricultural Watersheds. Sci. Total Environ. 2019, 647, 301–312. [Google Scholar] [CrossRef]
  22. Ludwig, W.; Dumont, E.; Meybeck, M.; Heussner, S. River Discharges of Water and Nutrients to the Mediterranean and Black Sea: Major Drivers for Ecosystem Changes during Past and Future Decades? Prog. Oceanogr. 2009, 80, 199–217. [Google Scholar] [CrossRef]
  23. Blaas, H.; Kroeze, C. Excessive Nitrogen and Phosphorus in European Rivers: 2000–2050. Ecol. Indic. 2016, 67, 328–337. [Google Scholar] [CrossRef]
  24. Grilli, F.; Accoroni, S.; Acri, F.; Bernardi Aubry, F.; Bergami, C.; Cabrini, M.; Campanelli, A.; Giani, M.; Guicciardi, S.; Marini, M.; et al. Seasonal and Interannual Trends of Oceanographic Parameters over 40 Years in the Northern Adriatic Sea in Relation to Nutrient Loadings Using the EMODnet Chemistry Data Portal. Water 2020, 12, 2280. [Google Scholar] [CrossRef]
  25. Montanari, A.; Nguyen, H.; Rubinetti, S.; Ceola, S.; Galelli, S.; Rubino, A.; Zanchettin, D. Why the 2022 Po River Drought Is the Worst in the Past Two Centuries. Sci. Adv. 2023, 9, eadg8304. [Google Scholar] [CrossRef]
  26. Bonaldo, D.; Bellafiore, D.; Ferrarin, C.; Ferretti, R.; Ricchi, A.; Sangelantoni, L.; Vitelletti, M.L. The Summer 2022 Drought: A Taste of Future Climate for the Po Valley (Italy)? Reg. Environ. Chang. 2023, 23, 1. [Google Scholar] [CrossRef]
  27. Gervasio, M.P.; Soana, E.; Vincenzi, F.; Magri, M.; Castaldelli, G. Drought-Induced Salinity Intrusion Affects Nitrogen Removal in a Deltaic Ecosystem (Po River Delta, Northern Italy). Water 2023, 15, 2405. [Google Scholar] [CrossRef]
  28. Gervasio, M.P.; Soana, E.; Gavioli, A.; Vincenzi, F.; Castaldelli, G. Contrasting Effects of Climate Change on Denitrification and Nitrogen Load Reduction in the Po River (Northern Italy). Environ. Sci. Pollut. Res. 2024, 31, 48189–48204. [Google Scholar] [CrossRef]
  29. Vezzoli, R.; Mercogliano, P.; Pecora, S.; Zollo, A.L.; Cacciamani, C. Hydrological Simulation of Po River (North Italy) Discharge under Climate Change Scenarios Using the RCM COSMO-CLM. Sci. Total Environ. 2015, 521–522, 346–358. [Google Scholar] [CrossRef]
  30. Dalsgaard, T.; Nielsen, L.P.; Brotas, V.; Viaroli, P.; Underwood, G.; Nedwell, D.; Sundback, K.; Rysgaard, S.; Miles, A.; Bartoli, M.; et al. Protocol Handbook for NICE-Nitrogen Cycling in Estuaries: A Project under the EU Research Programme: Marine Science and Technology (MAST III); Ministry of Environment and Energy National Environmental Research Institute: Silkeborg, Denmark; Department of Lake and Estuarine Ecology: Silkeborg, Denmark, 2000; pp. 1–62.
  31. Owens, M.S.; Cornwell, J.C. The Benthic Exchange of O2, N2 and Dissolved Nutrients Using Small Core Incubations. J. Vis. Exp. 2016, 104, 54098. [Google Scholar] [CrossRef]
  32. Braga, F.; Zaggia, L.; Bellafiore, D.; Bresciani, M.; Giardino, C.; Lorenzetti, G.; Maicu, F.; Manzo, C.; Riminucci, F.; Ravaioli, M.; et al. Mapping Turbidity Patterns in the Po River Prodelta Using Multi-Temporal Landsat 8 Imagery. Estuar. Coast. Shelf Sci. 2017, 198, 555–567. [Google Scholar] [CrossRef]
  33. Nielsen, L.P. Denitrification in Sediment Determined from Nitrogen Isotope Pairing. FEMS Microbiol. Lett. 1992, 86, 357–362. [Google Scholar] [CrossRef]
  34. Boldrin, A.; Langone, L.; Miserocchi, S.; Turchetto, M.; Acri, F. Po River Plume on the Adriatic Continental Shelf: Dispersion and Sedimentation of Dissolved and Suspended Matter during Different River Discharge Rates. Mar. Geol. 2005, 222–223, 135–158. [Google Scholar] [CrossRef]
  35. Menicucci, S.; De Felice, A.; Biagiotti, I.; Canduci, G.; Costantini, I.; Palermino, A.; Centurelli, M.; Leonori, I. Interannual Variation in the Zooplankton Community of the North Adriatic Sea under Short-Term Climatic Anomalies. Diversity 2024, 16, 291. [Google Scholar] [CrossRef]
  36. Armstrong, F.A.J.; Stearns, C.R.; Strickland, J.D.H. The Measurement of Upwelling and Subsequent Biological Process by Means of the Technicon Autoanalyzer® and Associated Equipment. Deep. Sea Res. Oceanogr. Abstr. 1967, 14, 381–389. [Google Scholar] [CrossRef]
  37. Kana, T.M.; Darkangelo, C.; Hunt, M.D.; Oldham, J.B.; Bennett, G.E.; Cornwell, J.C. Membrane Inlet Mass Spectrometer for Rapid High-Precision Determination of N2, O2, and Ar in Environmental Water Samples. Anal. Chem. 1994, 66, 4166–4170. [Google Scholar] [CrossRef]
  38. Robertson, E.K.; Bartoli, M.; Brüchert, V.; Dalsgaard, T.; Hall, P.O.J.; Hellemann, D.; Hietanen, S.; Zilius, M.; Conley, D.J. Application of the Isotope Pairing Technique in Sediments: Use, Challenges, and New Directions. Limnol. Ocean Methods 2019, 17, 112–136. [Google Scholar] [CrossRef]
  39. Steingruber, S.M.; Friedrich, J.; Gächter, R.; Wehrli, B. Measurement of Denitrification in Sediments with the 15N Isotope Pairing Technique. Appl. Environ. Microbiol. 2001, 67, 3771–3778. [Google Scholar] [CrossRef]
  40. Eyre, B.D.; Rysgaard, S.; Dalsgaard, T.; Christensen, P.B. Comparison of Isotope Pairing and N2:Ar Methods for Measuring Sediment Denitrification—Assumption, Modifications, and Implications. Estuaries 2002, 25, 1077–1087. [Google Scholar] [CrossRef]
  41. Pinheiro, J.; Bates, D.; DebRoy, S.; Sarkar, D.; R Core Team. nlme: Linear and Nonlinear Mixed Effects Models. R Package Version 2018, 3, 1–137. [Google Scholar]
  42. Deichmann, U.; Schuster, S.; Mazat, J.; Cornish-Bowden, A. Commemorating the 1913 Michaelis–Menten Paper Die Kinetik Der Invertinwirkung: Three Perspectives. FEBS J. 2014, 281, 435–463. [Google Scholar] [CrossRef]
  43. De Klein, J.J.M.; Overbeek, C.C.; Juncher Jørgensen, C.; Veraart, A.J. Effect of Temperature on Oxygen Profiles and Denitrification Rates in Freshwater Sediments. Wetlands 2017, 37, 975–983. [Google Scholar] [CrossRef]
  44. Johnson, M.F.; Albertson, L.K.; Algar, A.C.; Dugdale, S.J.; Edwards, P.; England, J.; Gibbins, C.; Kazama, S.; Komori, D.; MacColl, A.D.C.; et al. Rising Water Temperature in Rivers: Ecological Impacts and Future Resilience. WIREs Water 2024, 11, e1724. [Google Scholar] [CrossRef]
  45. Perkins, D.M.; Yvon-Durocher, G.; Demars, B.O.L.; Reiss, J.; Pichler, D.E.; Friberg, N.; Trimmer, M.; Woodward, G. Consistent Temperature Dependence of Respiration across Ecosystems Contrasting in Thermal History. Glob. Chang. Biol. 2012, 18, 1300–1311. [Google Scholar] [CrossRef]
  46. Saunders, D.L.; Kalff, J. Nitrogen Retention in Wetlands, Lakes and Rivers. Hydrobiologia 2001, 443, 205–212. [Google Scholar] [CrossRef]
  47. Boulêtreau, S.; Lyautey, E.; Dubois, S.; Compin, A.; Delattre, C.; Touron-Bodilis, A.; Mastrorillo, S.; Garabetian, F. Warming-Induced Changes in Denitrifier Community Structure Modulate the Ability of Phototrophic River Biofilms to Denitrify. Sci. Total Environ. 2014, 466–467, 856–863. [Google Scholar] [CrossRef] [PubMed]
  48. Velthuis, M.; Veraart, A.J. Temperature Sensitivity of Freshwater Denitrification and N2O Emission—A Meta-Analysis. Glob. Biogeochem. Cycles 2022, 36, e2022GB007339. [Google Scholar] [CrossRef]
  49. Speir, S.L.; Tank, J.L.; Taylor, J.M.; Grose, A.L. Temperature and Carbon Availability Interact to Enhance Nitrous Oxide Production via Denitrification in Alluvial Plain River Sediments. Biogeochemistry 2023, 165, 191–203. [Google Scholar] [CrossRef]
  50. Veraart, A.J.; De Klein, J.J.M.; Scheffer, M. Warming Can Boost Denitrification Disproportionately Due to Altered Oxygen Dynamics. PLoS ONE 2011, 6, e18508. [Google Scholar] [CrossRef]
  51. Ward, B.B. Nitrification: An Introduction and Overview of the State of the Field. In Nitrification; Ward, B.B., Arp, D.J., Klotz, M.G., Eds.; ASM Press: Washington, DC, USA, 2014; pp. 1–8. ISBN 978-1-68367-116-9. [Google Scholar]
  52. Qu, W.; Suo, L.; Liu, R.; Liu, M.; Zhao, Y.; Xia, L.; Fan, Y.; Zhang, Q.; Gao, Z. Influence of Temperature on Denitrification and Microbial Community Structure and Diversity: A Laboratory Study on Nitrate Removal from Groundwater. Water 2022, 14, 436. [Google Scholar] [CrossRef]
  53. Brin, L.D.; Giblin, A.E.; Rich, J.J. Similar Temperature Responses Suggest Future Climate Warming Will Not Alter Partitioning between Denitrification and Anammox in Temperate Marine Sediments. Glob. Chang. Biol. 2017, 23, 331–340. [Google Scholar] [CrossRef]
  54. Verstraete, W.; Forcht, D.D. Biochemical Ecology of Nitrification and Denitrification [Soils]. In Advances in Microbial Ecology; Springer: Boston, MA, USA, 1977; pp. 135–214. [Google Scholar]
  55. Nogaro, G.; Burgin, A.J. Influence of Bioturbation on Denitrification and Dissimilatory Nitrate Reduction to Ammonium (DNRA) in Freshwater Sediments. Biogeochemistry 2014, 120, 279–294. [Google Scholar] [CrossRef]
  56. Racchetti, E.; Bartoli, M.; Soana, E.; Longhi, D.; Christian, R.R.; Pinardi, M.; Viaroli, P. Influence of Hydrological Connectivity of Riverine Wetlands on Nitrogen Removal via Denitrification. Biogeochemistry 2011, 103, 335–354. [Google Scholar] [CrossRef]
  57. Inwood, S.E.; Tank, J.L.; Bernot, M.J. Factors Controlling Sediment Denitrification in Midwestern Streams of Varying Land Use. Microb. Ecol. 2007, 53, 247–258. [Google Scholar] [CrossRef] [PubMed]
  58. Soana, E.; Naldi, M.; Bonaglia, S.; Racchetti, E.; Castaldelli, G.; Brüchert, V.; Viaroli, P.; Bartoli, M. Benthic Nitrogen Metabolism in a Macrophyte Meadow (Vallisneria spiralis L.) under Increasing Sedimentary Organic Matter Loads. Biogeochemistry 2015, 124, 387–404. [Google Scholar] [CrossRef]
  59. Tesi, T.; Miserocchi, S.; Acri, F.; Langone, L.; Boldrin, A.; Hatten, J.A.; Albertazzi, S. Flood-Driven Transport of Sediment, Particulate Organic Matter, and Nutrients from the Po River Watershed to the Mediterranean Sea. J. Hydrol. 2013, 498, 144–152. [Google Scholar] [CrossRef]
  60. Stelzer, R.S.; Thad Scott, J.; Bartsch, L.A.; Parr, T.B. Particulate Organic Matter Quality Influences Nitrate Retention and Denitrification in Stream Sediments: Evidence from a Carbon Burial Experiment. Biogeochemistry 2014, 119, 387–402. [Google Scholar] [CrossRef]
  61. Seitzinger, S. Linkages between Organic Matter Mineralization and Denitrification in Eight Riparian Wetlands. Biogeochemistry 1994, 25, 19–39. [Google Scholar] [CrossRef]
Figure 1. (a) Maps of the Po River Basin (red border), its main natural hydraulic network (light blue lines), and (b) of the sampling site (black star), i.e., the closing section at Pontelagoscuro (Ferrara province).
Environments 11 00179 g001
Figure 2. Sediment oxygen demand (SOD; µmol O2 m−2 h−1) measured along the water temperature gradients. Average values ± standard deviations are reported (n = 15). The dashed lines show the statistically significant trends indicated on the right.
Environments 11 00179 g002
Figure 3. Denitrification rates measured along the temperature gradients in (a) summer and (b) autumn at ambient NO3 concentrations. Rates are split in the contribution of Dw (denitrification of water column NO3) and Dn (denitrification of NO3 produced by nitrification in the oxic sediment layer). Average values ± standard deviations (n = 15) are reported.
Environments 11 00179 g003
Figure 4. Denitrification rates of the 15NO3 (µmol N m−2 h−1) measured along the labelled NO3 concentrations (µM) gradient in (a) summer and in (b) autumn at the different seasonal temperatures. Average values ± standard deviations (n = 3) are reported. The dashed lines show the statistically significant trend indicated on the right of the fitted curve.
Environments 11 00179 g004
Figure 5. Denitrification of the 14NO3/15NO3 mixture diffusing from the water column into the sediment (DWtot, µmol N m−2 h−1) as a function of NO3 concentration (ambient 14NO3 + added 15NO3) in (a) summer and in (b) autumn at the different tested temperatures. Average values ± standard deviations (n = 3) are reported. The dashed lines show the statistically significant trend indicated on the right of the fitted curve.
Environments 11 00179 g005
Table 1. Water and sediment features at Pontelagoscuro site during the summer and autumn samplings. Standard deviations are reported in brackets.
SeasonsTemperature
(°C)
O2
(mg L−1)
NO3
(µM)
OM
(%)
Density
(g mL−1)
Porosity
(%)
Summer298.320
(2)
0.4
(0.03)
2.1
(0.1)
40
(3)
Autumn1410.2135
(3)
1.7
(0.4)
1.8
(0.2)
60
(10)
Table 2. Effect of the factors (temperature and concentration of added 15NO3) and their interaction on denitrification of labeled tracer (D15) in summer and autumn, based on linear mixed effects (LME) models. F test value and significance level (p) are reported.
SeasonTemperature
(°C)
15NO3
(µM)
Temperature
×
15NO3
FpFpFp
Summer33.0<0.001115.7<0.0013.60.05
Autumn202.3<0.00151.6<0.00132.6<0.001
Disclaimer/Publisher’s Note: The statements, opinions and data contained in all publications are solely those of the individual author(s) and contributor(s) and not of MDPI and/or the editor(s). MDPI and/or the editor(s) disclaim responsibility for any injury to people or property resulting from any ideas, methods, instructions or products referred to in the content.

