Article

Phenol, Cyanide, and Thiocyanate in Aquatic Media: The Ecotoxicity of Individual Substances and Their Mixtures

Faculty of Chemical Engineering and Technology, University of Zagreb, Trg Marka Marulića 19, 10000 Zagreb, Croatia
*
Authors to whom correspondence should be addressed.
Environments 2025, 12(4), 128; https://doi.org/10.3390/environments12040128
Submission received: 23 March 2025 / Revised: 17 April 2025 / Accepted: 18 April 2025 / Published: 20 April 2025
(This article belongs to the Special Issue Environmental Pollution Risk Assessment)

Abstract

:
Although the coking industry is a major polluter, it is still an important and irreplaceable industry in many countries. Wastewater from the coking industry typically contains large amounts of various hazardous substances, including phenols, cyanides, and thiocyanates; we conducted a comprehensive study on their ecotoxicity. This included five different toxicity tests with common species from different trophic levels: the bacteria Aliivibrio fischeri and Pseudomonas putida, the microalgae Chlorella sp., the duckweed Lemna minor, and the onion plant Allium cepa. These tests have rarely or never been used for these three toxicants. The results show that cyanide generally has the highest toxicity, while phenol has a relatively equal or higher toxicity than thiocyanate, depending on the test. Since no data on the joint toxic action of these three toxicants can be found in the literature, and although their joint occurrence in the aquatic environment is very likely, we performed joint toxic action analysis. The analysis was performed for binary and ternary mixtures of the toxicants using the Aliivibrio fischeri test. The concentration addition model was used as a reference model for the toxic behavior of these mixtures. The results obtained showed a synergistic deviation from the concentration addition model for combinations of phenol with cyanide and with thiocyanate, while the combination of cyanide and thiocyanate led to additive toxic behavior.

1. Introduction

The emission of various toxic substances into the aquatic environment through industrial effluents has led to the widespread contamination of water bodies. Due to the high environmental persistence of many of these toxic substances, their bioaccumulative nature and their high biomagnification potential, this contamination poses a serious threat to the environment and consequently to human health [1]. Industrial effluents, especially effluents from the coking industry [2], often contain large quantities of phenols, cyanides, and thiocyanates, which have a particularly high hazardous potential [3,4]. Consequently, phenol and cyanide are classified as priority pollutants by the United States Environmental Protection Agency [5]. Some basic information about phenol as well as cyanide and thiocyanate ions can be found in Table 1, while the overview of their concentrations in different industrial effluents is presented in Table 2.
Wastewaters containing phenols, cyanides, and thiocyanates are regarded as one of the most difficult industrial effluents to treat due to their complex composition. Consequently, modern treatment strategies usually demand a combination of physical, chemical, and biological processes to meet increasingly stringent environmental regulations [2]. Figure 1 provides an overview of the treatment methods for wastewater containing phenols, cyanides, and thiocyanates. According to the EU Industrial Emissions Directive and the corresponding Best Available Technique (BAT) Reference Document for Common Waste Water and Waste Gas Treatment/Management Systems in the Chemical Sector, the maximum allowable concentrations for phenol, free cyanide, and thiocyanate in treated industrial effluents discharged into natural water bodies are typically set at 0.1 mg/L for each compound [12]. While treatment technologies are well established, the design capacity of industrial wastewater treatment plants varies significantly depending on the specific production scale and local regulations. For example, Bargiel et al. [13] report a treatment plant capacity of 600 m3/day for coking industry wastewater, while the authors are familiar with two facilities in the region with capacities of approximately 1200 m3/day and 700 m3/day, respectively. This is not surprising given that such industries typically generate enormous volumes of highly polluted effluents that require complex and large-scale treatment systems [2].
Phenol behaves in an aqueous solution like a weak organic acid (pKa at 25 °C is 9.99) and therefore occurs in the aquatic environment mainly in its non-ionized form. Phenol causes irritation to the skin, eyes, and respiratory tract and can be fatal in high concentrations or with prolonged exposure, with the probable lethal oral dose for humans being 50–500 mg/kg [14]. The adverse effects of phenol on organisms are thought to be related to its hydrophobicity and the formation of organic radicals [15]. The origin of phenol in the environment may be natural, as phenols occur in plants [16]. Anthropogenic phenols are the result of intentional production or a by-product of various industries such as the plastics, dye, paper and pulp, petroleum, antioxidant, and pharmaceutical industries [17]. Unfortunately, elevated levels of phenolic compounds have been detected in numerous bodies of water around the world [18,19,20].
Cyanides are salts of weak cyanide acid (HCN, pKa at 25 °C is 9.22; [21]). Some common cyanides are easily soluble in water, such as NaCN, KCN, Ca(CN)2, etc., while many others are relatively insoluble [22,23]. When cyanides dissolve in water, cyanide ions (CN) are formed, which are very reactive and tend to hydrolyze or form complexes with various metal ions. Therefore, the regulations for cyanides in water often refer to the content of free cyanide ions [24]. The presence of cyanides in the environment can be of natural origin, as cyanides are produced by certain bacteria [25], fungi [26] and plants [27]. However, cyanides in the environment may also be of anthropogenic origin, as cyanide compounds are used in a variety of industrial applications [23]. The toxicity of cyanides is attributed to their ability to inhibit aerobic respiration by binding the cyanide ion to the enzyme cytochrome c oxidase. This binding prevents electron transport and inhibits ATP production [28].
Thiocyanates are salts of relatively strong thiocyanic acids (HSCN, pKa at 25 °C is −1.85 [21]). Similar to cyanides, the solubility of the various thiocyanates in water varies from slightly soluble to relatively insoluble [22]. The dissolution of thiocyanates leads to the formation of thiocyanate ions: SCN. Thiocyanate ions can affect the central nervous system: short-term exposure can lead to symptoms such as irritability, nervousness, hallucinations, psychosis, mania, delirium, and convulsions, while long-term exposure to thiocyanate can lead to long-term neurological and psychological effects [29].
A detailed literature review on the ecotoxicity of phenol, cyanide, and thiocyanate can be found in the Supplementary Materials (Tables S1–S3). It is clear that the ecotoxicity of phenol has been studied relatively extensively, with toxicity tests carried out on various aquatic organisms (Table S1). When we talk about cyanide, it is generally considered to be very toxic [30]. However, it is interesting to note that among the toxicity studies conducted on aquatic organisms, studies on fish, freshwater snails, and shellfish are mainly found in the literature (Table S2). Studies on lower organisms are very rare, so we could only find three such studies [28,31,32]. We also found that analyses carried out on similar types of organisms sometimes result in relatively different toxicity values, for example, in the case of freshwater snails or fish (Table S2), but this is probably a consequence of the different sizes of the individuals of the test species used. The review by Ketcheson and Fingas [33] contains a lot of data on the toxicity of cyanide. Unfortunately, some of the test organisms in this review are referred to by overly general names. For example, apple snails, river snails, pond snails, and pouch snails are listed as freshwater snails used in toxicity tests without naming the exact snail species. To make matters worse, no original references were given for these data, making it impossible to check which species they refer to. Finally, with regard to thiocyanate, a general lack of studies investigating its ecotoxicity was noted (Table S3). Some data were found in the safety data sheets of the chemical manufacturers [34,35,36]; these data mainly refer to toxicity impacting the crustacean Daphnia magna and the fish Oncorhynchus mykiss. Regarding toxicity data for other organisms, we could only find one toxicity value for tests on the freshwater alga Pseudokirchneriella subcapitata [35].
Interestingly, despite the well-documented high toxic potential of all three compounds, there is a lack of published data on their combined toxic effects in aqueous mixtures. This is particularly notable given their frequent co-occurrence in industrial effluents, especially in wastewaters from the coking industry (Table 2). The simultaneous presence of these pollutants may result in enhanced adverse effects on aquatic organisms, making it essential to investigate the mechanisms and outcomes of their joint action. The common assumption that the effects of toxicant mixtures are merely additive is often inaccurate, as synergistic or antagonistic interactions can substantially alter the overall ecological risk. While regulatory frameworks often rely on single-compound toxicity data, natural and engineered aquatic environments are typically exposed to complex pollutant mixtures. Without reliable ecotoxicological data on such combinations, risk assessments may underestimate or mischaracterize actual environmental threats. Moreover, mixture toxicity is still underrepresented in regulatory testing protocols, despite its ecological relevance. This gap is further exacerbated by the limited number of standardized bioassays designed specifically for mixture evaluation, particularly those that include organisms from different trophic levels.
Based on the above, we decided to conduct a comprehensive study on the ecotoxicity of phenol, cyanide, and thiocyanate using toxicity tests that have rarely or never been used for these toxicants. This included five different toxicity tests with common species from different trophic levels: the bacteria Aliivibrio fischeri and Pseudomonas putida, the microalgae Chlorella sp., the duckweed Lemna minor, and the onion plant Allium cepa. Although tests for the luminescent bacterium Aliivibrio fischeri are quite popular due to the relatively high sensitivity of the test and the simplicity of its performance, we found only two studies in the literature that provided toxicity values for this test for phenol (Table S1) and one for cyanide (Table S2). The situation is similar for the microalgae Chlorella sp., where we found one report each on the toxicity of phenol and cyanide for Chlorella vulgaris. For thiocyanates, we found no literature reports on toxicity studies with these organisms. To the best of our knowledge, there are no reports on the toxicity of phenol, cyanide, or thiocyanate to Pseudomonas putida or Lemna minor. Finally, regarding the toxicity test with Allium cepa, we only found one report on the toxicity of phenol [37], which gives a 50% inhibitory concentration of 229.02 mg L–1 for a five-day exposure, and one report on the toxicity of cyanide [38], which discusses the various toxic effects of cyanide but without giving the exact toxicity value. Due to the noted lack of information on the joint toxic action of these toxicants, we also performed a toxicity analysis of their binary and ternary mixtures. Considering the peculiarities of the Aliivibrio fischeri test mentioned above, we decided to use this test to analyze the toxicity of mixtures. The experimentally determined toxicities of the mixture solutions were compared with the values predicted by the concentration-addition model, the most commonly used model to describe the toxicity of mixtures, in order to determine the presence of additive behavior or corresponding antagonism or synergism.
This study addresses these knowledge gaps by combining five distinct bioassays covering bacteria, microalgae, aquatic plants, and higher plants, providing a holistic view of toxicity profiles for individual compounds and their mixtures. The application of isobolographic analysis for binary and ternary systems offers an important methodological advance, enabling a more precise characterization of interactive effects. Such insights are crucial for improving the accuracy of ecological risk assessments and for guiding the design of more effective treatment and monitoring strategies in complex wastewater scenarios.

2. Materials and Methods

Crystalline phenol (≥99.5%, p.a., Sigma-Aldrich, St. Louis, MO, USA), potassium cyanide salt (≥98.0%, p.a., Sigma-Aldrich, St. Louis, MO, USA), and potassium thiocyanate salt (99.0%, p.a., VWR, Leuven, Belgium) were used to prepare the aqueous solutions of the toxicants. Two stock solutions were prepared for each toxicant: those at 1.0000 mM were used for experiments with Aliivibrio fischeri, while those at 100 mg L–1 were used for experiments with other test organisms. All stock solutions were prepared in sterilized volumetric flasks. Deionized water was used for the tests with Aliivibrio fischeri and Allium cepa, basal medium was used for the test with Chlorella sp., mineral medium was used for the test with Pseudomonas putida, and Steinberg medium was used for the test with Lemna minor. The working solutions were prepared by diluting the stock solutions.
All calculations were performed using MS Excel 2010 (Microsoft, Redmont, WA, USA) or the MATLAB R2010b software (MathWorks®, Natick, MA, USA).

2.1. Toxicity Tests Applied

Five different toxicity tests were carried out to investigate the ecotoxicity of phenol, cyanide, and thiocyanate: (1) a luminescence inhibition test with the marine bacterium Aliivibrio fischeri; (2) a growth inhibition test with the bacterium Pseudomonas putida; (3) a growth inhibition test with the microalgae Chlorella sp.; (4) a growth inhibition test with duckweed Lemna minor; and (5) a seedling growth test with Allium cepa. For a simpler assessment of toxicity, a linearized form of the dose–response curve was used, relating the logarithmic value of the molar concentration as the independent variable (concentrations in mM were used in this study) and the logarithmic value of a commonly used parameter γ as the dependent variable. The parameter γ is calculated from the inhibition values (INH; expressed in percent) according to Equation (1):
γ = I N H 100 I N H
where γ is the logarithmic value of this parameter, INH is the percentage of inhibition achieved for each concentration tested, and 100 is 100%, which is the maximum inhibition value. This parameter is very suitable for a rapid assessment of toxicity, as its logarithmic value is zero when the concentration of the toxicant is equal to the EC50 value.

2.1.1. Aliivibrio fischeri Test

The luminescence inhibition test with the marine bacterium Aliivibrio fischeri was carried out in accordance with the ISO 11348-3:2007 standard, Water Quality—Determination of the inhibitory effect of water samples on the light emission of Aliivibrio fischeri (luminescent bacteria test). The bacterium was cultivated in a nutrient medium as defined in the standard. Cultures that were 24 h old were used for the toxicity tests. The bacterial suspension was prepared in a 2% NaCl solution and activated in a luminothermostat (LUMIStherm thermostat, Hach Lange, Ames, IA, USA) at 15 °C. The toxicity test was carried out in glass cuvettes containing the test solution, i.e., the bacterial suspension and the corresponding volume of a test substance solution. To analyze the influence of the concentration of the test substance on the luminescence inhibition, test substance solutions in different concentrations were used. These solutions were prepared by diluting the stock solution according to a standard geometric dilution series. The luminescence of the test suspension was measured at the beginning of the test and after 30 min of exposure to the test substance; the percentage of luminescence inhibition (INH, %) was then calculated according to Equation (2) which reflects the decrease in luminescence as an indicator of toxic effect:
I N H = L U M 0 L U M 30 L U M 0 100 %
where LUM0 is the initial luminescence and LUM30 is the luminescence measured after 30 min of exposure to the test substance. The luminescence was measured with the luminometer LUMIStox 300 (also Hach Lange, USA) at a wavelength of 480 nm.

2.1.2. Pseudomonas putida Test

The growth inhibition test with the bacterium Pseudomonas putida was performed in accordance with the ISO 10712:1995 standard, Water Quality—Pseudomonas putida growth inhibition test (Pseudomonas cell multiplication inhibition test) with two modifications. Firstly, the cultured bacterial culture was recultured in mineral media prior to the experiments according to the instructions of the ISO standard, but glucose was excluded from the mineral media because the presence of glucose can potentially mask the adverse effects of the applied toxicants. Secondly, the exposure time was extended to 72 h, as we had not observed any growth inhibition at the standard exposure of 16 h. The initial experimental conditions are listed in Table 3.
The optical density of the bacterial suspension was measured using a DR/2400 spectrophotometer (Hach, Loveland, CO, USA) at a wavelength of 436 nm. The experiments were carried out in sterile Erlenmeyer flasks containing a bacterial suspension, a mineral medium prepared according to the ISO standard, and a tested toxicant. To analyze the adverse effect of the concentrations of the toxicant, six solutions with different concentrations were used: 100, 75, 50, 25, 10, and 1 mg L−1. In addition, control flasks were prepared with the same constituents as in the regular experiments, but without the toxicant. The number of viable cells, expressed as colony-forming units (CFUs), was determined at the beginning of each experiment and after 72 h of exposure. These values were used to calculate the percentage of bacterial growth inhibition (INH, %) (Equation (3)):
I N H = C F U 0 C F U 72 C F U 0 100 %
where CFU0 is the number of viable bacterial cells at the beginning of the experiment and CFU72 is the number of viable cells after 72 h of exposure to the test substance.

2.1.3. Chlorella sp. Test

The growth inhibition test with the freshwater microalgae Chlorella sp. was performed according to OECD Test No. 201: Freshwater Alga and Cyanobacteria, Growth Inhibition Test, as described in the OECD Guidelines for the Testing of Chemicals, Section 2 (2011). Chlorella sp. was activated in a sterilized liquid basal medium under light/dark cycles. The sedimentation of the microalgae was prevented by continuous aeration through a 0.45 µm sterile filter (ReliaDiscTM, Ahlstrom-Munksjö, Helsinki, Finland). The initial experimental conditions are listed in Table 3. The optical density of the algal suspension was measured at 670 nm using a DR/2400 spectrophotometer (Hach, Loveland, CO, USA). The number of viable algal cells (CFU value) was determined using an optical microscope (Olympus BX50, Olympus Optical, Tokyo, Japan) with a Thoma counting chamber. The experiments were performed in sterile Erlenmeyer flasks containing an algal suspension, basal medium, and a tested toxicant; the exposure time was 72 h. Six solutions with different concentrations of the toxicant were used; the concentrations were the same as in the case of the Pseudomonas putida test (see Section 2.1.2). Control flasks without toxicants were used for comparison. The growth inhibition (INH, %) was calculated using the CFU values at the beginning (CFU0) and at the end of the test (CFU72) according to Equation (3).

2.1.4. Lemna minor Test

A growth inhibition test with the duckweed Lemna minor was carried out in accordance with the OECD Test No. 221: Lemna sp. Growth Inhibition Test, outlined in the OECD Guidelines for the Testing of Chemicals, Section 2 (2006). Lemna minor fronds were pre-cultured in Steinberg growth medium under a 16/8 h light/dark photoperiod. Experiments were carried out in beakers containing the Steinberg medium, a tested toxicant and 10 fronds of duckweed (with roots removed). Six toxicant concentrations were used, corresponding to those used in the test with Pseudomonas putida (see Section 2.1.2). Control beakers without the toxicant were used for comparison. The experiments were carried out over a period of 7 days at 24 ± 2 °C, with a light/dark period of 16/8 h. The average specific growth rate of Lemna minor (µ) was calculated according to the following equation (Equation (4)):
μ = 1 t ln ( N t N 0 )
where µ is the average specific growth rate of Lemna minor, N0 is the number of fronds at the beginning, Nt is the number of fronds at the end of the experiment, and t stands for the number of exposure days.
In addition, the average root length of the duckweed and the chlorophyll content were determined as described by Kalčíková et al. [39] and Putar et al. [40]. The average root length was determined by measuring the root length of 10 randomly selected plants in each beaker. To determine the average chlorophyll content, fresh plant material was homogenized in cold ethanol (95%) and then stored in the freezer for 24 h, after which the absorbance of the supernatant was measured. The absorbance was measured at two wavelengths: 664.2 nm and 648.6 nm (spectrophotometer DR/2400; Hach, Loveland, CO, USA). The measured absorbance values were used to calculate the average chlorophyll content using the equation given by Lichtenthaler [41].

2.1.5. Allium cepa Test

The phytotoxicity test using onion Allium cepa was carried out in accordance with the OECD Test No. 208: Terrestrial Plant Test: Seedling Emergence and Seedling Growth Test, from the OECD Guidelines for the Testing of Chemicals, Section 2 (2006). Six plastic containers were used for the test: five with soil containing different concentrations of a tested toxicant and, for comparison, one container with soil containing no toxicant (control container). The toxicant concentrations used were 100, 75, 50, 25, 10, and 1 mg L−1. After homogenization of the soil, the 6 seeds of Allium cepa were placed in the containers, which were kept at 20 ± 0.5 °C and a humidity of 70 ± 25% for 21 days under a 16/8 h light/dark cycle. The light source generated a photon flux of 350 ± 50 µmol m–2 s–1. Information on the number and height of sprouts was recorded throughout the experiment. The final measurements included the visual assessment of seedling emergence, sprout height, percentage of germination, and the evaluation of visible adverse effects on different parts of the plant. These measurements and observations were compared with the results from the control container.

2.2. Analysis of Joint Toxic Activity

The joint toxic action of phenol, cyanide, and thiocyanate in aqueous solutions containing their binary and ternary mixtures was analyzed using the concentration addition model as a reference model for the toxic behavior of the mixtures. The analysis was carried out on the basis of EC50 values.

2.2.1. Determination of the Toxicity of Mixtures

The solutions of binary and ternary mixtures of phenol, cyanide, and thiocyanate were prepared with a total concentration of the tested toxicants of 1.0000 mM. Binary mixtures were prepared in the molar ratios 25:75, 50:50, and 75:25, while ternary mixtures were prepared in the molar ratios 25:25:50, 25:50:25, 50:25:5, and 33.3:33.3:33.3. To experimentally determine the toxicity of these mixtures, the Aliivibrio fischeri test described above was carried out (see Section 2.1.1). The experimental toxicity values were compared with the values predicted by the concentration addition model to determine whether the joint toxic action of the three selected toxicants was consistent with the model or whether there was an antagonistic or synergistic deviation.

2.2.2. Concentration Addition Model

The concentration addition model, or simply the additive model, uses the concept of the toxicity units (TU) defined by Equation (5):
T U i = c i E C p , i
where TUi is toxicity units of toxicant i, ECp,i is the effective concentration of toxicant i, i.e., the concentration that causes p-percent damage in the population of the test organism, and ci is the molar concentration of the same toxicant in a mixture that causes the same degree of damage to the population [42].
The additive model assumes that all toxicants in a mixture have a common or similar mode of action [43]. Therefore, the addition of the toxicity contributions of all toxic substances in the mixture (Equation (6)) results in the comprehensive toxicity unit of the mixture (TUMIX),
T U MIX = i T U i
where TUMIX is the toxicity unit of the mixture and TUi is the toxicity unit of the toxicant i.
Based on the same assumption, the entire mixture can be considered as a single-agent solution for which Equation (7) can be applied.
T U MIX = c MIX E C p , MIX
The term TUMIX stands for the toxicity unit of the mixture, the term cMIX stands for the sum of the molar concentrations of all toxicants in the mixture, and ECp,MIX stands for the toxicity of the mixture. The simple combination of Equations (5)–(7) yields Equation (8), which can easily be transformed into Equation (9).
c MIX E C p , MIX = i c i E C p , i
E C p , MIX = ( i x i E C p , i ) 1
Equation (9) predicts the toxicity of the mixtures that behave according to the additive model. Here, xi represents the mole fraction of component i in the mixture of toxicants tested, as shown in Equation (10):
x i = c i c MIX
where the term xi represents the mole fraction of component i in the tested toxicant mixture, ci is the concentration of toxicant i, and cMIX is the concentration of the mixture.

3. Results and Discussion

In order to assess the ecotoxic potential of phenol, cyanide, and thiocyanate, a series of toxicity assays using different test organisms were conducted. The toxicity results are presented in Table 4. Since in some tests the selected range of toxicant concentrations did not include an EC50 value, we have also given the estimated EC20 values in Table 4. Values outside the applied concentration range were estimated by extrapolation. As extrapolation introduces additional uncertainty into the final result, all extrapolated values are marked with an asterisk in Table 4.
Since the tests with Aliivibrio fischeri, Pseudomonas putida, and Chlorella sp. are similar in that microorganisms are used as test organisms, we decided to comment on their results together, while the results for the tests with Lemna minor and Allium cepa are commented on separately due to the specificities of these tests.

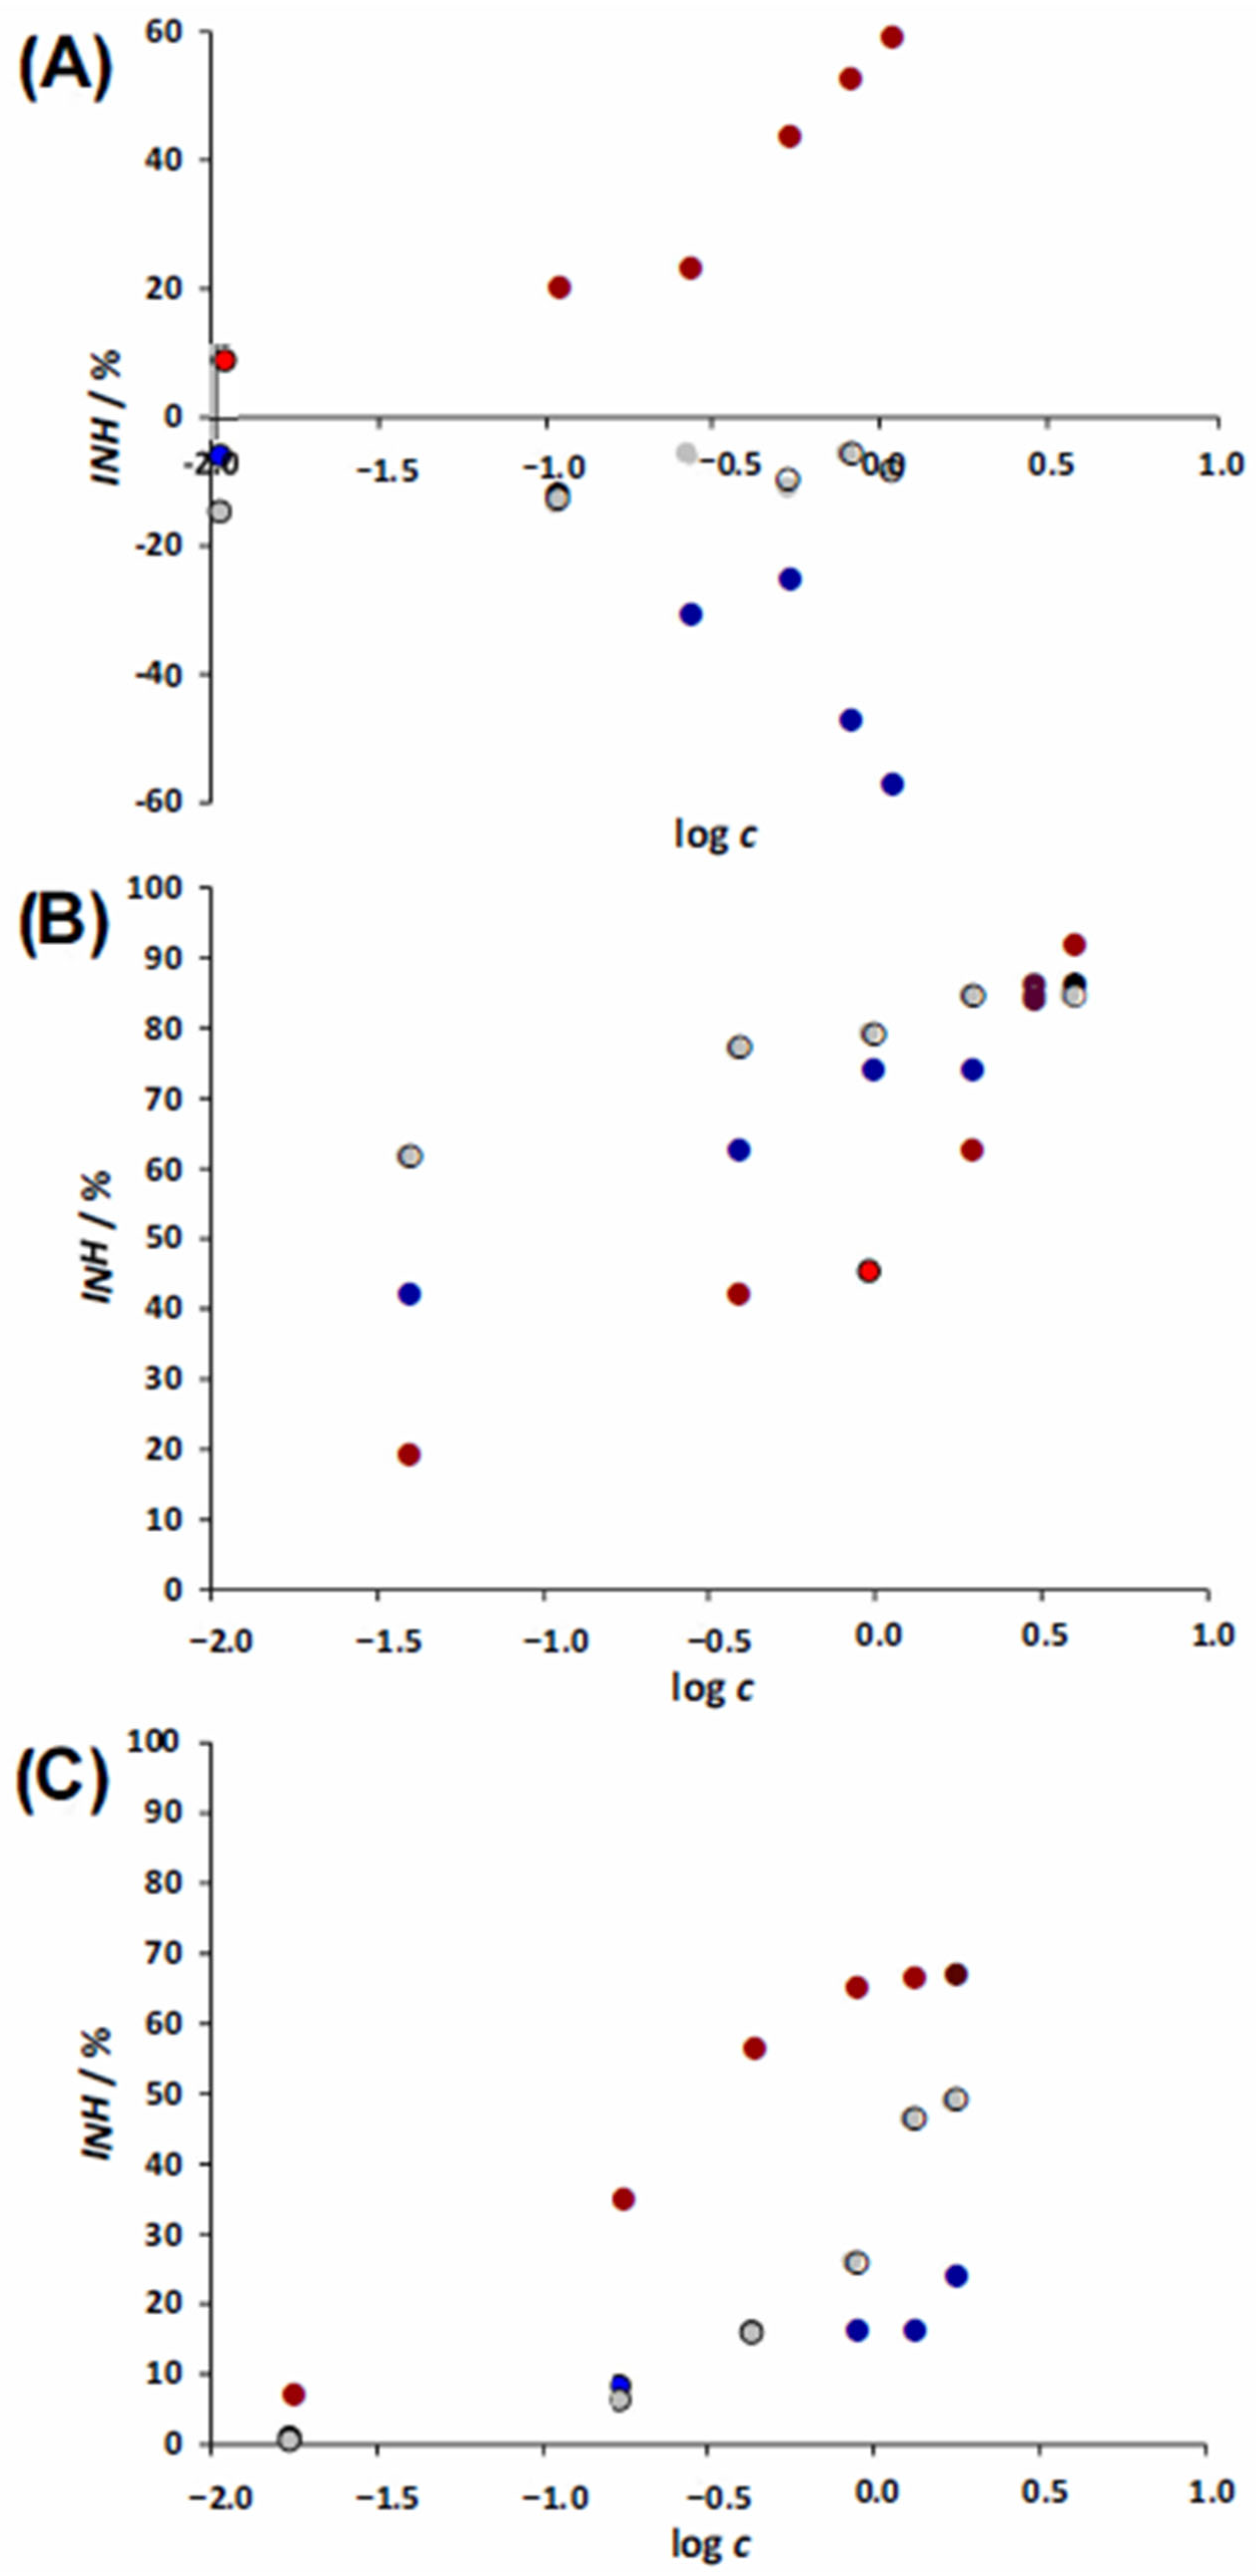
3.1. Toxicities Towards Aliivibrio fischeri, Pseudomonas putida, and Chlorella sp.

A comparison of the EC values listed in Table 4 shows that cyanide is the most toxic of the three toxins tested for the microorganisms Aliivibrio fischeri, Pseudomonas putida, and Chlorella sp. Thiocyanate and phenol showed practically the same toxicity to Aliivibrio fischeri (taking into account the EC50 values). Their toxicities to Pseudomonas putida and to Chlorella sp. (considering EC20 values, as EC50 values are assessed by data extrapolation) are also relatively consistent, although a slightly higher toxicity of phenol to Pseudomonas putida and of thiocyanate to Chlorella sp. was observed. The relative consistency of the toxicity results obtained by tests with Pseudomonas putida and Chlorella sp. implies that these two tests are equally sensitive to the toxicants tested, although two different organisms are used in these tests: bacterium and microalgae. Considering the possible behavior of these two cultures towards the presence of phenol in the immediate environment, it is necessary to emphasize that both cultures: Pseudomonas putida and Chlorella sp. have the ability to produce the enzymes protocatechuate 3,4-dioxygenase and catechol 1,2-dioxygenase [44,45], which facilitate the degradation of phenol [46], so that these cultures can potentially use phenol as a source of carbon and energy. Regarding exposure to cyanide, some authors believe that Pseudomonas putida and Chlorella sp. can also utilize it [47,48]. This is most likely due to the action of the enzyme cyanide hydratase, which converts cyanide to formamide, which in turn is degraded to ammonia and CO2 [3].
If we compare the results obtained in our study with the toxicity data available in the literature (Table S1), it is clear that the test with Aliivibrio fischeri gave a value for phenol toxicity that is consistent with that reported by [49], while the toxicity value obtained for cyanide was four times higher than that reported by Marugán et al. [31]. It seems interesting to discuss the results of cyanide toxicity towards Chlorella sp. In our case, an EC50 value of 24.79 mg L–1 was determined, while Liu et al. [28] reported an EC50 value of only 5.59 × 10⁻⁵ mg L–1 for Chlorella vulgaris. Such a high toxicity level is surprising, especially considering that Chlorella sp. can utilize cyanide from the environment [28,48] and that even the same authors [28] reported a positive effect of KCN at a concentration of 0.1 mg L–1 on Chlorella’s growth and chlorophyll content. For the other toxicity results against these three test microorganisms, we did not find suitable literature data with which to compare them.

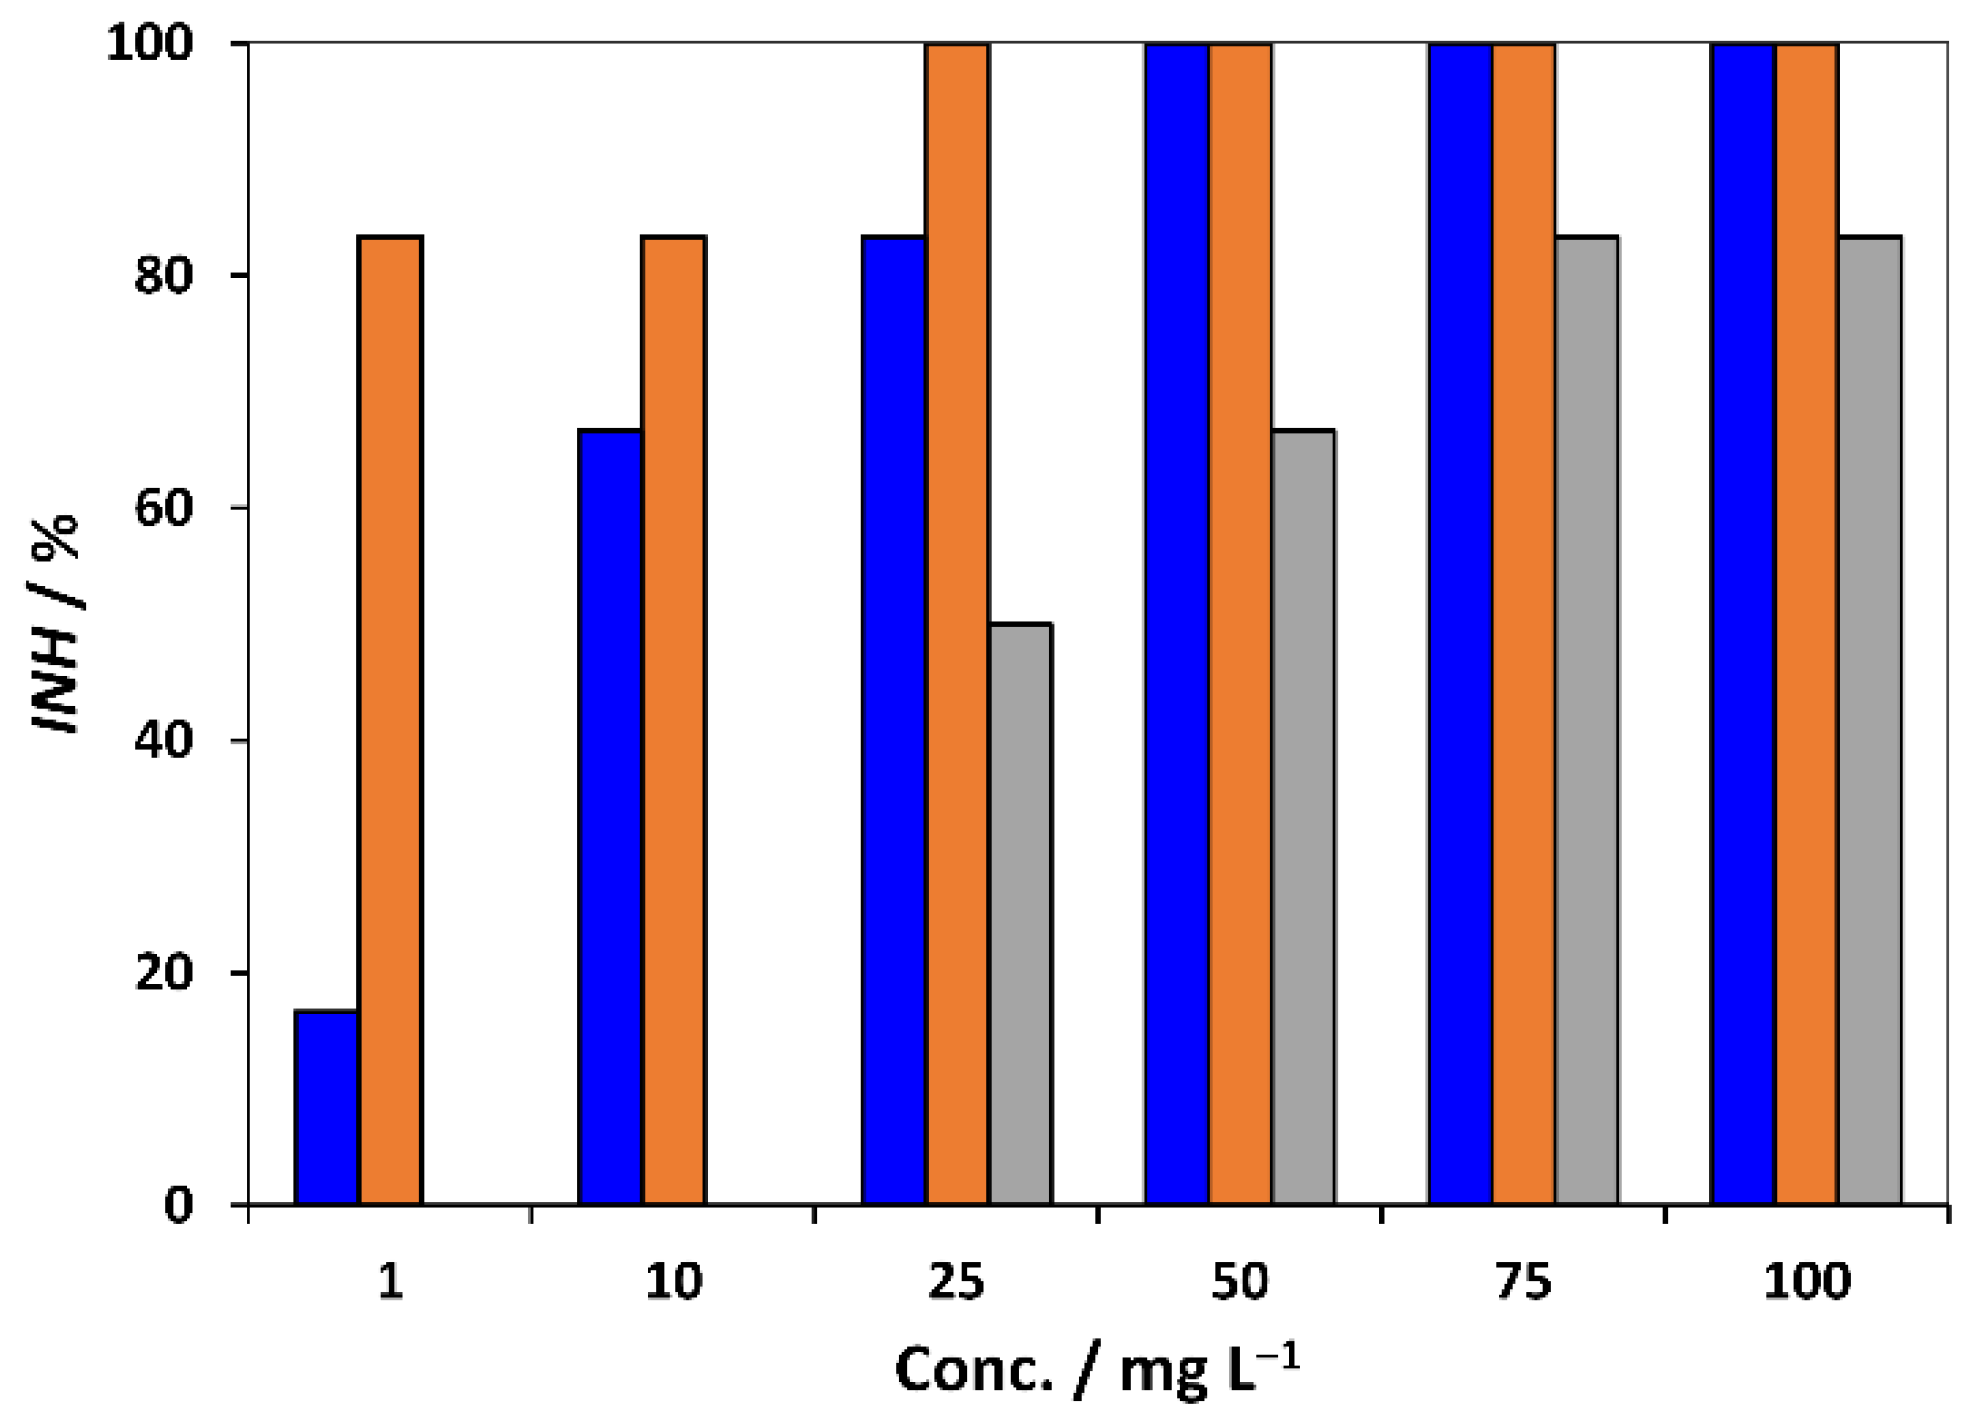
3.2. Toxicity Towards Lemna minor

Toxicity to duckweed Lemna minor (Table 4) was primarily determined by growth inhibition, which was monitored by counting the number of fronds. In addition, the influence of the concentration of toxicants on chlorophyll content and root length was also tested and commented upon.
The behavior of Lemna minor in the presence of phenol is shown in Figure 2A. Although we found a report stating that species such as Lemna minor, Lemna obscura, and Lemna gibba are sensitive to phenolic compounds [15], we detected no inhibition of frond growth of Lemna minor at phenol concentrations below 100 mg L–1. Instead, we found a strong growth promotion (up to 56.94%) with increasing phenol concentration (represented by blue circles in Figure 2A), suggesting that Lemna minor can metabolize phenol. This result is more consistent with that of Song and Huang [50], where no negative effects on the growth of Lemna polyrhiza were observed after 8 days of exposure to 1.88 mM pentachlorophenol.
The promotion of frond growth observed in our study was accompanied by a slight increase in root growth (up to 14.68%). However, due to variability in the data, no consistent dose-dependent trend could be established in this case (grey circles in Figure 2A). Notably, phenol exposure caused a visible deterioration of fronds, progressing from chlorosis to necrosis. This effect was confirmed by the chlorophyll content analysis (red circles in Figure 2A), which indicated an inhibition of chlorophyll a formation (up to 59.28%) with increasing phenol concentration. These findings suggest that, in Lemna minor, frond and root growth are less sensitive to phenol exposure compared to chlorophyll synthesis.
In the case of cyanide (Figure 2B) and thiocyanate (Figure 2C), the inhibition of all three monitored parameters (frond growth, root growth, and chlorophyll formation) was observed, with the detrimental effect of cyanide being much more pronounced. This is particularly evident in the inhibition of frond growth (up to 86.38% and 24.20% for cyanide and thiocyanate, respectively). In the root growth test, high inhibition values (61.77–84.71%) were observed for the entire concentration range of cyanide (1–100 mg L–1), which was not the case for thiocyanate, where only the highest concentration values resulted in inhibition values around 50% (the highest was 49.01%). The differences between cyanide and thiocyanate in the inhibition of chlorophyll formation were much smaller for some reason. However, of the three tests used, the chlorophyll inhibition test showed the steepest trend for both toxicants, suggesting that this test is the most sensitive to changes in the concentrations of cyanide and thiocyanate.
These findings suggest that the response of Lemna minor to phenol is complex, involving both the stimulation of frond and root growth and the inhibition of chlorophyll a formation, likely indicating a short-term adaptive mechanism rather than a genuinely beneficial effect. In contrast, cyanide and thiocyanate clearly impair overall growth and physiological function. The observed differences in toxicity are most likely related to the distinct structural properties of the tested compounds, although a general difference in the physiological response of Lemna minor to organic versus inorganic pollutants cannot be excluded.

3.3. Toxicity Towards Allium cepa

The growth inhibitions determined for the Allium cepa test are shown in Figure 3 and the assessed toxicity values are listed in Table 4. The growth inhibition was assessed by comparing the number of germinated individuals in the sample containing the toxicant with the number of germinated individuals in the blank sample. The relatively low number of only six individuals in the blank sample led to a high classification of inhibition values, which could only assume values of 0, 16.67, 33.33, 50, 66.67, 83.33, and 100%. It is to be expected that such a high classification of inhibition values increases the uncertainty of the toxicity assessment. Furthermore, since the linearization of the dose–response curve included the logarithmic value of the parameter γ (defined by Equation (1)), we had to exclude toxicant concentrations that resulted in 0 or 100% inhibition from the linearization process, which further increased the uncertainty of the toxicity assessment. As a result, only three experimentally determined data points relating to the concentration range from 1 to 25 mg L–1 (0.0106–0.2656 mM) were used to assess the toxicity of phenols. In the case of cyanide, there were only two concentration levels: 1 and 10 mg L–1 (0.0384–0.3843 mM), that resulted in inhibitions of less than 100% (Figure 3), but due to the previously commented high classification of inhibition values, these two concentrations resulted in an equal inhibition of 83.33%. Therefore, it was not possible to construct a linearized form of the dose–response curve. It was only possible to state (Table 4) that the EC50 value for cyanide was below 1 mg L–1 (<0.0384 mM). In the case of thiocyanate, the linearization of the dose–response curve was performed using four inhibition values corresponding to a concentration range of 25–100 mg L–1 (0.4304–1.7218 mM; Figure 3).
Although we were not able to determine the exact EC50 value for cyanides, only the concentration value below which we were certain the EC50 value was, by comparing this information with the molar EC50 values for phenol and thiocyanate (Table 4), it was possible to draw a conclusion about the order of toxicity of the three toxicants tested. Thus, at the EC50 level, cyanide is the most toxic to Allium cepa, followed by phenol, and thiocyanate was about 10 times less toxic than phenol. This order seems to change at higher concentrations of the toxicants, which can be deduced from the values of the concentrations leading to maximum inhibition. This is not evident from the values of the mass concentrations, where cyanide reaches 100% inhibition at concentrations greater than or equal to 25 mg L–1, phenol reaches this inhibition at 50 mg L–1 and in the case of thiocyanate, 100% inhibition was not reached for the applied concentration range of 1–100 mg L–1. For the comparison of toxicity, however, it is not the mass concentration but the molar concentration that is relevant, since the molar concentration depends on the number of units of the toxicant, while the mass concentration additionally depends on the molar mass of the toxicant. Comparing the values of the molar concentrations, it becomes clear that 100% inhibition is achieved first by phenol (at 0.5313 mM) and then by cyanide (at 0.9608 mM), while thiocyanate is in third place. Although such a reversal of the order of toxicity of cyanide and phenol is not impossible, this observation should be taken with a grain of salt. This is because the values of phenol and cyanide concentrations that cause 100% inhibition are relatively close to each other, so the different order of toxicity may also be a consequence of the slightly higher measurement uncertainty resulting from the impossibility of a “finer” classification of the inhibition values.

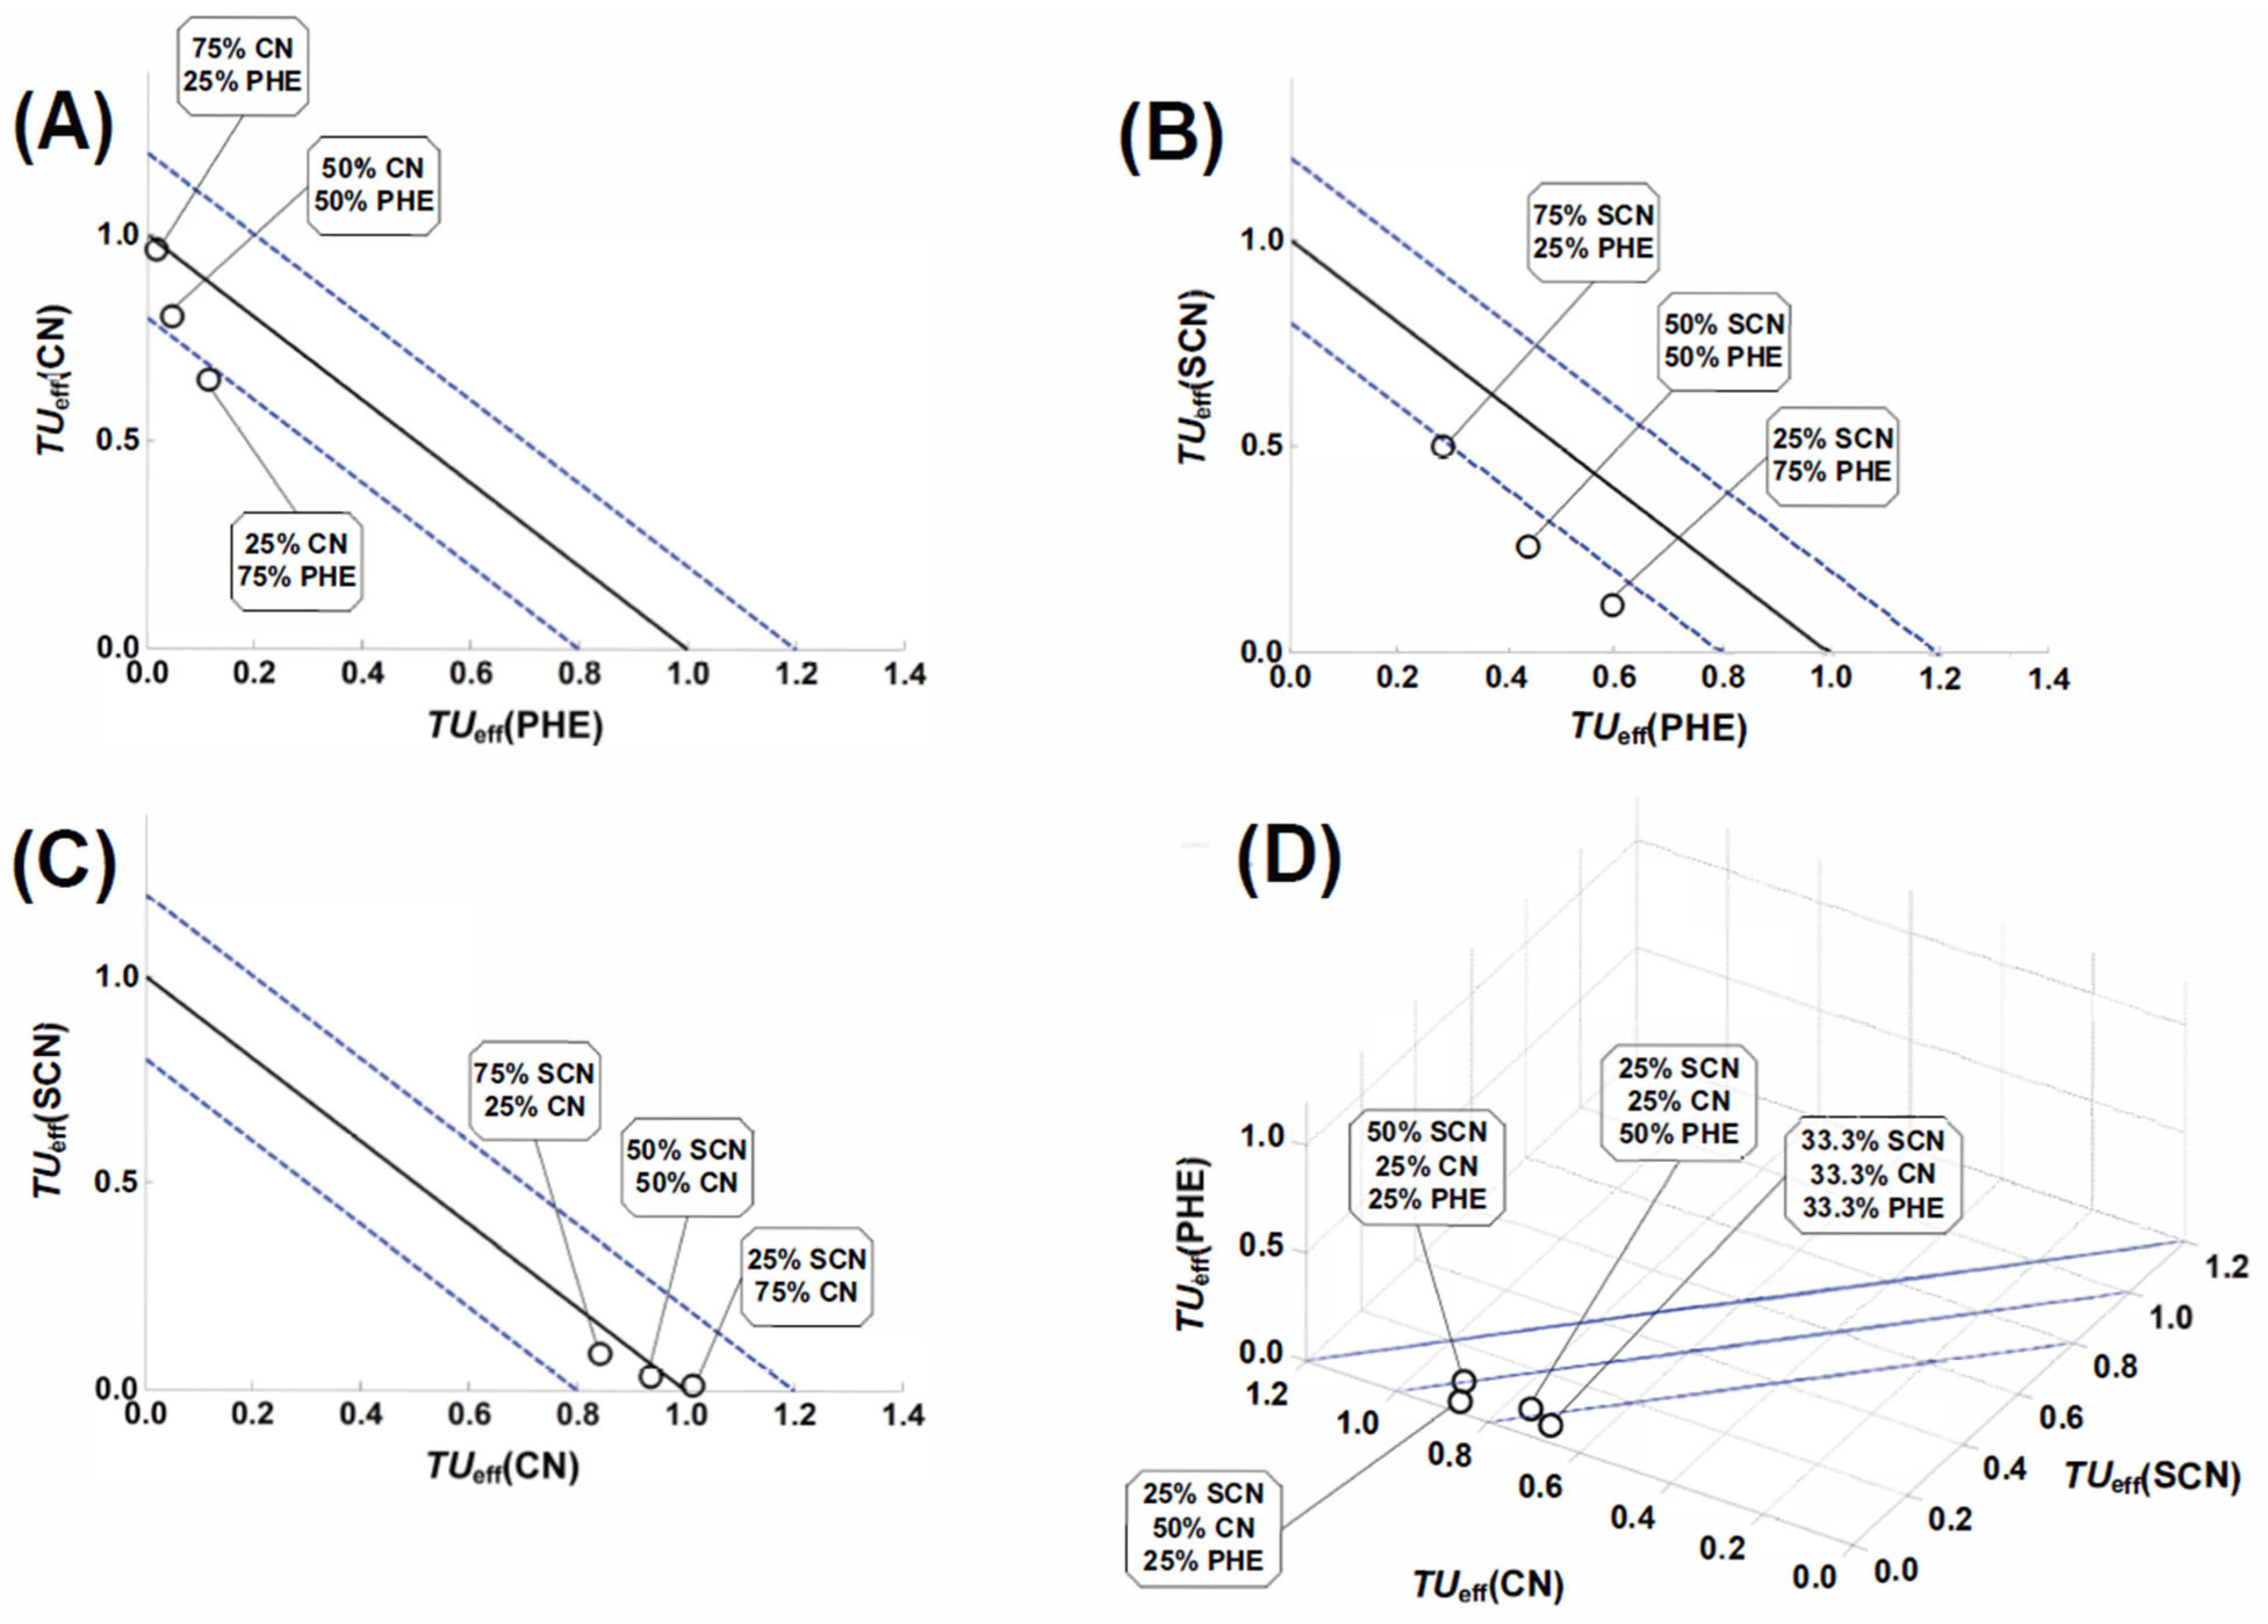
3.4. Joint Toxic Activity

Given that countless combinations of toxic substances are possible in the environment, the risk assessment for aquatic mixtures is usually based on data on the toxicity of mixtures, which are assessed using mathematical models. These models assess the toxicity of aquatic mixtures based on information about the composition of these mixtures and the toxicity of the individual components of the mixture. The additive model described in Section 2.2.2 is the most commonly used model to describe the toxic behavior of mixtures. However, mixtures of chemicals, especially aquatic mixtures, generally exhibit very complex behavior, which often leads to toxic effects that are more (synergism) or less (antagonism) pronounced than expected, i.e., estimated by a model [1,51]. Therefore, any additional information on possible synergistic and antagonistic deviations from the expected behavior is extremely important for adequate risk assessment.
This chapter presents the results of the analysis of the joint toxic action of phenol, cyanide, and thiocyanate in aqueous solutions. The experimentally determined toxicity values of binary and ternary combinations of selected toxicants were compared with those predicted by the additive model, since the additive model was selected as the reference model for the toxic behavior of mixtures. Experimental toxicity data were obtained using the Aliivibrio fischeri test. The parameters of the dose–response relation and toxicity values for the individual toxicants are shown in Table 4, while the corresponding values for binary and ternary mixtures are shown in Table 5.
By implementing the data on the composition of the solutions and the experimentally determined toxicity values (from Table 4 and Table 5) in the additive model, the isobolograms of binary and ternary mixtures shown in Figure 4 were constructed. The line connecting the points (0, 1) and (1, 0) for binary mixtures (Figure 4A–C) represents the behavior according to the additive model, i.e., the function represented by Equation (11); this line is referred to as the additive isobole.
i T U i = 1
In the case of ternary mixtures (Figure 4D), the model of additive behavior is represented by a plane connecting the points (0, 0, 1), (0, 1, 0), and (1, 0, 0). To better visualize the positioning of the TU points, the viewing angle for Figure 4D is set so that the planes are only visible in a cross-section, i.e., as lines. In general, the TU points below the additive line/plane indicate synergistic behavior, while those above the line/plane indicate antagonistic behavior. Knowing that the determination of toxicity is subject to some random error, we have chosen a prediction interval of ±20% (the range bounded by isoboles 0.8 and 1.2) to increase confidence in our conclusions.
For the combination of phenol and cyanide (Figure 4A), it can be seen that the TU points are influenced by the dominant toxicity of cyanide (see Table 4), as they are relatively close to the cyanide axis (in this case, it is the ordinate). All three TU points are below the additive isobole, but the points relating to mixtures in which cyanide accounts for 50 and 75% of the total toxicant concentration are within the prediction interval of 0.8–1.2. However, looking at the position of the TU point of the mixture with 25% cyanide, which is below the isobole of 0.8, it is easy to see that there is a trend where the TU points should continue to be outside the interval of 0.8–1.2 if the phenol content is further increased. This indicates a synergistic action of these two toxicants that is partially masked by the dominant toxicity of cyanide. The synergistic action is also detectable with the combination of phenol and thiocyanate, but the situation is much more obvious in this case (Figure 4B): due to the even toxicity of phenol and thiocyanate, there is no positioning of TU points near the abscissa or ordinate and all three mixtures resulted in TU points below the isobole of 0.8. For the solutions in which we combined cyanide and thiocyanate (Figure 4C), the dominant toxicity of cyanide again led to a positioning of the TU points relatively close to the cyanide axis (in this case, it is the abscissa). However, no deviation from additivity can be seen, as all three points are within the selected prediction interval; moreover, they are in close proximity to the additive isobole. The lack of deviation from additivity indicates potentially similar mechanisms of toxic action of these two toxicants.
Analysis of the behavior of the ternary mixtures showed no additional increase in synergisms (Figure 4D). The tendency of the positioning of the TU points was more or less the same as for the binary mixtures. Again, the dominant influence of cyanide toxicity compared to phenol and thiocyanate toxicity is seen in the positioning of the TU points close to the cyanide axis. All four mixtures resulted in TU points below the additivity plane. The TU points of the mixtures with lower phenol content (25%) are closer to the additivity plane, while the points corresponding to somewhat higher phenol contents (33.3% and 50%) are in close proximity to the isobolic plane 0.8: one point inside and one outside the prediction interval. This once again indicates a synergistic action in phenol-containing solutions, which is partially masked at lower phenol contents, most likely also due to the dominant toxicity of cyanide.

4. Conclusions

The ecotoxicity of phenols, cyanides, and thiocyanates was assessed using a diverse set of bioassays. These included luminescence inhibition with Aliivibrio fischeri, growth inhibition with Pseudomonas putida and Chlorella sp., a series of assays with Lemna minor targeting frond and root growth as well as chlorophyll a formation, and a seedling growth test using Allium cepa.
In the Lemna minor assays, phenol induced visible chlorosis and significantly reduced chlorophyll a content, yet simultaneously stimulated both frond and root development, pointing to a potential metabolic adaptation. On the other hand, cyanide and thiocyanate demonstrated consistent toxicity across all measured parameters, with cyanide showing the strongest inhibitory effects, especially on root and frond growth.
Among the applied assays, Aliivibrio fischeri and Allium cepa exhibited the highest sensitivity to the tested compounds. However, the test with Allium cepa had serious drawbacks as it was time-consuming and suffered from a high classification of inhibition values due to a relatively low number of germinated individuals in the blank sample. The tests involving Pseudomonas putida and Chlorella sp., conducted over the same exposure period, revealed comparable sensitivity levels.
When comparing the toxicants, cyanide was generally the most harmful across all tests. Phenol exhibited either similar or slightly higher toxicity than thiocyanate, depending on the assay. Overall, most of these tests showed a clear negative effect of the selected toxicants, which underlines the importance of assessing the risk of the presence of these substances in the aquatic environment.
In addition to the toxicity of the individual toxicants, their joint toxic action was also analyzed. For this purpose, the experimentally determined toxicities of binary and ternary mixtures (according to the Aliivibrio fischeri test) were compared with the toxicities predicted by the additive model. Isobolographic analysis showed a synergistic deviation from additivity for solutions in which phenol was combined with cyanide. A higher content of cyanide (as a significantly more toxic component) masked the synergism by bringing the toxicity of the mixtures closer to that of the cyanide solution, thus positioning two of the mixtures (i.e., two TU points) within the predefined additivity interval of ±20%. However, when all three mixtures are considered together, a deviation from the additivity interval with a clear tendency towards synergistic behavior can be seen. The synergistic deviation from additivity was more pronounced in the solutions where phenol was combined with thiocyanate, as all three TU points were below the additivity interval. In addition, cyanide and thiocyanate showed additive behavior, indicating that they have a very similar toxic mode of action. The ternary mixtures did not differ significantly from the behavior of the binary mixtures. The presence of a synergistic deviation from additivity, as observed in the case of Aliivibrio fischeri, increases the likelihood of such a scenario in the case of other organisms. Therefore, this should be seriously considered when assessing ecological risks in real-life scenarios.
Based on the ecotoxicological data obtained, the selection of appropriate treatment strategies should be tailored to the specific physicochemical properties of the pollutants and the nature of their interactions. For phenolic compounds, biological treatment technologies, such as activated sludge systems and membrane bioreactors, have demonstrated high efficacy due to the biodegradability of these substances. In contrast, cyanides and thiocyanates, owing to their pronounced toxicity and limited biodegradability, often necessitate advanced chemical oxidation techniques, including alkaline chlorination, ozonation, or other advanced oxidation processes (AOPs). In many cases, the integration of biological and chemical treatments within hybrid systems may offer the most robust and efficient approach. Special consideration should be given to pollutant mixtures, where synergistic interactions may enhance overall toxicity and simultaneously compromise treatment performance.
Future research should prioritize the development of integrated, multi-barrier treatment solutions that are capable of addressing complex, multi-component industrial effluents. This includes advancing early-warning monitoring systems for the detection of combined effects, as well as improving the mechanistic understanding of the sublethal and chronic impacts on aquatic organisms. A comprehensive roadmap for pollutant management should encompass (i) the design of cost-effective and scalable treatment technologies, (ii) the refinement of bioassays with improved ecological sensitivity and predictive value, and (iii) the implementation of risk assessment frameworks that explicitly consider mixture toxicity and non-additive effects.

Supplementary Materials

The following supporting information can be downloaded at https://www.mdpi.com/article/10.3390/environments12040128/s1, Table S1: Ecotoxicity of phenol to various aquatic organisms.; Table S2: Ecotoxicity of cyanide to various aquatic organisms; Table S3: Ecotoxicity of thiocyanate to various aquatic organisms.

Author Contributions

Conceptualization, D.K.G., M.C. and Š.U.; methodology, M.M. and M.C.; formal analysis, A.T.; investigation, A.T.; writing—original draft preparation, A.T.; writing—review and editing, D.K.G., M.M. and Š.U.; visualization, A.T. and Š.U. All authors have read and agreed to the published version of the manuscript.

Funding

This research received no external funding.

Data Availability Statement

Data are contained within the article.

Conflicts of Interest

The authors declare no conflicts of interest.

Abbreviations

The following abbreviations are used in this manuscript:
ATPAdenosine triphosphate
BATBest Available Technique
CFUColony-forming units
CNCyanide
COColorado
ECEffective concentration, i.e., toxicity
INHInhibition
ISOInternational Organization for Standardization
OECDOrganisation for Economic Co-operation and Development
PHEPhenol
MAMassachusetts
SCNThiocyanate
TUToxicity unit
USAUnited States of America
WAWashington

References

  1. Gaur, V.; Mathur, A. Determination of LC50 of phenolic compounds (phenol & m-cresol) for a fish, Labeo rohita. Int. J. Med. Lab. Res. 2019, 4, 55–63. [Google Scholar] [CrossRef]
  2. Tutić, A.; Miloloža, M.; Cvetnić, M.; Martinjak, V.; Furač, L.; Markić, M.; Ukić, Š.; Bolanča, T.; Kučić Grgić, D. An Overview of Coking Wastewater Characteristics and Treatment Technologies. Kem. Ind. 2023, 75, 349–358. [Google Scholar] [CrossRef]
  3. Singh, N.; Balomajumder, C. Simultaneous removal of phenol and cyanide from aqueous solution by adsorption onto surface modified activated caFrbon prepared from coconut shell. J. Water Process Eng. 2016, 9, 233–245. [Google Scholar] [CrossRef]
  4. Singh, H.; Mishra, B.K. Degradation of cyanide, aniline and phenol in pre-treated coke oven wastewater by peroxide assisted electro-oxidation process. Water Sci. Technol. 2018, 78, 2214–2227. [Google Scholar] [CrossRef]
  5. United States Environmental Protection Agency. Priority Pollutant List. 2014. Available online: https://www.epa.gov/sites/default/files/2015-09/documents/priority-pollutant-list-epa.pdf (accessed on 8 January 2025).
  6. Kim, Y.M. Acclimatization of communities of ammonia oxidizing bacteria to seasonal changes in optimal conditions in a coke wastewater treatment plant. Bioresour. Technol. 2013, 147, 627–631. [Google Scholar] [CrossRef] [PubMed]
  7. Mondal, A.; Sarkar, A.; Nair, U.G. Comparative characterization of cyanide-containing steel industrial wastewater. Water Sci. Technol. 2021, 83, 322–330. [Google Scholar] [CrossRef] [PubMed]
  8. Papadimitriou, C.A.; Samaras, P.; Sakellaropoulos, G.P. Comparative study of phenol and cyanide containing wastewater in CSTR and SBR activated sludge reactors. Bioresour. Technol. 2009, 100, 31–37. [Google Scholar] [CrossRef]
  9. Marañón, E.; Vázquez, I.; Rodríguez, J.; Castrillón, L.; Fernández, Y. Coke wastewater treatment by a three-step activated sludge system. Water. Air Soil Pollut. 2008, 192, 155–164. [Google Scholar] [CrossRef]
  10. Melcer, H.; Nutt, S.G. Nitrogen Control of Complex Industrial Wastewaters. J. Environ. Eng. 1988, 114, 166–178. [Google Scholar] [CrossRef]
  11. Barton, P.J.; Hammer, C.A.; Kennedy, D.C. Analysis of Cyanides in Coke Plant Wastewater Effluents. J. Water Pollut. Cont. Fed. 1978, 50, 234–239. [Google Scholar]
  12. European Commission. Best Available Techniques (BAT) Reference Document for Common Waste Water and Waste Gas Treatment/Management Systems in the Chemical Sector. Available online: https://eippcb.jrc.ec.europa.eu/sites/default/files/2019-11/CWW_Bref_2016_published.pdf (accessed on 7 April 2025).
  13. Bargieł, P.; Zabochnicka-Świątek, M.; Wolski, P. Treatment of Coking Wastewater Using Sorption Processes. J. Ecol. Eng. 2022, 23, 43–47. [Google Scholar] [CrossRef] [PubMed]
  14. National Center for Biotechnology Information. PubChem Compound Summary for CID 996, Phenol. Available online: https://pubchem.ncbi.nlm.nih.gov/compound/Phenol (accessed on 7 January 2025).
  15. Park, J.S.; Brown, M.T.; Han, T. Phenol toxicity to the aquatic macrophyte Lemna paucicostata. Aquat. Toxicol. 2012, 106–107, 182–188. [Google Scholar] [CrossRef] [PubMed]
  16. Bousselma, A.; Abdessemed, D.; Tahraoui, H.; Zedame, F.; Amrane, A. Polyphenols and Flavonoids Contents of Fresh and Dried Apricots Extracted by Cold Soaking and Ultrasound-assisted Extraction. Kem. Ind. 2023, 72, 161–168. [Google Scholar] [CrossRef]
  17. Pavithra, K.G.; Sundar Rajan, P.S.; Arun, J.; Brindhadevi, K.; Le, Q.H.; Pugazhendhi, A. A review on recent advancements in extraction, removal and recovery of phenols from phenolic wastewater: Challenges and future outlook. Environ. Res. 2023, 237, 117005. [Google Scholar] [CrossRef] [PubMed]
  18. Bezverbna, O.; Załęska-Radziwiłł, M. Ecotoxicological evaluation the effects of the safe concentration of wastewater containing phenol on aquatic ecosystems. J. Environ. Eng. Landsc. Manag. 2017, 26, 57–63. [Google Scholar] [CrossRef]
  19. Ramos, R.L.; Martins, M.F.; Lebron, Y.A.R.; Moreira, V.R.; Reis, B.G.; Grossi, L.B.; Amaral, M.C.S. Membrane distillation process for phenolic compounds removal from surface water. J. Environ. Chem. Eng. 2021, 9, 105588. [Google Scholar] [CrossRef]
  20. Shehi, A.; Shpati, K.; Dama, A.; Myrtaj, B.; Nuro, A. Determination of phenol levels in some surface water ecosystems of Tirana Area, Albania. J. Ecol. Eng. 2025, 26, 48–55. [Google Scholar] [CrossRef]
  21. Perrin, D.D. Dissociation constants of inorganic acids and bases in aqueous solution. Pure Appl. Chem. 1969, 20, 133–236. [Google Scholar] [CrossRef]
  22. Šoljić, Z. Kvalitativna Kemijska Analiza Anaorganskih Tvari; Fakultet kemijskog inženjerstva i tehnologije & Hinus: Zagreb, Croatia, 2005. [Google Scholar]
  23. Xylem Lab Solutions. Cyanide Analysis Guide; OI Analytical: Yellow Springs, OH, USA, 2023; Available online: https://www.ysi.com/file%20library/documents/brochures%20and%20catalogs/2968-03-xylem-cyanide-guide---web.pdf?srsltid=AfmBOopLExlZeag09iMJp7qffSIFrwJ9ZEd5cKxE8HIDOsCYvlb5GTWf (accessed on 7 January 2025).
  24. Ibnul, N.K.; Russell, J.; Dennen, K.; Tripp, C.P. Quantification of free and weakly bound cyanide in water using infrared spectroscopy. Talanta 2024, 266, 124939. [Google Scholar] [CrossRef]
  25. Sehrawat, A.; Sindhu, S.S.; Glick, B.R. Hydrogen cyanide production by soil bacteria: Biological control of pests and promotion of plant growth in sustainable agriculture. Pedosphere 2022, 32, 15–38. [Google Scholar] [CrossRef]
  26. Ward, E.W.B.; Lebeau, J.B. Autolytic production of hydrogen cyanide by certain snow mold fungi. Can. J. Bot. 1962, 40, 85–88. [Google Scholar] [CrossRef]
  27. Aranguri-Llerena, G.; Siche, R. Superior Plants with Significant Amounts of Cyanide and Their Toxicological Implications. Rev. Agric. Sci. 2020, 8, 354–366. [Google Scholar] [CrossRef]
  28. Liu, Q.; Zhang, G.; Ding, J.; Zou, H.; Shi, H.; Huang, C. Evaluation of the Removal of Potassium Cyanide and its Toxicity in Green Algae (Chlorella vulgaris). Bull. Environ. Contam. Toxicol. 2017, 100, 228–233. [Google Scholar] [CrossRef]
  29. Ryu, B.G.; Kim, J.; Yoo, G.; Lim, J.T.; Kim, W.; Han, J.I. Microalgae-mediated simultaneous treatment of toxic thiocyanate and production of biodiesel. Bioresour. Technol. 2014, 158, 166–173. [Google Scholar] [CrossRef]
  30. Bhattacharya, R.; Flora, S.J.S. CHAPTER 19—Cyanide Toxicity and its Treatment. In Handbook of Toxicology of Chemical Warfare Agents; Gupta, R.C., Ed.; Academic Press: Chennai, India, 2009; pp. 255–270. [Google Scholar] [CrossRef]
  31. Marugán, J.; Bru, D.; Pablos, C.; Catalá, M. Comparative evaluation of acute toxicity by Aliivibrio fischeri and fern spore based bioassays in the follow-up of toxic chemicals degradation by photocatalysis. J. Hazard. Mater. 2012, 213–214, 117–122. [Google Scholar] [CrossRef] [PubMed]
  32. Tez, S.; Oral, R.; Kocbas, F.; Koru, E.; Turkcu, E.; Pagano, G.; Trifuoggi, M. Comparative multi-species analysis of potassium cyanide toxicity. Mar. Pollut. Bull. 2022, 182, 113965. [Google Scholar] [CrossRef] [PubMed]
  33. Ketcheson, K.; Fingas, M. Chapter 39: Sodium cyanide: Properties, toxicity, uses and environmental impacts. In The Handbook of Hazardous Materials Spills Technology; Fingas, M., Ed.; McGraw-Hill: New York, NY, USA, 2002; pp. 39.1–39.22. [Google Scholar]
  34. Hampton Research. Safety Data Sheet According to Regulation (EC) No 1907/2006; HR2-693; Version 1.5; Hampton Research: Aliso Viejo, CA, USA, 2 June 2020; Available online: https://hamptonresearch.com/uploads/support_materials/2-693_SDS_-_Sigma_251410.pdf (accessed on 10 January 2025).
  35. Sigma-Aldrich. Safety Data Sheet According to Regulation (EC) No. 1907/2006; SIGALD-207799; Version 6.7; Merck: Darmstadt, Germany, 2 June 2023; Available online: https://www.sigmaaldrich.com/HR/en/sds/sigald/207799?userType=undefined (accessed on 10 January 2025).
  36. Thermo Fisher Scientific. SAFETY DATA SHEET ALFAAA13731; Version 3, Revision Date: 7 May 2024; Thermo Fisher Scientific: Waltham, MA, USA, 2010; Available online: https://assets.thermofisher.com/DirectWebViewer/private/document.aspx?prd=ALFAAA13731~~PDF~~MTR~~CGV4~~EN~~2024-04-30%2019:10:40~~Potassium%20thiocyanate~~ (accessed on 10 January 2025).
  37. González, P.S.; Maglione, G.A.; Giordana, M.; Paisio, C.E.; Talano, M.A.; Agostini, E. Evaluation of phenol detoxification by Brassica napus hairy roots, using Allium cepa test. Environ. Sci. Pollut. Res. Int. 2012, 19, 482–491. [Google Scholar] [CrossRef] [PubMed]
  38. Levan, A.; Wangenheim, K.H. Potassium cyanide in the allium test. Hereditas 1952, 38, 297–313. [Google Scholar] [CrossRef]
  39. Kalčíková, G.; Skalar, T.; Marolt, G.; Kokalj, A.J. An environmental concentration of aged microplastics with adsorbed silver significantly affects aquatic organisms. Water Res. 2020, 175, 115644. [Google Scholar] [CrossRef]
  40. Putar, U.; Turk, K.; Jung, J.; Kim, C.; Kalčíková, G. The dual impact of tire wear microplastics on the growth and ecological interactions of duckweed Lemna minor. Environ. Pollut. 2025, 368, 125681. [Google Scholar] [CrossRef]
  41. Lichtenthaler, H.K. Chlorophylls and Carotenoids: Pigments of Photosynthetic Biomembranes. Methods Enzymol. 1987, 148, 350–382. [Google Scholar] [CrossRef]
  42. Backhaus, T.; Faust, M. Predictive environmental risk assessment of chemical mixtures: A conceptual framework. Environ. Sci. Technol. 2012, 46, 2564–2573. [Google Scholar] [CrossRef]
  43. Qin, L.-T.; Liu, S.-S.; Zhang, J.; Xiao, Q.-F. A novel model integrated concentration addition with independent action for the prediction of toxicity of multi-component mixture. Toxicology 2011, 280, 164–172. [Google Scholar] [CrossRef] [PubMed]
  44. Chen, Q.; Li, Z.; Li, Y.; Liu, M.; Wu, Y.; Chen, Z.; Zhu, B. Biodegradation of benzo[a]pyrene by a marine Chlorella vulgaris LH-1 with heterotrophic ability. Mar. Pollut. Bull. 2024, 198, 115848. [Google Scholar] [CrossRef] [PubMed]
  45. El-Naas, M.H.; Al-Muhtaseb, S.A.; Makhlouf, S. Biodegradation of phenol by Pseudomonas putida immobilized in polyvinyl alcohol (PVA) gel. J. Hazard. Mat. 2009, 164, 720–725. [Google Scholar] [CrossRef]
  46. Medić, A.B.; Karadžić, I.M. Pseudomonas in environmental bioremediation of hydrocarbons and phenolic compounds-key catabolic degradation enzymes and new analytical platforms for comprehensive investigation. World J. Microbiol. Biotechnol. 2022, 38, 165. [Google Scholar] [CrossRef]
  47. Babu, G.R.V.; Wolfram, J.H.; Chapatwala, K.D. Conversion of sodium cyanide to carbon dioxide and ammonia by immobilized cells of Pseudomonas putida. J. Ind. Microbiol. Biotechnol. 1992, 9, 235–238. [Google Scholar] [CrossRef]
  48. Dwivedi, N.; Majunder, C.B.; Mondal, P.; Dwivedi, S. Biological treatment of cyanide containing wastewater. Res. J. Chem. Sci. 2011, 7, 15–21. [Google Scholar]
  49. Shigeoka, T.; Sato, Y.; Takeda, Y.; Yoshida, K.; Yamauchi, F. Acute toxicity of chlorophenols to green algae, Selenastrum capricornutum and Chlorella vulgaris, and quantitative structure-activity relationships. Environ. Toxicol. Chem. 1988, 7, 847–854. [Google Scholar] [CrossRef]
  50. Song, Z.; Huang, G. Toxic effects of pentachlorophenol on Lemna polyrhiza. Ecotoxicol. Environ. Saf. 2007, 66, 343–347. [Google Scholar] [CrossRef]
  51. Duan, W.; Meng, F.; Cui, H.; Lin, Y.; Wang, G.; Wu, J. Ecotoxicity of phenol and cresols to aquatic organisms: A review. Ecotoxicol. Environ. Saf. 2018, 157, 441–456. [Google Scholar] [CrossRef] [PubMed]
Figure 1. Overview of treatment methods for wastewaters containing phenols, cyanides, and thiocyanates.
Environments 12 00128 g001
Figure 2. A comparison of the data on the inhibition (INH) of plant growth (blue circles), root growth (gray circles), and chlorophyll formation (red circles) for: (A) phenol, (B) cyanide, and (C) thiocyanate. The parameter log c stands for the logarithmic amounts of the molar concentrations expressed in mM.
Environments 12 00128 g002
Figure 3. Inhibition of Allium cepa growth under exposure to phenol (blue bars), cyanide (orange bars), and thiocyanate (gray bars).
Environments 12 00128 g003
Figure 4. Isobolograms of mixtures of phenol (PHE), cyanide (CN), and thiocyanate (SCN). Cases (AC) refer to binary mixtures, while case (D) refers to a ternary mixture. For each data point, the composition of the mixture is shown for ease of reference (as text within the octagon), with the values expressed as a percentage representing the proportion of each toxicant in the total concentration of 1.0000 mM (black lines-indicates additivity; blue lines synergy or antagonism).
Environments 12 00128 g004
Table 1. Basic information about phenol, cyanide, and thiocyanate.
PhenolCyanide IonThiocyanate Ion
molecular formulaC6H6OCNSCN
structureEnvironments 12 00128 i001N≡CN≡C−S
molecular weight94.11 g mol−126.02 g mol−158.08 g mol−1
Table 2. Concentration ranges of phenols, cyanides, and thiocyanates reported for various industrial effluents.
Phenols, mg L−1Cyanides, mg L−1Thiocyanates, mg L−1IndustryReference
56020056coking[4]
384–53412–24367–642coking[6]
414–6622.8–9301–542steel[7]
400–12004–15200–500coking[8]
100–22111–41198–427coking[9]
4838.2361coking[10]
250010–50100–300coking[11]
Table 3. The initial conditions for the growth inhibition tests with the bacterium Pseudomonas putida and with the microalgae Chlorella sp.
Test OrganismOptical DensityCFU/Cells mL−1pHγ (O2)/mg L−1T/°C
Pseudomonas putida0.201.9 × 1087.67.726.7
Chlorella sp.0.023.6 × 1058.27.924.4
Table 4. The results of the toxicity tests for phenol, cyanide, and thiocyanate: The data show the parameters of the linearized dose–response curves and the corresponding toxicity values. The concentration values expressed in mM were used to estimate the parameters of the dose–response lines.
ToxicantToxicity TestDurationDose–Response LineToxicity Values
InterceptSlopeR2EC20/mM (mg L–1)EC50/mM (mg L–1)
PhenolAliivibrio fischeri30 min0.7701.7460.99830.1638 (15.41)0.3621 (34.08)
Pseudomonas putida72 h–0.3310.7410.98770.4314 (40.60)2.7984 (263.36) *
Chlorella sp.72 h–0.3001.0400.99190.5123 (48.21)1.9415 (182.71) *
Lemna minor7 dn.d.n.d.n.d.n.d.n.d.
Allium cepa21 d1.2751.0001.00000.0133 (1.25)0.0531 (5.00)
CyanideAliivibrio fischeri30 min1.8031.0790.99560.0059 (0.15)0.0214 (0.56)
Pseudomonas putida72 h–0.0560.7760.98090.1982 (5.16)1.1808 (30.72)
Chlorella sp.72 h0.01640.7750.97970.1593 (4.14)0.9526 (24.79)
Lemna minor7 d0.4790.4730.92340.0052 (0.14) *0.0972 (2.53)
Allium cepa21 dn.d.n.d.n.d.<0.0384 (<1.00)<0.0384 (<1.00)
ThiocyanateAliivibrio fischeri30 min0.2211.0450.99280.1632 (9.48)0.6150 (35.72)
Pseudomonas putida72 h–0.6581.0360.94411.1315 (65.72)4.3111 (250.39) *
Chlorella sp.72 h–0.3761.3010.99090.6705 (38.94)1.9458 (113.01)
Lemna minor7 d–0.6410.7100.93861.1338 (65.85)7.9801 (463.48) *
Allium cepa21 d0.4511.2650.94560.1470 (8.54)0.4397 (25.54)
n.d.—not determined; *—values estimated by data extrapolation.
Table 5. The results of the Aliivibrio fischeri toxicity test for binary and ternary mixtures of phenol, cyanide, and thiocyanate: The data show the parameters of the linearized dose–response curves and the corresponding EC50 values. The concentration values expressed in mM were used to estimate the parameters of the dose–response lines.
CombinationMixture RatioInterceptSlopeR2EC50/mM
phenol and cyanide25:751.5791.2590.99530.0557
50:501.6761.1450.99380.0344
75:251.7421.1170.99720.0275
phenol and thiocyanate25:750.7451.3760.99550.2875
50:500.6021.2130.99730.3188
75:250.4531.1760.99470.4120
cyanide and thiocyanate25:751.7441.1320.99750.0288
50:501.4811.0590.99710.0400
75:251.1891.0400.99530.0719
phenol and cyanide and thiocyanate25:25:501.9721.7630.99670.0619
25:50:252.1731.5210.99350.0151
50:25:251.9631.6210.99630.0250
33.3:33.3:33.31.8111.3300.99720.0236
Disclaimer/Publisher’s Note: The statements, opinions and data contained in all publications are solely those of the individual author(s) and contributor(s) and not of MDPI and/or the editor(s). MDPI and/or the editor(s) disclaim responsibility for any injury to people or property resulting from any ideas, methods, instructions or products referred to in the content.

