Abstract
The SORGENTINA-RF project aims at developing a 14 MeV fusion neutron source featuring an emission rate in the order of 5–7 × 10 s. The plant relies on a metallic water-cooled rotating target and a deuterium (50%) and tritium (50%) ion beam. Beyond the main focus of medical radioisotope production, the source may represent a multi-purpose neutron facility by implementing a series of neutron-based techniques. Among the different engineering and technological issues to be addressed, the production of incondensable gases and corrosion product into the rotating target deserves a dedicated investigation. In this study, a preliminary analysis is carried out, considering the general layout of the target and the present choice of the target material.
1. Introduction
SORGENTINA-RF is a project aiming at developing a high-intensity 14 MeV fusion neutron source featuring an expected power of about 250 kW provided by an 883 mA D-T ion beam impinging on a Ti-coated aluminum rotating target. The reader is referred to Ref. [1] for a schematic description of the plant. This configuration is supposed to yield a neutron emission rate of about 5–7 × 10 s. Among the different tasks and teams working on the design of the different components, a series of preliminary studies are presently carried out to address some important issues. Among these, the ones related to the main component of the plant, e.g., the rotating target, are worthy of investigation. As explained in Ref. [1], the rotating target at this stage is foreseen to be composed of aluminum (the suitable alloy is still subject to refinement) and it is cooled by water, resembling the behavior of a heat pipe. Under ion beam irradiation and consequent neutron and -ray production, the formation of incondensable gases and corrosion products induced by water radiolysis is a possibility [2,3,4,5]. These chemical species may jeopardize the effective operation of the target in heat removal. Thus, the effect of radiolysis, although in a preliminary target configuration (geometry and material), is useful to carry out to provide a first evaluation of the quantity of incondensable gases and corrosive radicals that may be produced. To this aim, a first quantitative figure was obtained from previous studies on the cooling water of the first wall of ITER [6], where an estimation of the incondensable gas (mostly hydrogen) and corrosive species was carried out on a very general ground and, for this reason, scalable to our system, at least to provide an order of magnitude.
After that, a series of numerical simulations were carried out to better understand the time-evolution of concentration profiles of main molecules, ions, and radicals under work conditions.
2. Materials and Methods
A recent model on the mechanism of water radiolysis, proposed by Sxiatla-Wojcik and Buxton [7], divides the radiolysis process mainly into three steps: physical, physicochemical, and chemical stages (Figure 1).
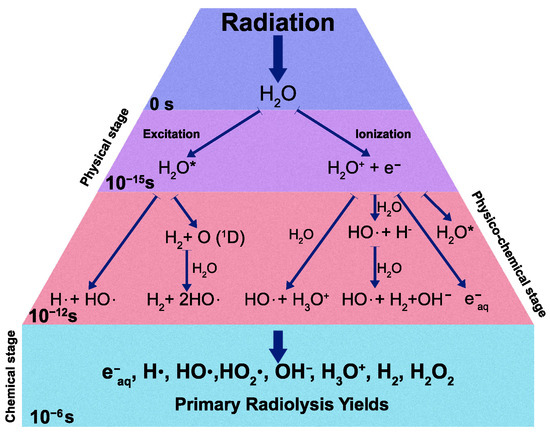
Figure 1.
Schematic diagram of water radiolysis process.
After the initial interaction with the radiation, the water molecule HO can be either ionized or excited in the so-called physical stage, resulting in the generation of excited water molecules (HO), ionized water molecules (HO), and sub-excitation electrons e. The physicochemical stage takes place from to s, in which the ionized and excited water molecules undergo transformations and dissipate energy by transferring it to other molecules and breaking bonds. Many other different processes occur in this stage and not all of them have been well characterized experimentally. In the chemical stage ( and s), the radical species react with each other and also with surrounding molecules and then diffuse in solution. All the species which have been produced after these three stages are called “primary products” of radiolysis. The rate at which each ith radiolytic species is produced is given by [8]:
where G and G are the radiolytic yields for neutrons and gamma photons, respectively, expressed in terms of G-values, is Avogadro’s number, F is a conversion factor, is the water density, and DR and DR are the energy dose rates for gamma photon and neutron, respectively. However, each ith radiolytic species is involved in several chemical reactions; thus, its concentrations will be related to their reaction rates. If we consider a generic reaction that produces i-th species with a rate constant and a generic reaction that consumes i with a rate constant , where m, l, i, and j represent different species in water radiolysis,
the net reaction rate is
If fluid convection is supposed to not affect the concentration, then the total rate of the ith radiolysis species production is
By solving the system of equations generated by Equation (3), the concentrations of each species at different times and at any point of the system can be calculated (see Supporting Material for more details, Table S1).
To perform these calculations, we employed a Python routine for homogeneous aqueous chemical reaction analysis [9] and a simplified kinetic model developed by B.G. Ershov et al. [10]. The model is composed of a set of 32 reactions occurring in pure water and aqueous solutions of H, HO, and O and providing an adequate description of the radiation chemical decomposition in the pH from 1 to 10 (see Table 1). This approach refers to the so-called “homogeneous” stage of radiolysis, which starts about 10 s after the action of ionizing radiation. At this stage, a uniform distribution of radicals, ions, and molecules can be assumed and the main chemical reactions involved in the radiolysis of water and dilute aqueous solutions take place. Rates for each reaction were determined in the model by assuming elementary reaction rates and a water activity of 1.

Table 1.
Reactions, rate constants, and activation energies used in the model (adapted from [10]).
The input data for the model are temperature, dose rate, initial concentrations, and G-values. Because of the geometry of the system, and relying on a series of preliminary thermofluidodymanics calculations [11], it is possible to consider that the water is subjected to constant irradiation at a temperature of 60 °C. The main components of ionizing radiation during operation are 14 MeV neutron and gamma radiation, with dose rates constant over simulation time of about 0.74878 Gy/s and 0.04148 Gy/s, respectively. Neutron and photon dose on water were calculated with MCNP 5 [12] Monte Carlo Code. FENDL 3.1 [13] and MCPLIB04 [14] were used for neutron and photon transport, respectively. The MCNP model, reported in Figure 2, represents a simplified scheme of SORGENTINA neutron source with a 50 cm radius wheel with 5 mm thick Al walls, filled with a 12 cm thick external circular crown of water. The bunker hall is represented by 50 cm thick standard concrete walls placed at about 1 m from the wheel. The neutron source is represented by an isotropic and mono-energetic 14 MeV source, starting from a 5 cm radius disk, placed at the external part of the wheel. Energy deposition tallies (f6) were used to calculate the dose in water, normalized at an average neutron yield of 1 × 10 n/s.
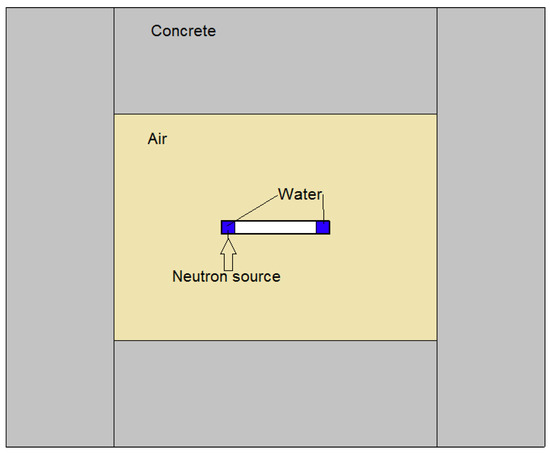
Figure 2.
Simplified scheme of SORGENTINA neutron source.
Thus, the well-established G-values used for water radiolysis in ITER [8] can be used (Table 2).
Table 2.
The G-values (molecules/100 eV) of primary species for 14 MeV neutrons and gamma radiation deposited in water at 60 °C.
Since the rate constant, , is a function of the coolant temperature, the actual rate constant for each chemical reaction was calculated using Arrhenius’ law and other experimentally derived relationships [15]. In line with the target design [1] a, pressure value of 0.3 bar (which determines the water density) and three different initial pH (6.5, 7, 7.5) were chosen to perform the simulations. Although the coolant should have a pH value of about 7, its surrounding values were investigated to take into account possible unwanted pH alteration. These conditions were simulated by setting an appropriate initial amount of H and OH. The conditions assumed for the simulation are summarized in Table 3.
Table 3.
Conditions assumed for simulation.
3. Results and Discussion
3.1. A Simplified Model Calculation
A rough estimation of the effect of the radiolysis of the target’s cooling water due to its interaction with neutron and gamma radiation was performed (refer to Figure 3) which represents the steady-state situation of the rotating target.
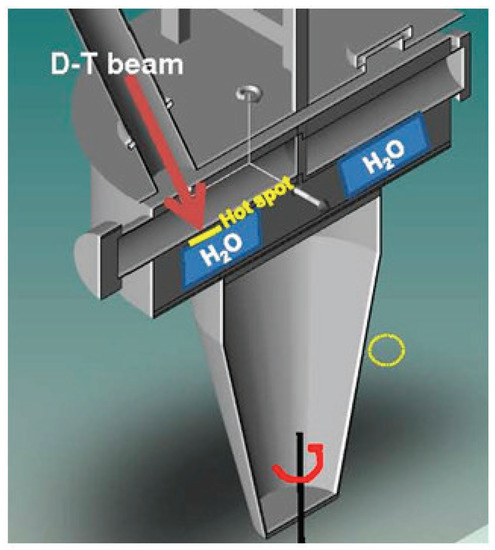
Figure 3.
Schematic 3D representation of the rotating target. In operation, the cooling water is placed in the evaporator volume to extract the power load under the hot spot.
The radiolysis process is described by:
The radiation field during plant operation is typically determined by (1) neutron field composed of two components: the “direct” beam due to the neutrons emitted by the “hot spot” area and by the diffuse component due to the neutrons which, scattered from all structural materials and from bioshielding materials enter into the volume where the cooling water is contained; (2) gamma radiation field due to both “prompt” processes and those due to the activation of materials following neutron irradiation. Together with these “beam on” processes, gamma radiation is also present during “beam off” for a time interval depending on the half lives of the radionuclides generated by neutron irradiation and with an intensity determined by the overall activation of the materials. A quantitative estimate of the neutron and gamma fields in the evaporator component of the target can only be obtained with a numerical calculation which, however, requires definitive geometry and materials that constitute the neutron source and the bioshielding that are under definition at present. A first rough estimate can be made, taking as input data derived from a study performed to calculate the effect of the radiolysis of the water in the cooling system of the integrated first wall blanket edge localized mode and vertical stabilization coil divertor primary heat transport system (IBED-PHTS) [6]. A simplified model is schematically represented in Figure 4.
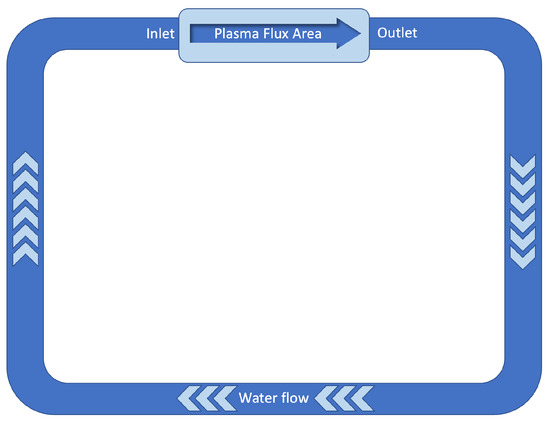
Figure 4.
Schematic representation of the ITER’s IBED PHTS. Data from [6].
Figure 5 describes the kinetics of the molar concentration (mol L) production of the various species generated as a function of time due to radiolysis induced by neutron and gamma fields interacting with the cooling water, which is at an average temperature of about 98 C during the operation. The concentration of the species generated by radiolysis depends on the energy deposited by the neutron and gamma flux which at the first ITER wall is expected to be 10 cm s.
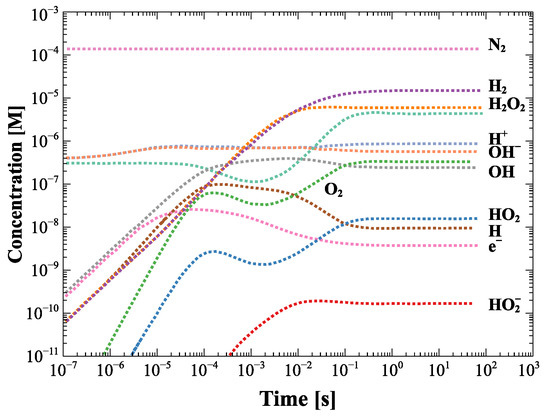
Figure 5.
Concentration of radiolysis species in the single module as a function of time with no initial hydrogen addition. Data from [6].
If we consider the operating conditions of SORGENTINA, which provide for a neutron emission rate Y = 5–7 × 10 s, and referring to Figure 3, where the quantity of water is of the order of ten (or a few tens) of liters, the molar concentration of H and other species can be scaled in a very first approximation with the expected flux in the evaporator volume where cooling water circulates in operation conditions. Considering for simplicity the area below the hot spot (with a diameter of 10–12 cm) and a height of 10 cm, the volume of water is in the order of 1 L. Considering a maximum neutron flux in the order of 10 cm s to maximize the effect), the concentration of H, for example, is of the order of 10 M (referring to the graph in Figure 5) at the steady state. In this hyper-simplified treatment of the problem, the differences due to the thermodynamic conditions of the water were not taken into account in the case that IBED-PHTS water is at a temperature of 70 C and at a pressure of 4 MPa at the inlet to the various modules (average T operating temperature: 98 C), while under the hot spot of Figure 3 there is a phase transition that occurs below 100 C considering that the average operating pressure is of the order of 0.3 bar in operation conditions. If we consider that the effect of p and T does not cause a variation of the order of magnitude, the estimate of 10 M can be considered as reasonable, within the approximations used. The volume occupied in the thermodynamic operating conditions of SORGENTINA are of the order of 2 L and are therefore absolutely negligible at steady state, as compared to the volume of the rotating target. This should not affect its operation based on the continuous circulation of the steam generated in the phase transition due to the absorption of the thermal power due to the ion beam impinging on the rotating target. It is worth highlighting that in this very simplified and conservative calculation, the radiolysis products scale with the neutron flux (assuming that also the gamma radiation is proportional to the neutron field intensity) and the chemical properties of the SORGENTINA’s cooling water are supposed to be similar to those of the IBED-PHTS system.
3.2. Refined Model Numerical Simulations
Numerical integration of differential kinetic equations (Equation (3)) provides the time-dependent profiles describing how concentrations of the radiolysis products vary with the exposure time approaching equilibrium. Although the method was successfully developed and validated by Bartels et al. [16], and G-values, reactions, and their rate constants have been well established by many researchers, we further verified the validity of the calculation model by comparing the simulation result with the experimental data of Yakabuskie et al. [17], as shown in Figure 6.
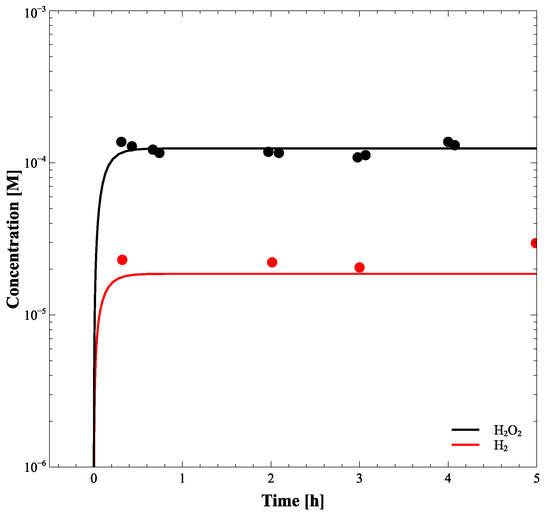
Figure 6.
[H] and [HO] during 6 h radiation at a dose rate of 2.5 Gy/s. The solid symbols represent the experimental data and the lines show the radiolysis model results.
To better understand how possible pH alteration could affect the different equilibria involving the radiolysis products, the same simulations were carried out by changing the starting pH value from 6.5 to 7.5.
The concentrations of main radicals and stable species for water with an initial pH of 6.5 are shown in Figure 7. Note that a solution with a pH of 6.5 is slightly acid at room temperature, but at 60 °C this value corresponds to the neutral pH.
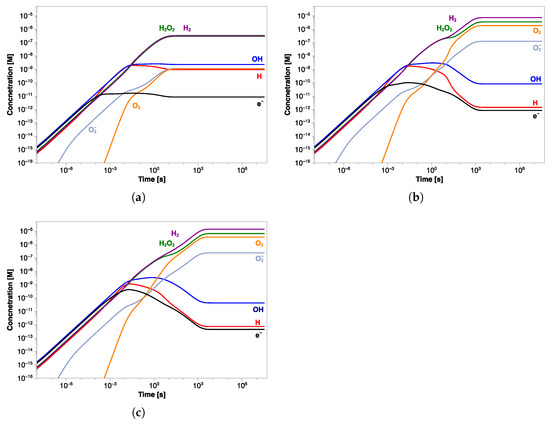
Figure 7.
Concentration profiles of the main radiolytic products as a function of exposure time at pH (a) 6.5, (b) 7, and (c) 7.5.
It is possible to see how the steady-state concentration is reached at about 10 s, and H and HO are in larger excess (∼0.3 µM), compared to the other radiolysis products, by at least two orders of magnitude. The concentrations of HO and HO radicals are negligible throughout the simulation time, while the pH of water increases by about 0.2 units (Table 4). The OH· radicals produced mainly in reactions (11) and (18) (Table 1) are consumed almost equally in both reactions (1) and (3) due to their similar rate constants. This results in nearly equal concentrations of generated H and HO. The steady-state concentrations of the main radiolysis products are summarized in Table 4.
Table 4.
Concentrations of main species after 1 year of constant radiation at pH 6.5, 7, and 7.5.
Starting with a pH value of 7 (Figure 7b), the concentration profiles change, resulting in an increase of H and HO to 7.32 µM and 3.48 µM, respectively. Except for OH· and H· radicals, the other species show higher concentrations than those observed at pH of 6.5, although HO and HO are, again, negligible (Table 4). Unlike the previous simulation, the steady state is reached after a longer time (about 10 s), and the oxygen concentration grows by three orders of magnitude. Similar results were obtained in the simulation at pH 7.5, in which the same trend in the concentration profiles was observed (Figure 7c). In this case also, the steady-state concentration is reached in about 10 s of irradiation, after which H and HO further increase to 13.4 µM and 6.52 µM, respectively (Table 4). As in the previous simulation, the oxygen reaches micromolar concentrations while the pH value increases by about 0.3 units. A comparison between the concentration profiles of different radiolysis products calculated in the three simulations is shown in Figure 8a. It is even more evident how the transition time shifts towards longer values by increasing the pH value, and the final concentration of stable molecules and ions slightly increases while that of the radicals decreases; see Figure 8b.
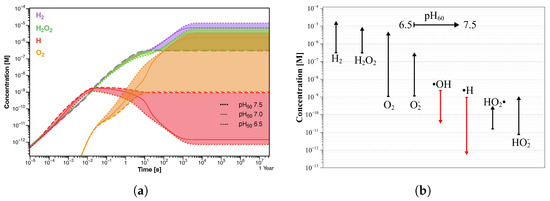
Figure 8.
(a) Concentration profiles of the main radiolysis products. The colored regions represent the concentration distributions in the initial pH range 6.5–7.5. (b) Corresponding concentration trend of the radiolysis products after 1 year of exposure.
A slight change in the pH value during the exposure was observed in all three simulations, therefore consisting of a decrease in the H concentration and simultaneous increase in OH. By observing the concentration profiles at short times, it is possible to see how almost all species seem to reach the steady state within 10 s and at the same concentrations as at pH 6.5, but their profiles start to change again at a longer time.
Since it is common to inhibit the production of the main oxidizing species, such as O, HO, and ·OH radicals, by adding an adequate amount of H, further calculations simulating a flow of hydrogen were performed. This also allows to simulate possible H production from aluminum-water reactions induced by -radiation [18,19,20]. Figure 9 refers to similar calculations in which a hydrogen flow at three different concentrations was simulated in water with pH 6.5, 7, and 7.5.
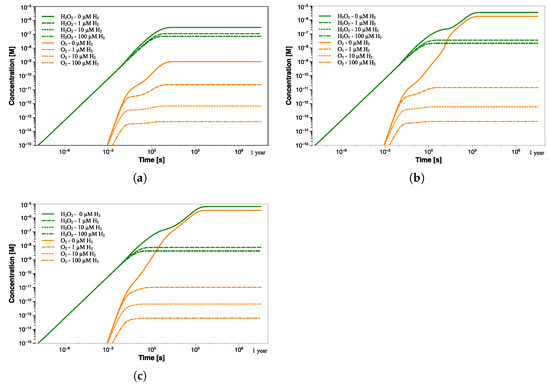
Figure 9.
HO and O concentration profiles as a function of exposure time at pH (a) 6.5, (b) 7, and (c) 7.5 with different H concentrations (0–100 µM).
These simulations allow to better understand how the H may affect the concentration of other radiolysis products, particularly the oxidizing species. In the presence of only 1 µM H (∼2 ppb), the steady-state concentration of oxygen significantly decreases by two orders of magnitude and is reached within 5 s at pH 6.5, as shown in Figure 9a. The decrease is also seen for all radiolysis species, except for the hydrogen radicals, which slightly increase due to the introduction of H (Table 5).
Table 5.
Concentrations of main species after 1 year of constant radiation at pH 6.5 with different [H].
The same trend, although to differing degrees, occurs when 10 µM H is added. Again, the steady-state concentrations are reached in shorter times as hydrogen concentration enhances. Obviously, a higher addition of H can decrease the concentration of oxidants to lower levels. However, the efficiency of H injection for suppressing oxidant production declines as the amount injected increases.
Indeed, the addition of 100 µM H no longer leads to a further decrease of HO (from 0.0736 µM to 0.0715 µM). Additionally, the oxygen suppression will become less significant in passing from 6.81 × 10 µM to 5.13 × 10 µM. The lowest H concentration at which the production of radiolysis species changes from a continuous increase to a steady state is usually referred to as the threshold hydrogen concentration (THC) [21]. In this regard, it is important to find the right compromise between suppressing the radiolysis process and limiting potential issues related to excessive H concentration. Similar results were obtained at higher pH values, as shown in Figure 9b,c. Despite the higher steady-state concentration of both HO and O (at 0 µM H), the addition of 1 µM of H reduces their concentrations to levels comparable to those achieved at pH 6.5. This behavior is even more noticeable in Figure 10a, where a comparison between the concentration trend of the main radiolytic products after 1 year of exposure at the three pH values and different [H] addition is shown. The differences in the steady-state concentrations of some species, such as O, O, ·OH, and ·H, as a function of the pH are almost nullified by the hydrogen addition. Thus, the difference of more than three orders of magnitude in the oxygen concentration due to pH differences is no longer detected when an initial flow of hydrogen is employed. Interestingly, although higher pH values induce slower reaching of the steady state when no H addition occurs, the addition of an appropriate amount of hydrogen instead promotes faster transition time (Figure 9 and Figure 10b).
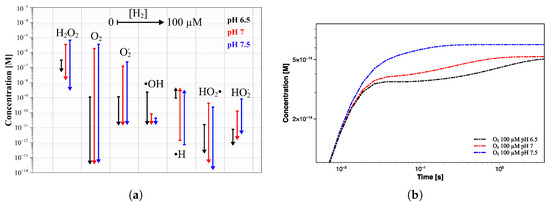
Figure 10.
(a) Concentration trend of the main radiolytic products after 1 year of exposure, as a function of hydrogen addition, at pH 6.5 (black lines), 7 (red lines), and 7.5 (blue lines). (b) Comparison between the oxygen concentration profiles at pH 6.5, 7, and 7.5 when 100 µM of hydrogen is added.
By comparing the O concentration profiles at the three different pH values, it is possible to see how, although the steady state is reached within 5 s from the beginning of the irradiation, the transition time is even lower than the second at pH 7.5. This means that the THC shifts to lower values when the pH increases, as a higher H concentration is required to reach a stable concentration of oxygen at pH values of 6.5 and 7, within this time window (<1 s). In fact, the oxygen also seems to reach the steady state at pH below 7.5, but its profile starts to rise again at a longer time, before stabilizing at about 5 s. Note that all calculations were performed by enforcing a constant concentration of H, thus suggesting the need to modulate its addition during operations to maintain that condition. Interestingly, further simulations showed how this should not be necessary, since the initial amount of H does not undergo any significant changes (maximum of 1% of the initial concentration) even after a year of work; thus, only an appropriate initial injection could be sufficient.
4. Conclusions
Preliminary radiolysis modeling was performed to evaluate the water radiolysis behaviors in SORGENTINA-RF, under exposure to 14 MeV neutron and gamma radiation at 60 °C. The simulation, carried out at three different initial pH values, showed that HO and H are the dominant radiolysis products, with concentrations in the range of 10–10 M. As pH increased, most of the radiolytic products showed growth and also needed a longer time to reach their steady state. The concentrations of ·OH and H· radicals, which are among the main oxidizing and reducing radiolytic products, respectively, drop to become negligible, contrarily to oxygen which grows to reach micromolar concentrations.
The addition of an adequate amount of H inhibits the production of the main oxidizing species, such as O, HO, and OH radicals. The results confirmed the concentration decrease of oxidants to lower levels, but the effectiveness of H injection comes down as its concentration further increases. Again, the pH of the aqueous solution affects the time to reach the steady state but, in this case, with an opposite trend to that observed without H addition. However, this difference occurs on a very short time scale compared to the operation time to be considered significant. Given the absence of differences in the steady-state concentration of the O, it is also possible to conclude that potential effects of pH alterations in the studied range are mitigated by H addition. In addition, the concentrations of O and HO radicals become negligibly small compared to HO. This is a simple consequence of the fact that it takes three ·OH radicals to produce HO, and four to produce an O molecule (Table 1). In the presence of so much H, the lifetime of ·OH radicals is significantly reduced (reaction 1), so there is little chance to produce these more highly oxidized species. These calculations will be exploited to perform corrosion tests in order to understand potential corrosion behavior of aluminum in water with the simulated composition.
In the next step, the model will be further optimized by expanding the set of potential reactions and employing G-values fine-tuned for a more defined target configuration. Other simulations will be performed to better evaluate how possible unexpected events, such as unwanted increase of oxygen concentration, or the simple shutdown for servicing, could affect the concentration profiles of the main radiolytic products.
Supplementary Materials
The following supporting information can be downloaded at: https://www.mdpi.com/article/10.3390/environments9080106/s1, Table S1: List of all simulation equations.
Author Contributions
Conceptualization, C.S. and A.P.; methodology, C.S., M.A., D.F. and A.P.; software, C.S. and D.F.; investigation, C.S. and A.P.; writing—original draft preparation, C.S. and A.P.; writing—review and editing, all authors; project administration, A.P. All authors have read and agreed to the published version of the manuscript.
Funding
This research received no external funding.
Data Availability Statement
Not applicable.
Acknowledgments
The authors acknowledge the Regione Emilia Romagna-ENEA agreement for the project “SORGENTINA RF—Thermomechanical Demonstration”.
Conflicts of Interest
The authors declare no conflict of interest.
Abbreviations
The following abbreviations are used in this manuscript:
| DR | Dose rate |
| MCNP | Monte Carlo N-Particle Transport Code |
| FENDL | Fusion Evaluated Nuclear Data Library |
| IBED PHTS | Integrated blanket edge localized mode coils and divertor primary heat transfer system |
| THC | Threshold hydrogen concentration |
References
- Pietropaolo, A.; Contessa, G.M.; Farini, M.; Fonnesu, N.; Marinari, R.; Moro, F.; Rizzo, A.; Scaglione, S.; Terranova, N.; Utili, M.; et al. SORGENTINA-RF project: Fusion neutrons for 99Mo medical radioisotope. Eur. Phys. J. Plus 2021, 136, 1140. [Google Scholar]
- Lister, D.; Uchida, S. Determining water chemistry conditions in nuclear reactor coolants. J. Nucl. Sci. Technol. 2015, 52, 451–466. [Google Scholar]
- Lorenzetto, P.; Bjergbakke, E.; Hickel, B. Water radiolysis under NET conditions. Fusion Eng. Des. 1991, 17, 165–270. [Google Scholar] [CrossRef]
- Karditsas, P.J. Water radiolysis in fusion neutron environments. Fusion Eng. Des. 2011, 86, 2701–2704. [Google Scholar] [CrossRef]
- Giambartolomei, G.; Pesetti, A.; Raucci, M.; Aquaro, D. Effect of non-condensable gas in steam condensation at sub-atmospheric pressure condition. J. Phys. Conf. Ser. 2021, 2177, 012019. [Google Scholar] [CrossRef]
- Petrov, A.Y.; Macdonald, D.; Engelhardt, G. Assessment of Radiolysis in Tokamak Cooling Water System of ITER Fusion Reactor. In Proceedings of the 21st International Conference on Water Chemistry in Nuclear Reactor Systems, San Francisco, CA, USA, 9–14 September 2018. [Google Scholar]
- Swiatla-Wojcik, D.; Buxton, G.V. Modeling of radiation spur processes in water at temperatures up to 300 °C. J. Phys. Chem. 1995, 99, 011464–11471. [Google Scholar] [CrossRef]
- Fan, Z.; Cao, X.; Tong, L.; Muroya, Y.; Whitaker, G.; Momeni, M.; Lin, M. An improved method for modelling coolant radiolysis in ITER. Fusion Eng. Des. 2018, 127, 91–98. [Google Scholar]
- Doyle, P.; Bartels, D. Python script for homogeneous aqueous chemical reaction analysis and associated data related to radiolysis simulations. Data Brief 2020, 31, 105734. [Google Scholar] [CrossRef] [PubMed]
- Ershov, B.G.; Gordeev, A.V. A model for radiolysis of water and aqueous solutions of H2, H2O2 and O2. Radiat. Phys. Chem. 2008, 77, 928–935. [Google Scholar] [CrossRef]
- Mancini, A. (ENEA—Department of Fusion and Technologies for Nuclear Safety and Security, Rome, Italy). Private communication, 2022.
- Mckinney, G. MCNP—A General Monte Carlo Code n-Particle Transport Code, Version 5; X-5 Monte Carlo Team; LA-UR-03-1987; Los Alamos National Laboratory: Los Alamos, NM, USA, 2005. [Google Scholar]
- FENDL-3.1d: Fusion Evaluated Nuclear Data Library Ver.3.1d. Available online: https://www-nds.iaea.org/fendl/ (accessed on 15 February 2022).
- White, W.C. Photoatomic Data Library MCPLIB04: A New Photoatomic Library Based on Data from ENDF/B-VI Release 8; LAUR-03-1019; Los Alamos National Laboratory: Los Alamos, NM, USA, 2003. [Google Scholar]
- Elliot, A.J.; Bartels, D.M. The Reaction Set, Rate Constants and g-Values for the Simulation of the Radiolysis of Light Water over the Range 20 Deg to 350 Deg C Based on Information Available in 2008; AECL–153-127160-450-001; Atomic Energy of Canada Limited: Mississauga, ON, Canada, 2009. [Google Scholar]
- Doyle, P.; Sun, K.; Snead, L.; Katoh, Y.; Bartels, D.; Zinkle, S.; Raiman, S. The effects of neutron and ionizing irradiation on the aqueous corrosion of SiC. J. Nucl. Mater. 2020, 536, 152190. [Google Scholar] [CrossRef]
- Yakabuskie, P.A. The Influence of Long-Term Gamma-Radiation and Initially Dissolved Chemicals on Aqueous Kinetics and Interfacial Processes. Ph.D. Thesis, The University of Western Ontario, London, ON, Canada, 2015. [Google Scholar]
- Milinchuk, V.K.; Klinshpont, E.R.; Belozerov, V.I.; Khavroshina, I.S.; Sadikov, E.I. The tansformation of the oxide coatings of aluminum by imitation factors of nuclear power plants. Nucl. Eng. Technol. 2016, 2, 209–213. [Google Scholar] [CrossRef]
- Kanjana, K.; Ampornrat, P.; Channuie, J. Gamma-radiation-induced corrosion of aluminum alloy: Low dose effect. J. Phys. Conf. Ser. 2017, 860, 012041. [Google Scholar] [CrossRef]
- Godart, P.; Fischman, J.; Seto, K.A.; Hart, D. Hydrogen production from aluminum-water reactions subject to varied pressures and temperatures. Int. J. Hydrogen Energy 2019, 44, 11448–11458. [Google Scholar] [CrossRef]
- Lertnaisat, P.; Katsumura, Y.; Mukai, S.; Umehara, R.; Shimizu, Y.; Suzuki, M. Simulation of the inhibition of water α-radiolysis via H2 addition. J. Nucl. Sci. Technol. 2014, 51, 1087–1095. [Google Scholar] [CrossRef][Green Version]


Publisher’s Note: MDPI stays neutral with regard to jurisdictional claims in published maps and institutional affiliations. |
© 2022 by the authors. Licensee MDPI, Basel, Switzerland. This article is an open access article distributed under the terms and conditions of the Creative Commons Attribution (CC BY) license (https://creativecommons.org/licenses/by/4.0/).