Article

Leveraging Supply Chain Reaction Time: The Effects of Big Data Analytics Capabilities on Organizational Resilience Enhancement in the Auto-Parts Industry

by
Marcelo Bronzo
1,
Marcelo Werneck Barbosa
2,*,
Paulo Renato de Sousa
3,
Noel Torres Junior
4 and
Marcos Paulo Valadares de Oliveira
5
1
Department of Administrative Sciences, Federal University of Minas Gerais, Belo Horizonte 31270-901, Brazil
2
Department of Agricultural Economics, Pontificia Universidad Católica de Chile, Santiago 7820436, Chile
3
Fundação Dom Cabral, Campus Belo Horizonte, Belo Horizonte 30140-083, Brazil
4
Department of Production Engineering, Federal University of Minas Gerais, Belo Horizonte 31270-901, Brazil
5
Department of Business Administration, Universidade Federal do Espirito Santo, Vitoria 29075-910, Brazil
*
Author to whom correspondence should be addressed.
Adm. Sci. 2024, 14(8), 181; https://doi.org/10.3390/admsci14080181
Submission received: 17 July 2024 / Revised: 13 August 2024 / Accepted: 15 August 2024 / Published: 18 August 2024
(This article belongs to the Special Issue Supply Chain in the New Business Environment)

Abstract

:
Big data analytics capabilities (BDACs) are strategic capabilities that expedite decision-making processes, empowering organizations to mitigate the impacts of supply chain disruptions. These capabilities enhance the ability of companies to be more proactive in detecting and predicting disruptive events, increasing their resilience. This study analyzed the effects BDACs have on firms’ reaction time and the effects companies’ reaction time has on their resilience. The research model was assessed with 263 responses from a survey with professionals of auto-parts companies in Brazil. Data were analyzed with the Partial-Least-Squares—Structural Equation Modeling method. Cluster analysis techniques were also applied. This study found that BDACs reduce reaction time, which, in turn, improves firms’ resilience. We also observed greater effects in first-tier and in companies with longer Industry 4.0 journeys, opening further perspectives to investigate the complex mediations of digital readiness, reaction time, and organizational resilience performance of firms and supply chains. Our research builds upon the dynamic capabilities theory and identifies BDACs as dynamic capabilities with the potential to enhance resilience by reducing data, analytical, and decision latencies, which are recognized as core elements of the reaction time concept, which is particularly crucial during disruptive supply chain events.

1. Introduction

By integrating cutting-edge technology and growing organizational commitment to data analytics, companies actively pursue greater responsiveness to supply chain events, thus improving operational efficiency and adaptability. Technologies, such as cyber–physical systems, cloud computing, the Industrial Internet of Things (IIoT), artificial intelligence (AI), digital twins, additive manufacturing, machine learning, collaborative robots, and remote sensing, reflect the increasing overlap between physical and virtual dimensions in operations and processes management (Yang et al. 2019). From an operations management perspective, these disruptive innovations introduce a range of new challenges as transformation systems evolve into intelligent, integrated, responsive, and autonomous entities. This integration extends to larger ecosystems, like a company’s supply chain, generating an immense volume of real-time data with the aid of Industry 4.0 technologies (Jeschke et al. 2017; Müller et al. 2018; Wang et al. 2016a).
Big data encompass vast and heterogeneous datasets comprising structured and unstructured data from diverse sources continuously updated in real time (Gupta and George 2016; Wang and Wang 2020). The unique characteristics associated with big data, including their velocity, volume, variety, and veracity, pose significant challenges for enterprises, emphasizing the need to develop specific sorts of capabilities, commonly referred to as big data analytics (BDA) capabilities. BDA capabilities empower organizations to ensure data accuracy, cope with data generation and dissemination velocity, manage the massive volume and diverse types of data, and extract valuable insights to drive informed decision making.
These capabilities become particularly relevant when considering the occurrence of disruptive and unplanned events in supply chains. The occurrence of many types of disruptive and/or unplanned events may require prompt reactions or countermeasures from companies aiming to mitigate their effects. A disruptive event in a supply chain may be defined as an unforeseen occurrence that significantly interrupts the normal flow of operations. Such incidents can range from logistical delays and industrial accidents to environmental disasters, drastic demand fluctuations, or quality issues (Ladeira et al. 2021).
In general terms, the reaction time to a disruptive event in a firm’s supply chain includes the time involved in recognition of the event, registration, analysis, and decision making. Following the proposition of zur Muehlen and Shapiro (2010), reaction time would comprise data latency, analytical latency, and decision latency. Assuming that higher levels of analytical capabilities in big data can promote the reduction of these latencies, it is still unknown whether these antecedent elements would have significant effects on organizational resilience during adverse situations in firms’ supply chain.
In the organizational context, resilience expresses an organization’s ability to prepare for, anticipate, and respond or adapt to incremental changes or sudden disruptions in its value chain. It is an adaptive capability essential for companies to deal with planned or unplanned changes in a scenario of increasing complexity of operations (Chopra and Sodhi 2004; Craighead et al. 2007; Ergun et al. 2023; Pereira et al. 2014; Pettit et al. 2013).
Our investigation sought to answer four central research questions:
  • Q1: Do BDA capabilities play a significant role in reducing organizations’ reaction time in the face of unexpected incidents or disruptions within their supply chains?
  • Q2: Furthermore, what effects does this expedited response have on enhancing organizations’ resilience?
  • Q3: Does a firm’s position within the supply chain influence the effects BDA capabilities have on reaction time and organizational resilience?
  • Q4: Are the effects of BDA capabilities on reaction time and organizational resilience greater for companies with longer Industry 4.0 journeys and more intense absorption of Industry 4.0 smart technologies?
To address these research questions, our study surveyed 263 executives from automotive companies associated with SAE Brazil, an affiliate of SAE International, one of the main sources of norms and standards for the automotive and aerospace sectors worldwide. We surveyed CEOs, directors, superintendents, and managers from procurement, logistics, the supply chain, finance, marketing, and sales areas. The choice of the auto-parts industry is due to the fact that among the sectors that have already started their journey towards the visionary model of Industry 4.0, the automotive sector and its entire broad ecosystem—a network of suppliers, intermediate companies, final consumers, research centers, and third-party logistics (3PL) providers, among others—make up a very peculiar and special case. Also, it is noteworthy that industries within this sector are particularly prone, for various reasons, to quickly embracing smart manufacturing technologies of Industry 4.0 (Lin et al. 2018).
This industry is considered an important case to study supply chain digitalization and its effects on performance (Fabbe-costes and Lechaptois 2022). However, it is an industry experiencing radical transformations with the rising dominance of electric vehicles. This shift encompasses, for example, shared on-demand mobility, connected cars, and autonomous vehicles, introducing novel challenges and opportunities for firms and their supply chains. As a result, significant transformations are occurring in the configuration and management of their production and assembly lines and supply chain processes (Bortolini et al. 2017).
Considering the arguments previously outlined, our research aimed to address the following research gaps, which hold both practical and theoretical relevance:
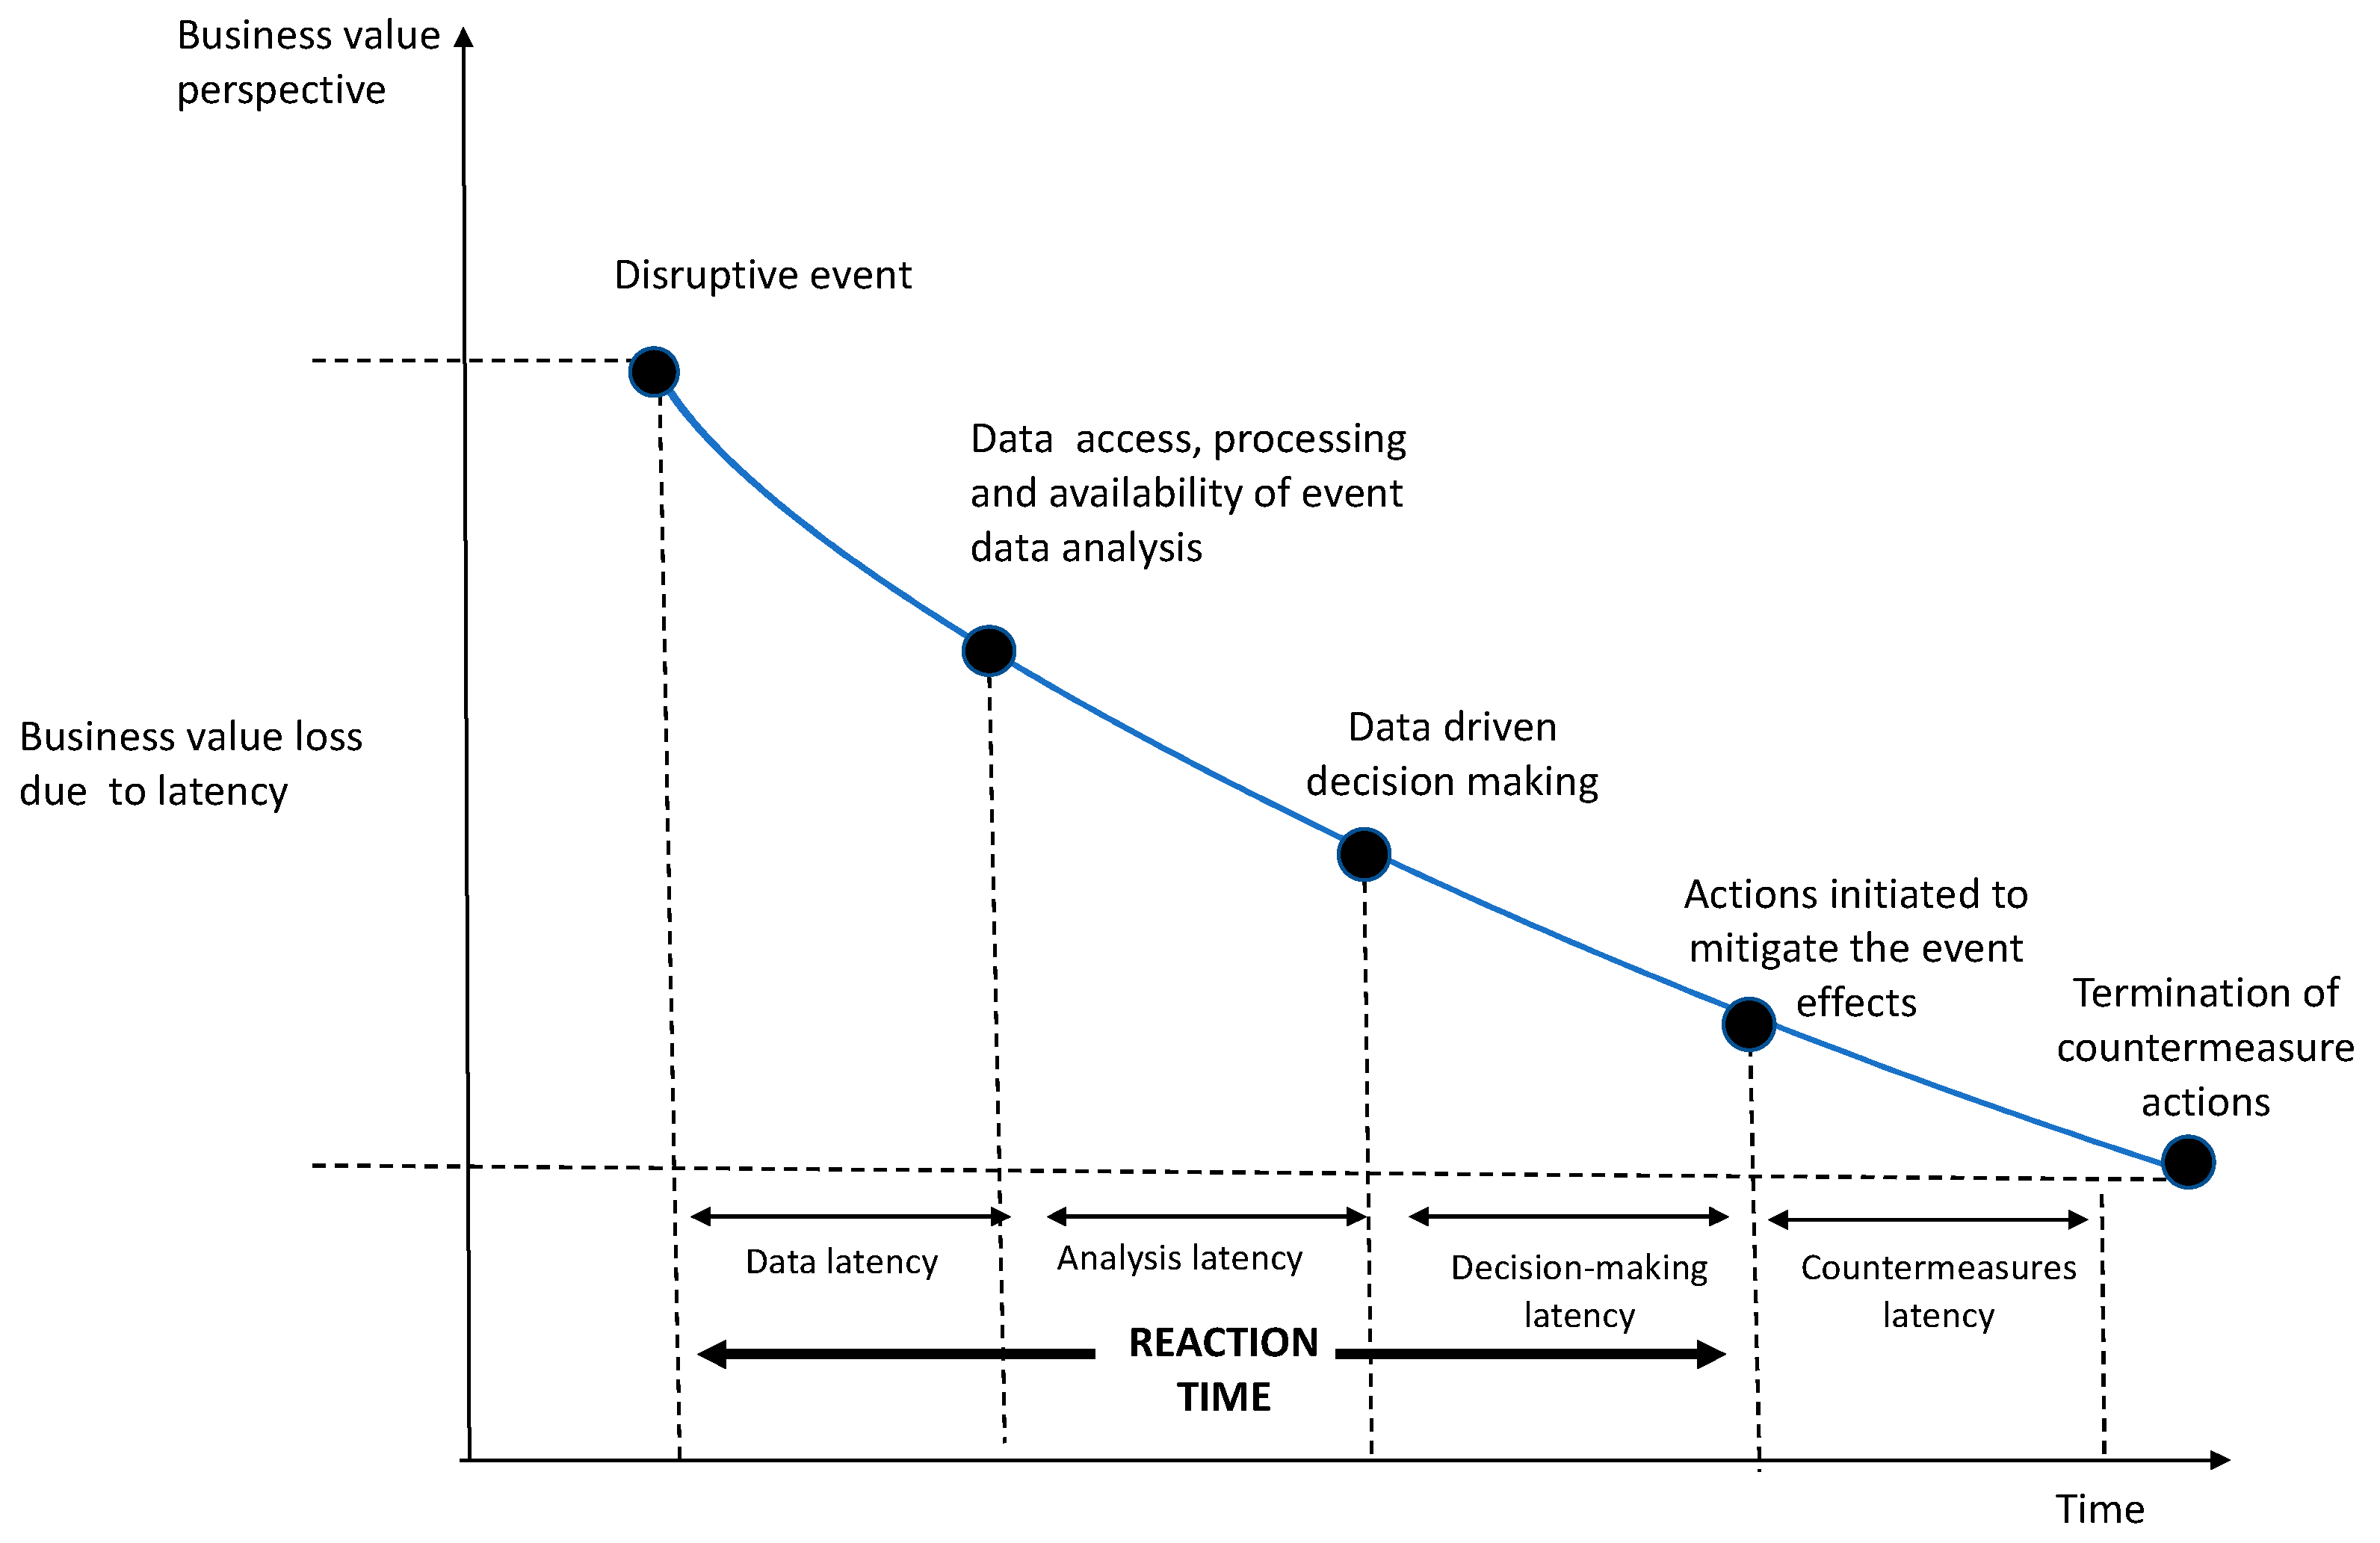
  • BDACs’ role in disruption response: Although the concept that BDA capabilities can reduce reaction time during supply chain disruptions may seem intuitive, there is a lack of empirical evidence demonstrating the extent to which BDACs directly influence the speed of response to unforeseen incidents. Particularly important and novel for our investigation is the description of the effects of BDACs on different and specific forms of latencies—data latency, analytical latency, and decision latency—which are fundamental components of reaction time.
  • Effects on organizational resilience: The literature has yet to fully explore the systemic relationships between reaction time, facilitated by BDACs, and the enhancement of organizational resilience, particularly during supply chain disruptions.
  • Position in the supply chain and BDAC impact: Knowledge is lacking regarding how a firm’s position within the supply chain (e.g., first-tier vs. indirect suppliers) influences the effect of BDACs on reaction time and organizational resilience, as many specificities can be taken into account, such as risk exposure, the quality and speed of information flow, power dynamics, and supply chain resource allocation priorities, amongst other relevant dimensions.
  • Influence of Industry 4.0 journey length: There are not yet enough studies to assert whether the level of technological readiness of firms, in relation to the absorption of smart technologies from Industry 4.0, would have any influence on the potential effects of BDA capabilities on reaction times to disruptions in the supply chain and the degree of firms’ resilience in such events.
Our work is theoretically grounded in the dynamic capabilities theory (DCT) as BDA capabilities are considered relevant capabilities to integrate, build, and reconfigure internal and external competencies to address rapidly changing environments (Teece et al. 1997). We view BDA capabilities as having the ability to intentionally expand, modify, or create a company’s resource pool. This theory is suitable in an environment of Industry 4.0 smart manufacturing technologies, as all of these disruptive innovations produce and demand huge amounts of real-time data. We consider BDA capabilities valuable assets to face disruptive events in firms’ supply chain upstream and downstream flows, consider the sense and shape of opportunities and threats, seize opportunities, and quickly reconfigure intangible and tangible assets (Teece 2007). In the case of disruptions or unplanned events in the supply chain processes, we assume that BDA capabilities will positively affect the reduction of reaction time and improve firms’ organizational resilience. The DCT has been adopted in previous studies to describe BDA capabilities (Nisar et al. 2020; Shan et al. 2019).
The contributions of our work in addressing these gaps are manifold, encompassing both practical and theoretical dimensions. Firstly, our study extends the dynamic capabilities theory by conceptualizing BDACs as a set of dynamic capabilities that enable organizations to reduce reaction time and enhance resilience in the context of supply chain disruptions. Additionally, it offers a nuanced understanding of these capabilities amidst the assimilation of Industry 4.0 smart technologies by firms. This study extends DCT by demonstrating the positive effects of BDACs as dynamic capabilities on firms’ resilience and reaction time. Secondly, we propose and evaluate a new research model that empirically validates the relationships between BDACs, reaction time, and organizational resilience in the context of a range of unplanned occurrences in a company’s value chain, such as supplier delays, quality issues, environmental disasters, sudden demand shifts, and pandemics, among other causes. We aim to describe and correlate these reaction times with the levels of BDACs and organizational resilience scores, offering insights into how organizations navigate and counter the effects of such challenges. Hence, our research’s main findings indicate that BDA capabilities significantly influence reaction time and organizational resilience, with first-tier suppliers and digitally mature companies demonstrating enhanced performance in these areas. These findings underline the importance of BDA capabilities in real-time decision making and the integration of Industry 4.0 technologies in modern supply chain management. Thirdly, we demonstrate that the length of the journey of implementation of Industry 4.0 smart manufacturing technologies can influence the relationships between the model’s variables. This is a relevant contribution to managers and practitioners because it highlights the importance of time and maturity in digital transformation and Industry 4.0 adoption processes. Firms that have started to implement their Industry 4.0 processes will take greater advantage of the effects of BDACs on firms’ resilience and reaction time. And, finally, we demonstrate that a supplier’s position in the supply chain (first-tier vs. indirect suppliers) is a categorical variable that must be considered when assessing the outcomes of BDACs, reaction time, and organizational resilience. This is also a relevant contribution for managers as it highlights the importance of first-tier suppliers and the need to develop closer and more strategic relationships with them. This opens up many possibilities for future studies to further deepen the explanations and implications of such findings by acknowledging the position-specific differences of suppliers and their effects on supply chain resilience performance.

2. Theoretical Background and Research Hypotheses

2.1. BDA Capabilities

Analytics refers to a set of different IT-enabled resources used to gain information, answer questions, predict outcomes of problem solutions, and support decision making, consequently creating competitive advantage (Barbosa et al. 2022; Davenport and Jeanne 2007; Trkman et al. 2010). Davenport (2014) describes the evolution of different types of analytics from decision support systems (Yang et al. 2008a, 2008b) to Business Intelligence, Business Analytics, and BDA. This evolution was first characterized by reporting and extracting information from data and then using statistical tools to support decision making and prescribe and predict actions.
In a very fast-changing world with huge disruptive innovations, organizations are seeking to develop and exploit big data ecosystems to create value for their businesses (Chen et al. 2012; Côrte-real et al. 2017; Davenport 2013; Rialti et al. 2019). Big data have been elevated to the status of a “new paradigm of knowledge assets” (Hagstrom 2012), a “new frottage for innovation, competition, and productivity” (Manyika et al. 2011), and a “crucial component for decision-making” in organizations’ business processes (Machado et al. 2019; Wamba et al. 2016). Big data support companies’ innovation, prediction of market trends, and the optimization of development processes (Xu et al. 2024).
Big data refer to large and very heterogeneous sets of data—structured and unstructured—from different sources that are updated continuously and in real time (Gupta and George 2016; Wang and Wang 2020). These data sets are considered massive because they can range from terabytes to zettabytes—e.g., a platform like YouTube supports 500 h of new content uploads every minute (IBM Corporation 2020). The characteristics associated with big data (e.g., speed of data dissemination, high volume, a wide variety of sources, and veracity, among others) bring immense challenges to enterprises, including the urgency to develop their BDA capabilities. Also, BDA capabilities can help companies ensure data accuracy (veracity), deal with the speed of data generation and dissemination (velocity), manage the sheer volume of data, handle a wide range of data types and sources (Barbosa et al. 2022), and positively impact organizational performance (Atobishi et al. 2024).
Wang, Kung, and Byrd (Wang et al. 2016b) defined BDA capabilities as a firm’s ability to acquire, store, process, and analyze a large amount of data obtained in different formats and from different sources and provide meaningful information to users, thus enabling them to discover business value and develop timely insights. BDA capabilities are often identified as a higher-order, multidimensional construct, which indicates that several subdimensions determine their primary dimensions (Akter et al. 2016). Shuradze and Wagner (2016) categorized these capabilities into infrastructure, people, and relationships. Akter et al. (2016) identified three dimensions of analytical capabilities in big data: organizational (management), physical (infrastructure), and human (skills or knowledge). Cosic et al. (2015), in turn, defined a set of 16 capabilities, which were grouped into four capability areas: governance, culture, people, and technology. Liu et al. (2022) acknowledge the existence of big data technical capabilities, which refer to the professional skills used to extract insights from data and big data managerial capabilities, which refer to the management skills required to manage big data resources. Barbosa et al. (2017) recognize the adoption of BDA to manage organizational, technological, and human resources. Among these capabilities, Huynh et al. (2023) stated that BDA management and technological capabilities are gaining popularity. Solano and Cruz (2024) also highlight the relevance of analytical and technological capabilities.
Building analytical capabilities is a crucial determinant of a firm’s competitiveness, given its role in extracting value and insights from data (Trkman et al. 2010). By integrating AI and machine learning, companies can leverage analytical skills to (1) comprehensively and rapidly recount their business processes’ past performance (descriptive analytics); (2) recognize complex patterns and associations between variables, hence forecasting the likelihood and impact of future events (predictive analytics); and (3) identify and evaluate potential actions in alignment with certain constraints and goals (prescriptive analytics) (Barker et al. 2017; Eisenberg et al. 2019).

2.2. Reaction Time

The seminal conception of reaction time has its origins in the field of experimental psychology during the 19th century. The concept was developed to infer the lengths of different cognitive processes and the time it takes for a person to respond to a stimulus. It is usually measured from the onset of a stimulus until the initiation of the response. Today, with its specificity, the concept is considered not only in the areas of psychology and neuroscience but mainly in sports science, healthcare and clinical psychology, ergonomics, and operations management, amongst other fields of knowledge. In the operations management theory and practice contexts, the concept may reflect a position of adjustment of behavior, strategies, norms, and/or policies of organizations, aiming to assume a more favorable position in the face of the dynamic characteristic of their business environment (Richey et al. 2022).
In this study, we consider “reaction time” as the period required for an organization to respond to unexpected disruptions or unplanned events within its value chain. This period extends from the onset of the disruption to the initiation of actions aimed at mitigating the effects of the incident. According to Hackatorn (2002) and zur Muehlen and Shapiro (2010), this timeframe can be segmented into data latency, analysis latency, decision-making latency, and countermeasures latency. Reaction time comprises the first three latency types. Figure 1 identifies each of these types of latency and underscores a pivotal phenomenon. In the occurrence of a disruptive event, there is a potential decline in the business value when decisions and implementation of actions or countermeasures in response to that event take longer.
In the supply chain context, data latency refers to the delay between the occurrence of an event and the access to event data, its processing, and the availability of the data analysis. This delay can be challenging when dealing with disruptive events, and its impact can vary significantly depending on the magnitude of the event. For example, in the auto-parts supply chain, a sudden shortage of a critical component due to a natural disaster can lead to significant delays. If the data latency is high, the company may not be able to quickly access, process, and make available the necessary information to find alternative suppliers, resulting in prolonged production stoppages and substantial financial losses. Data need to be converted into formats usable for decision making, taking various forms, such as notifications, reports, or embedded within key performance indicators. Traditional analytical methods, which rely on historical data and periodic report generation, fail to synchronize analytical efforts with the event’s timing, resulting in increased system analytic latency (zur Muehlen and Shapiro 2010). Data and analysis latency can be collectively called “analytic infrastructural latency.” This term encompasses the time required for capturing, storing, analyzing, and visualizing events. Minimizing analytic infrastructural latency facilitates early data-driven decision making and action taking in response to events.
Decision-making latency, in turn, is influenced by various complex factors, including the type and complexity of the problem, the opportunity cost associated with potential action alternatives, and the trade-offs involved in the decision, among others. In the face of an unplanned event, reducing decisional latency enables quicker initiation of actions or countermeasures to mitigate the effects of the event. Reduced decision making and analytic infrastructural latency are crucial for ensuring the company spends less time accessing, processing, and analyzing data, which would allow decision makers to efficiently access comprehensive reports that synthesize time-sensitive information promptly, fostering a real-time process analytics culture in the organization. The final stage in this latency chain relates to the actual execution of the decision, known as implementation latency, which represents the point in time when the decision’s effects are realized, that is, when actions or countermeasures are enacted in response to events.
When firms are able to speed up their responses to external events, they are able to make timely informed decisions and optimize their reaction time (Barlette and Baillette 2022). Previous research has shown that BDACs are critical for companies to quickly respond to their supply chain partners’ needs because they allow them detect and analyze data in real time (Liu et al. 2022), reducing the reaction time required to deal with unplanned events. Considering this context, we formulated the first hypothesis of our study.
Hypothesis 1 (H1): 
BDA capabilities positively affect companies’ reaction time (reducing data latency, analytical latency, and decision latency) in response to disruptive and/or unplanned events in their supply chain.

2.3. Organizational Resilience

The concept of resilience is both multidisciplinary and multidimensional (Ivanov et al. 2024; Pettit et al. 2013; Ponomarov 2012; Ponomarov and Holcomb 2009). It is considered a multidisciplinary phenomenon because it is investigated in different areas of knowledge, such as physical sciences, engineering, human sciences, social psychology in particular, and, more recently, operations management.
It is also a multidimensional phenomenon because it refers to a domain that can be studied from different perspectives or associated with other performance dimensions in flexibility, agility, or horizontal and vertical process integration. Resilience has been associated with the visibility and mitigation of disruption effects (Chopra and Sodhi 2004; Christopher and Lee 2004; Li et al. 2023), agility and responsiveness (Christopher 2000; Christopher and Towill 2001; Van Hoek et al. 2016), and uncertainty reduction (Craighead et al. 2007; Hallikas et al. 2004; van der Vorst and Beulens 2002), as well as in association with cross-organizational collaboration (Scholten and Schilder 2015; Wieland and Wallenburg 2013).
In their conceptualization of resilience, Colicchia and Strozzi (2012) highlight the proactive nature of firms in managing risks, emphasizing the significance of effectively identifying risks and vulnerabilities within their supply chains. A similar perspective is reflected in the research by Bode, Wagner, Petersen, and Ellram (Bode et al. 2011), viewing supply chain disruption orientation as a means to leverage sustainable competitive advantages in dynamic markets characterized by increased vulnerabilities and uncertainties. Alkhatib and Momani (2023) stated that supply chain resilience positively impacts manufacturing firms’ operational performance. In other studies, such as those by Eisensberg, Seager, and Alderson (Eisenberg et al. 2019) and Barker et al. (2017), the concept of resilience analytics expresses the systematic use of BDA to enhance the ability of companies to be more proactive in both detecting and predicting disruptive events in their value chain. Corallo et al. (2023) stated that there are still relevant challenges in processing huge sets of data in the shortest possible time. Given all of these previous arguments, we proposed the second hypothesis of this study.
Hypothesis 2 (H2): 
In the face of disruptive and unplanned events within firms’ supply chains, a decrease in reaction time (including reduced data latency, analytical latency, and decision latency) is positively associated with higher levels of organizational resilience.
Our study also tested the hypothesis that tier-one suppliers in the auto industry would be more inclined to and consistent in nurturing BDA capabilities than automaker’s indirect suppliers, which would lead to lower reaction time and greater effects on organizational resilience influenced by BDA capabilities.
This industry faces massive changes, which are partly due to the huge transformation of business models as electric vehicles become increasingly dominant in the global car market. These changes also encompass the advent of shared on-demand mobility, the connected car, and autonomous vehicles. These shifts are dual-faceted, posing both disruptive challenges to players throughout the industry and offering a potential path toward growth and profitability. The trend is that growth in revenues and profits of strategic tier-one suppliers must come increasingly from the systems needed for the next-generation vehicles, as they play a critical role (and are directly involved) in designing, developing, and manufacturing such key systems and components for this new industry of electric vehicles.
Amidst the shifting landscape of the automotive sector, first-tier suppliers already bear significant responsibility for fostering and facilitating the progression of new technological proficiencies among automakers’ indirect suppliers (e.g., second-tier, third-tier, etc.) required for next-generation vehicles. The internationalization of automakers’ supply chains has led to fragmentation among second- and third-tier suppliers, adding complexity to a more intricate and diverse supply chain network. Also, this fragmentation has increased the need for transparency and accountability and to address concerns regarding disruption risks and sustainability issues (Miemczyk et al. 2012).
The fast-paced changes in the auto industry can also be attributed to Industry 4.0’s smart manufacturing technologies, as we see the step-by-step integration of these cutting-edge technologies gradually enabling firms to have more transparency and control over the process flows in the multi-tier supply chain. As Wagire et al. (2021) observed, many manufacturers foresee substantial alterations in their supply chains, operations, and business models due to Industry 4.0’s ongoing developments, including AI. Nevertheless, the technological disruptive innovations of Industry 4.0, the challenge considering its implementation in both companies’ and supply chain operations’ contexts, and the rising complexity of supply chain systems in this industry still need to be more fully comprehended. Considering these previous concerns, we proposed Hypothesis 3.
Hypothesis 3 (H3): 
The effects BDA capabilities have on reaction time and organizational resilience are higher for first-tier suppliers.

2.4. Smart Manufacturing Technologies of Industry 4.0

We consider Industry 4.0 a synthesis concept to designate the fourth industrial revolution underway and the many disruptive technologies that affect companies’ business models and how they manage their business processes. Industry 4.0 defines a new stage of evolution for industrial organizations. One of the main elements of this evolution is the change in the connectivity between transformation systems, mainly due to the integration of new information and communication technologies, the IoT, and smart machines operating in cyber–physical systems (Bortolini et al. 2017; Dalenogare et al. 2018; Lichtblau et al. 2015). These transformation systems capture, record, and interpret data from the environment and react to signals from different points of origin in that environment. Unlike other technologies, they are self-regulating systems, integrating communication with human actors and other devices at local and global levels (Reischauer 2018).
Industry 4.0 is characterized by higher levels of horizontal integration, referring to integrating the physical and virtual worlds of the firm’s value chain processes. Higher levels of horizontal integration enable smart factories to better adapt to the circumstances of the environment, thus reacting more quickly to events, such as material unavailability, disruptions in production scheduling, or timely changes in order volumes.
The new technologies also have the potential to positively affect levels of vertical integration, with people, machines, work centers, production lines, and other resources being physically and digitally integrated in the form of cyber–physical systems. Industry 4.0 also means the presence of intelligent products capable of gathering and transmitting information pertinent to the processes involved in their manufacture in real time but also associated with their consumption by customers. Smart products make it possible to offer data-driven services, which are collected throughout the life cycle of products (Hermann et al. 2015; Lee et al. 2015; Lichtblau et al. 2015; Tjahjono et al. 2017), which is quite relevant in durable goods industries, such as the automotive, electronic, and machinery industries.
The implementation of Industry 4.0 technologies requires organizations to integrate digital technologies in their operations, business processes, customer relationships, employee engagement, and, especially, in their sales and supply channels (Siachou et al. 2020). Industry 4.0 applications can stimulate the adoption of a data-driven decision-making culture in firms (Chaudhuri et al. 2024). Companies that have started their implementation process longer would be more mature in terms of technology implementation. To Mettler and Pinto (2018), this implementation process involves continuous and ongoing adaptations to a changing digital landscape. Companies that have been implementing Industry 4.0 technologies longer are more agile, flexible, decentralized, digitally oriented, and collaborative, and they promote more integration among areas. These companies have higher technological capability performance, comprising assets that enable digital data generation, processing, and use (Pinto et al. 2023). Although Industry 4.0 smart technologies can link disruptive technologies to manufacturing systems, researchers have stated that there needs to be more empirical work on understanding the I4.0 implementation journey and supply chain digitalization. Given these concerns, Hypothesis 4 was formulated.
Hypothesis 4 (H4): 
The effects BDA capabilities have on reaction time and organizational resilience are greater for companies with longer Industry 4.0 journeys and more intense absorption of Industry 4.0 smart technologies.

3. Research Methodology

This section presents the study’s methodology and describes (1) the research design and the sample characterization, (2) the measures, and (3) the data analysis.

3.1. Research Design and Sample Characterization

In order to answer the research questions and validate our structural model, we conducted a descriptive–conclusive study of a quantitative nature, carried out by means of a survey research method. The data were collected from a group of executives working in companies associated with SAE Brazil, an affiliate of SAE International, one of the main sources of norms and standards for the automotive and aerospace sectors worldwide, with 138,000 technical specialist engineers. SAE Brazil has an estimated membership of around 6000 associates. The sample comprised 263 respondents, including CEOs, directors, superintendents, and managers responsible for operations and processes across departments, such as procurement, logistics, the supply chain, finance, marketing, and sales. The data were collected by administering questionnaires via email to SAE Brazil associates. Participants provided their written consent after acknowledging the study’s objectives and agreeing to respond truthfully to the survey. Responses were treated anonymously, confidentially, and aggregated solely for research purposes. For further inquiries, participants were encouraged to contact the study coordinator via email.

3.2. Measures

In the first section of the survey instrument, we introduced the items used to measure the model’s latent variables—BDA capabilities, reaction time, and organizational resilience—all of which displayed a reflective nature. All measurements were evaluated using a 5-point Likert scale, ranging from “strongly agree” to “strongly disagree” response options.
The construct of BDA capabilities comprised 10 measurement items, and it has been adapted from the theoretical framework developed by Wamba et al. (2016) and Gupta and George (2016). These items encompass the dimensions of management, people, technology, and data-driven culture. The reaction time latent construct was defined based on the study published by Hackatorn (2002), which has been subsequently refined by zur Muehlen and Shapiro (2010). Reaction time expresses the time lag between an event’s occurrence in the company’s supply chain and the subsequent action to mitigate its effects. In our study, this construct is enhanced by including measurements from the study by Valadares de Oliveira and Handfield (2018), covering management capabilities, data governance aspects, and data visibility and transparency in value chain process areas. As an endogenous construct in our structural model, organizational resilience mirrors past contributions from Pettit (2008), Pettit et al. (2013), and Ponomarov (2012). The measurement model consists of five items to address how effectively companies handle disruptions in their supply chain. It encompasses four key aspects: disruption response efficiency (restoration of normal production flows), financial preparedness for disruptions, supply chain connectivity during disruptions, and internal functioning during disruptions.
The theoretical research model is presented in Figure 2.
Finally, the last section of the questionnaire included questions designed to gather information on the profiles of the respondents and their respective companies. It included respondents’ roles, their tenure within the company, whether the company serves as a direct or indirect supplier to automakers, the annual revenue, the duration of the digital transformation journey, the presence or absence of a dedicated department for digital transformation processes, and the degree of adoption of Industry 4.0 advanced technologies. Regarding this last section, we adopted with minor modifications measurement items proposed and validated in the work of Dalenogare et al. (2018). This latent variable includes first-order constructs: (i) vertical integration; (ii) virtualization; (iii) automation; (iv) traceability; and (v) flexibility. In addition to these dimensions, the construct includes an extra item to identify the companies’ use of the IIoT, which is a foundational element of Industry 4.0 primarily focused on connecting devices, machines, and systems across industrial environments. It enhances connectivity and facilitates real-time data collection, which is crucial for informed decision making and process optimization.
The research questionnaire is presented in Appendix A.

3.3. Data Analysis

This study employed PLS-SEM to examine a hypothetical–conceptual model that assesses the relationships among the constructs of BDA capabilities, reaction time, and organizational resilience. In addition, we assessed whether the digital transformation journey duration and the intensity of absorption of Industry 4.0 smart manufacturing technologies influence the effects BDA capabilities have on reaction time and organizational resilience.
To validate the structural model, we used SEMinR, a comprehensive package for SEM in R (Hair et al. 2021). SEMinR is a versatile package that offers a variety of tools and resources for SEM analysis, including the specification, estimation, evaluation, and visualization of models.
Data were analyzed with descriptive statistics and multivariate data tests, according to PLS-SEM. This method requires that the sample must be large enough to ensure that the model is estimated accurately and that the results are reliable. It is suggested that exploratory studies should have a sample size of at least five times the number of parameters or measurable items in the structural model (Gorsuch 1983; Hatcher 1994; Suhr 2006). The research model proposed comprises three latent variables that, together, have 20 measurement items. Therefore, the total number of respondents who participated in this study (263 respondents) exceeds the suggested minimum sample size of 200 cases.
Different statistical tests were carried out to evaluate the measurement models. The unidimensionality of the constructs was verified using Cronbach’s alpha (CA) and composite reliability measures. Tests were also conducted to evaluate convergent validity, using factor loadings and the average variance extracted (AVE) measures. Finally, we evaluate the discriminant validity of the measurement models through an analysis of cross-loadings and the heterotrait–monotrait ratio (HTMT).
In order to validate the structural model, we calculated the R2 for the endogenous variables in the model and examined the values and statistical significance of path coefficients. Additionally, tests were performed to evaluate the magnitude or size of the direct effects between constructs in the model (f2 test).
Finally, we conducted a cluster analysis employing the k-means method to identify clusters of homogeneous companies within the sample. The analysis focused on the duration of the digital transformation journey, the intensity of smart manufacturing technology absorption, and the position of these companies within the supply chain (first-tier and indirect suppliers).

4. Findings

4.1. Descriptive Data Analysis

As previously outlined, the data collection phase resulted in 263 valid responses. Some initial descriptive sample data are presented below. Regarding job position and tenure in the company, the sample was mostly composed of professionals with over five years of professional experience in the company (239 cases), and over half of the respondents (151 cases) occupied the position of CEO, superintendent, and logistics and supply chain operations directors/managers. Out of the 263 respondents, over half (161 cases) worked in first-tier supplier companies to automakers in the country.
The majority of the surveyed companies (83.6% of the total) can be characterized as medium-sized (131 cases) and large-sized (89 cases) in terms of the number of direct employees. Regarding revenue, most respondents worked in companies with revenue ranging from more than USD 60 million and less than or equal to USD 100 million (40.7%).
Also, 112 companies (42.6%) began their digital transformation between 3 and 5 years ago, 61 companies (23.2%) more than 10 years ago, 27 companies (10.3%) less than 3 years ago, 26 companies (9.9%) between 7 and 10 years ago, 14 companies (5.3%) between 5 and 7 years ago, and 23 companies (8.7%) have not yet started. In terms of the presence of an area/function or team responsibility for digital transformation, 155 companies (58.9%) had a specific area dedicated to this function, while 108 companies (41.1%) did not. The responsibility was mainly dispersed amongst CEOs, general directors, or superintendents in 49 companies (31.6%); directors/managers of operations, logistics, and the supply chain in 48 companies (30.9%); and assistants/supervisors of operations, logistics, and the supply chain in 33 companies (21.3%). A summary of these sample descriptive statistics can be found in Table 1.

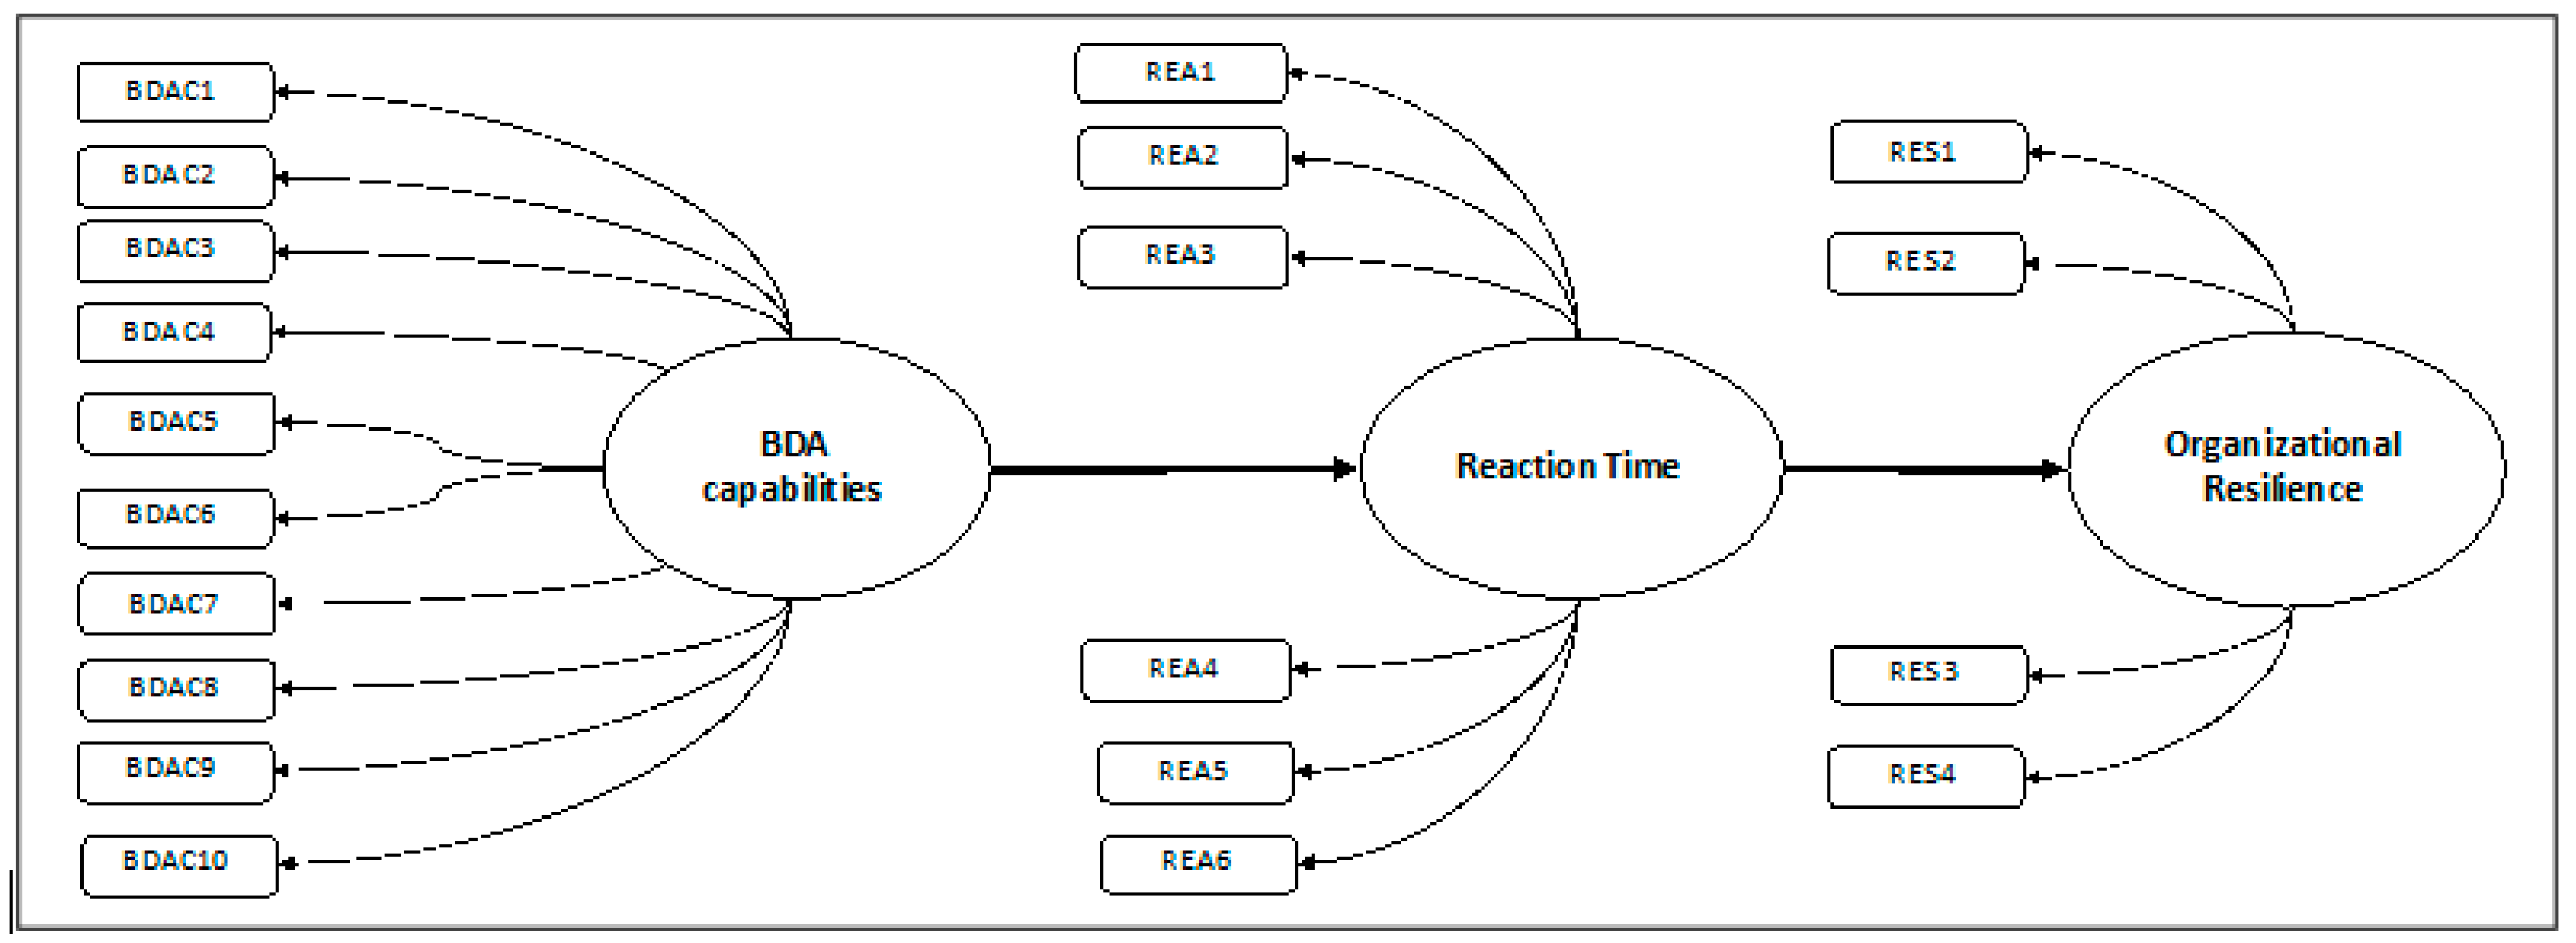
4.2. Measurement Model Validation

The convergent validity of the constructs was evaluated regarding their respective measurement items. Out of the 20 items distributed across the three latent variables, 10 presented loadings above the commonly used threshold value of 0.7, with some even higher at 0.8. As indicated by Hair et al. (2021), social science studies often present weak indicator loadings (<0.708) for newly developed scales. Rather than automatically removing indicators, Hair et al. (2021) state that indicators with loadings between 0.40 and 0.708 should only be removed if this increases reliability or convergent validity above the threshold. Content validity should also be considered when deciding whether to delete an indicator. By taking into account such observations, we decided to keep those items with loadings slightly below the value of 0.7, as they still contribute to the overall evaluation of the latent constructs of our model.
We also evaluate the construct’s convergent validity using AVE, which is the mean value of the squared loadings. A minimum of 0.50 is needed for a construct to explain 50% or more of its indicators’ variance. Considering the three constructs of the model, only the latent variable of BDA capabilities presented an AVE value (0.416), which is slightly below the recommended threshold (0.5). Reaction time and organizational resilience latent variables presented an AVE value of 0.518 and 0.627, respectively.
The second step in reflective measurement model assessment involves examining the internal consistency reliability, which is the extent to which indicators measuring the same construct are associated with each other. Jöreskog’s composite reliability rhoC and Cronbach’s alpha are commonly used to assess internal consistency reliability in PLS-SEM. Reliability values between 0.60 and 0.70 are acceptable, while values between 0.70 and 0.90 are satisfactory to good. Values above 0.90 may indicate redundant indicators and lead to lower construct validity. In our study, all Cronbach’s alpha and the composite reliability rhoA and rhoC values sat slightly above the limit of 0.80, indicating that there were no unidimensionality problems considering the research model’s latent variables.
All mean values and standard deviations for the measurement items of the model, as well as the results of the convergent validity tests and internal consistency reliability, are summarized in Appendix A.
Finally, tests were conducted to evaluate the discriminant validity of the measurement models. Discriminant validity exists when the loading of an item that composes a certain block of variables (a construct) is higher than the loadings of that item with other constructs in the structural model. One way to test the constructs’ discriminant validity is through cross-loading analysis. Table 2 shows the cross-loading values of the items and constructs in the model. These data indicate no discriminant validity issues were observed regarding the measurement models.
Discriminant validity was also assessed using the HTMT method. Although the Fornell and Larcker (1981) test has traditionally been used to assess discriminant validity in SEM, recent research (Hair et al. 2021; Henseler et al. 2015; Radomir and Moisescu 2019) has shown that this test might be not reliable for identifying discriminant validity problems in empirical applications, particularly when the indicator loadings on a construct are similar. Therefore, the HTMT of correlations is recommended as an alternative method to assess discriminant validity (Hair et al. 2021, p. 79). Discriminant validity problems are present when HTMT values are very high. A value below 0.90 indicates that discriminant validity between two reflective constructs has been established. A lower, more conservative threshold value is suggested when constructs are conceptually more distinct, such as 0.85 or less.
The data presented in Table 3 indicate that no discriminant validity problems were observed. However, the value found when examining the correlations between the constructs of reaction time and organizational resilience is at the boundary range.

4.3. Structural Model Assessment

We utilized a range of multivariate statistical tests to validate the structural model. This involved identifying the determination coefficients (R2) and path coefficients, conducting significance tests of regressions and correlations, and calculating effect sizes (f2).
The data in Table 4 indicate that the latent variable BDA capabilities can explain approximately 40% of the proportion of reaction time construct variance. Following some commonly used thresholds for interpreting R2 values, this result means a moderate amount of the variance explained (Hair et al. 2021). The latent variable reaction time can explain or predict approximately 56% of the proportion of organizational resilience variance. Considering that R2 values between 0.50 and 0.75 are commonly recognized as indicating a good fit of the model to the data, the results demonstrated that the latent variable reaction time may explain a substantial amount of organization resilience variance.
We tested the research’s four hypotheses in the second step of the structural model assessment. Firstly, we evaluated the path coefficients for the relationships presented in research Hypotheses 1 and 2. Through the bootstrapping technique, the generation of the standard error allowed us to calculate the t-values for the established hypotheses (paths). For the 5% significance level, the parameter for the t-value is above 1.96.
As it can be observed from the data summarized in Table 5, the two path coefficients can be considered high, and they are statistically significant. The results indicated that the first hypothesis was supported, suggesting that BDA capabilities significantly affect the reaction time (a path coefficient of 0.637). The second hypothesis was also supported once the reaction time construct significantly affected organizational resilience (with a path coefficient of 0.752).
Figure 3 presents the structural model’s R2 values and path coefficients.
The determination coefficients (R2) of the endogenous constructs and the model’s path coefficient values, indicated in Figure 2, describe a strong association between the latent variables of the structural model. Additionally, we conducted the ƒ2 test to describe the strength of these effects. A general guideline suggests that values of 0.02, 0.15, and 0.35 represent the exogenous latent variable’s small, medium, and large effects (Cohen 1988) when assessing ƒ2. Effect sizes below 0.02 indicate no effect. As illustrated in Table 6, the impact of the exogenous latent variable BDA capabilities on reaction time and organizational resilience can be deemed significant with large effect sizes.
As it can be seen from these results, the proportion of variance explained by the endogenous variables in our model may be taken as significant, as well as the direct predictor effects of BDA capabilities and reaction time on organizational resilience outcomes, therefore validating Hypotheses 1 and 2 of the research.
Hypothesis 3 investigated if the effects BDA capabilities have on reaction time and organizational resilience are greater for first-tier suppliers. To test H3, two groups were formed with the aid of cluster analysis, which is a generic term for a wide range of numerical methods with the common goal of uncovering or discovering groups or clusters of observations that are homogeneous and separated from other groups. This analysis showed that 161 companies were reported as direct suppliers in this study (cluster 1), while 102 companies were reported as indirect suppliers to automakers (cluster 2). The null hypothesis tested was that there would be no difference in the mean values of the two groups regarding the effects BDA capabilities have on reaction time and organizational resilience. Table 7 shows that the differences in median values between the two groups were considered significant regarding the constructs of reaction time and organizational resilience. In both cases, the results of the companies in cluster 1 (first-tier suppliers) can be considered slightly superior, thereby validating H3.
Finally, we tested Hypothesis 4, which stated that the effects BDA capabilities have on reaction time and organizational resilience are higher for companies with longer Industry 4.0 journeys and more intense absorption of Industry 4.0 smart technologies. To test Hypothesis 4, we also conducted a cluster analysis. From the data of the 263 survey respondents, two clusters were obtained using the K-means method. These two groups can be observed in Figure 4.
Figure 4 indicates that, in many cases, an Industry 4.0 journey that is not yet very long may or may not be accompanied by a greater intensity in the absorption of technologies (because there are companies that reported greater intensity in the absorption of new technologies but that are still in an early stage of Industry 4.0 adoption). However, data indicate that companies with a longer Industry 4.0 journey are also the ones that strongly seek to absorb the innovative Industry 4.0 smart manufacturing technologies.
Table 8 and Table 9 show that cluster 1 is characterized by companies with shorter Industry 4.0 implementation and average smart manufacturing technology absorption scores ranging between 2 and 4 points on a scale of 1 to 5. On the other hand, cluster 2 is characterized by companies with longer Industry 4.0 implementation and higher average smart manufacturing technology absorption scores ranging between 3 and 5 points on a scale of 1 to 5.
We used the nonparametric test of Mann–Whitney to compare these two independent groups in terms of their medians. Specifically, the test determines whether the distributions of the two groups are different based on their ranked scores. The test provides information about whether there is a significant difference between the medians of the two groups being compared, as well as the level of significance of this difference.
As shown in Table 10, the median values are different between the two respondent groups, and these differences are statistically significant. In particular, it is noted that the group with a longer digital transformation journey and greater intensity in the absorption of Industry 4.0 technologies (cluster 2) presented better scores for the constructs of BDA capabilities, reaction time, and organizational resilience. Hence, these findings confirmed the fourth hypothesis formulated in this study.

5. Discussion

The results of this study provide strong evidence that BDA capabilities positively influence reaction time, which, in turn, positively influences organizational resilience. The results showed that BDA capabilities can explain 40% of the variance in reaction time; that is, BDA capabilities are a powerful way to reduce reaction time. The results indicate a significant relationship between reaction time and organizational resilience, with reaction time explaining 56% of the variance in resilience.
Hypothesis H1 has been confirmed in line with previous studies, which state that BDA capabilities positively affect companies’ reaction time in response to disruptive and/or unplanned events in their value chain. Thereby, we extend previous research by specifically analyzing the influence BDA capabilities have on reaction time. Given the constant and dynamic nature of data in today’s environment, organizations must adopt fast and efficient analysis approaches capable of handling diverse data types and formats (Jabbar et al. 2020).
Effective decision making relies on rapid responses to changing circumstances (Chen et al. 2021). BDA capabilities enable companies to quickly adapt to changing business environments, resolve inconsistencies, and respond to competitive pressures (Vera-Baquero et al. 2016). By effectively handling vast volumes of real-time data, BDA capabilities prove invaluable in ensuring timely and efficient analysis (Vera-Baquero et al. 2016). As such, BDA capabilities fulfill the requirements for effective decision making and empower organizations to leverage real-time data for strategic advantage. BDA capabilities improve awareness and informed decision making, reliability, and information connectivity by generating business insights based on data from several sources (Rad et al. 2022).
Our study’s findings are aligned with previous research that observed that BDA capabilities can increase data throughput and reduce latency in data processing to achieve real-time analysis and visualization (Yao and Wang 2020). By fostering BDA capabilities across the supply chain, companies have the potential to minimize delays in insight generation, data transformation, and inferencing. This facilitates real-time monitoring and processing, thereby reducing the time lag between data generation and insight extraction. Moreover, BDA capabilities support establishing a distributed system that fosters efficient information sharing and prompt notifications in the face of supply chain disruptions (Dey 2022).
This study has also confirmed H2, which states that the lower the reaction time, the higher the level of resilience of companies in facing disruptive and/or unplanned events in their value chain. Previous studies have found that key Industry 4.0 technologies positively impact resilience (Marcucci et al. 2022). Real-time BDA applications can mitigate damaging impacts and enhance the capacity to recover from extreme events quickly (Yao and Wang 2020). Hence, BDA improves supply chain resilience through predictive practices and capabilities (Bianco et al. 2023). Due to increased visibility and real-time information sharing, the risk is reduced, and supply chains are better-prepared for recovery planning and collaborative decision making (Dey 2022). Previous research has shown that supply chain visibility increases the impact of Industry 4.0 technologies on supply chain resilience (Qader et al. 2022).
When supply chain partners collaborate and connect with each other, real-time information flow is enabled (Scholten and Schilder 2015), and reaction time is reduced. Hence, quickly capturing and sharing information is critical for detecting problems and planning recovery from disruptions (Dey 2022). While previous studies have focused on the direct effects of BDA on supply chain resilience, our study extends previous research by showing a positive relationship between reaction time and resilience.
This study has identified that the effects BDA capabilities have on reaction time and organizational resilience are higher for first-tier suppliers, thereby supporting H3. These results are to be taken up in consideration of the proper nature of interactions between companies and specific forms of governance and segmentation, as inter-organizational relationships may be characterized, in broad terms, as either (1) arm’s length, transaction-based interactions or (2) cooperative, relational interactions (Dwyer et al. 1987; Poppo and Zenger 2002; Rinehart et al. 2004; Vachon and Klassen 2006). While an arm’s length approach emphasizes short-term relationships and minimizing dependence on suppliers, a cooperative approach puts less emphasis on short-term deliverables. It seeks to foster processes that lead to long-term operational and innovative enhancements. These more collaborative relationships may include designing contractual and informational mechanisms to align incentives, share information, increase commitment, and generate common goals between buyers and strategic suppliers. This is especially true in the case of the auto industry, where tier-one suppliers foster their role in designing or co-designing parts of the vehicle or producing complete systems for the assembly firms and make specific geographical and equipment investments in physically concentrated plants nearby the assembly plant, seeking to reduce logistical costs as well as facilitate innovative and other collaborative efforts.
The automotive sector may be one of the most supplier-dependent industries in contemporary supply chains (Simpson and Power 2005). In the case of the Brazilian auto industry, since the early 1990s, the Brazilian economy has opened up to the world, and the automotive industry has undergone a broad transformation. As noticed in other national economies, the traditional vertical structures of assemblers began to yield to smaller units with fewer suppliers, establishing a tiered structure that revolutionized the supply chain. In this new scenario, tier-one suppliers have begun to play an entirely different role. Also, new producers entered the country, establishing new operations and/or acquiring Brazilian companies, leading to a shift in the value-added sequence and a reduction in vertical integration.
The confirmation of Hypothesis H4 validates that the longer a company’s Industry 4.0 journey, the more they absorb Industry 4.0 Smart manufacturing technologies with greater intensity. Companies that have long gone through a I4.0 journey are considered more digitally mature, flexible, resilient, collaborative, and capable of innovating and experimenting. They also perform slightly better when utilizing technology (Pinto et al. 2023).

5.1. Managerial Contributions

This study also presents contributions to managers of companies in the manufacturing sector, especially in the automotive industry, which is the largest and most dominant manufacturing sector (Zailani et al. 2015). The automotive industry is highly competitive and innovative, and it has been at the forefront of the developments of Industry 4.0 and smart manufacturing technologies worldwide (Eslami et al. 2023). Our study also answers calls made by researchers to capture the perspective of automotive sectors in developing and under-developed countries (Ghadge et al. 2022) and to examine the case of Brazil as the country is an important market in the automobile industry (Masiero et al. 2017).
The outcomes of this study suggest that strong BDA capabilities are closely linked to the reduction of reaction time, enabling firms to respond more quickly and effectively to supply chain disruption events, such as supplier delays, quality issues, environmental disasters, pandemics, and other causes of disruptions. Hence, we argue that a more comprehensive understanding among operations managers of the components of reaction time—as defined in our research by data latency, analytical latency, and decision latency—will be of great assistance to enhance resilience in the face of disruptions. This is of particular interest and relevance in a complex context like the auto-parts industry.
This interpretation might prompt a call for more research into the exact mechanisms through which BDAs contribute to reducing latency (improving reaction time) and fostering supply chain resilience in disruptive events and how firms can most effectively develop and utilize these capabilities to improve their overall competitive performance.

5.2. Theoretical Contributions

This study also presents theoretical contributions. The proposed research model extends the literature by exploring the relationship between BDA capabilities, reaction time, and organizational resilience in a context where firms face disruptive and/or unplanned events in their value chain. As far as we know, there has not been any previous research that has explored these concepts in a research model similar to the one presented in this study.
The conceptualization of this study is embedded in the dynamic capabilities theoretical perspective (Teece 2007; Teece et al. 1997), as we see BDA capabilities as relevant to “integrate, build, and reconfigure internal and external competencies to address rapidly changing environments” (Teece et al. 1997, p. 516), particularly in a very fast-changing and dynamic environment. In such a context of disruptive technological innovations, one of the current major roles of strategic management will be addressing the need to adapt, integrate, and reconfigure resources, as well as organizational skills and functional competencies to respond to the challenges of the external environment (Eisenhardt and Martin 2000; Ponomarov 2012; Ponomarov and Holcomb 2009). Although our research objective was not intentionally designed to investigate how firms’ dynamic capabilities can be nurtured and fostered for the benefit of the competitive advantage of companies and their supply chains, the validation of our theoretical model contributes to a nuanced understanding of such dynamic capabilities. The study explores the relationship between BDA capabilities and specific latencies in reaction time—data, analytical, and decision latencies—in seeking to describe their effects on organizational resilience in the context of a sector that is currently facing significant challenges brought on by the Industry 4.0 revolution.
Furthermore, BDA capabilities may be considered a critical component of supply chain orientation (SCO) (Esper et al. 2010), recognizing their strategic implications in helping manage supply chain flows. Such an approximation becomes even more appealing when considering the recent developments in the operations management body of knowledge, with the concepts of SCO supplier fit and SCO customer fit, as well as their positive impact on firms’ operational and customer performance in return on assets and return on sales, as demonstrated in the work of Gligor et al. (2022).
Thus, our research expands the dynamic capabilities framework by highlighting the role of a firm’s BDA capabilities in reducing latency and improving reaction time when companies are obliged to face disruptive events in their supply chains. The outcomes of this research provide insights for improving and expanding the dynamic capabilities theoretical approach, particularly when investigating the disruptive innovations of Industry 4.0.

6. Conclusions

This study highlights the significant role of big data analytics (BDA) capabilities in reducing companies’ reaction time to disruptive or unplanned events in their value chain and enhancing organizational resilience. The structural model was validated using SEM and cluster analysis, providing robust evidence for the proposed relationships. The findings demonstrate that BDA capabilities are crucial strategic tools for fostering supply chain agility and resilience, particularly in the highly competitive and fast-paced automotive industry.
Additionally, the research shows that a company’s position within the supply chain affects its scores on BDA capabilities, reaction time, and organizational resilience. The study also confirms that digitally mature companies, which have been on their digital transformation journey longer, are more agile, flexible, decentralized, and innovative, thereby extending the literature on Industry 4.0 implementation and its impact on organizational performance.
While this study presents valuable insights, it is important to acknowledge its limitations, such as the focus on companies associated with SAE Brazil. Future research should consider other industries and countries to test the robustness of the proposed model and explore the mechanisms through which BDA capabilities contribute to resilience during disruptive events, potentially using qualitative methods. Despite these limitations, the study offers practical and theoretical implications, particularly in the context of digital transformation and Industry 4.0, emphasizing the need for organizations to leverage BDA capabilities to enhance their agility and resilience in an increasingly volatile business environment.

Author Contributions

Conceptualization, M.B. and M.W.B.; Methodology, M.B., M.W.B. and P.R.d.S.; Validation and formal analysis, N.T.J. and M.P.V.d.O.; Writing—original draft preparation and Writing—review and editing, M.B. and M.W.B.; Project administration, M.B., P.R.d.S. and N.T.J. All authors have read and agreed to the published version of the manuscript.

Funding

The APC was funded by Fundação Dom Cabral, FDC.

Institutional Review Board Statement

Ethical review was waived as the study guaranteed informed consent and respected the participants’ cultural and ethical values. Protocols for confidentiality and privacy were strictly followed.

Informed Consent Statement

Informed consent was obtained from all subjects involved in the study.

Data Availability Statement

Data will be made available upon request.

Conflicts of Interest

The authors declare no conflicts of interest.

Appendix A. Descriptive Statistics, Convergent Validity, and Reliability Tests

ConstructCodeItem DescriptionLoadingsAVErhoCrhoACronbach’s AlphaMeanStd. Dev.
Big Data Analytics CapabilitiesBDAC 1The organization uses cloud services to process and analyze data.0.5590.4160.8750.8530.8430.23980.3818
BDAC 2 0.664 4.100.652
BDAC 3The organization has access to a large amount of unstructured data (from sources, such as social networks, websites, videos, images, among others) that can be quickly analyzed by its technicians and/or data scientists.0.551 3.481.073
BDAC 4The organization can effectively integrate internal and external data from multiple sources (especially with suppliers and direct customers).0.587 3.560.897
BDAC 5The organization has professionals in different areas of the company with the necessary skills and experience to analyze data, using this knowledge in the execution of their tasks/activities.0.658 3.770.717
BDAC 6The organization provides training in decision-support systems (such as data mining and use of artificial intelligence for predictive analysis, among others).0.542 3.490.855
BDAC 7The managers involved in data analysis in the company have a good grasp of the information requirements of different area or process managers within the organization, as well as those of its suppliers and customers.0.730 3.920.722
BDAC 8The managers involved in data analysis in the company are capable of analyzing data collaboratively with both area and process managers within the organization and its suppliers and customers.0.699 3.870.727
BDAC 9The managers involved in data analysis in the company are capable of anticipating and being proactive in considering the information needs of various area or process managers in the company, as well as those of the organization’s suppliers and customers.0.566 3.770.723
BDAC10The organization considers data to be a valuable asset for the business and for managing its processes in the supply chain.0.833 4.160.788
Reaction TimeREA 1When a disruptive or unplanned event occurs, the organization has fairly quickly access to data and information about the event.0.7470.5180.8650.8220.8153.660.889
REA 2When a disruptive or unplanned event occurs, the organization is able to fairly quickly analyze data and gather information about the event.0.729 4.040.659
REA 3When a disruption or unplanned event occurs, the organization makes decisions fairly quickly once it has access to data and analyzes data about the event. 0.693 4.140.794
REA 4In our company, the data are dynamically updated, allowing a real-time view of the different processes and/or areas of the organization.0.689 3.940.702
REA 5There is a governance structure in place in the company to monitor and identify disruption events and put into action plans to mitigate the effects of these events.0.794 3.970.717
REA 6Your value chain partners share with your company an aligned vision as to how to proceed and discuss actions to be implemented in disruption situations.0.657 4.080.768
Organizational ResilienceRES 1In the face of a disruptive or unplanned event, the organization was able to respond to the disruptive situation in a way that quickly restored normal production flows.0.7610.6270.8700.8030.8013.880.915
RES 2In the face of a disruptive or unplanned event, the organization was well-prepared to deal with potential financial effects caused by the disruption.0.760 4.110.764
RES 3In the face of a disruptive or unplanned event, the organization was able to maintain a satisfactory level of connectivity with other agents in the supply chain during the period of impact of the disruption.0.845 3.790.739
RES 4In the face of a disruptive or unplanned event, the organization was able to maintain a satisfactory level of functioning of its internal functions.0.798 4.130.678

References

  1. Akter, Shahriar, Samuel Fosso, Angappa Gunasekaran, Rameshwar Dubey, and Stephen J. Childe. 2016. How to improve firm performance using big data analytics capability and business strategy alignment? International Journal of Production Economics 182: 113–31. [Google Scholar] [CrossRef]
  2. Alkhatib, Saleh Fahed, and Rahma Asem Momani. 2023. Supply Chain Resilience and Operational Performance: The Role of Digital Technologies in Jordanian Manufacturing Firms. Administrative Sciences 13: 40. [Google Scholar] [CrossRef]
  3. Atobishi, Thabit, Sahar Moh’d Abu Bakir, and Saeed Nosratabadi. 2024. How Do Digital Capabilities Affect Organizational Performance in the Public Sector? The Mediating Role of the Organizational Agility. Administrative Sciences 14: 37. [Google Scholar] [CrossRef]
  4. Barbosa, Marcelo Werneck, Alberto de la Calle Vicente, Marcelo Bronzo, and Marcos Paulo Valadares de Oliveira. 2017. Managing supply chain resources with Big Data Analytics: A systematic review. International Journal of Logistics: Research and Applications 21: 1–24. [Google Scholar] [CrossRef]
  5. Barbosa, Marcelo Werneck, Marcelo Bronzo, Paulo Renato de Sousa, and Marcos Paulo Valadares de Oliveira. 2022. Supply chain collaboration and organizational performance: The effects of big data analytics capabilities, technological dynamism and competitive intensity. International Journal of Business Environment 13: 358–91. [Google Scholar] [CrossRef]
  6. Barker, Kash, James H. Lambert, Christopher W. Zobel, Andrea H. Tapia, Jose E. Ramirez-Marquez, Laura Albert, Charles D. Nicholson, and Cornelia Caragea. 2017. Defining resilience analytics for interdependent cyber-physical-social networks. Sustainable and Resilient Infrastructure 2: 59–67. [Google Scholar] [CrossRef]
  7. Barlette, Yves, and Paméla Baillette. 2022. Big data analytics in turbulent contexts: Towards organizational change for enhanced agility. Production Planning and Control 33: 105–22. [Google Scholar] [CrossRef]
  8. Bianco, Débora, Adauto Bueno, Moacir Filho Godinho, Hengky Latan, Gilberto Miller Devós Ganga, Alejandro Germán Frank, and Charbel Jose Chiappetta Jabbour. 2023. The role of Industry 4.0 in developing resilience for manufacturing companies during COVID-19. International Journal of Production Economics 256: 108728. [Google Scholar] [CrossRef]
  9. Bode, Christoph, Stephan M. Wagner, Kenneth J. Petersen, and Lisa M. Ellram. 2011. Understanding responses to supply chain disruptions: Insights from information processing and resource dependence perspectives. Academy of Management Journal 54: 833–56. [Google Scholar] [CrossRef]
  10. Bortolini, Marco, Emilio Ferrari, Mauro Gamberi, Francesco Pilati, and Maurizio Faccio. 2017. Assembly system design in the Industry 4.0 era: A general framework. In IFAC PapersOnLine. Paris: International Federation of Automatic Control, pp. 5700–5. [Google Scholar]
  11. Chaudhuri, Ranjan, Sheshadri Chatterjee, Marcello M. Mariani, and Samuel Fosso Wamba. 2024. Assessing the influence of emerging technologies on organizational data driven culture and innovation capabilities: A sustainability performance perspective. Technological Forecasting and Social Change 200: 123165. [Google Scholar] [CrossRef]
  12. Chen, Hsinchun, Roger Chiang, and Veda Storey. 2012. Business Intelligence and Analytics: From Big Data to Big Impact. MIS Quarterly 36: 1165–88. [Google Scholar] [CrossRef]
  13. Chen, Yi-Ting, Edward Sun, Ming-feng Chang, and Yi-Bing Lin. 2021. Pragmatic real-time logistics management with traffic IoT infrastructure: Big data predictive analytics of freight travel time for Logistics 4.0. International Journal of Production Economics 238: 108157. [Google Scholar] [CrossRef]
  14. Chopra, Sunil, and ManMohan S. Sodhi. 2004. Managing Risk to Avoid Supply-Chain Breakdown. MIT Sloan Management Review 46: 52–61. [Google Scholar]
  15. Christopher, Martin. 2000. The agile supply chain: Competing in volatile markets. Industrial Marketing Management 29: 37–44. [Google Scholar] [CrossRef]
  16. Christopher, Martin, and Dennis Towill. 2001. An integrated model for the design of agile supply chains. International Journal of Physical Distribution and Logistics Management 31: 235–46. [Google Scholar] [CrossRef]
  17. Christopher, Martin, and Hau Lee. 2004. Mitigating supply chain risk through improved confidence. International Journal of Physical Distribution & Logistics Management 34: 388–96. [Google Scholar] [CrossRef]
  18. Cohen, Jacob. 1988. Statistical Power Analysis for the Behavioral Sciences, 2nd ed. Hillsdale: Lawrence Erlbaum Associates. [Google Scholar]
  19. Colicchia, Claudia, and Fernanda Strozzi. 2012. Supply chain risk management: A new methodology for a systematic literature review. Supply Chain Management: An International Journal 17: 403–18. [Google Scholar] [CrossRef]
  20. Corallo, Angelo, Anna Maria Crespino, Vito Del Vecchio, Massimiliano Gervasi, Mariangela Lazoi, and Manuela Marra. 2023. Evaluating maturity level of big data management and analytics in industrial companies. Technological Forecasting and Social Change 196: 122826. [Google Scholar] [CrossRef]
  21. Cosic, Ranko, Graeme Shanks, and Sean Maynard. 2015. A business analytics capability framework. Australasian Journal of Information Systems 19: 5–19. [Google Scholar] [CrossRef]
  22. Côrte-real, Nadine, Tiago Oliveira, and Pedro Ruivo. 2017. Assessing business value of Big Data Analytics in European firms. Journal of Business Research 70: 379–90. [Google Scholar] [CrossRef]
  23. Craighead, Christopher W., Jennifer Blackhurst, M. Johnny Rungtusanatham, and Robert B. Handfield. 2007. The severity of supply chain disruptions: Design characteristics and mitigation capabilities. Decision Sciences 38: 131–56. [Google Scholar] [CrossRef]
  24. Dalenogare, Lucas Santos, Guilherme Brittes Benitez, Néstor Fabián Ayala, and Alejandro Germán Frank. 2018. The expected contribution of Industry 4.0 technologies for industrial performance. International Journal of Production Economics 204: 383–94. [Google Scholar] [CrossRef]
  25. Davenport, Thomas H. 2013. Analytics 3.0: Measurable Business Impact from Analytics & Big Data. Harvard Business Review, November 11. [Google Scholar]
  26. Davenport, Thomas H. 2014. How strategists use ‘big data’ to support internal business decisions, discovery and production. Strategy & Leadership 42: 45–50. [Google Scholar] [CrossRef]
  27. Davenport, Thomas H., and G. Harris Jeanne. 2007. Competing on Analytics: The New Science of Winning. Cambridge: Harvard Business Press. [Google Scholar]
  28. Dey, Shantanu. 2022. Surviving major disruptions: Building supply chains resilience and visibility through rapid information flow and real-time insights at the ‘edge’. Sustainable Manufacturing and Service Economics 2: 100008. [Google Scholar] [CrossRef]
  29. Dwyer, F. Robert, Paul H. Schurr, and Sejo Oh. 1987. Developing Buyer-Seller Relationships. Journal of Marketing 51: 11–27. [Google Scholar] [CrossRef]
  30. Eisenberg, Daniel, Thomas Seager, and David L. Alderson. 2019. Rethinking Resilience Analytics. Risk Analysis 39: 1870–84. [Google Scholar] [CrossRef] [PubMed]
  31. Eisenhardt, Kathleen M., and Jeffrey A. Martin. 2000. Dynamic capabilities: What are they? Strategic Management Journal 21: 1105–21. [Google Scholar] [CrossRef]
  32. Ergun, Ozlem, Wallace J. Hopp, and Pinar Keskinocak. 2023. A structured overview of insights and opportunities for enhancing supply chain resilience. IISE Transactions 55: 57–74. [Google Scholar] [CrossRef]
  33. Eslami, Mohammad H., Leona Achtenhagen, Cedric Tobias, and Annika Lehmann. 2023. Sharing across supply chain actors in adopting Industry 4.0 technologies: An exploratory case study within the automotive industry. Technological Forecasting & Social Change 186: 122118. [Google Scholar] [CrossRef]
  34. Esper, Terry L., C. Clifford Defee, and John T. Mentzer. 2010. A framework of supply chain orientation. The International Journal of Logistics Management 21: 161–79. [Google Scholar] [CrossRef]
  35. Fabbe-costes, Nathalie, and Lucie Lechaptois. 2022. Automotive Supply Chain Digitalization: Lessons and Perspectives. The Digital Supply Chain. Amsterdam: Elsevier Inc. [Google Scholar] [CrossRef]
  36. Fornell, Claes, and David Larcker. 1981. Evaluating structural equation models with unobservable variables and measurement error. Journal of Marketing Research 18: 39–50. [Google Scholar] [CrossRef]
  37. Ghadge, Abhijeet, Dnyaneshwar Mogale, Michael Bourlakis, Lohithaksha M. Maiyar, and Hamid Moradlou. 2022. Link between Industry 4.0 and green supply chain management: Evidence from the automotive industry. Computers & Industrial Engineering 169: 108303. [Google Scholar] [CrossRef]
  38. Gligor, David, Javad Feizabadi, Terrance Pohlen, Michael Maloni, and Jeffrey A. Ogden. 2022. The impact of the supply chain orientation fit between supply chain members: A triadic perspective. Journal of Business Logistics 43: 518–39. [Google Scholar] [CrossRef]
  39. Gorsuch, Richard. 1983. Factor Analysis, 2nd ed. Hillsdale: Lawrence Erlbaum. [Google Scholar]
  40. Gupta, Manjul, and Joey F. George. 2016. Toward the development of a big data analytics capability. Information & Management 53: 1049–64. [Google Scholar] [CrossRef]
  41. Hackatorn, Richard. 2002. Minimizing action distance. DM Review 12: 22–23. [Google Scholar]
  42. Hagstrom, Thomas. 2012. High-performance analytics fuels innovation and inclusive growth: Use big data, hyperconnectivity and speed to intelligence to get true value in the digital economy. Journal of Advanced Analytics 2: 3–4. [Google Scholar]
  43. Hair, Joseph, Tomas Hult, Christian Ringle, and Marko Sarstedt. 2021. A Primer on Partial Least Squares Structural Equation Modeling (PLS-SEM), 3rd ed. Los Angeles: SAGE Publications Inc. [Google Scholar]
  44. Hallikas, Jukka, Iris Karvonen, Urho Pulkkinen, Veli-Matti Virolainen, and Markku Tuominen. 2004. Risk management processes in supplier networks. International Journal of Production Economics 90: 47–58. [Google Scholar] [CrossRef]
  45. Hatcher, Larry. 1994. A Step-by-Step Approach to Using the SAS® System for Factor Analysis and Structural Equation Modeling. Cary: SAS Institute. [Google Scholar]
  46. Henseler, Jörg, Christian M. Ringle, and Marko Sarstedt. 2015. A New criterion for assessing discriminant validity in variance-based structural equation modeling. Journal of the Academy of Marketing Science 43: 115–35. [Google Scholar] [CrossRef]
  47. Hermann, Mario, Tobias Pentek, and Boris Otto. 2015. Design Principles for Industrie 4.0 Scenarios: A Literature Review. Paper presented at the 2016 49th Hawaii International Conference on System Sciences (HICSS), Koloa, HI, USA, January 5–8. [Google Scholar]
  48. Huynh, Minh Tay, Michael Nippa, and Thomas Aichner. 2023. Big data analytics capabilities: Patchwork or progress? A systematic review of the status quo and implications for future research. Technological Forecasting and Social Change 197: 122884. [Google Scholar] [CrossRef]
  49. IBM Corporation. 2020. Building a Robust, Governed Data Lake for AI. Armond: IBM Corporation. [Google Scholar]
  50. Ivanov, Dmitry, Weiwei Chen, David Coit, and Nezih Altay. 2024. Modeling and Optimization of Supply Chain Resilience to Pandemics and Long-Term Crises. IISE Transactions 56: 683–84. [Google Scholar] [CrossRef]
  51. Jabbar, Abdul, Pervaiz Akhtar, and Samir Dani. 2020. Real-time big data processing for instantaneous marketing decisions: A problematization approach. Industrial Marketing Management 90: 558–69. [Google Scholar] [CrossRef]
  52. Jeschke, Sabina, Christian Brecher, Tobias Meisen, Denis Özdemir, and Tim Eschert. 2017. Industrial Internet of Things and Cyber Manufacturing Systems. In Industrial Internet of Things. Cham: Springer, pp. 3–19. [Google Scholar] [CrossRef]
  53. Ladeira, Marcelo Bronzo, Marcos Paulo Valadares de Oliveira, Paulo Renato de Sousa, and Marcelo Werneck Barbosa. 2021. Firm’s supply chain agility enabling resilience and performance in turmoil times. International Journal of Agile Systems and Management 14: 224–53. [Google Scholar] [CrossRef]
  54. Lee, Jay, Behrad Bagheri, and Hung-An Kao. 2015. A cyber-physical systems architecture for Industry 4.0-based manufacturing systems. Manufacturing Letters 3: 18–23. [Google Scholar] [CrossRef]
  55. Li, Dun, Bangdong Zhi, Tobias Schoenherr, and Xiaojun Wang. 2023. Developing capabilities for supply chain resilience in a post-COVID world: A machine learning-based thematic analysis. IISE Transactions 55: 1256–76. [Google Scholar] [CrossRef]
  56. Lichtblau, Karl, Volker Stich, Roman Bertenrath, Matthias Blum, Martin Bleider, Agnes Millack, Katharina Schmitt, Edgar Schmitz, and Moritz Schroter. 2015. Impuls: Industrie 4.0 Readiness. Aachen and Cologne: VDMA’s IMPULS-Stiftung. [Google Scholar]
  57. Lin, Danping, Carman Lee, Henry Lau, and Yang Yang. 2018. Strategic response to Industry 4.0: An empirical investigation on the Chinese automotive industry. Industrial Management and Data Systems 118: 589–605. [Google Scholar] [CrossRef]
  58. Liu, Yang, Wei Fang, Taiwen Feng, and Na Gao. 2022. Bolstering green supply chain integration via big data analytics capability: The moderating role of data-driven decision culture. Industrial Management and Data Systems 122: 2558–82. [Google Scholar] [CrossRef]
  59. Machado, Carla Gonçalves, Mats Winroth, Dan Carlsson, Peter Almstrom, Victor Centerholt, and Malin Hallin. 2019. Industry 4.0 readiness in manufacturing companies: Challenges and enablers towards increased digitalization. Procedia CIRP 81: 1113–18. [Google Scholar] [CrossRef]
  60. Manyika, James, Michael Chui, Brad Brown, Jacques Bughin, Richard Dobbs, Charles Roxburgh, and Angela Hung Byers. 2011. Big Data: The Next Frontier for Innovation, Competition, and Productivity. San Francisco: McKinsey Global Institute, Report, June. [Google Scholar]
  61. Marcucci, Giulio, Sara Antomarioni, Filippo Emanuele Ciarapica, and Maurizio Bevilacqua. 2022. The impact of Operations and IT-related Industry 4.0 key technologies on organizational resilience. Production Planning & Control 33: 1417–31. [Google Scholar] [CrossRef]
  62. Masiero, Gilmar, Mario Henrique, Ailton Conde, and Marcelo Luiz. 2017. The global value chain of electric vehicles: A review of the Japanese, South Korean and Brazilian cases. Renewable and Sustainable Energy Reviews 80: 290–96. [Google Scholar] [CrossRef]
  63. Mettler, Tobias, and Roberto Pinto. 2018. Evolutionary paths and influencing factors towards digital maturity: An analysis of the status quo in Swiss hospitals. Technological Forecasting & Social Change 133: 104–17. [Google Scholar] [CrossRef]
  64. Miemczyk, Joe, Thomas E. Johnsen, and Monica Macquet. 2012. Sustainable purchasing and supply management: A structured literature review of definitions and measures at the dyad, chain and network levels. Supply Chain Management 17: 478–96. [Google Scholar] [CrossRef]
  65. Müller, Oliver, Maria Fay, and Jan vom Brocke. 2018. The Effect of Big Data and Analytics on Firm Performance: An Econometric Analysis Considering Industry Characteristics. Journal of Management Information Systems 35: 488–509. [Google Scholar] [CrossRef]
  66. Nisar, Qasim Ali, Nadia Nasir, Samia Jamshed, Shumaila Naz, Mubashar Ali, and Shahzad Ali. 2020. Big data management and environmental performance: Role of big data decision-making capabilities and decision-making quality. Journal of Enterprise Information Management 34: 1061–96. [Google Scholar] [CrossRef]
  67. Pereira, Carla Roberta, Martin Christopher, and Andrea Lago da Silva. 2014. Achieving supply chain resilience: The role of procurement. Supply Chain Management 19: 626–42. [Google Scholar] [CrossRef]
  68. Pettit, Timothy J. 2008. Supply Chain Resilience: Development of a Conceptual Framework, an Assessment Tool and an Implementation Process. Doctoral dissertation, The Ohio State University, Columbus, OH, USA; pp. 1–420. [Google Scholar]
  69. Pettit, Timothy J., Keely L. Croxton, and Joseph Fiksel. 2013. Ensuring supply chain resilience: Development and implementation of an assessment tool. Journal of Business Logistics 34: 46–76. [Google Scholar] [CrossRef]
  70. Pinto, Marcelo Rezende, Paula Karina Salume, Marcelo Werneck Barbosa, and Paulo Renato de Sousa. 2023. The path to digital maturity: A cluster analysis of the retail industry in an emerging economy. Technology in Society 72: 102191. [Google Scholar] [CrossRef]
  71. Ponomarov, Serhiy Y. 2012. Antecedents and Consequences of Supply Chain Resilience: A Dynamic Capabilities Perspective. Knoxville: University of Tennesse. [Google Scholar]
  72. Ponomarov, Serhiy Y., and Mary C. Holcomb. 2009. Understanding the concept of supply chain resilience. The International Journal of Logistics Management 20: 124–43. [Google Scholar] [CrossRef]
  73. Poppo, Laura, and Todd Zenger. 2002. Do formal contracts and relational governance function as substitutes or complements? Strategic Management Journal 23: 707–25. [Google Scholar] [CrossRef]
  74. Qader, Ghulam, Muhammad Junaid, Qamar Abbas, and Muhammad Shujaat Mubarik. 2022. Industry 4.0 enables supply chain resilience and supply chain performance. Technological Forecasting and Social Change 185: 122026. [Google Scholar] [CrossRef]
  75. Rad, Fakhreddin F., Pejvak Oghazi, and Maximilian Palmi. 2022. Industry 4.0 and supply chain performance: A systematic literature review of the benefits, challenges, and critical success factors of 11 core technologies. Industrial Marketing Management 105: 268–93. [Google Scholar] [CrossRef]
  76. Radomir, Läcrämioara, and Ovidiu Moisescu. 2019. Discriminant validity of the customer-based corporate reputation scale: Some causes for concern. Journal of Product & Brand Management 29: 457–469. [Google Scholar] [CrossRef]
  77. Reischauer, Georg. 2018. Industry 4.0 as policy-driven discourse to institutionalize innovation systems in manufacturing. Technological Forecasting and Social Change 132: 26–33. [Google Scholar] [CrossRef]
  78. Rialti, Riccardo, Giacomo Marzi, Cristiano Ciappei, and Donatella Busso. 2019. Big data and dynamic capabilities: A bibliometric analysis and systematic literature review. Management Decision 57: 2052–68. [Google Scholar] [CrossRef]
  79. Richey, Robert Glenn, Anthony S. Roath, Frank G. Adams, and Andreas Wieland. 2022. A responsiveness view of logistics and supply chain management. Journal of Business Logistics 43: 62–91. [Google Scholar] [CrossRef]
  80. Rinehart, Lloyd M., James A. Eckert, Robert B. Handfield, Thomas J. Page, Jr., and Thomas Atkin. 2004. An assessment of supplier-customer relationships. Journal of Business Logistics 25: 25–62. [Google Scholar] [CrossRef]
  81. Scholten, Kirstin, and Sanne Schilder. 2015. The role of collaboration in supply chain resilience. Supply Chain Management: An International Journal 20: 471–84. [Google Scholar] [CrossRef]
  82. Shan, Siqing, Yiting Luo, Yuan Zhou, and Yigang Wei. 2019. Big data analysis adaptation and enterprises’ competitive advantages: The perspective of dynamic capability and resource-based theories. Technology Analysis and Strategic Management 31: 406–20. [Google Scholar] [CrossRef]
  83. Shuradze, Giorgi, and Heinz-Theo Wagner. 2016. Towards a Conceptualization of Data Analytics Capabilities. Paper presented at the Hawaii International Conference on System Sciences (HICSS), Koloa, HI, USA, January 5–8. [Google Scholar]
  84. Siachou, Evangelia, Demetris Vrontis, and Eleni Trichina. 2020. Can traditional organizations be digitally transformed by themselves? The moderating role of absorptive capacity and strategic interdependence. Journal of Business Research 124: 408–21. [Google Scholar] [CrossRef]
  85. Simpson, Dayna F., and Damien J. Power. 2005. Use the supply relationship to develop lean and green suppliers. Supply Chain Management 10: 60–68. [Google Scholar] [CrossRef]
  86. Solano, Maria C., and Juan C. Cruz. 2024. Integrating Analytics in Enterprise Systems: A Systematic Literature Review of Impacts and Innovations. Administrative Sciences 14: 138. [Google Scholar] [CrossRef]
  87. Suhr, Diana. 2006. Exploratory or Confirmatory Factor Analysis. Cary: SAS Institute. [Google Scholar]
  88. Teece, David. 2007. Explicating dynamic capabilities: The nature and microfoundations of (sustainable) enterprise performance. Strategic Management Journal 28: 1319–50. [Google Scholar] [CrossRef]
  89. Teece, David, Gary Pisano, and Amy Shuen. 1997. Dynamic capabilities and strategic management. Strategic Management Journal 17: 509–33. [Google Scholar] [CrossRef]
  90. Tjahjono, Benny, Carlos Esplugues, Enrique Ares, and Gustavo Pelaez. 2017. What does Industry 4.0 mean to supply chain? Procedia Manufacturing 13: 1175–82. [Google Scholar] [CrossRef]
  91. Trkman, Peter, Kevin McCormack, Marcos Paulo Valadares de Oliveira, and Marcelo Bronzo Ladeira. 2010. The impact of business analytics on supply chain performance. Decision Support Systems 49: 318–27. [Google Scholar] [CrossRef]
  92. Vachon, Stephan, and Robert Klassen. 2006. Extending green practices across the supply chain. International Journal of Operations & Production Management 26: 795–821. [Google Scholar] [CrossRef]
  93. Valadares de Oliveira, Marcos Paulo, and Robert Handfield. 2018. Analytical foundations for development of real-time supply chain capabilities. International Journal of Production Research 57: 1571–89. [Google Scholar] [CrossRef]
  94. van der Vorst, J., and A. Beulens. 2002. Identifying sources of uncertainty to generate supply chain redesign and strategies. International Journal of Physical Distribution and Logistics Management 32: 409–30. [Google Scholar] [CrossRef]
  95. Van Hoek, Remko I., Alan Harrison, and Martin Christopher. 2016. Measuring Agile Capabilities in Supply Chain. International Journal of Operations & Production Management 21: 126–48. [Google Scholar] [CrossRef]
  96. Vera-Baquero, Alejandro, Ricardo Colomo-Palacios, and Owen Molloy. 2016. Real-time business activity monitoring and analysis of process performance on big-data domains. Telematics and Informatics 33: 793–807. [Google Scholar] [CrossRef]
  97. Wagire, Aniruddha Anil, Rohit Joshi, Ajay Pal Singh Rathore, and Rakesh Jain. 2021. Development of maturity model for assessing the implementation of Industry 4.0: Learning from theory and practice. Production Planning and Control 32: 603–22. [Google Scholar] [CrossRef]
  98. Wamba, Samuel Fosso, Angappa Gunasekaran, Shahriar Akter, Steven Ji-fan Ren, Rameshwar Dubey, and Stephen J. Childe. 2016. Big data analytics and firm performance: Effects of dynamic capabilities. Journal of Business Research 70: 356–65. [Google Scholar] [CrossRef]
  99. Wang, William Yu, and Yichuan Wang. 2020. Analytics in the era of big data: The digital transformations and value creation in industrial marketing. Industrial Marketing Management 86: 12–15. [Google Scholar] [CrossRef]
  100. Wang, Shiyong, Jiafu Wan, Di Li, and Chunhua Zhang. 2016a. Implementing Smart Factory of Industrie 4.0: An Outlook. International Journal of Distributed Sensor Networks 12: 3159805. [Google Scholar] [CrossRef]
  101. Wang, Yichuan, LeeAnn Kung, and Terry Anthony Byrd. 2016b. Big data analytics: Understanding its capabilities and potential benefits for healthcare organizations. Technological Forecasting and Social Change 126: 3–13. [Google Scholar] [CrossRef]
  102. Wieland, Andreas, and Carl Marcus Wallenburg. 2013. The influence of relational competencies on supply chain resilience: A relational view. International Journal of Physical Distribution & Logistics Management 43: 300–20. [Google Scholar] [CrossRef]
  103. Xu, Minghao, Yufei Zhang, Haoran Sun, Yuanxiu Tang, and Junjun Li. 2024. How digital transformation enhances corporate innovation performance: The mediating roles of big data capabilities and organizational agility. Heliyon 10: e34905. [Google Scholar] [CrossRef] [PubMed]
  104. Yang, Hui, Soundar Kumara, Satish T. S. Bukkapatnam, and Fugee Tsung. 2019. The internet of things for smart manufacturing: A review. IISE Transactions 51: 1190–216. [Google Scholar] [CrossRef]
  105. Yang, Xinying, Guanghong Gong, and Yuan Tian. 2008a. Optimal Game Theory in Complicated Virtual-Modeling and CGF Decision-Making with Multi-Granularities. Paper presented at the International Conference on Smart Manufacturing Application, Goyangi, Republic of Korea, April 9–11; pp. 95–99. [Google Scholar] [CrossRef]
  106. Yang, Xinying, Guanghong Gong, Yuan Tian, and Xiaoxia Yu. 2008b. Generalized Optimal Game Theory in Virtual Decision-Makings. Paper presented at the Chinese Control and Decision Conference, Yantai, China, July 2–4; pp. 1960–64. [Google Scholar] [CrossRef]
  107. Yao, Fang, and Yan Wang. 2020. Towards resilient and smart cities: A real-time urban analytical and geo-visual system for social media streaming data. Sustainable Cities and Society 63: 102448. [Google Scholar] [CrossRef]
  108. Zailani, Suhaiza, Kannan Govindan, Mohammad Iranmanesh, and Mohd Rizaimy Shaharudin. 2015. Green innovation adoption in automotive supply chain: The Malaysian case. Journal of Cleaner Production 108: 1115–22. [Google Scholar] [CrossRef]
  109. zur Muehlen, Michael, and Robert Shapiro. 2010. Business Process Analytics. In Handbook on Business Process Management 2, International Handbooks on Information Systems. Berlin: Springer, vol. 2, pp. 137–57. [Google Scholar] [CrossRef]
Figure 1. Types of latency and reaction time (adapted from Hackatorn (2002) and from zur Muehlen and Shapiro (2010)).
Admsci 14 00181 g001
Figure 2. Theoretical research model.
Admsci 14 00181 g002
Figure 3. Research model: path coefficients and R2 values.
Admsci 14 00181 g003
Figure 4. Two clusters using the K-means method.
Admsci 14 00181 g004
Table 1. Respondents’ and companies’ profiles.
DimensionClassificationNumber of Responses%
Working experience in the companyMore than 5 years23990.90
Between 3 and 5 years249.13
Position in the organizationDirector/manager of operations, logistics, and supply chain9134.6
CEO, general director, superintendent6022.8
Purchasing assistant/supervisor 4115.6
Operations, logistics, and supply chain assistant/supervisor3914.8
Financial assistant/supervisor134.94
Director/manager of marketing114.18
Director/commercial and sales manager83.04
Company’s positionDirect supplier of parts/modules or systems to automakers 16161.2
Supplier of parts/modules or systems to other suppliers in the automakers’ supply chain10238.8
Number of employees100 to 4994316.3
500 to 99913149.8
1000 or greater8933.8
Annual gross revenue (in US million dollars)More than USD 18 and less than USD 60 5420.5
More than USD 60 and less than or equal to USD 10010740.7
More than USD 100 and less than USD 140 186.84
More than USD 140 and less than USD 200 4115.6
More than USD 200 4316.3
Digital transformation journeyHas not initiated238.75
Less than 3 years2710.27
More than 3 and up to 5 years11242.6
More than 5 and up to 7 years145.32
More than 7 and up to 10 years269.89
More than 10 years6123.19
Area or department responsible for the digital transformation processCEO, general director,
superintendent
4931.6
Director/manager of operations,
logistics, and supply chain
4830.9
Operations, logistics, and
supply chain supervisor
3321.3
Financial assistant/supervisor138.3
Commercial and sales manager85.1
Purchasing assistant/supervisor42.5
None10841.1
Table 2. Cross-loading results.
Measurement ItemBDA CapabilitiesReaction TimeOrganizational
Resilience
BDAC 10.55920.23980.3818
BDAC 20.66390.47030.5462
BDAC 30.55140.37740.3848
BDAC 40.58680.33050.2311
BDAC 50.65760.24700.3620
BDAC 60.54220.25800.2664
BDAC 70.73010.45570.3726
BDAC 80.69860.53120.4932
BDAC 90.56550.49910.5160
BDAC100.83270.45430.4722
REA 10.66990.74720.5488
REA 20.41450.72850.6298
REA 30.51540.69300.5912
REA 40.27210.68860.3926
REA 50.41900.79420.5289
REA 60.33980.65690.4950
RES 10.50620.58130.7611
RES 20.63860.67300.7596
RES 30.48120.57530.8447
RES 40.39100.52560.7980
Table 3. Discriminant validity—heterotrait–monotrait ratio (HTMT) criterion values.
BDA CapabilitiesReaction TimeOrganizational
Resilience
BDA capabilities
Reaction time0.69
Organizational resilience0.750.90
Table 4. Coefficients of determination (R2).
Path(R2)(Adjusted R2)
BDA capabilities -> reaction time0.4060.404
Reaction time -> organizational resilience0.5660.564
Table 5. Hypothesis 1 and Hypothesis 2 test results for the proposed model.
HypothesisRelationshipsPath
Coefficients
t-ValuesHypothesis Supported
H1BDA capabilities -> reaction time0.63712.959Yes
H2 Reaction time -> organizational resilience0.75227.436Yes
Table 6. Effect size (ƒ2 test).
Construct NameReaction TimeOrganizational Resilience
BDA capabilities0.6845-
Reaction time-1.3019
Table 7. Supplier position in the automaker supply chain (first-tier x indirect suppliers).
ConstructsClusterSizeMedianp-Value
BDA capabilitiesOEM direct supplier 1603.600.475
OEM indirect supplier1033.90
Reaction timeOEM direct supplier1604.17<0.001
OEM indirect supplier1033.83
Organizational resilienceOEM direct supplier1604.25<0.001
OEM indirect supplier1033.75
Table 8. Characterization of clusters by Industry 4.0 journey time.
Duration of Digital
Transformation Journey
Cluster 1 (n = 161)Cluster 2 (n = 102)
n%n%
Not initiated2314.2900.00
Less than 3 years1911.8087.84
More than 3 and up to 5 years8351.552928.43
More than 5 and up to 7 years84.9765.88
More than 7 and up to 10 years74.351918.63
More than 10 years2113.044039.22
Table 9. Characterization of clusters by an average score of the intensity of absorption of I4.0 smart manufacturing technologies.
Average Score of the Intensity of Absorption of Smart Manufacturing Technologies of I4.0 (1–5)Cluster 1
(n = 161) (%)
Cluster 2
(n = 102) (%)
1 to 20%0%
2 to 323%0%
3 to 477%63%
4 to 50%37%
Table 10. Median differences between respondent groups (cluster 1 and cluster 2).
ConstructsClusterSizeMedianp-Value
BDA capabilities11613.50<0.001
21024.25
Reaction time11613.83<0.001
21024.17
Organizational resilience11614.00<0.001
21024.50
Disclaimer/Publisher’s Note: The statements, opinions and data contained in all publications are solely those of the individual author(s) and contributor(s) and not of MDPI and/or the editor(s). MDPI and/or the editor(s) disclaim responsibility for any injury to people or property resulting from any ideas, methods, instructions or products referred to in the content.

