Abstract
While outside chief executive officers (CEOs) are often viewed as catalysts for strategic change compared to their inside counterparts, this study reveals their potential to undermine firms’ environmental responsibility. Integrating agency theory with social capital theory, we investigate whether and how board-level social capital can moderate the sustainability risks associated with outside CEO succession. Using a panel dataset of 989 pollution-intensive Chinese firms from 2010 to 2022, we apply propensity score matching (PSM) to reduce endogeneity in CEO succession decisions, followed by fixed-effects regressions. The empirical results show that outside CEOs, particularly during their early tenure, are more likely to prioritize short-term financial performance over environmental goals—due to limited firm-specific knowledge and heightened external pressure. However, external board social capital (e.g., ties to government and industry associations) enhances resource access and post-appointment accountability, while internal social capital (e.g., co-working experience among directors) establishes common norms that facilitate strategic continuity. This study positions board social capital as a relational governance mechanism that complements formal oversight. The findings contribute to succession and environmental research by linking executive origin to sustainability outcomes and provide practical guidance on leveraging board networks to support leadership transitions.
1. Introduction
As China intensifies environmental enforcement through initiatives such as the Environmental Protection “Frontrunner” System (2015) and the Blue-Sky Protection Campaign (2018–2020), pollution-intensive firms face a leadership dilemma: balancing environmental responsibility with financial performance. This tension intensifies during CEO transitions, when strategic adjustments, short-term performance pressure, and heightened stakeholder expectations increase the complexity of decision-making.
A key dimension of CEO succession lies in whether the new leader is promoted from within or hired externally, raising the question of whether outside CEOs are more hesitant about environmental responsibility than inside CEOs. While outside CEOs often drive strategic change (Karaevli & Zajac, 2013), innovation (Cucculelli, 2018), and firm performance (Georgakakis & Ruigrok, 2017), they typically lack firm-specific expertise (Cummings & Knott, 2018), historical context, and the stakeholder networks required to address environmental issues. As a result, they face a steeper learning curve. Moreover, short-term performance pressures from shareholders (Hutzschenreuter et al., 2012; D. Li et al., 2017) may push outside CEOs toward symbolic compliance (e.g., greenwashing) rather than substantive environmental investments. This trend might be magnified in China, where environmental initiatives are generally positively related to firm performance (Akbar et al., 2021; Gao et al., 2023; J. Wang et al., 2021; X. Zhang et al., 2023), but impose immediate financial costs (Song et al., 2017), leading investors to prioritize profitability over sustainability (Guo et al., 2020; J. Meng & Zhang, 2022). Therefore, we posit that outside CEOs are less engaged in environmental responsibility than internally promoted CEOs.
The board, as a core governance mechanism for oversight and resource provision, has been widely studied through characteristics such as board independence (Alves, 2023; De Villiers et al., 2011), board diversity (Orij et al., 2021; Zhu & Shen, 2016), and interlock effects (Ding et al., 2021; Maswadi & Amran, 2023). Recent studies highlight the important governance role of board social capital (García-Gómez et al., 2023; Jebran et al., 2022; Reguera-Alvarado & Bravo-Urquiza, 2022). In this study, we propose that board social capital may shape the role of outside CEOs because it can effectively relieve agency problems (Hoi et al., 2019; Javakhadze et al., 2016). Drawing on social capital theory, we argue that boards operate as relational networks that facilitate strategic coordination (Adler & Kwon, 2002) and constrain outside CEO discretion (Hoi et al., 2019; Sauerwald et al., 2016), leading to better strategic decisions (Tian et al., 2011). Externally, ties to regulators, industry associations, and peer firms improve information access (Adler & Kwon, 2002; Pfeffer & Salancik, 2015; Tian et al., 2011; Z. Wang et al., 2019) to facilitate candidate screening and impose accountability through stakeholder visibility and benchmarking pressures (Baah et al., 2021; Konadu et al., 2020). Internally, directors’ shared experience fosters tacit knowledge and organizational memory (Abbas et al., 2024; Adler & Kwon, 2002; Inkpen & Tsang, 2016; Pfeffer & Salancik, 2015; Wood et al., 2021), which provide the informational foundation for strategic continuity. These experiences also cultivate informal norms that shape behavioral expectations and reinforce alignment with long-term goals. In China’s relational governance context, these effects are amplified by collectivist values and reciprocity-based expectations. Accordingly, board social capital complements formal oversight and helps mitigate the environmental risks associated with outside CEO appointments.
While prior research has examined the financial outcomes of outside CEO succession (G. Chen & Hambrick, 2012; Georgakakis & Ruigrok, 2017), its implications for non-financial domains such as environmental responsibility remain underexplored. Moreover, few studies consider how governance mechanisms, such as board social capital, may buffer these effects, particularly in emerging market contexts.
This study aims to examine whether outside-appointed CEOs are less committed to environmental responsibility than inside-promoted ones and how board social capital moderates this relationship. To test our hypotheses, we construct a panel dataset of 989 A-share listed firms in pollution-intensive industries in China, covering the period from 2010 to 2022. We employ PSM to address potential selection bias in CEO appointments and use fixed-effects regressions to estimate the main and moderating effects. This study contributes to CEO succession and environmental governance research by revealing outside CEOs’ hesitation about environmental responsibility. It explores how firms balance short-term pressures with long-term commitments through internal alignment and external networks, highlighting the role of board social capital in emerging economies.
2. Literature Review
2.1. CEO Influence on Environmental Responsibility
CEO characteristics shape firms’ environmental strategies. Prior studies report mixed effects of CEO succession: some suggest it enhances corporate sustainability initiatives (Bernard et al., 2018; Gu et al., 2021), while others find no significant link (X. H. Meng et al., 2013). The influence of CEO power and tenure is similarly nuanced—powerful CEOs may either support or neglect environmental efforts (Francoeur et al., 2021; Gull et al., 2023), and longer tenure tends to dampen environmental performance (Khan et al., 2020). In contrast, newly appointed CEOs focus more on environmental initiatives as a strategy to build reputations early in their tenure (Al-Shaer et al., 2023).
Background-specific expertise emerges as a key factor. CEOs with environmental expertise mitigate liability and improve environmental performance (X. Li et al., 2024; Walls & Berrone, 2017). Broader education (e.g., MBA degrees) and functional experience (e.g., research and development [R&D], finance, marketing) enhance CEOs’ innovation and insight capacity to align sustainability with stakeholder expectations (H. Huang et al., 2023; Shahab et al., 2020; Zhou et al., 2021). International exposure links to better sustainability performance by transferring advanced practices from global markets (Quan et al., 2021; Y. Wang et al., 2022).
2.2. Outside CEO Succession: Strategic Catalyst or Disruptive Force?
The choice between inside and outside CEO succession hinges on strategic context. Firms opt for outside CEOs to drive strategic change (Jalal & Prezas, 2012), overcome performance crises (Barron et al., 2011; Jalal & Prezas, 2012), or compensate for weak internal talent pools (Agrawal et al., 2006). Outsiders bring novel knowledge (Cucculelli, 2018; Ramachandran, 2018) and signal strategic renewal to investors (Connelly et al., 2016). However, from an agency theory lens, outsiders may prioritize personal interests over those of the firm (Davidson et al., 2002).
Empirical evidence is divided into competing perspectives. On one hand, compared to inside CEOs embedded in social networks that entrench strategic inertia (Karaevli & Zajac, 2013), outside CEOs disrupt inertia through novel frameworks (Cucculelli, 2018; Ramachandran, 2018) and possess rich experience (e.g., engagement with board diversity) to enhance performance (Georgakakis & Ruigrok, 2017). On the other hand, outside CEOs often exacerbate information asymmetry (Y. Zhang, 2008) and disrupt organizational stability (Y. Zhang & Rajagopalan, 2004), which may amplify performance volatility (Quigley et al., 2019). Their limited firm-specific expertise impedes innovation as it hinders efficient resource allocation (Cummings & Knott, 2018).
2.3. Board Social Capital
The board functions both as a monitoring body (agency theory) and a strategic resource provider (resource dependence theory). It is influenced by social capital, which refers to the relational assets embedded in directors’ internal and external networks (Haynes & Hillman, 2010; Hillman & Dalziel, 2003; Kim & Cannella, 2008). Social capital theory describes two interdependent dimensions: external (“bridging”) capital—derived from interlocking directorships and industry ties—and internal (“bonding”) capital—rooted in shared tenure and norms among directors (Abbas et al., 2024; Adler & Kwon, 2002; Inkpen & Tsang, 2016; Kim & Cannella, 2008; Pfeffer & Salancik, 2015; Tian et al., 2011; Wood et al., 2021).
2.3.1. Board External Social Capital
Board external social capital serves as a strategic channel for resource acquisition and governance effectiveness. By holding central positions in these networks, boards foster collaboration and resource mobilization (Z. Wang et al., 2019) while attracting elite directors who strengthen monitoring (Sauerwald et al., 2016). Interlocking directorates provide valuable information flows that support CEOs in R&D decisions (H. L. Chen et al., 2013) and financial planning (Jebran et al., 2022; Kim & Cannella, 2008; Pérez-Calero et al., 2016). Industry-embedded ties deepen industry-specific expertise (Kor & Misangyi, 2008), driving firm growth (Kor & Sundaramurthy, 2009), innovation (Klarner et al., 2020), and environmental management (Shui et al., 2022). These networks also promote strategic alliances (Bicen et al., 2021), advanced management practices (Barroso-Castro et al., 2011), and secure critical financial capital (Uzzi & Gillespie, 2002). However, the benefits are influenced by CEO power: while external ties mitigate corporate social responsibility (CSR) gaps (Ferraris et al., 2024), powerful CEOs may co-opt these networks to suppress CSR initiatives (Muttakin et al., 2018).
In addition, external ties entail governance trade-offs: multiple directorships lead to role overload, reducing monitoring effectiveness (Fich & Shivdasani, 2006), while politically embedded boards might suppress CSR disclosure to protect reputational interests (Maswadi & Amran, 2023; Ramón-Llorens et al., 2019). Notably, while powerful CEOs exploit external connections to expand financial discretion (Sauerwald et al., 2016), robust external capital constrains managerial opportunism by limiting CEO rent extraction (Hoi et al., 2019), mitigating crash risks (Jebran et al., 2022), and elevating CSR reporting standards (Reguera-Alvarado & Bravo-Urquiza, 2022).
2.3.2. Board Internal Social Capital
Board internal social capital enhances governance efficacy by fostering trust and cohesion. These “bonding” ties improve the quality of strategic advice (Tian et al., 2011) and reduce coordination costs, serving as a crucial compensatory resource when external networks are constrained (Barroso-Castro et al., 2016). Shared norms and values promote aligned expectations and commitments among directors, helping to mitigate agency problems such as excessive CEO returns (Hoi et al., 2019; Sauerwald et al., 2016). However, these benefits may be weakened when powerful CEOs manipulate information flows or influence monitoring norms to serve their own interests (Sauerwald et al., 2016).
While internal cohesion generally mitigates agency risks, excessive familiarity or board homogeneity risks strategic inertia (Haynes & Hillman, 2010) and groupthink (D. A. Harris & Helfat, 2007). Some studies link dense internal ties to heightened stock crash risks (Jebran et al., 2022). Nonetheless, such dysfunctions remain marginal in practice due to limited board interaction frequency, emerging only when internal social capital reaches exceptionally high levels (Barroso-Castro et al., 2016).
3. Hypothesis Development
3.1. Outside CEOs and Environmental Responsibility
Outside succession is characterized by heightened information asymmetry and misaligned incentives (Pepper & Gore, 2015). Unlike inside CEOs, whose career paths are aligned with long-term organizational goals, outside CEOs often face pressure to deliver immediate financial outcomes. To mitigate agency risks, boards commonly impose short-term metrics (Y. Zhang & Rajagopalan, 2010), which may lead outside CEOs to prioritize short-term financial performance at the expense of long-term environmental sustainability—an effect further reinforced by investor expectations (J. Meng & Zhang, 2022; Y. Zhang & Rajagopalan, 2010). Moreover, early-tenure insecurity exacerbates this tendency, diverting resources from environmental initiatives toward immediate financial gains.
Inside CEOs are embedded in strong relational networks, including ties with predecessors, directors, and key stakeholders, which enhance their commitment to existing strategic priorities. These relational ties foster normative accountability, increasing the costs associated with deviating from sustainability commitments. Given that social network embeddedness is a key driver of executives’ commitment to social responsibility (Chahine et al., 2019, 2021; Muttakin et al., 2018; L. Wang et al., 2023), outside CEOs lacking such connections typically face less pressure to uphold environmental commitments. They tend to have greater strategic flexibility, which may lead to the termination or downsizing of environmental responsibility initiatives.
Effective environmental governance necessitates diverse expertise to navigate operational complexities and regulatory uncertainties. However, outside hires often experience a competency gap, as their prior managerial experience may not align with the firm’s specific environmental challenges. Even high-performing outside CEOs may struggle to integrate environmental considerations into corporate strategy, as success in previous roles does not guarantee an understanding of the focal firm’s unique environmental needs. In contrast, inside CEOs can leverage organizational memory and tacit knowledge (Y. Zhang & Rajagopalan, 2010) to promote sustainable environmental governance.
Hypothesis 1.
Outside CEOs exhibit lower environmental responsibility than inside CEOs.
3.2. Board Social Capital as a Governance Moderator
3.2.1. External Board Social Capital: Resource Access and Accountability
Boards endowed with strong external social capital shape CEO behaviors through access to strategic resources and accountability mechanisms.
During CEO selection, external social capital provides boards with exclusive and up-to-date insights into potential candidates (Tian et al., 2011). Given the confidential nature of CEO hiring decisions, information from trusted sources, such as elite connections, is particularly valuable. These external ties act as a “window” to the broader perspective, offering reputational insights and strategic information (Perry & Peyer, 2005; Pfeffer & Salancik, 2015), enhancing firm value (Perry & Peyer, 2005) and reducing scanning costs. Directors with cross-industry experience are better equipped to make informed hiring decisions (Tian et al., 2011), while reputational signals help filter out candidates prone to symbolic compliance. This reduces information asymmetry (Fogel et al., 2018), aligning the interests of the new CEO and the board (Wiersema et al., 2018).
CEO evaluation is a specialized governance function requiring industry-specific expertise and privileged access to strategic data—competencies uniquely held by the board (Charan, 2005). Directors with external ties are better positioned to develop this expertise (Tian et al., 2011); their broader understanding of corporate strategy, execution, and performance metrics enables them to set clear standards for new hires. In the post-appointment phase, boards with strong external social capital can institutionalize environmental accountability. First, they activate reputational feedback loops by benchmarking environmental performance against industry leaders and exposing CEOs to scrutiny from external stakeholders (Baah et al., 2021; Konadu et al., 2020). Second, they translate external market signals into measurable incentive structures tied to environmental outcomes. This promotes long-termism by embedding environmental responsibility into performance evaluation frameworks.
Simultaneously, external social capital improves firms’ access to resources such as green subsidies or regulatory support, which can reduce the financial burden of early-stage sustainable initiatives. By staying attuned to evolving policy regimes, stakeholder expectations, and industry innovations, externally connected boards enhance environmental adaptability and reduce strategic uncertainty faced by outside CEOs.
Hypothesis 2.
The negative relationship between outside CEOs and environmental responsibility is attenuated when boards possess higher external social capital.
3.2.2. Internal Board Social Capital: Internal Cohesion for Strategic Continuity
Internal social capital supports strategic continuity through information support. Directors’ long co-working experience enhances board effectiveness by fostering tacit knowledge transfer and deep understanding of each member’s competencies, enabling efficient information flows and integration (Haynes & Hillman, 2010). For outside CEOs, such internal capital is the main channel for understanding the firm’s unique strategic challenges—a task poorly served by secondary data sources. During leadership transitions, boards lacking co-working experience may issue generic mandates misaligned with the firm’s needs, whereas cohesive boards leverage institutional memory to rapidly transfer decision insights (Tian et al., 2011). By embedding newcomers in the firm’s ‘strategic DNA’, they accelerate CEO learning curves and reduce implementation risks for environment initiatives.
Beyond knowledge sharing, internal social capital shapes executive behavior through shared expectations and informal peer influence. Directors with strong internal bonds tend to share a collective identity and implicit expectations, reducing uncertainty and transaction costs (Ahearne et al., 2014). These shared norms allow boards to pressure CEOs to align with long-term environmental commitments (D. A. Harris & Helfat, 2007; Pfeffer & Salancik, 2015). Cohesive boards may even impose informal penalties for actions that deviate from expected behaviors, such as excluding CEOs from critical decisions (L. Zhang et al., 2011), thereby reinforcing sustainability norms.
Internal cohesion is particularly important when outside CEOs, driven by performance-based incentives and pressure for quick results, may prioritize short-term financial targets. However, cohesive boards promote a unified, long-term stance on environmental responsibility practices. By supporting such initiatives with delayed returns, the board helps embed sustainability goals into the firm’s strategic agenda, thereby alleviating agency concerns and ensuring governance continuity (Hoi et al., 2019).
Hypothesis 3.
The negative relationship between outside CEOs and environmental responsibility is attenuated when boards possess higher internal social capital.
Figure 1 presents the theoretical framework that integrates the proposed hypotheses.
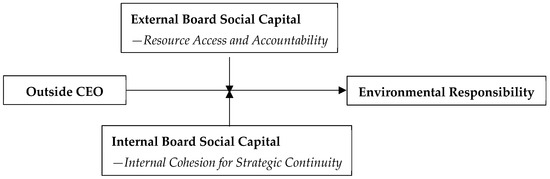
Figure 1.
Theoretical framework.
4. Research Design
4.1. Samples and Data
This study uses a panel dataset of Chinese A-share listed firms (2010–2022). Data on CEO turnover, financials, and environment performance are primarily sourced from the China Stock Market and Accounting Research (CSMAR) database, with data for outside CEOs not included in CSMAR manually collected from reliable online sources such as company websites and disclosure platforms. The sample is restricted to firms in pollution-intensive industries based on the 2012 industry classification issued by the China Securities Regulatory Commission (see Table 1 for industry distribution). This focus enhances construct validity, as environmental outcomes in these industries are subject to stricter disclosure requirements and are more likely to reflect CEO-level strategic decisions. After excluding firms with missing data or those labeled as ST/PT, the final sample comprises 8395 firm-year observations from 989 firms, documenting 926 CEO successions (213 outside and 713 inside).

Table 1.
Industry distribution.
4.2. Variables
Dependent Variable
Environmental Responsibility
Referring to Henri and Journeault (2008), environmental responsibility (ER) is measured across three dimensions: green management, green investment, and green outcomes (sum in Table 2). Each item is selected based on prior studies, including environmental information disclosure (X. H. Meng et al., 2013), environmental certification (M. Wang et al., 2021), green training (Yafi et al., 2021), environmental investments (R. Li & Ramanathan, 2020), environmentally desirable waste treatment (Ríos & Picazo-Tadeo, 2021), and eco-friendly product innovation (Arena et al., 2018). Disclosure is scored as follows: 2 for quantitative disclosure, 1 for general mention, and 0 for no disclosure (X. H. Meng et al., 2013; Wiseman, 1982; Zeng et al., 2010).
Table 2.
Measurements of environmental responsibility.
This disclosure-based measure is commonly used in research on Chinese firms (D. Li et al., 2017; J. Meng & Zhang, 2022; X. H. Meng et al., 2013; Zeng et al., 2010), where long-term, firm-level environmental performance data remain limited. While disclosure data may partly reflect symbolic compliance, their structured format and broad availability offer a practical and comparable basis for measuring environmental engagement across firms and over time. To reduce potential bias, we distinguish between general and quantitative disclosure in the scoring scheme. Additionally, we conduct robustness checks using each subdimension separately (see Section 5.5.1).
Independent Variables
Outside CEO
An Outside CEO is defined as a CEO who joined the firm within 2 years prior to succession, coded as 1; otherwise, it is coded as 0 (D. Harris & Helfat, 1997; Zhu & Shen, 2016).
Board Social Capital
External board social capital (Ex_socialcapital) is measured as the ratio of the total number of external directorships held by a firm’s board members to the board’s total size. By normalizing the number of external directorships by board size, this measure accounts for inter-firm variation in board composition and ensures comparability across firms. It reflects the extent to which board members hold concurrent positions on the boards of other firms, indicating the board’s structural embeddedness in the broader inter-organizational network. This proxy follows prior research that measures board social capital through directors’ external appointments (Barroso-Castro et al., 2016; Kiel & Nicholson, 2006). It offers a replicable and scalable measure of external structural connectedness suitable for large-sample empirical studies.
Internal board social capital (In_socialcapital) is defined based on the shared working experience of the board of directors (Tian et al., 2011). Consistent with previous research (Barkema & Shvyrkov, 2007; Tian et al., 2011), it is calculated as the directors’ overlapping board tenures, using the following formula where ui is the term of office of the i-th director, and n is the number of times ui and uj are compared pairwise. This approach captures the structural familiarity among board members, which reflects the degree of internal cohesion and trust.
Control Variables
We incorporate control variables related to CEO attributes, firm characteristics, and external factors. CEO age is included, as the young tend to prioritize sustainability (Shahab et al., 2020). CEOs’ education and green experience shape their environment strategy (Hu & Shi, 2025; R. Huang & Wei, 2023; X. Li et al., 2024; Zhou et al., 2021). CEO-chairman duality—a proxy for CEO power—has been associated with firms’ environmental performance (Francoeur et al., 2021). Firm size is added as larger firms invest more in ESG due to economies of scale and stakeholder expectations (Bissoondoyal-Bheenick et al., 2023). State ownership (SOE) is included due to policy support and strong environmental commitments (K. Zhang et al., 2023). Leverage (Lev) captures financial risk, as CEO turnover is more common in financially distressed firms (Jostarndt & Sautner, 2008). The growth rate of operating income (Growth) affects resource and capability allocation (O’Cass & Sok, 2014), potentially influencing corporate environmental impact. Free cash flow and Institutional ownership (INST) are considered, as they separately affect managerial discretion and impose pressure on CSR (X. Chen et al., 2016; Harjoto et al., 2017). Regional marketization (Market) and the Herfindahl–Hirschman Index (HHI) capture the regulatory landscape and market dynamics. Year and Industry account for macroeconomic and sectoral factors. Table 3 provides variable measurements.
Table 3.
Summary of Variables.
4.3. Models
Model 1 estimates the Environmental responsibility (ER) of firm i in year t as a function of the Outside CEO and control variables (Controls). Models 2 and 3 examine the moderating effects of external (Ex_socialcapital) and internal board social capital (In_socialcapital). All models incorporate year (η) and industry (λ) fixed effects to control for time- and sector-level heterogeneity, with clustered standard errors at the firm level (ε) to account for serial correlation and heteroskedasticity in panel data.
Model 1: ERit = β0 + β1(Outside CEO)it + β2(Controls)it + ηi + λt + εit
Model 2: ERit = β0 + β1(Outside CEO)it + β2(Ex_socialcapital)it + β3(Outside CEO × Ex_socialcapital)it +β4(Controls)it + ηi + λt + εit
Model 3: ERit = β0 + β1(Outside CEO)it + β2(In_socialcapital)it + β3(Outside CEO × In_socialcapital)it +β4(Controls)it + ηi + λt + εit
5. Results and Analysis
5.1. Endogeneity Concerns and PSM Model
We use the PSM method (Rosenbaum & Rubin, 1983) to address potential selection bias in CEO succession. Firms that appoint outside CEOs may differ systematically from those that promote internally in terms of size, ownership type, governance structure, or past performance. These differences could affect environmental responsibility outcomes. PSM helps construct a matched sample based on observable firm characteristics, improving the internal validity of the comparison.
First, we estimate a logit model to predict the probability of outside selection based on firm characteristics (size, growth, leverage, age, loss, violations) and governance factors (board size, independent director ratio) (Cummings & Knott, 2018; Liu, 2023). We then match outside CEOs (treatment) to inside CEOs (control) based on their respective years of succession using nearest-neighbor matching (caliper = 0.10, 3:1 ratio; (Austin, 2011; Quan et al., 2021)).
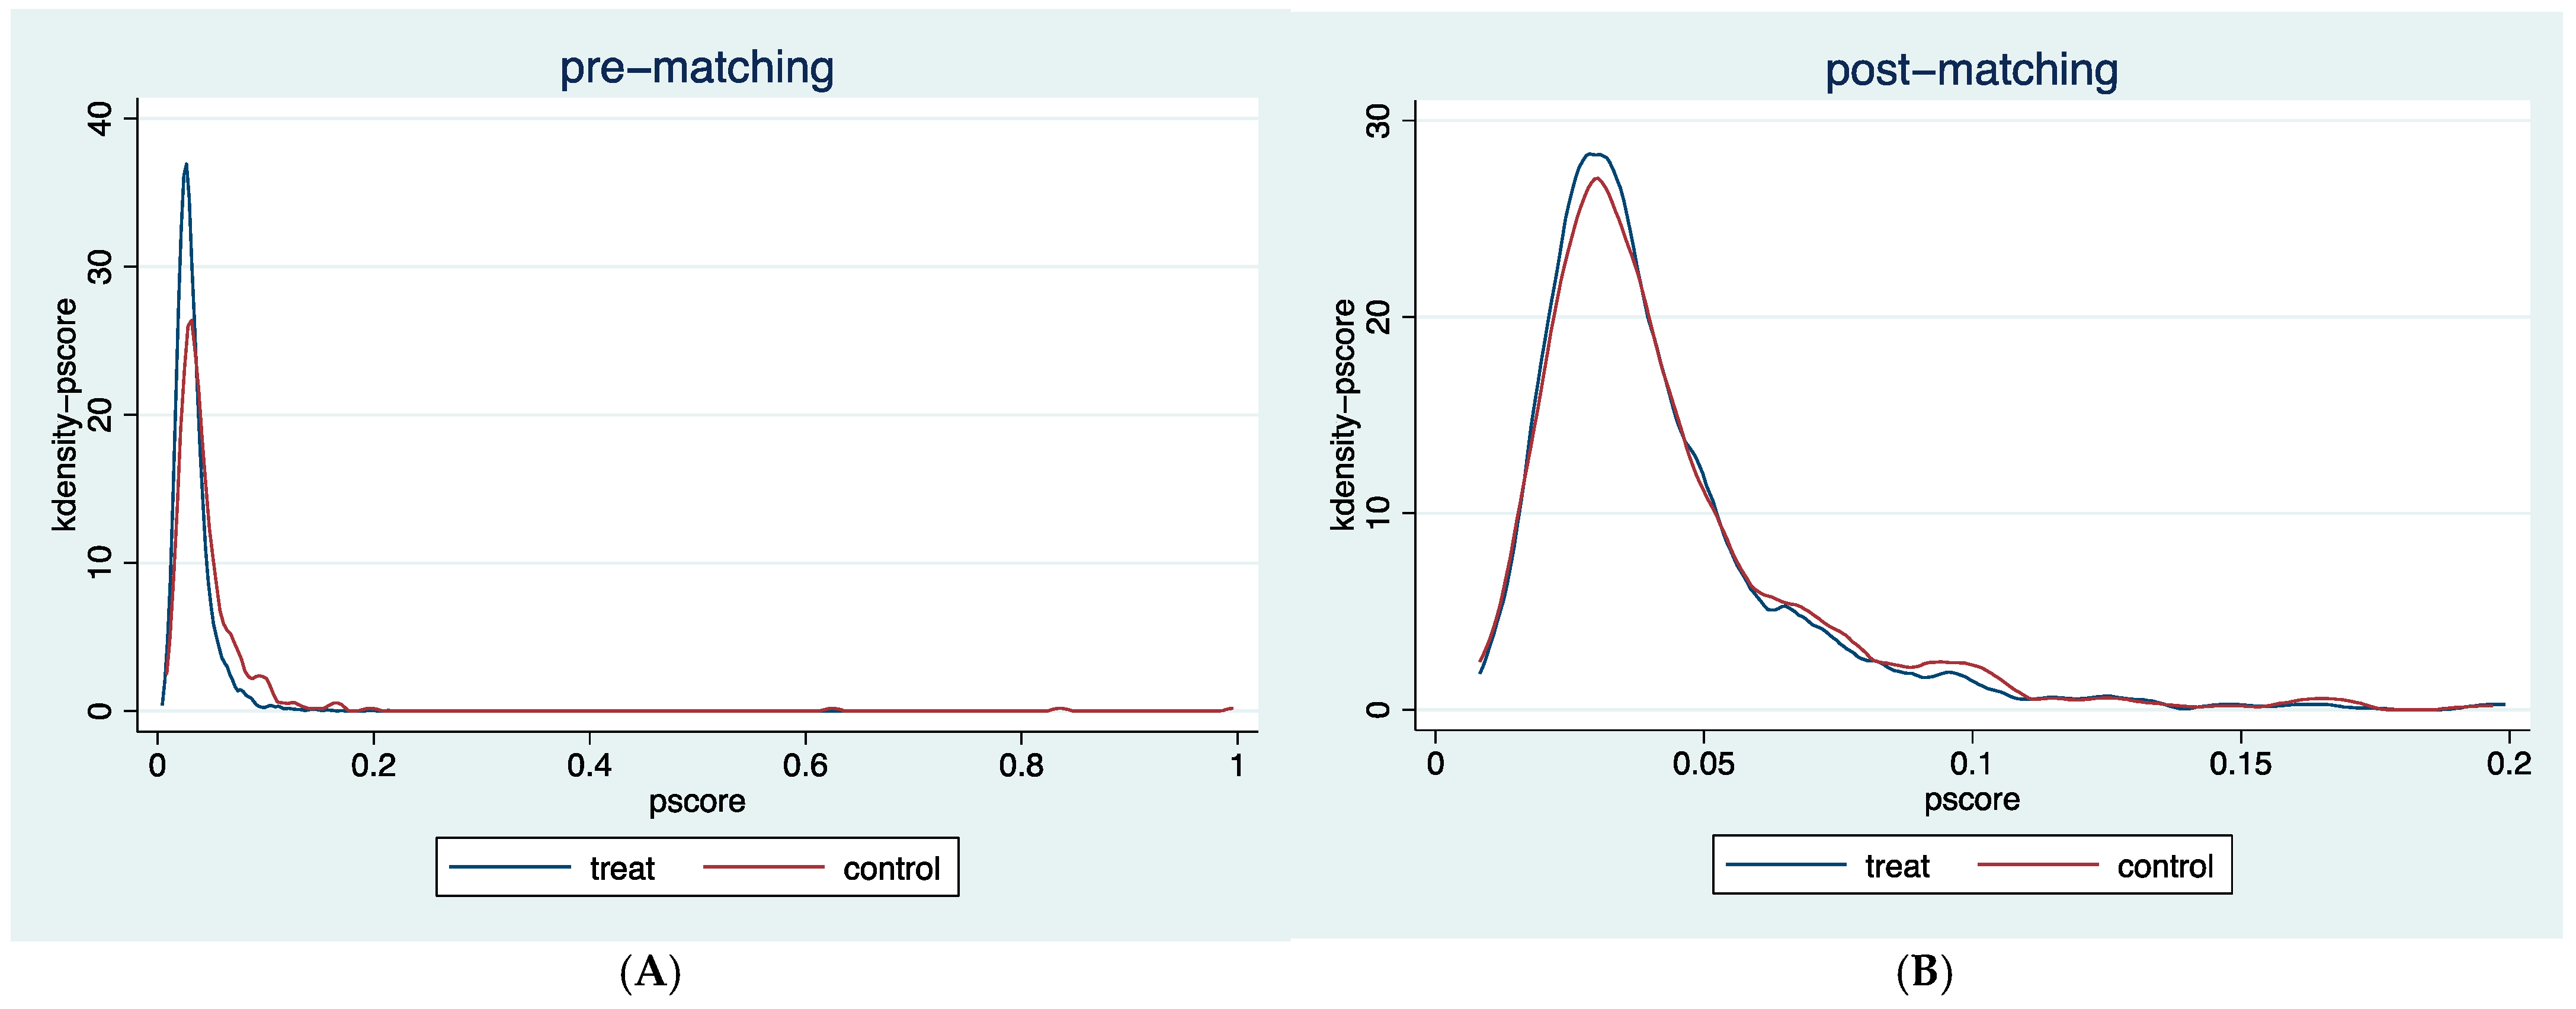
Table 4 shows a significant average treatment effect (ATT) (t-test = −1.97, p < 0.05), while Table 5 and Figure 2 show reduced biases (below 10%). Figure 3 presents kernel density plots, showing closer distributions between the treatment and control groups. These collectively confirm the effectiveness of the PSM model.
Table 4.
PSM: The average treatment effect of outside CEO.
Table 5.
Pre- and post-match bias reduction (%).
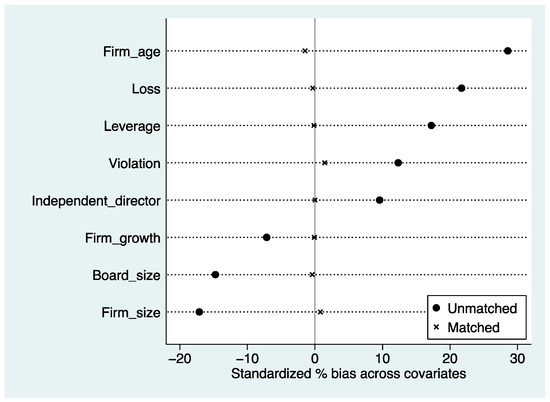
Figure 2.
Balance test before and after PSM.
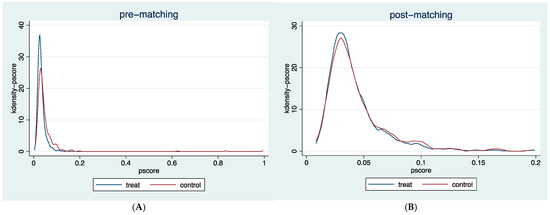
Figure 3.
The plot of propensity scores between samples before (A) and after (B) PSM.
5.2. Descriptive Statistics
Table 6 shows that the differences in variables are mitigated by PSM, and variance inflation factors (VIFs) are well below the threshold of 10 (Ryan, 2008), indicating that multicollinearity is not a significant concern in our analysis. Table 7 presents the correlation coefficients between variables after PSM.
Table 6.
Descriptive statistics.
Table 7.
Correlation matrix (matched sample).
5.3. Empirical Results
5.3.1. Outside CEO and Environmental Responsibility
Table 8 presents the main regression results. To examine the impact of outside CEOs on environmental responsibility, we conduct yearly regressions within a 3-year window. Results show that compared to internal succession, environmental responsibility significantly declines after outside succession, with the strongest effect in the first three years (Model 1: β = −0.1024, p < 0.01; Model 2: β = −0.0935, p < 0.01; Model 3: β = −0.0767, p < 0.01). Results for the matched sample confirm robustness after PSM (Model 5: β = −0.1346, p < 0.01; Model 6: β = −0.1060, p < 0.01; Model 7: β = −0.1013, p < 0.01). The findings indicate that the negative relationship between outside CEOs and environmental responsibility weakens over time and largely disappears after the third year. Therefore, Hypothesis 1 is supported: outside CEOs exhibit lower environmental responsibility than inside CEOs.
Table 8.
Regression results of outside CEO on environmental responsibility.
5.3.2. Board Social Capital
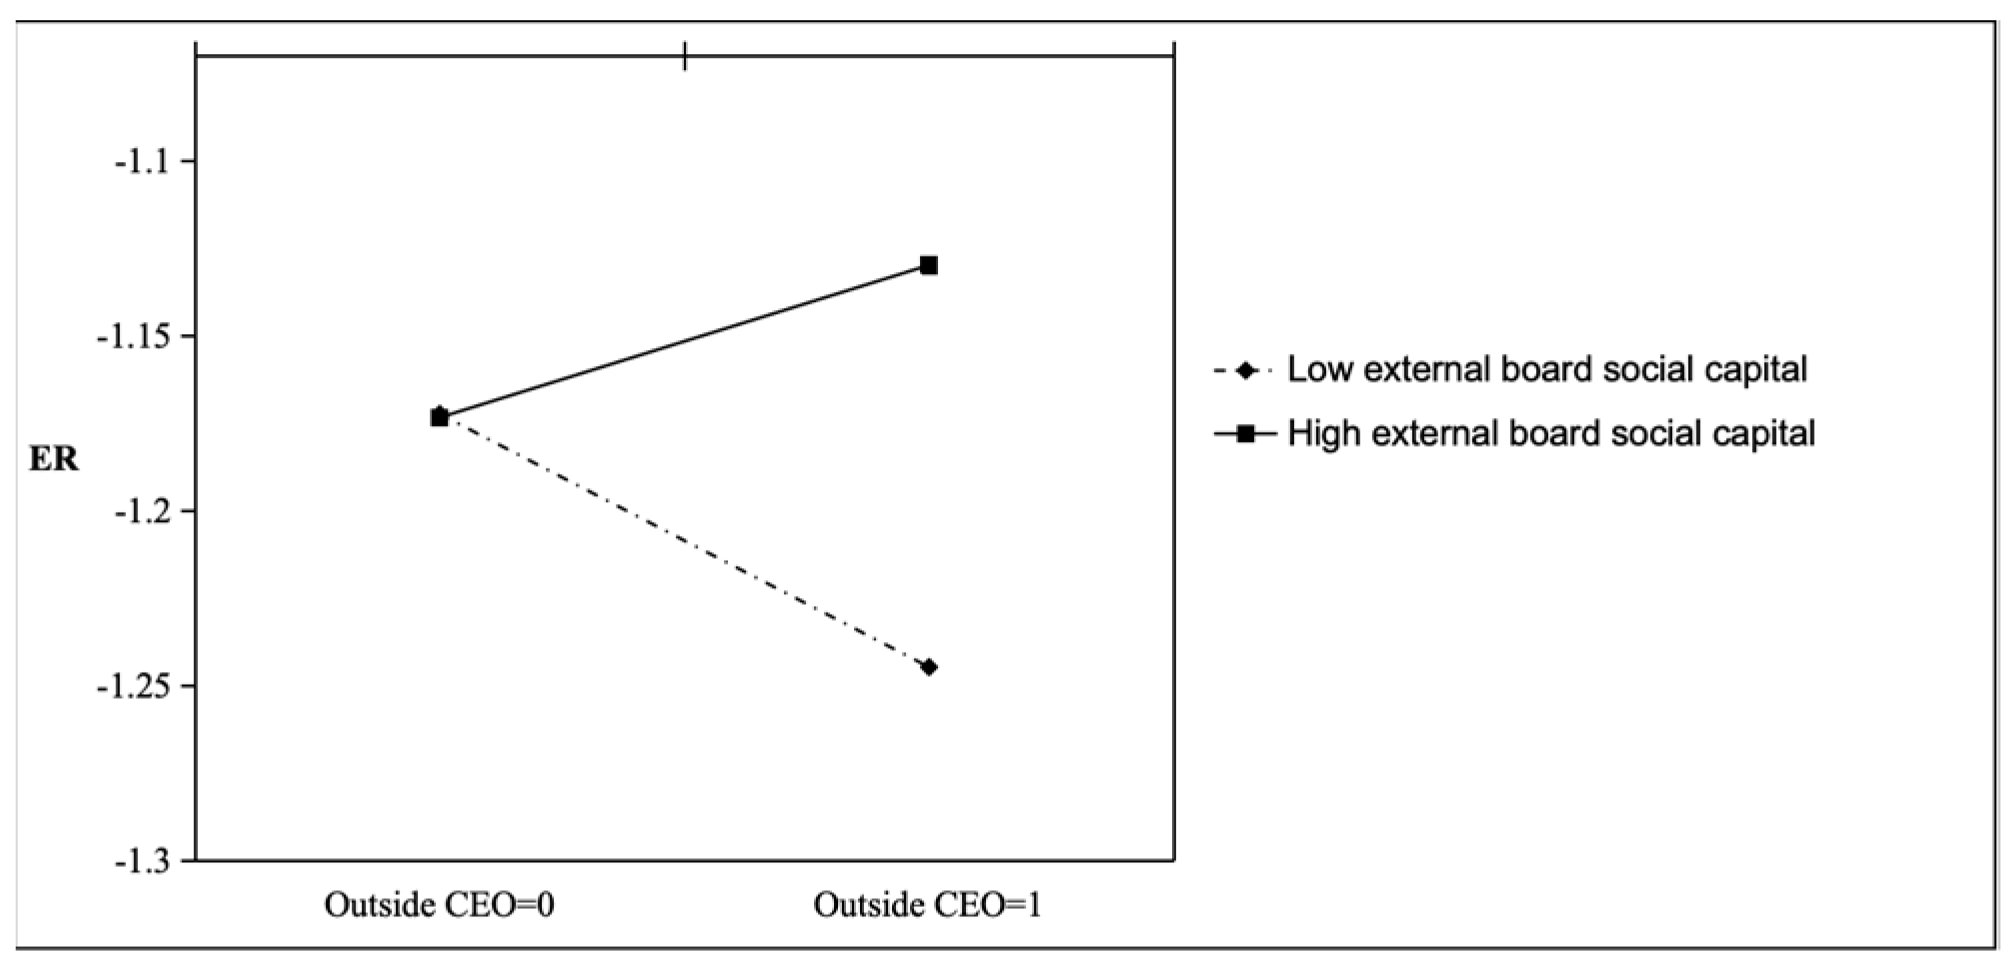
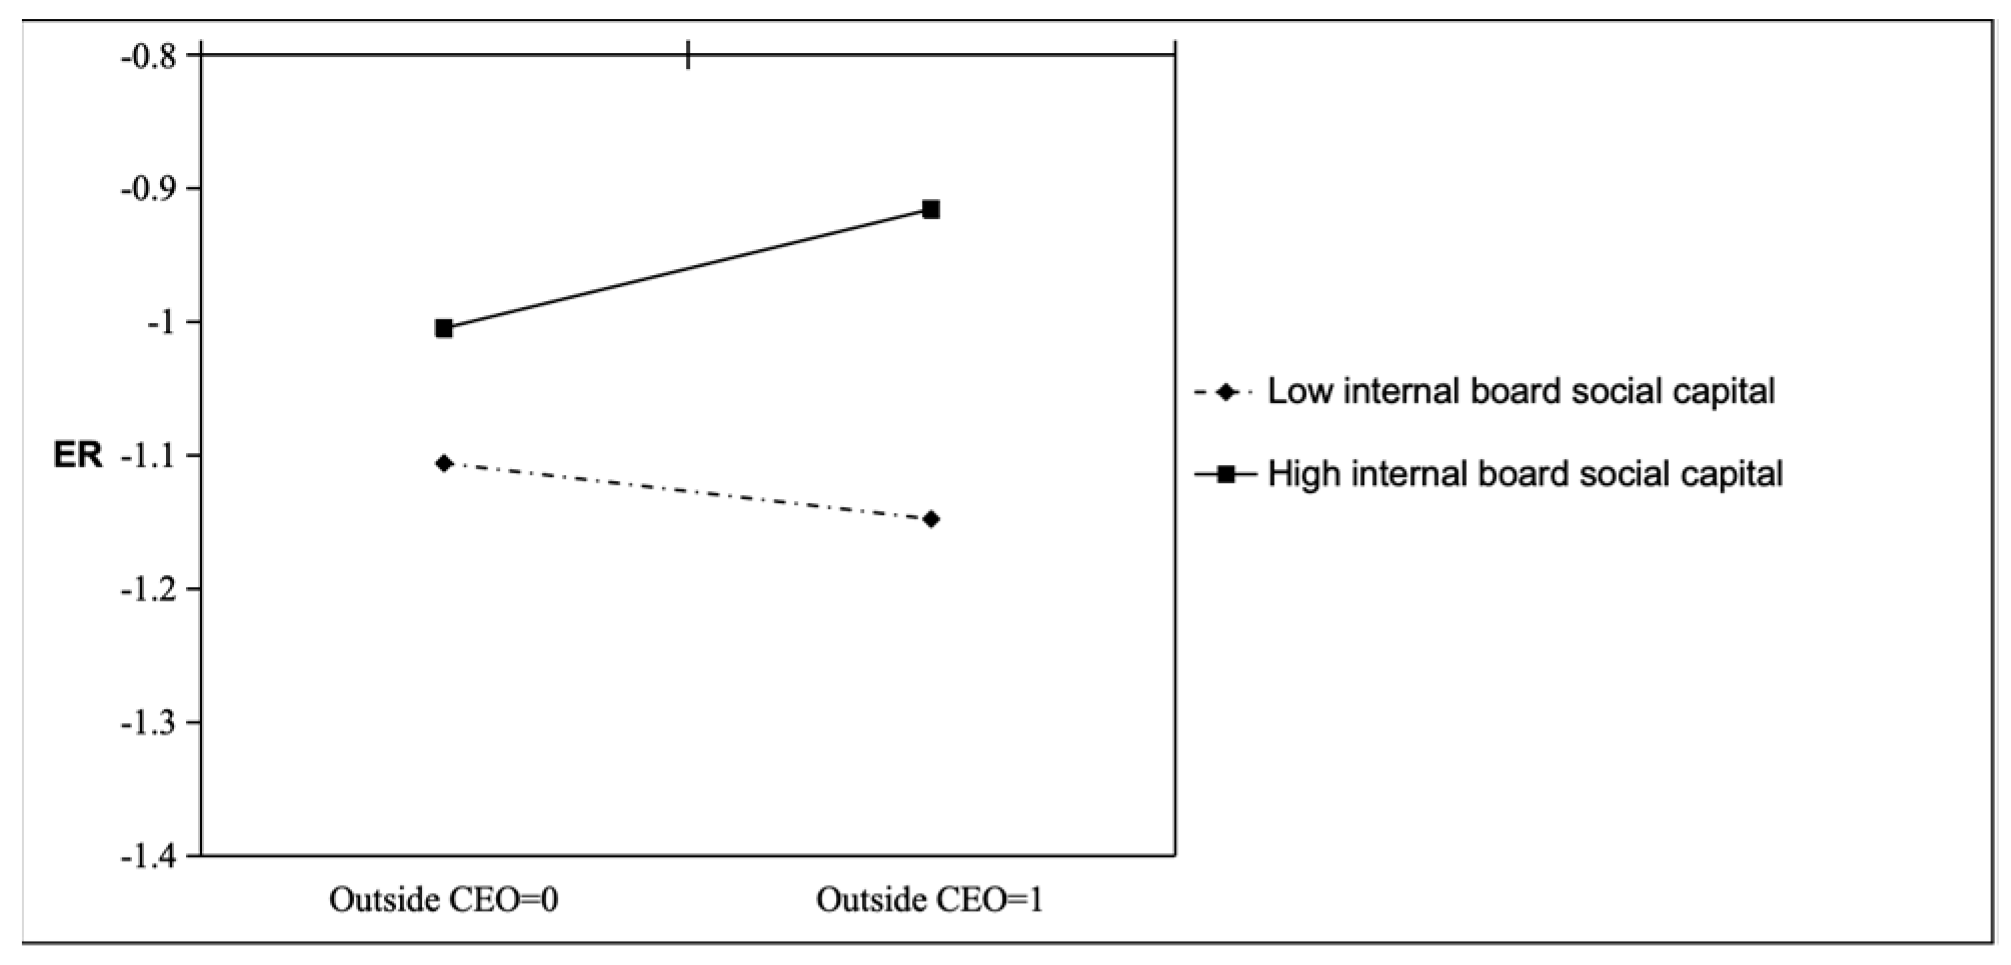
Table 9 presents the moderating effects of board social capital between outside CEO and environmental responsibility before and after PSM, using environmental responsibility in the first year after succession as the dependent variable. Results show that external and internal board social capital positively moderates this relationship (model 2: β = 0.0099, p < 0.01; Model 4: β = 0.0027, p < 0.1). After PSM, the results remain consistent with the pre-matching analysis (model 6: β = 0.0151, p < 0.01; model 8: β = 0.0060, p < 0.1). The moderation effects are illustrated in Figure 4 and Figure 5. Figure 4 shows that the negative effect of outside CEO succession on environmental responsibility is substantially reduced when external board social capital is high. A similar pattern is observed in Figure 5 with internal board social capital, indicating consistent moderating effects across both board social capital dimensions. Therefore, Hypotheses 2 and 3 are supported: the negative relationship between outside CEO succession and environmental responsibility is attenuated when boards possess higher external or internal social capital.
Table 9.
The moderating role of board social capital (DV = ERt+1).
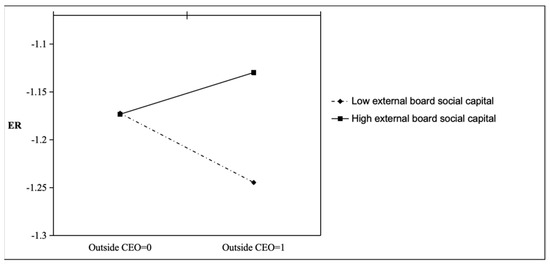
Figure 4.
Moderating Effect Diagram: External Board Social Capital.
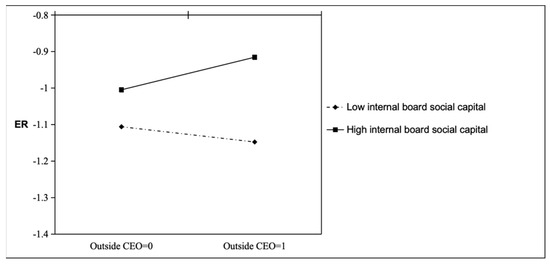
Figure 5.
Moderating Effect Diagram: Internal Board Social Capital.
5.4. Post Hoc Tests
As outside CEOs are typically expected to prioritize short-term performance early in their tenure, we analyzed firm financial performance (ROE) in the three years following succession. Results in Table 10 show consistent improvements in ROE (model 1: β = 0.8380, p < 0.01; Model 2: β = 0.4004, p < 0.1; Model 3: β = 0.2214, p < 0.1), indicating short-term financial gains. However, this improvement is not mirrored by environmental responsibility, which shows a slight decline during the same period. These results suggest a trade-off whereby outside CEOs prioritize short-term financial metrics over longer-term sustainability goals.
Table 10.
Regression results of outside CEO on ROE.
5.5. Robustness Test
5.5.1. Subgroup Regression
As mentioned, environmental responsibility is measured using green management (GM), green investment (GI), and green outcomes (GO). To further validate the results, we conduct a subgroup regression analysis. Table 11 presents the results for environmental responsibility in the first and second years after outside CEO succession. It indicates that outside CEO reduces all three metrics (model 1: β = −0.1136, p < 0.01; Model 2: β = −0.0751, p < 0.05; Model 3: β = −0.1128, p < 0.05; Model 4: β = −0.1014, p < 0.05; Model 5: β = −0.1824, p < 0.01; Model 6: β = −0.1244, p < 0.05), further supporting Hypothesis 1.
Table 11.
Subgroup regression.
5.5.2. Lagged Models (t + 2)
To further examine the moderating effect, we test whether the results remain robust when analyzing environmental responsibility in the second year after outside CEO succession. The answer is yes, as shown in Table 12 (model 2: β = 0.0122, p < 0.05; Model 4: β = 0.0055, p < 0.1), which further supported Hypotheses 2 and 3. These checks strengthen the credibility of our conclusions.
Table 12.
The moderating role of board social capital (DV = ERt+2).
6. Discussion and Conclusions
6.1. Discussion
This study provides empirical evidence on how outside CEO succession influences firms’ environmental responsibility. Consistent with our theoretical expectation grounded in agency theory (Davidson et al., 2002; J. Meng & Zhang, 2022; Pepper & Gore, 2015; Y. Zhang & Rajagopalan, 2010), we find that outside CEOs are associated with lower levels of environmental responsibility. The post hoc analysis shed light on the strategic priorities of outside CEOs. The observed improvement in ROE, alongside a decline in environmental responsibility, suggests a trade-off in strategic focus following outside CEO succession. To establish legitimacy and signal competence, outside CEOs may focus on financial metrics that are more visible, externally monitored, and tied to short-term evaluations. In contrast, environmental initiatives, which often require longer time horizons and are less directly attributable to CEO actions, tend to receive less attention. The results echo prior findings in the corporate governance literature that associate leadership transitions with increased short-termism (Guo et al., 2020; J. Meng & Zhang, 2022; Pepper & Gore, 2015; Y. Zhang & Rajagopalan, 2010), but it further reveals how such tendencies manifest in sustainability domains.
Our results then underscore the governance role of board social capital in shaping post-succession outcomes. Specifically, external board social capital enhances informational transparency and stakeholder accountability by facilitating access to external resources, while internal board social capital promotes strategic continuity through shared norms and director cohesion. Together, these mechanisms help mitigate the negative effects of outside CEO succession on environmental responsibility. The result empirically validates the functional distinction between these two dimensions, highlighting that boards with greater social capital are better equipped to offset risks arising from leadership transition, thereby reinforcing prior research on the governance role of social capital (Hoi et al., 2019; Jebran et al., 2022; Reguera-Alvarado & Bravo-Urquiza, 2022; Sauerwald et al., 2016).
While the coefficients for outside CEOs are not large in absolute terms, they remain substantively meaningful given the log-transformed nature of the dependent variable. For example, the coefficient of −0.1024 in Table 8 (Model 1) implies an approximate 10.24% reduction in environmental responsibility. In pollution-intensive industries, where environmental disclosures face heightened scrutiny from regulators and investors, modest percentage changes reflect material shifts in executive behaviors. These results affirm the practical significance of the observed effects.
Taken together, these findings provide a more nuanced understanding of how leadership transitions interact with board governance to influence sustainability outcomes, particularly within transitional institutional contexts.
6.2. Theoretical Contributions
First, this study advances the understanding of CEO succession’s role in environmental strategy, particularly in transitional economies. While prior studies suggest that CEO origin influences innovation (Cucculelli, 2018; Ramachandran, 2018) and strategy change (Karaevli & Zajac, 2013; Y. Zhang & Rajagopalan, 2010), its specific impact on environmental responsibility remains underexplored. Existing evidence appears to be context-dependent. For instance, a study based in France finds that outside CEOs are more attentive to sustainability performance than inside successors (Bernard et al., 2018). However, such findings may not generalize to emerging markets such as China, where environmental concerns often take a backseat to financial imperatives (J. Meng & Zhang, 2022). Agency theory presents conflicting conclusions: while outside CEOs may engage in impression management to signal effective and ethical leadership (Marquis & Tilcsik, 2016), they may also prioritize short-term returns over environmental goals to demonstrate their value to shareholders (D. Li et al., 2017). This study confirms the negative impact of outside CEOs on environmental responsibility, adding nuance to existing theoretical debates. It also offers insight into how competing performance logics influence executive decision-making during leadership transitions.
Second, it refines agency theory by showing that outside successors amplify agency concerns in sustainability leadership. Compared to inside CEOs, who tend to be more embedded in firm-specific routines and relational structures, outside CEOs face greater pressure to deliver short-term results due to their limited organizational familiarity and external legitimacy concerns. This extends agency theory beyond ownership and compensation structures by incorporating relational and contextual factors that influence CEO decision-making in domains requiring long-term commitment.
Third, it extends the theoretical lens of board social capital by clarifying its distinct governance functions in executive succession. External board social capital facilitates selection and evaluation processes by facilitating access to strategic information, reputational signals, and stakeholder expectations. Internal board social capital enhances strategic alignment by enabling knowledge support and normative reinforcement. They may serve as targeted governance levers during periods of strategic disruption. By bridging CEO succession, board governance, and sustainability research, this study contributes to a more context-sensitive understanding of corporate environmental strategy.
6.3. Practical Contributions
This study highlights the importance of firms strategically managing CEO succession, balancing the need for leadership renewal with long-term sustainability commitments. Nomination committees should establish oversight protocols that integrate sustainability audits into CEO performance evaluations, with a particular focus on environmental metrics. This alignment can help ensure that incoming leaders are accountable not only for financial outcomes but also for environmental progress.
For outside CEOs, who typically face a steeper learning curve due to limited firm-specific familiarity, structured onboarding is essential. Mentorship programs that pair new CEOs with experienced directors can facilitate the transfer of institutional knowledge and sustainability priorities. Additional onboarding practices, such as targeted briefings on ESG expectations and stakeholder engagement routines, may also accelerate alignment with the firm’s environmental agenda.
Policymakers can play a supportive role by introducing institutional safeguards to mitigate short-termism driven by leadership transitions. This could involve mandating environmental disclosures in CEO transition reports and offering incentives for firms that maintain consistent sustainability investments through periods of leadership change. Furthermore, cross-industry platforms for eco-innovation sharing can equip new CEOs with practical knowledge to address sector-specific environmental challenges.
6.4. Limitations and Further Research
This study has several limitations.
First, it focuses on Chinese firms, where institutional features such as state influence, relational governance, and culturally rooted norms may shape both agency problems and the role of board social capital. These context-specific conditions may limit the generalizability of the findings to countries with different governance environments. Future research could adopt cross-national comparative approaches to examine how institutional and cultural differences influence the relationship between CEO origin, board governance, and environmental strategy.
Second, the sample is restricted to pollution-intensive industries, which narrows the scope of the findings. Firms in less regulated or service-oriented sectors may exhibit different patterns in CEO succession and environmental governance. Future research could examine whether the observed relationships hold across a broader set of industries.
Third, board social capital is measured using structural proxies based on directors’ connections and shared tenure. While this approach enables consistency and comparability in large-sample studies, it does not capture tie strength or relational quality. Future research could employ more nuanced indicators to reflect interpersonal dynamics within the board.
Lastly, the study focuses on the short-term effects (3–5 years post-succession) of outside CEOs on environmental responsibility without assessing the long-term impact. Future research may explore whether reduced environmental responsibility acts as a mediating mechanism influencing broader outcomes such as financial performance or firm competitiveness. Such an inquiry would contribute to a more comprehensive understanding of the effects of executive succession.
Author Contributions
Conceptualization, H.Z.; methodology, H.Z., S.H.; software, S.H.; validation, S.H.; formal analysis, S.H.; data curation, S.H.; writing—original draft preparation, S.H.; writing—review and editing, S.H., H.Z.; visualization, S.H.; funding acquisition, H.Z. All authors have read and agreed to the published version of the manuscript.
Funding
This research was funded by the National Natural Science Foundation of China grant number 71972125.
Institutional Review Board Statement
Not applicable.
Informed Consent Statement
Not applicable.
Data Availability Statement
Data are available from the corresponding author upon request.
Conflicts of Interest
The authors declare no conflicts of interest.
References
- Abbas, A., Ekowati, D., Suhariadi, F., & Anwar, A. (2024). Human capital creation: A collective psychological, social, organizational and religious perspective. Journal of Religion and Health, 63(3), 2168–2200. [Google Scholar] [CrossRef]
- Adler, P. S., & Kwon, S.-W. (2002). Social capital: Prospects for a new concept. Academy of Management Review, 27(1), 17–40. [Google Scholar] [CrossRef]
- Agrawal, A., Knoeber, C. R., & Tsoulouhas, T. (2006). Are outsiders handicapped in CEO successions? Journal of Corporate Finance, 12(3), 619–644. [Google Scholar] [CrossRef]
- Ahearne, M., Lam, S. K., & Kraus, F. (2014). Performance impact of middle managers’ adaptive strategy implementation: The role of social capital. Strategic Management Journal, 35(1), 68–87. [Google Scholar] [CrossRef]
- Akbar, A., Jiang, X., Qureshi, M. A., & Akbar, M. (2021). Does corporate environmental investment impede financial performance of Chinese enterprises? The moderating role of financial constraints. Environmental Science and Pollution Research, 28(41), 58007–58017. [Google Scholar] [CrossRef] [PubMed]
- Al-Shaer, H., Albitar, K., & Liu, J. (2023). CEO power and CSR-linked compensation for corporate environmental responsibility: UK evidence. Review of Quantitative Finance and Accounting, 60(3), 1025–1063. [Google Scholar] [CrossRef]
- Alves, S. (2023). CEO duality, earnings quality and board independence. Journal of Financial Reporting and Accounting, 21(2), 217–231. [Google Scholar] [CrossRef]
- Arena, C., Michelon, G., & Trojanowski, G. (2018). Big egos can be green: A study of CEO hubris and environmental innovation. British Journal of Management, 29(2), 316–336. [Google Scholar] [CrossRef]
- Austin, P. C. (2011). Optimal caliper widths for propensity-score matching when estimating differences in means and differences in proportions in observational studies. Pharmaceutical Statistics, 10(2), 150–161. [Google Scholar] [CrossRef]
- Baah, C., Opoku-Agyeman, D., Acquah, I. S. K., Agyabeng-Mensah, Y., Afum, E., Faibil, D., & Abdoulaye, F. A. M. (2021). Examining the correlations between stakeholder pressures, green production practices, firm reputation, environmental and financial performance: Evidence from manufacturing SMEs. Sustainable Production and Consumption, 27, 100–114. [Google Scholar] [CrossRef]
- Barkema, H. G., & Shvyrkov, O. (2007). Does top management team diversity promote or hamper foreign expansion? Strategic Management Journal, 28(7), 663–680. [Google Scholar] [CrossRef]
- Barron, J. M., Chulkov, D. V., & Waddell, G. R. (2011). Top management team turnover, CEO succession type, and strategic change. Journal of Business Research, 64(8), 904–910. [Google Scholar] [CrossRef]
- Barroso-Castro, C., Villegas, M. M., & Pérez-Calero, L. (2011). Board influence on a firm’s internationalization. Corporate Governance: An International Review, 19(4), 351–367. [Google Scholar] [CrossRef]
- Barroso-Castro, C., Villegas-Periñan, M. M., & Casillas-Bueno, J. C. (2016). How boards’ internal and external social capital interact to affect firm performance. Strategic Organization, 14(1), 6–31. [Google Scholar] [CrossRef]
- Bernard, Y., Godard, L., & Zouaoui, M. (2018). The effect of CEOs’ turnover on the corporate sustainability performance of French firms. Journal of Business Ethics, 150, 1049–1069. [Google Scholar] [CrossRef]
- Bicen, P., Hunt, S. D., & Madhavaram, S. (2021). Coopetitive innovation alliance performance: Alliance competence, alliance’s market orientation, and relational governance. Journal of Business Research, 123, 23–31. [Google Scholar] [CrossRef]
- Bissoondoyal-Bheenick, E., Brooks, R., & Do, H. X. (2023). ESG and firm performance: The role of size and media channels. Economic Modelling, 121, 106203. [Google Scholar] [CrossRef]
- Chahine, S., Fang, Y., Hasan, I., & Mazboudi, M. (2019). Entrenchment through corporate social responsibility: Evidence from CEO network centrality. International Review of Financial Analysis, 66, 101347. [Google Scholar] [CrossRef]
- Chahine, S., Fang, Y., Hasan, I., & Mazboudi, M. (2021). CEO network centrality and the likelihood of financial reporting fraud. Abacus, 57(4), 654–678. [Google Scholar] [CrossRef]
- Charan, R. (2005). Boards that deliver: Advancing corporate governance from compliance to competitive advantage. John Wiley & Sons. [Google Scholar]
- Chen, G., & Hambrick, D. C. (2012). CEO replacement in turnaround situations: Executive (mis) fit and its performance implications. Organization Science, 23(1), 225–243. [Google Scholar] [CrossRef]
- Chen, H. L., Ho, M. H. C., & Hsu, W. T. (2013). Does board social capital influence chief executive officers’ investment decisions in research and development? R&D Management, 43(4), 381–393. [Google Scholar] [CrossRef]
- Chen, X., Sun, Y., & Xu, X. (2016). Free cash flow, over-investment and corporate governance in China. Pacific-Basin Finance Journal, 37, 81–103. [Google Scholar] [CrossRef]
- Connelly, B. L., Ketchen, D. J., Jr., Gangloff, K. A., & Shook, C. L. (2016). Investor perceptions of CEO successor selection in the wake of integrity and competence failures: A policy capturing study. Strategic Management Journal, 37(10), 2135–2151. [Google Scholar] [CrossRef]
- Cucculelli, M. (2018). Firm age and the probability of product innovation. Do CEO tenure and product tenure matter? Journal of Evolutionary Economics, 28, 153–179. [Google Scholar] [CrossRef]
- Cummings, T., & Knott, A. M. (2018). Outside CEOs and innovation. Strategic Management Journal, 39(8), 2095–2119. [Google Scholar] [CrossRef]
- Davidson, W. N., Nemec, C., Worrell, D. L., & Lin, J. (2002). Industrial origin of CEOs in outside succession: Board preference and stockholder reaction. Journal of Management and Governance, 6, 295–321. [Google Scholar] [CrossRef]
- De Villiers, C., Naiker, V., & Van Staden, C. J. (2011). The effect of board characteristics on firm environmental performance. Journal of Management, 37(6), 1636–1663. [Google Scholar] [CrossRef]
- Ding, H., Hu, Y., Yang, X., & Zhou, X. (2021). Board interlock and the diffusion of corporate social responsibility among Chinese listed firms. Asia Pacific Journal of Management, 39, 1287–1320. [Google Scholar] [CrossRef]
- Ferraris, A., Golgeci, I., Arslan, A., & Santoro, G. (2024). Understanding the link between subsidiary CEOs and corporate social responsibility in emerging markets: Moderating role of social capital. Business Ethics, the Environment & Responsibility, 33(1), 80–93. [Google Scholar] [CrossRef]
- Fich, E. M., & Shivdasani, A. (2006). Are busy boards effective monitors? The Journal of Finance, 61(2), 689–724. [Google Scholar] [CrossRef]
- Fogel, K., Jandik, T., & McCumber, W. R. (2018). CFO social capital and private debt. Journal of Corporate Finance, 52, 28–52. [Google Scholar] [CrossRef]
- Francoeur, C., Lakhal, F., Gaaya, S., & Saad, I. B. (2021). How do powerful CEOs influence corporate environmental performance? Economic Modelling, 94, 121–129. [Google Scholar] [CrossRef]
- Gao, Y., Nie, Y., & Hafsi, T. (2023). Not all stakeholders are equal: Corporate social responsibility variability and corporate financial performance. Business Ethics, the Environment & Responsibility, 32(4), 1389–1410. [Google Scholar] [CrossRef]
- García-Gómez, C. D., Zavertiaeva, M. A., Kirpishchikov, D., & López-Iturriaga, F. J. (2023). Board social capital in an emerging market: Do directors’ connections affect corporate risk-taking? Borsa Istanbul Review, 23(5), 1173–1190. [Google Scholar] [CrossRef]
- Georgakakis, D., & Ruigrok, W. (2017). CEO succession origin and firm performance: A multilevel study. Journal of Management Studies, 54(1), 58–87. [Google Scholar] [CrossRef]
- Gu, Y., Ho, K.-C., Yan, C., & Gozgor, G. (2021). Public environmental concern, CEO turnover, and green investment: Evidence from a quasi-natural experiment in China. Energy Economics, 100, 105379. [Google Scholar] [CrossRef]
- Gull, A. A., Hussain, N., Khan, S. A., Mushtaq, R., & Orij, R. (2023). The power of the CEO and environmental decoupling. Business Strategy and the Environment, 32(6), 3951–3964. [Google Scholar] [CrossRef]
- Guo, M., Kuai, Y., & Liu, X. (2020). Stock market response to environmental policies: Evidence from heavily polluting firms in China. Economic Modelling, 86, 306–316. [Google Scholar] [CrossRef]
- Harjoto, M., Jo, H., & Kim, Y. (2017). Is institutional ownership related to corporate social responsibility? The nonlinear relation and its implication for stock return volatility. Journal of Business Ethics, 146, 77–109. [Google Scholar] [CrossRef]
- Harris, D. A., & Helfat, C. E. (1997). Specificity of CEO human capital and compensation. Strategic Management Journal, 18(11), 895–920. [Google Scholar] [CrossRef]
- Harris, D. A., & Helfat, C. E. (2007). The board of directors as a social network: A new perspective. Journal of Management Inquiry, 16(3), 228–237. [Google Scholar] [CrossRef]
- Haynes, K. T., & Hillman, A. (2010). The effect of board capital and CEO power on strategic change. Strategic Management Journal, 31(11), 1145–1163. [Google Scholar] [CrossRef]
- Henri, J.-F., & Journeault, M. (2008). Environmental performance indicators: An empirical study of Canadian manufacturing firms. Journal of Environmental Management, 87(1), 165–176. [Google Scholar] [CrossRef]
- Hillman, A. J., & Dalziel, T. (2003). Boards of directors and firm performance: Integrating agency and resource dependence perspectives. Academy of Management Review, 28(3), 383–396. [Google Scholar] [CrossRef]
- Hoi, C. K. S., Wu, Q., & Zhang, H. (2019). Does social capital mitigate agency problems? Evidence from Chief Executive Officer (CEO) compensation. Journal of Financial Economics, 133(2), 498–519. [Google Scholar] [CrossRef]
- Hu, W., & Shi, S. (2025). CEO green background and enterprise green innovation. International Review of Economics & Finance, 97, 103765. [Google Scholar] [CrossRef]
- Huang, H., Chang, Y., & Zhang, L. (2023). CEO’s marketing experience and firm green innovation. Business Strategy and the Environment, 32(8), 5211–5233. [Google Scholar] [CrossRef]
- Huang, R., & Wei, J. (2023). Does CEOs’ green experience affect environmental corporate social responsibility? Evidence from China. Economic Analysis and Policy, 79, 205–231. [Google Scholar] [CrossRef]
- Hutzschenreuter, T., Kleindienst, I., & Greger, C. (2012). How new leaders affect strategic change following a succession event: A critical review of the literature. The Leadership Quarterly, 23(5), 729–755. [Google Scholar] [CrossRef]
- Inkpen, A. C., & Tsang, E. W. (2016). Reflections on the 2015 decade award—Social capital, networks, and knowledge transfer: An emergent stream of research. Academy of Management Review, 41, 573–588. [Google Scholar] [CrossRef]
- Jalal, A. M., & Prezas, A. P. (2012). Outsider CEO succession and firm performance. Journal of Economics and Business, 64(6), 399–426. [Google Scholar] [CrossRef]
- Javakhadze, D., Ferris, S. P., & French, D. W. (2016). Social capital, investments, and external financing. Journal of Corporate Finance, 37, 38–55. [Google Scholar] [CrossRef]
- Jebran, K., Chen, S., & Zhang, R. (2022). Board social capital and stock price crash risk. Review of Quantitative Finance and Accounting, 58(2), 499–540. [Google Scholar] [CrossRef]
- Jostarndt, P., & Sautner, Z. (2008). Financial distress, corporate control, and management turnover. Journal of Banking & Finance, 32(10), 2188–2204. [Google Scholar] [CrossRef]
- Karaevli, A., & Zajac, E. J. (2013). When do outsider CEOs generate strategic change? The enabling role of corporate stability. Journal of Management Studies, 50(7), 1267–1294. [Google Scholar] [CrossRef]
- Khan, T. M., Gang, B., Fareed, Z., & Yasmeen, R. (2020). The impact of CEO tenure on corporate social and environmental performance: An emerging country’s analysis. Environmental Science and Pollution Research, 27(16), 19314–19326. [Google Scholar] [CrossRef]
- Kiel, G. C., & Nicholson, G. J. (2006). Multiple directorships and corporate performance in Australian listed companies. Corporate Governance: An International Review, 14(6), 530–546. [Google Scholar] [CrossRef]
- Kim, Y., & Cannella, A. A., Jr. (2008). Toward a social capital theory of director selection. Corporate Governance: An International Review, 16(4), 282–293. [Google Scholar] [CrossRef]
- Klarner, P., Probst, G., & Useem, M. (2020). Opening the black box: Unpacking board involvement in innovation. Strategic Organization, 18(4), 487–519. [Google Scholar] [CrossRef]
- Konadu, R., Owusu-Agyei, S., Lartey, T. A., Danso, A., Adomako, S., & Amankwah-Amoah, J. (2020). CEOs’ reputation, quality management and environmental innovation: The roles of stakeholder pressure and resource commitment. Business Strategy and the Environment, 29(6), 2310–2323. [Google Scholar] [CrossRef]
- Kor, Y. Y., & Misangyi, V. F. (2008). Outside directors’ industry-specific experience and firms’ liability of newness. Strategic Management Journal, 29(12), 1345–1355. [Google Scholar] [CrossRef]
- Kor, Y. Y., & Sundaramurthy, C. (2009). Experience-based human capital and social capital of outside directors. Journal of Management, 35(4), 981–1006. [Google Scholar] [CrossRef]
- Li, D., Zhao, Y., Sun, Y., & Yin, D. (2017). Corporate environmental performance, environmental information disclosure, and financial performance: Evidence from China. Human and Ecological Risk Assessment: An International Journal, 23(2), 323–339. [Google Scholar] [CrossRef]
- Li, R., & Ramanathan, R. (2020). Can environmental investments benefit environmental performance? The moderating roles of institutional environment and foreign direct investment. Business Strategy and the Environment, 29(8), 3385–3398. [Google Scholar] [CrossRef]
- Li, X., Guo, F., & Wang, J. (2024). A path towards enterprise environmental performance improvement: How does CEO green experience matter? Business Strategy and the Environment, 33(2), 820–838. [Google Scholar] [CrossRef]
- Liu, X. (2023). Fear to lose? An analysis of CEO successors’ decision-making regarding R&D intensity based on behavioral agency theory. Asian Business & Management, 22(1), 403–430. [Google Scholar] [CrossRef]
- Marquis, C., & Tilcsik, A. (2016). Institutional equivalence: How industry and community peers influence corporate philanthropy. Organization Science, 27(5), 1325–1341. [Google Scholar] [CrossRef]
- Maswadi, L., & Amran, A. (2023). Does board capital enhance corporate social responsibility disclosure quality? The role of CEO power. Corporate Social Responsibility and Environmental Management, 30(1), 209–225. [Google Scholar] [CrossRef]
- Meng, J., & Zhang, Z. (2022). Corporate environmental information disclosure and investor response: Evidence from China’s capital market. Energy Economics, 108, 105886. [Google Scholar] [CrossRef]
- Meng, X. H., Zeng, S. X., Tam, C. M., & Xu, X. D. (2013). Whether top executives’ turnover influences environmental responsibility: From the perspective of environmental information disclosure. Journal of Business Ethics, 114, 341–353. [Google Scholar] [CrossRef]
- Muttakin, M. B., Khan, A., & Mihret, D. G. (2018). The effect of board capital and CEO power on corporate social responsibility disclosures. Journal of Business Ethics, 150, 41–56. [Google Scholar] [CrossRef]
- O’Cass, A., & Sok, P. (2014). The role of intellectual resources, product innovation capability, reputational resources and marketing capability combinations in firm growth. International Small Business Journal, 32(8), 996–1018. [Google Scholar] [CrossRef]
- Orij, R. P., Rehman, S., Khan, H., & Khan, F. (2021). Is CSR the new competitive environment for CEOs? The association between CEO turnover, corporate social responsibility and board gender diversity: Asian evidence. Corporate Social Responsibility and Environmental Management, 28(2), 731–747. [Google Scholar] [CrossRef]
- Pepper, A., & Gore, J. (2015). Behavioral agency theory: New foundations for theorizing about executive compensation. Journal of Management, 41(4), 1045–1068. [Google Scholar] [CrossRef]
- Perry, T., & Peyer, U. (2005). Board seat accumulation by executives: A shareholder’s perspective. The Journal of Finance, 60(4), 2083–2123. [Google Scholar] [CrossRef]
- Pérez-Calero, L., Villegas, M. d. M., & Barroso, C. (2016). A framework for board capital. Corporate Governance, 16(3), 452–475. [Google Scholar] [CrossRef]
- Pfeffer, J., & Salancik, G. (2015). External control of organizations—Resource dependence perspective. In Organizational behavior 2 (pp. 355–370). Routledge. [Google Scholar]
- Quan, X., Ke, Y., Qian, Y., & Zhang, Y. (2021). CEO foreign experience and green innovation: Evidence from China. Journal of Business Ethics, 182, 535–557. [Google Scholar] [CrossRef]
- Quigley, T. J., Hambrick, D. C., Misangyi, V. F., & Rizzi, G. A. (2019). CEO selection as risk-taking: A new vantage on the debate about the consequences of insiders versus outsiders. Strategic Management Journal, 40(9), 1453–1470. [Google Scholar] [CrossRef]
- Ramachandran, I. (2018). Triggering absorptive capacity in organizations: CEO succession as a knowledge enabler. Journal of Knowledge Management, 22(8), 1844–1864. [Google Scholar] [CrossRef]
- Ramón-Llorens, M. C., García-Meca, E., & Pucheta-Martínez, M. C. (2019). The role of human and social board capital in driving CSR reporting. Long Range Planning, 52(6), 101846. [Google Scholar] [CrossRef]
- Reguera-Alvarado, N., & Bravo-Urquiza, F. (2022). The influence of board social capital on corporate social responsibility reporting. Journal of Intellectual Capital, 23(4), 913–935. [Google Scholar] [CrossRef]
- Ríos, A.-M., & Picazo-Tadeo, A. J. (2021). Measuring environmental performance in the treatment of municipal solid waste: The case of the European Union-28. Ecological Indicators, 123, 107328. [Google Scholar] [CrossRef]
- Rosenbaum, P. R., & Rubin, D. B. (1983). The central role of the propensity score in observational studies for causal effects. Biometrika, 70(1), 41–55. [Google Scholar] [CrossRef]
- Ryan, T. P. (2008). Modern regression methods (Vol. 655). John Wiley & Sons. [Google Scholar]
- Sauerwald, S., Lin, Z., & Peng, M. W. (2016). Board social capital and excess CEO returns. Strategic Management Journal, 37(3), 498–520. [Google Scholar] [CrossRef]
- Shahab, Y., Ntim, C. G., Chen, Y., Ullah, F., Li, H. X., & Ye, Z. (2020). Chief executive officer attributes, sustainable performance, environmental performance, and environmental reporting: New insights from upper echelons perspective. Business Strategy and the Environment, 29(1), 1–16. [Google Scholar] [CrossRef]
- Shui, X., Zhang, M., Smart, P., & Ye, F. (2022). Sustainable corporate governance for environmental innovation: A configurational analysis on board capital, CEO power and ownership structure. Journal of Business Research, 149, 786–794. [Google Scholar] [CrossRef]
- Song, H., Zhao, C., & Zeng, J. (2017). Can environmental management improve financial performance: An empirical study of A-shares listed companies in China. Journal of Cleaner Production, 141, 1051–1056. [Google Scholar] [CrossRef]
- Tian, J., Haleblian, J., & Rajagopalan, N. (2011). The effects of board human and social capital on investor reactions to new CEO selection. Strategic Management Journal, 32(7), 731–747. [Google Scholar] [CrossRef]
- Uzzi, B., & Gillespie, J. J. (2002). Knowledge spillover in corporate financing networks: Embeddedness and the firm’s debt performance. Strategic Management Journal, 23(7), 595–618. [Google Scholar] [CrossRef]
- Walls, J. L., & Berrone, P. (2017). The power of one to make a difference: How informal and formal CEO power affect environmental sustainability. Journal of Business Ethics, 145, 293–308. [Google Scholar] [CrossRef]
- Wang, J., Li, J., & Zhang, Q. (2021). Does carbon efficiency improve financial performance? Evidence from Chinese firms. Energy Economics, 104, 105658. [Google Scholar] [CrossRef]
- Wang, L., Lin, Y., Jiang, W., Yang, H., & Zhao, H. (2023). Does CEO emotion matter? CEO affectivity and corporate social responsibility. Strategic Management Journal, 44(7), 1820–1835. [Google Scholar] [CrossRef]
- Wang, M., Liao, G., & Li, Y. (2021). The relationship between environmental regulation, pollution and corporate environmental responsibility. International Journal of Environmental Research and Public Health, 18(15), 8018. [Google Scholar] [CrossRef] [PubMed]
- Wang, Y., Qiu, Y., & Luo, Y. (2022). CEO foreign experience and corporate sustainable development: Evidence from China. Business Strategy and the Environment, 31(5), 2036–2051. [Google Scholar] [CrossRef]
- Wang, Z., McNally, R., & Lenihan, H. (2019). The role of social capital and culture on social decision-making constraints: A multilevel investigation. European Management Journal, 37(2), 222–232. [Google Scholar] [CrossRef]
- Wiersema, M. F., Nishimura, Y., & Suzuki, K. (2018). Executive succession: The importance of social capital in CEO appointments. Strategic Management Journal, 39(5), 1473–1495. [Google Scholar] [CrossRef]
- Wiseman, J. (1982). An evaluation of environmental disclosures made in corporate annual reports. Accounting, Organizations and Society, 7(1), 53–63. [Google Scholar] [CrossRef]
- Wood, D. J., Mitchell, R. K., Agle, B. R., & Bryan, L. M. (2021). Stakeholder identification and salience after 20 years: Progress, problems, and prospects. Business & Society, 60(1), 196–245. [Google Scholar] [CrossRef]
- Yafi, E., Tehseen, S., & Haider, S. A. (2021). Impact of green training on environmental performance through mediating role of competencies and motivation. Sustainability, 13(10), 5624. [Google Scholar] [CrossRef]
- Zeng, S., Xu, X., Dong, Z., & Tam, V. W. (2010). Towards corporate environmental information disclosure: An empirical study in China. Journal of Cleaner Production, 18(12), 1142–1148. [Google Scholar] [CrossRef]
- Zhang, K., Pan, Z., Janardhanan, M., & Patel, I. (2023). Relationship analysis between greenwashing and environmental performance. Environment, Development and Sustainability, 25(8), 7927–7957. [Google Scholar] [CrossRef]
- Zhang, L., Ji, W., Tao, J., & Wang, Q. (2011). Who shall leave? How CEO preference and power affect executive turnover in Chinese listed companies. Corporate Governance: An International Review, 19(6), 547–561. [Google Scholar] [CrossRef]
- Zhang, X., Le, Y., Meng, Q., & Teng, X. (2023). Green entrepreneurial orientation and financial performance in Chinese firms: The role of stakeholder engagement and green absorptive capacity. Corporate Social Responsibility and Environmental Management, 30(3), 1082–1095. [Google Scholar] [CrossRef]
- Zhang, Y. (2008). Information asymmetry and the dismissal of newly appointed CEOs: An empirical investigation. Strategic Management Journal, 29(8), 859–872. [Google Scholar] [CrossRef]
- Zhang, Y., & Rajagopalan, N. (2004). When the known devil is better than an unknown god: An empirical study of the antecedents and consequences of relay CEO successions. Academy of Management Journal, 47(4), 483–500. [Google Scholar] [CrossRef]
- Zhang, Y., & Rajagopalan, N. (2010). Once an outsider, always an outsider? CEO origin, strategic change, and firm performance. Strategic Management Journal, 31(3), 334–346. [Google Scholar] [CrossRef]
- Zhou, M., Chen, F., & Chen, Z. (2021). Can CEO education promote environmental innovation: Evidence from Chinese enterprises. Journal of Cleaner Production, 297, 126725. [Google Scholar] [CrossRef]
- Zhu, D. H., & Shen, W. (2016). Why do some outside successions fare better than others? The role of outside CEOs’ prior experience with board diversity. Strategic Management Journal, 37(13), 2695–2708. [Google Scholar] [CrossRef]


Disclaimer/Publisher’s Note: The statements, opinions and data contained in all publications are solely those of the individual author(s) and contributor(s) and not of MDPI and/or the editor(s). MDPI and/or the editor(s) disclaim responsibility for any injury to people or property resulting from any ideas, methods, instructions or products referred to in the content. |
© 2025 by the authors. Licensee MDPI, Basel, Switzerland. This article is an open access article distributed under the terms and conditions of the Creative Commons Attribution (CC BY) license (https://creativecommons.org/licenses/by/4.0/).