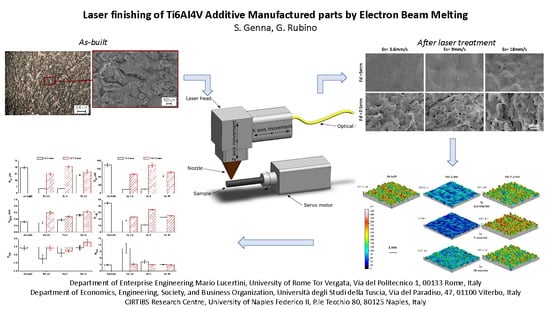
Laser Finishing of Ti6Al4V Additive Manufactured Parts by Electron Beam Melting


Abstract
:
1. Introduction
2. Materials, Equipment, and Methods
2.1. Materials
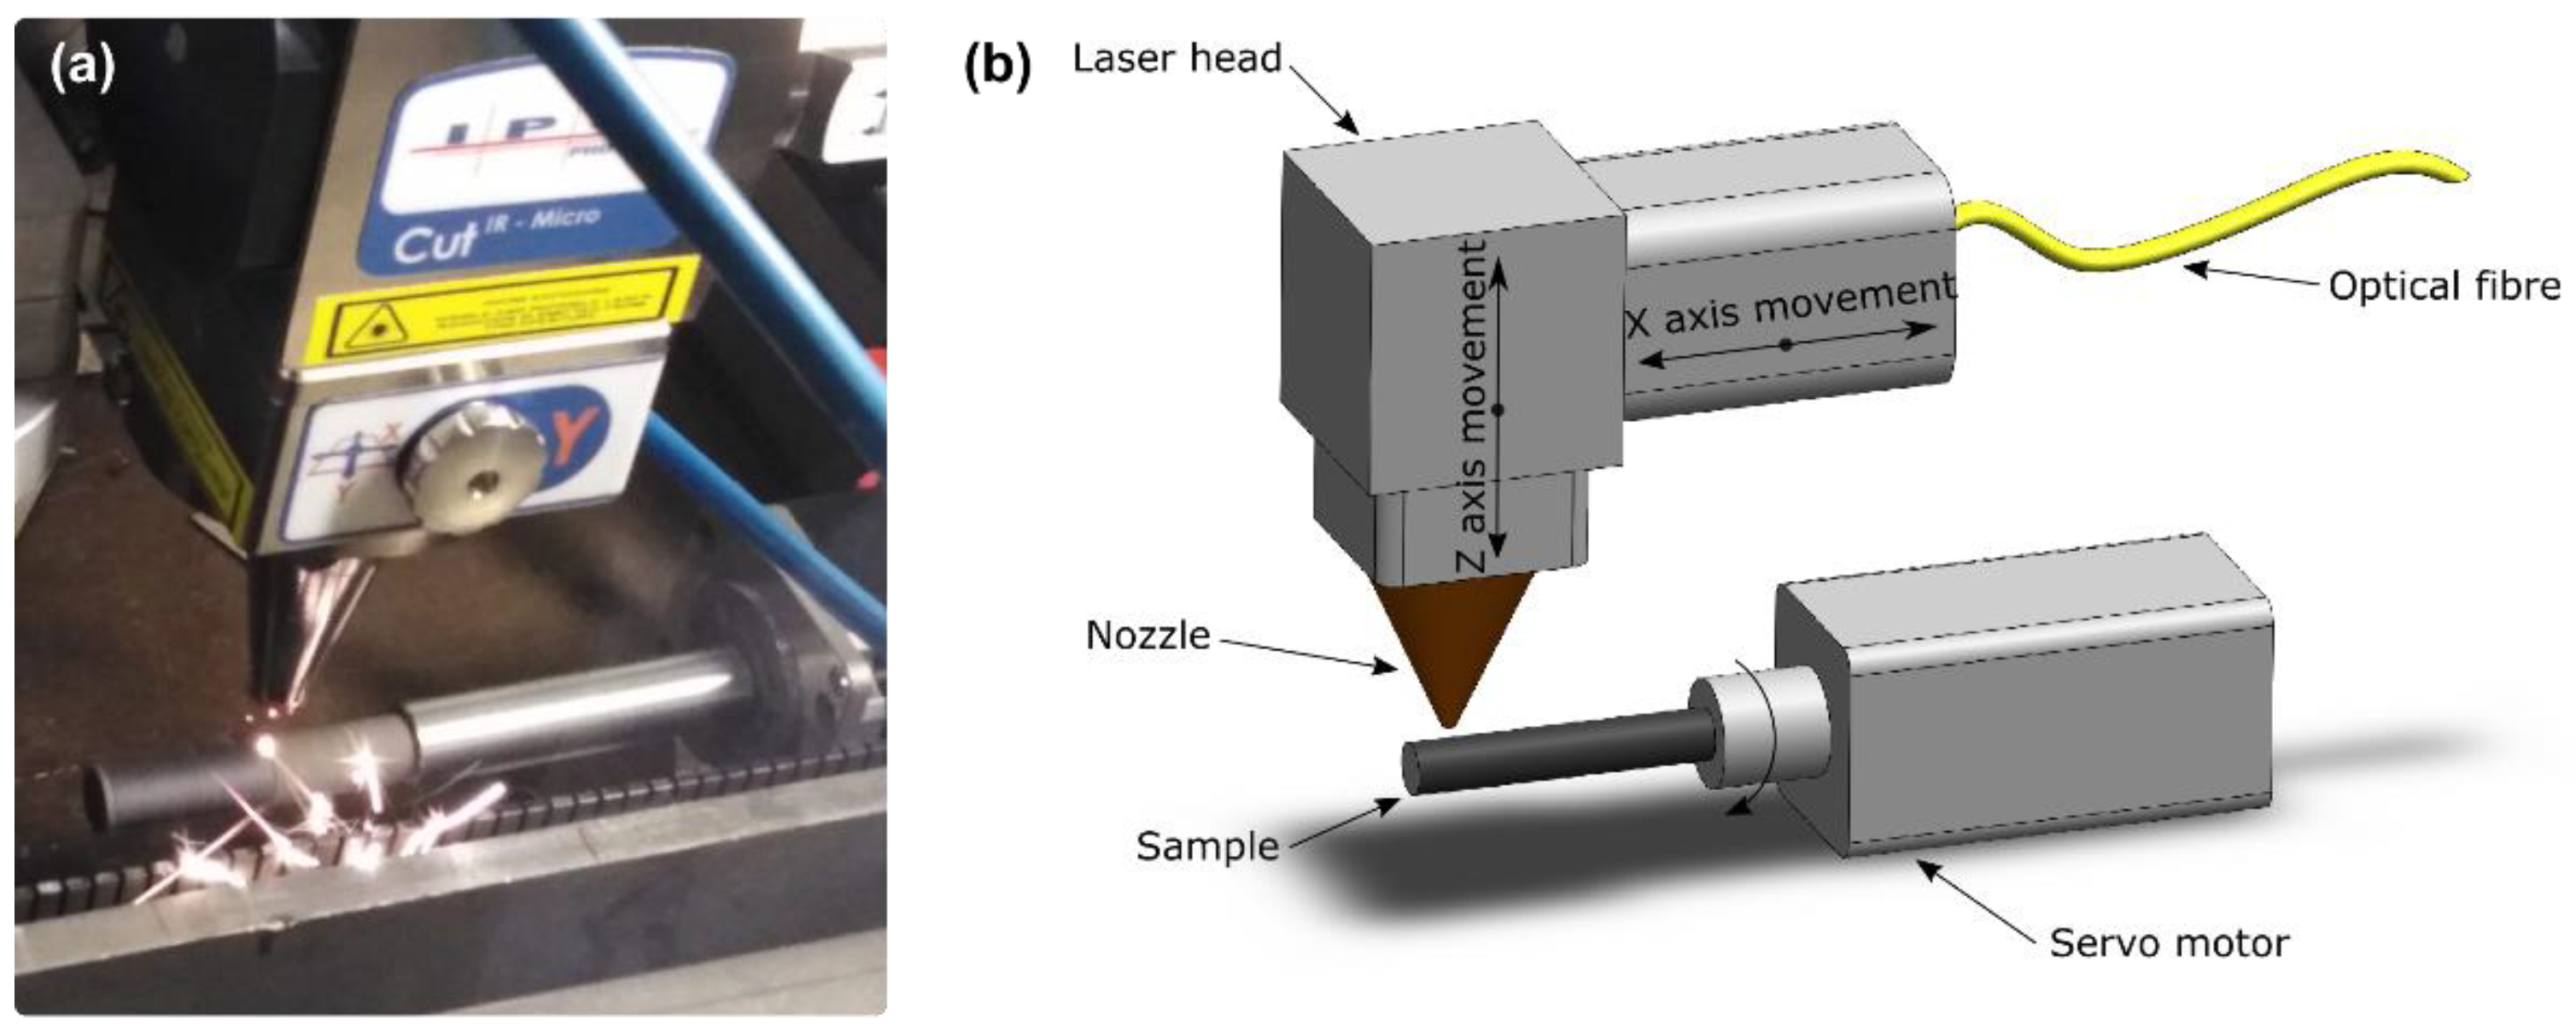
2.2. Laser Finishing Setup
2.3. Experimental Procedures
3. Results
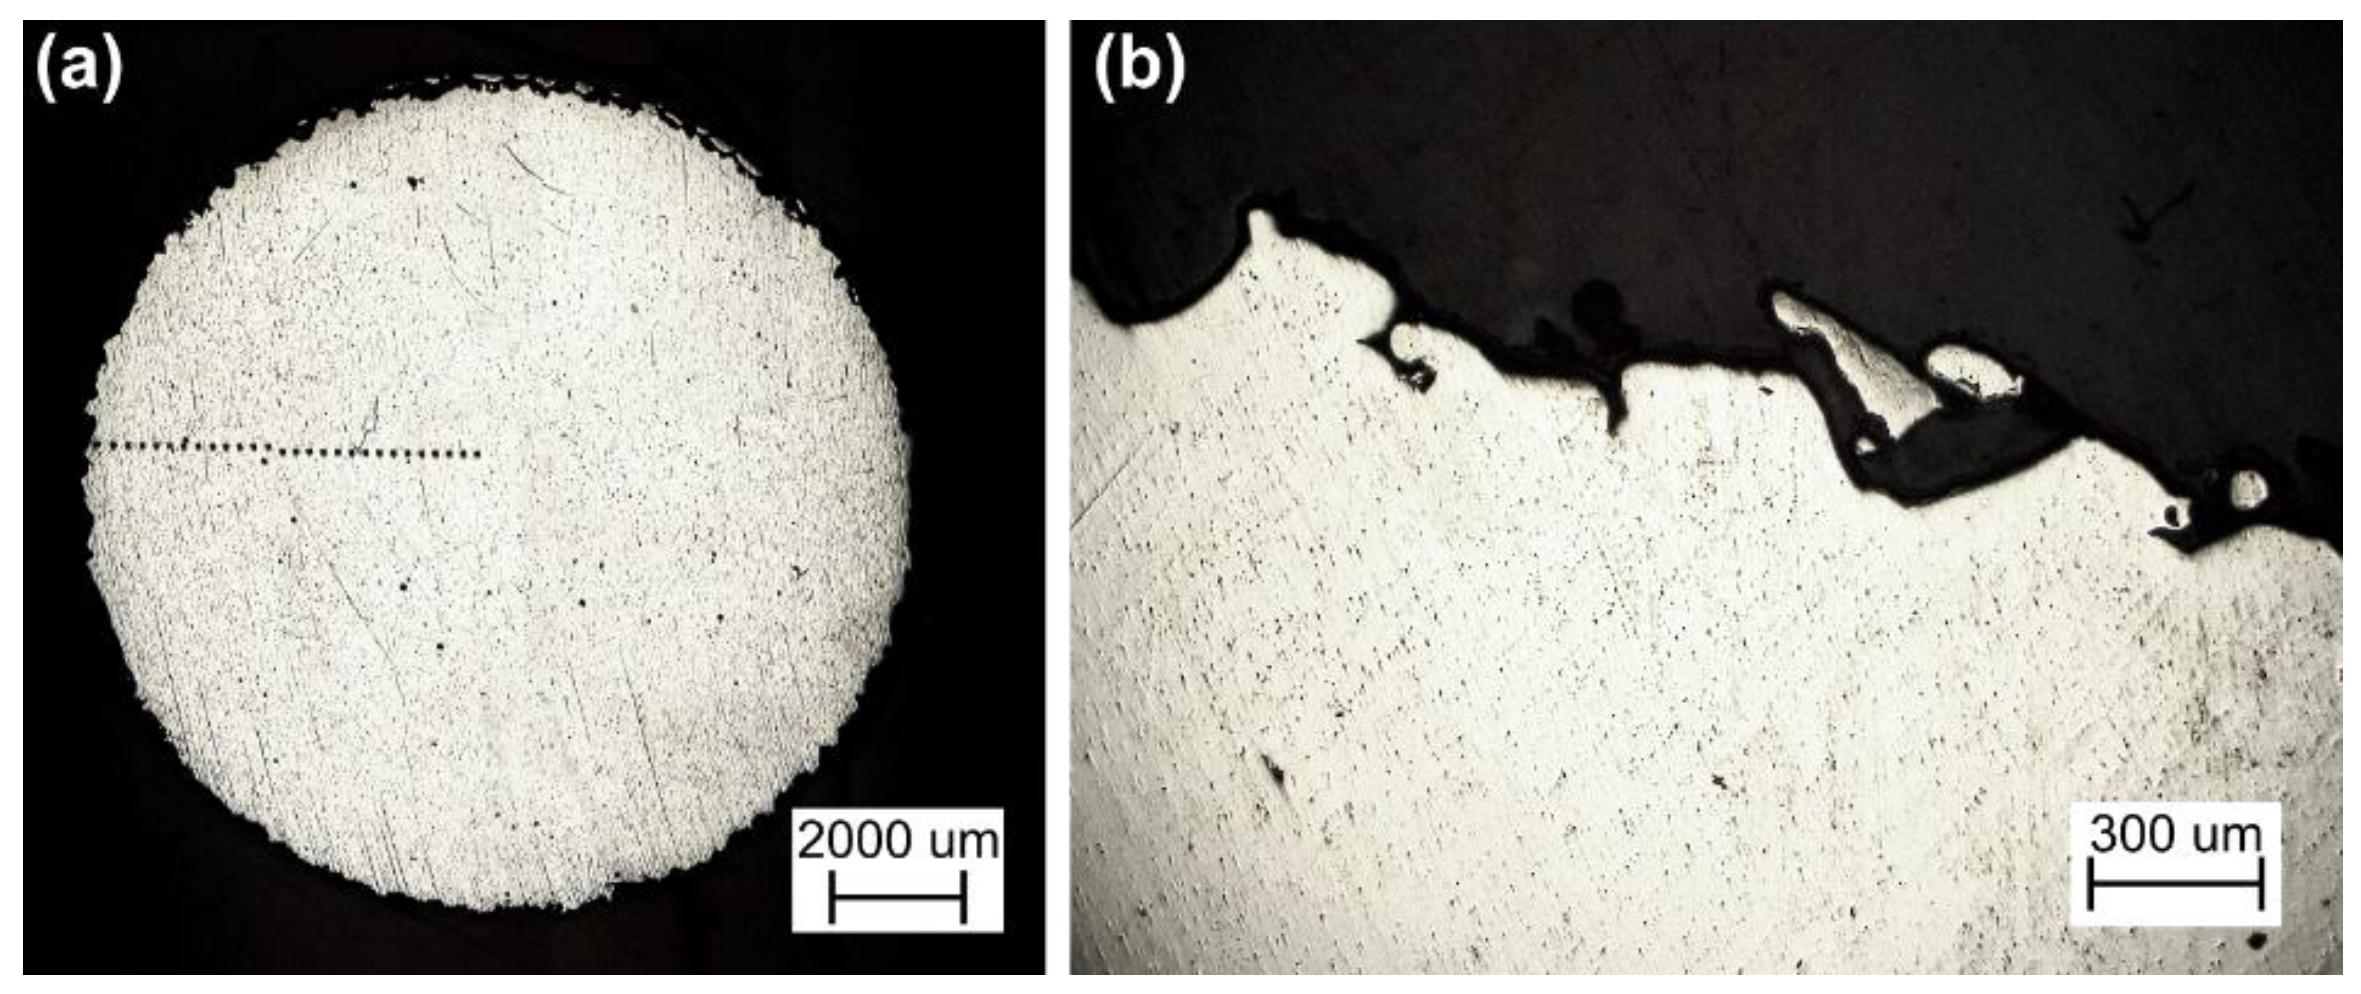
3.1. Preliminary Tests
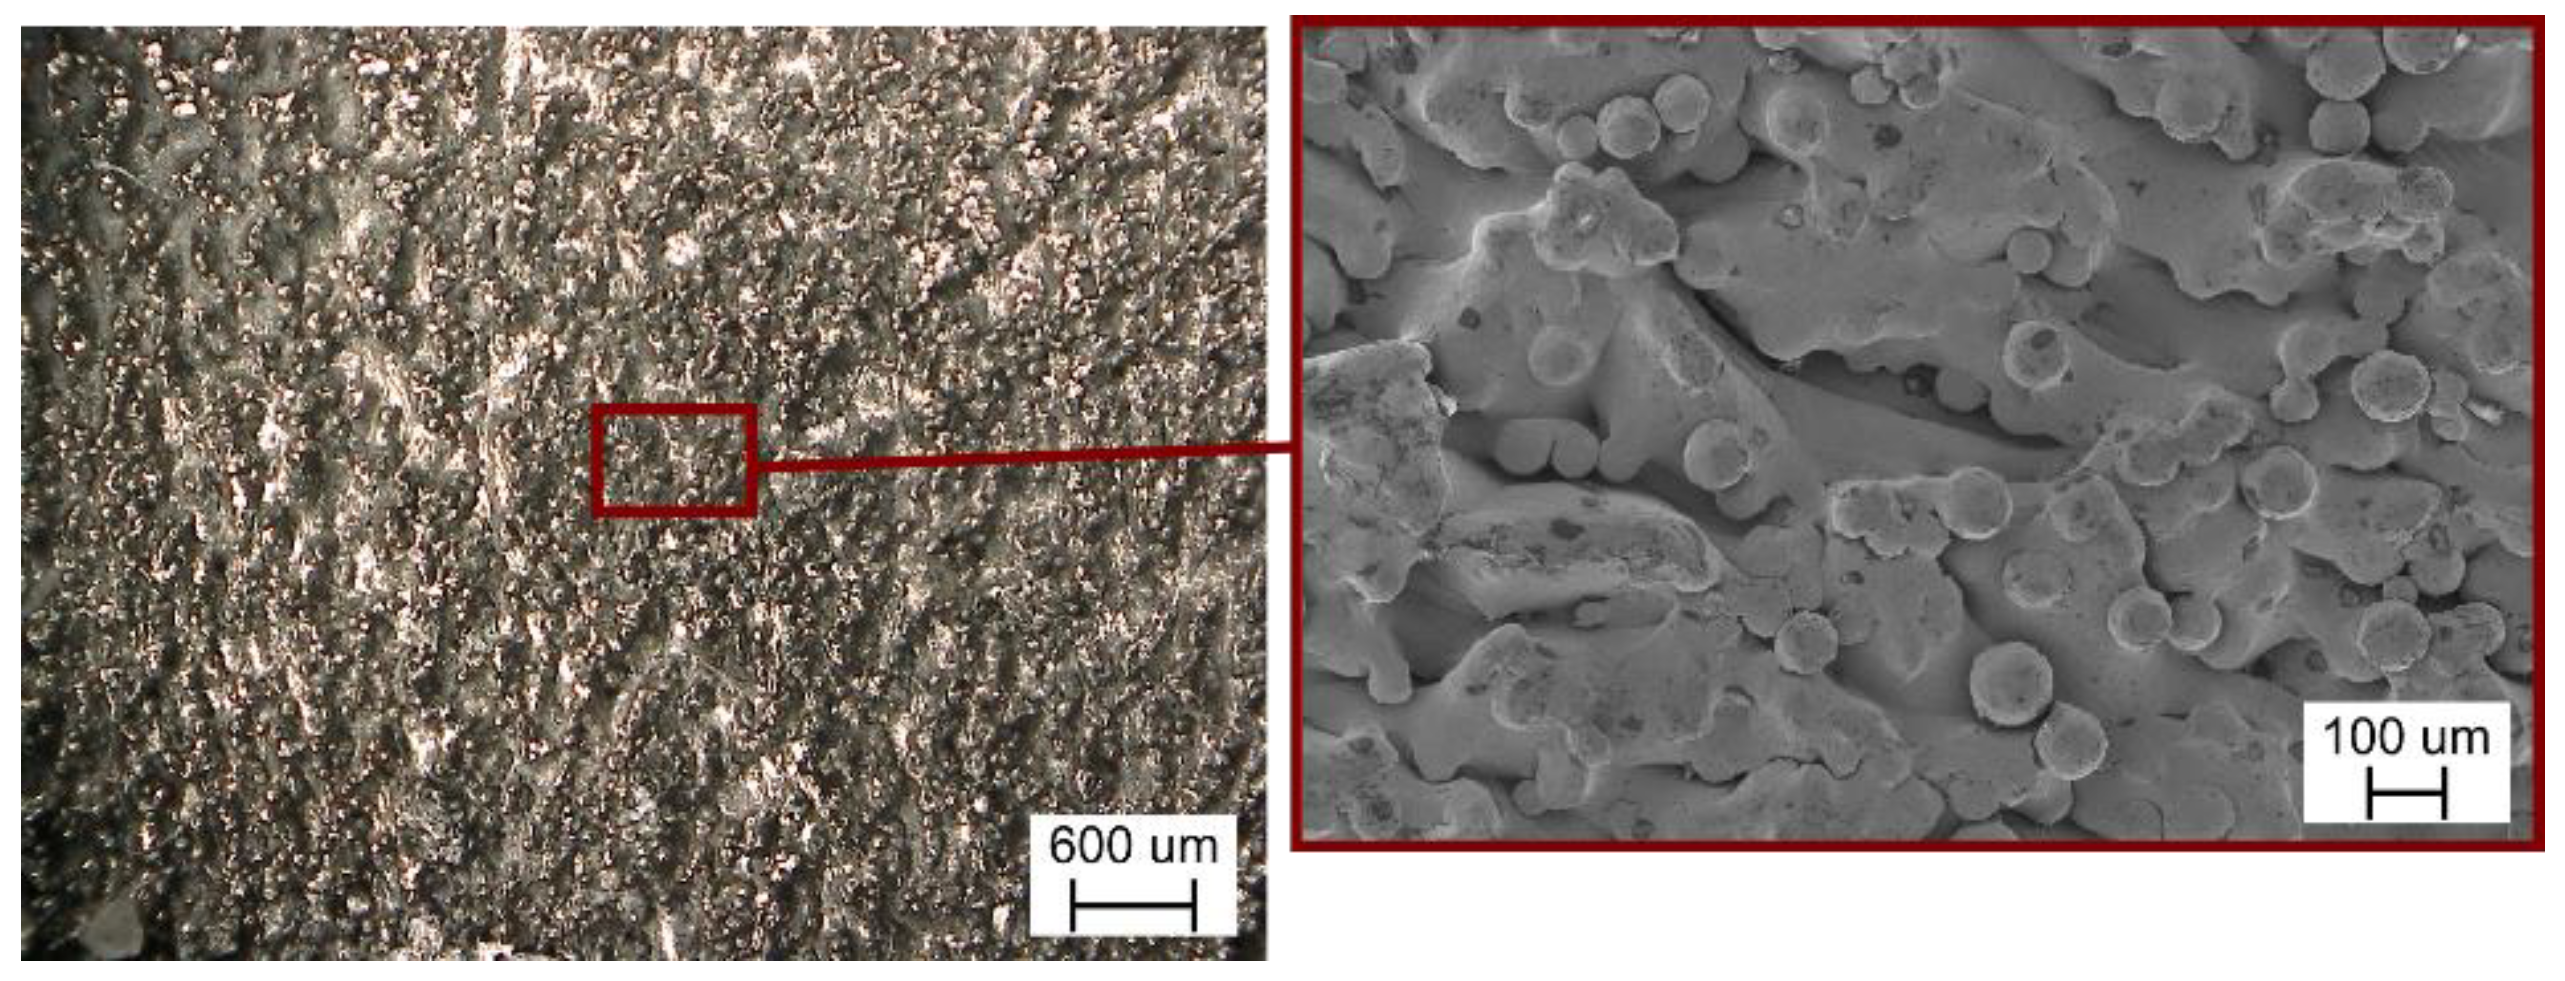
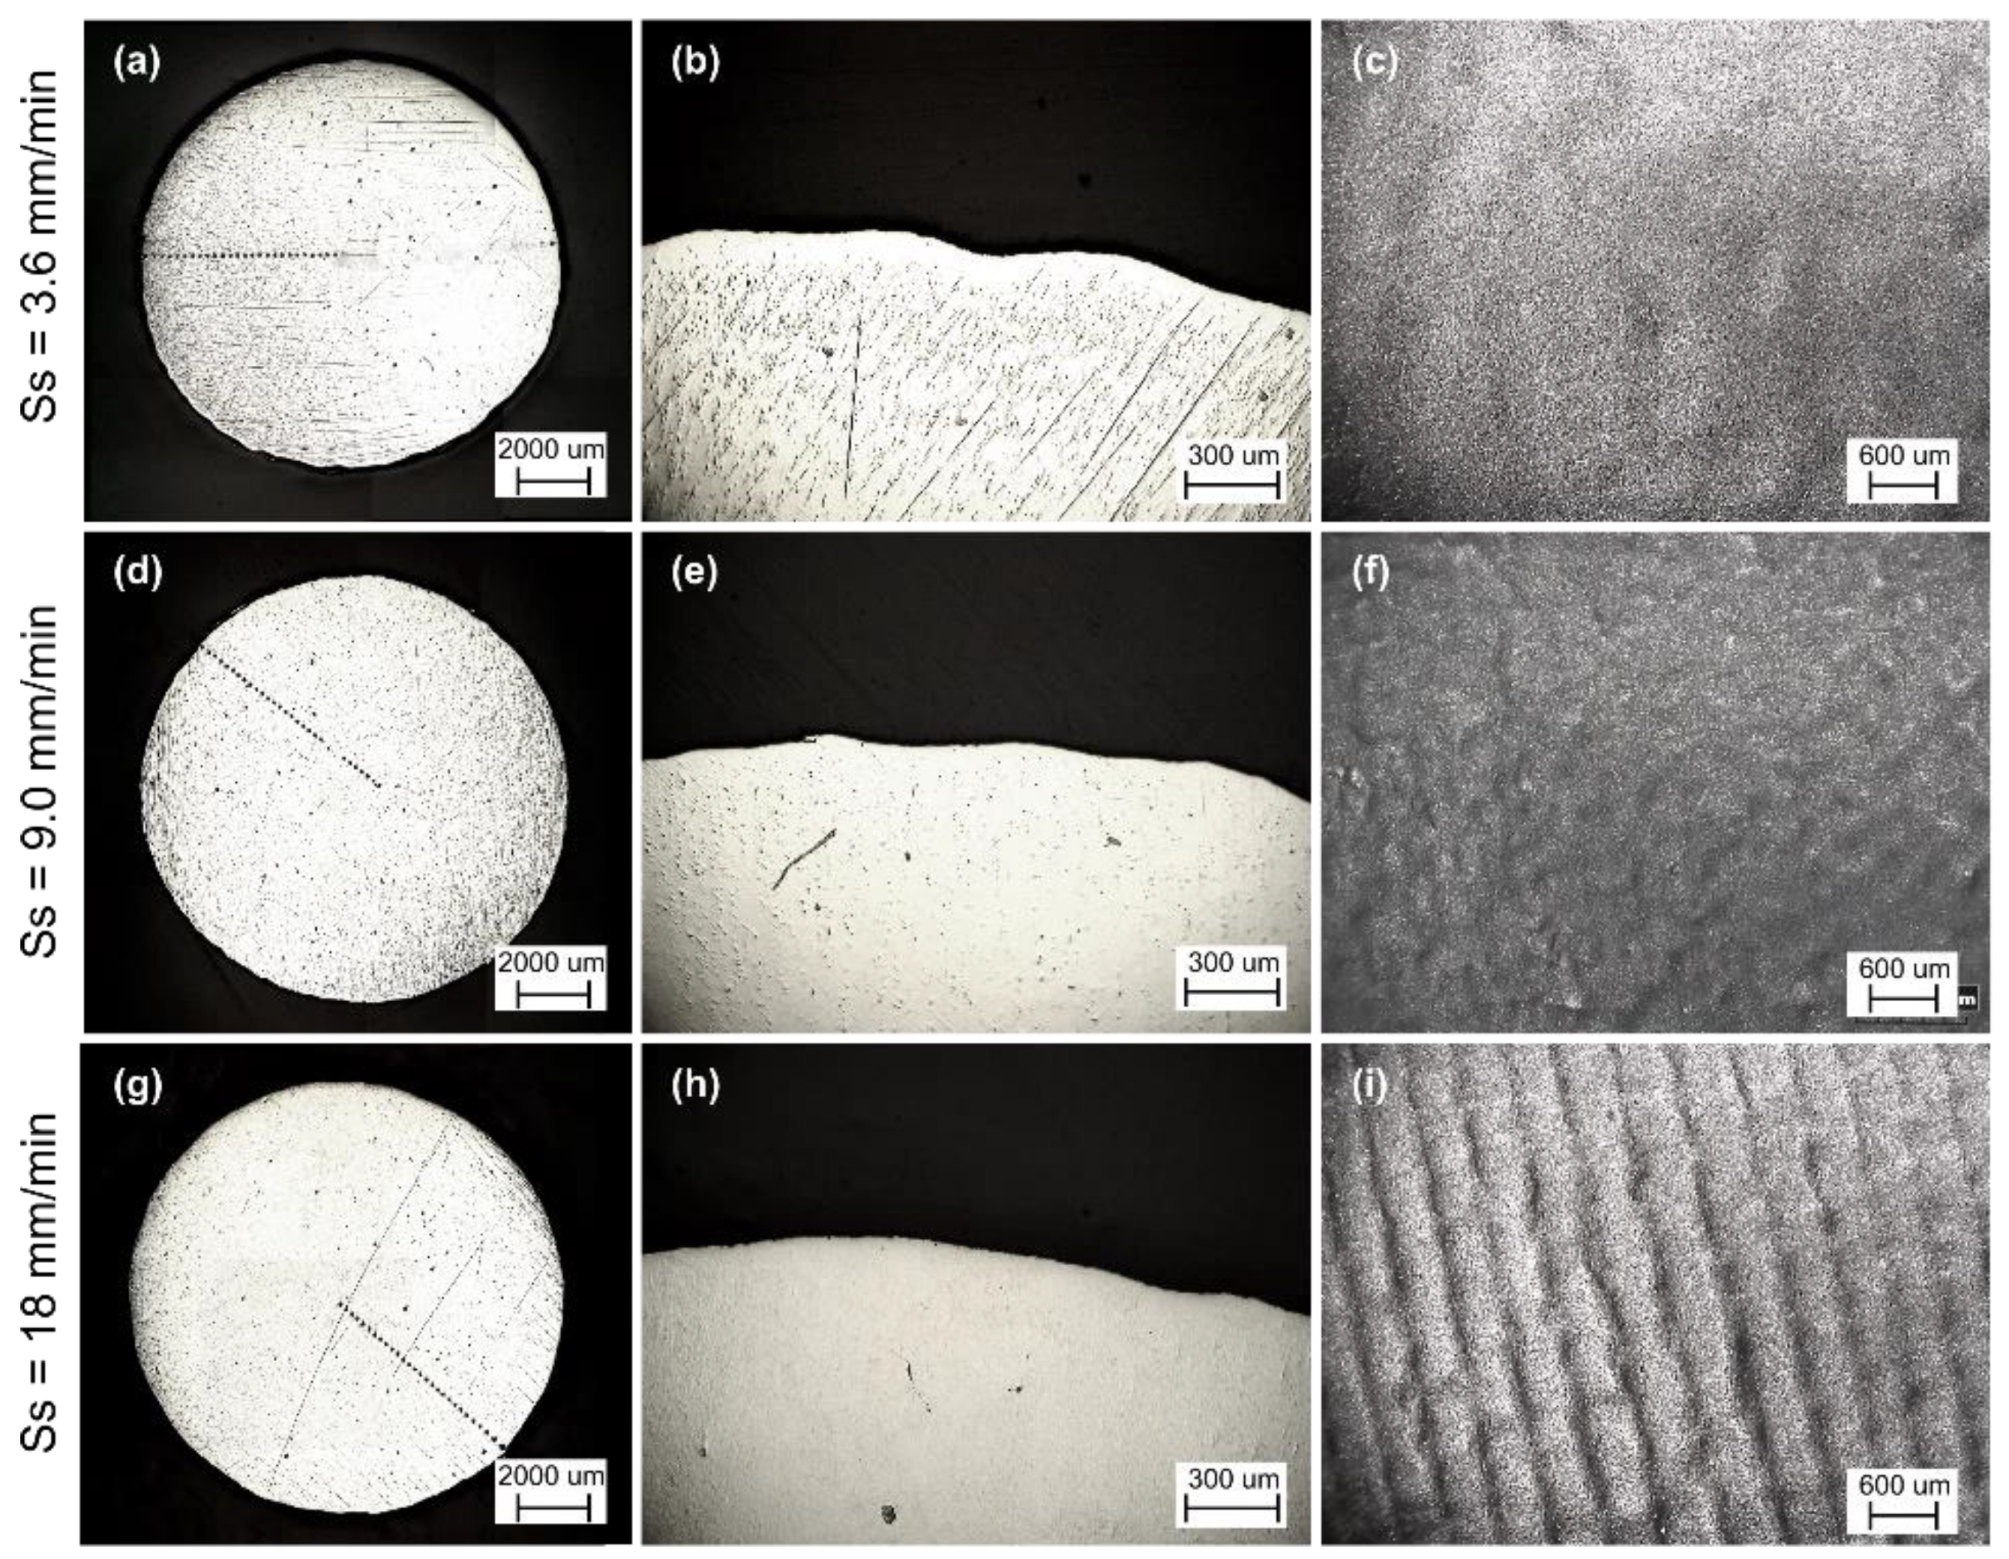
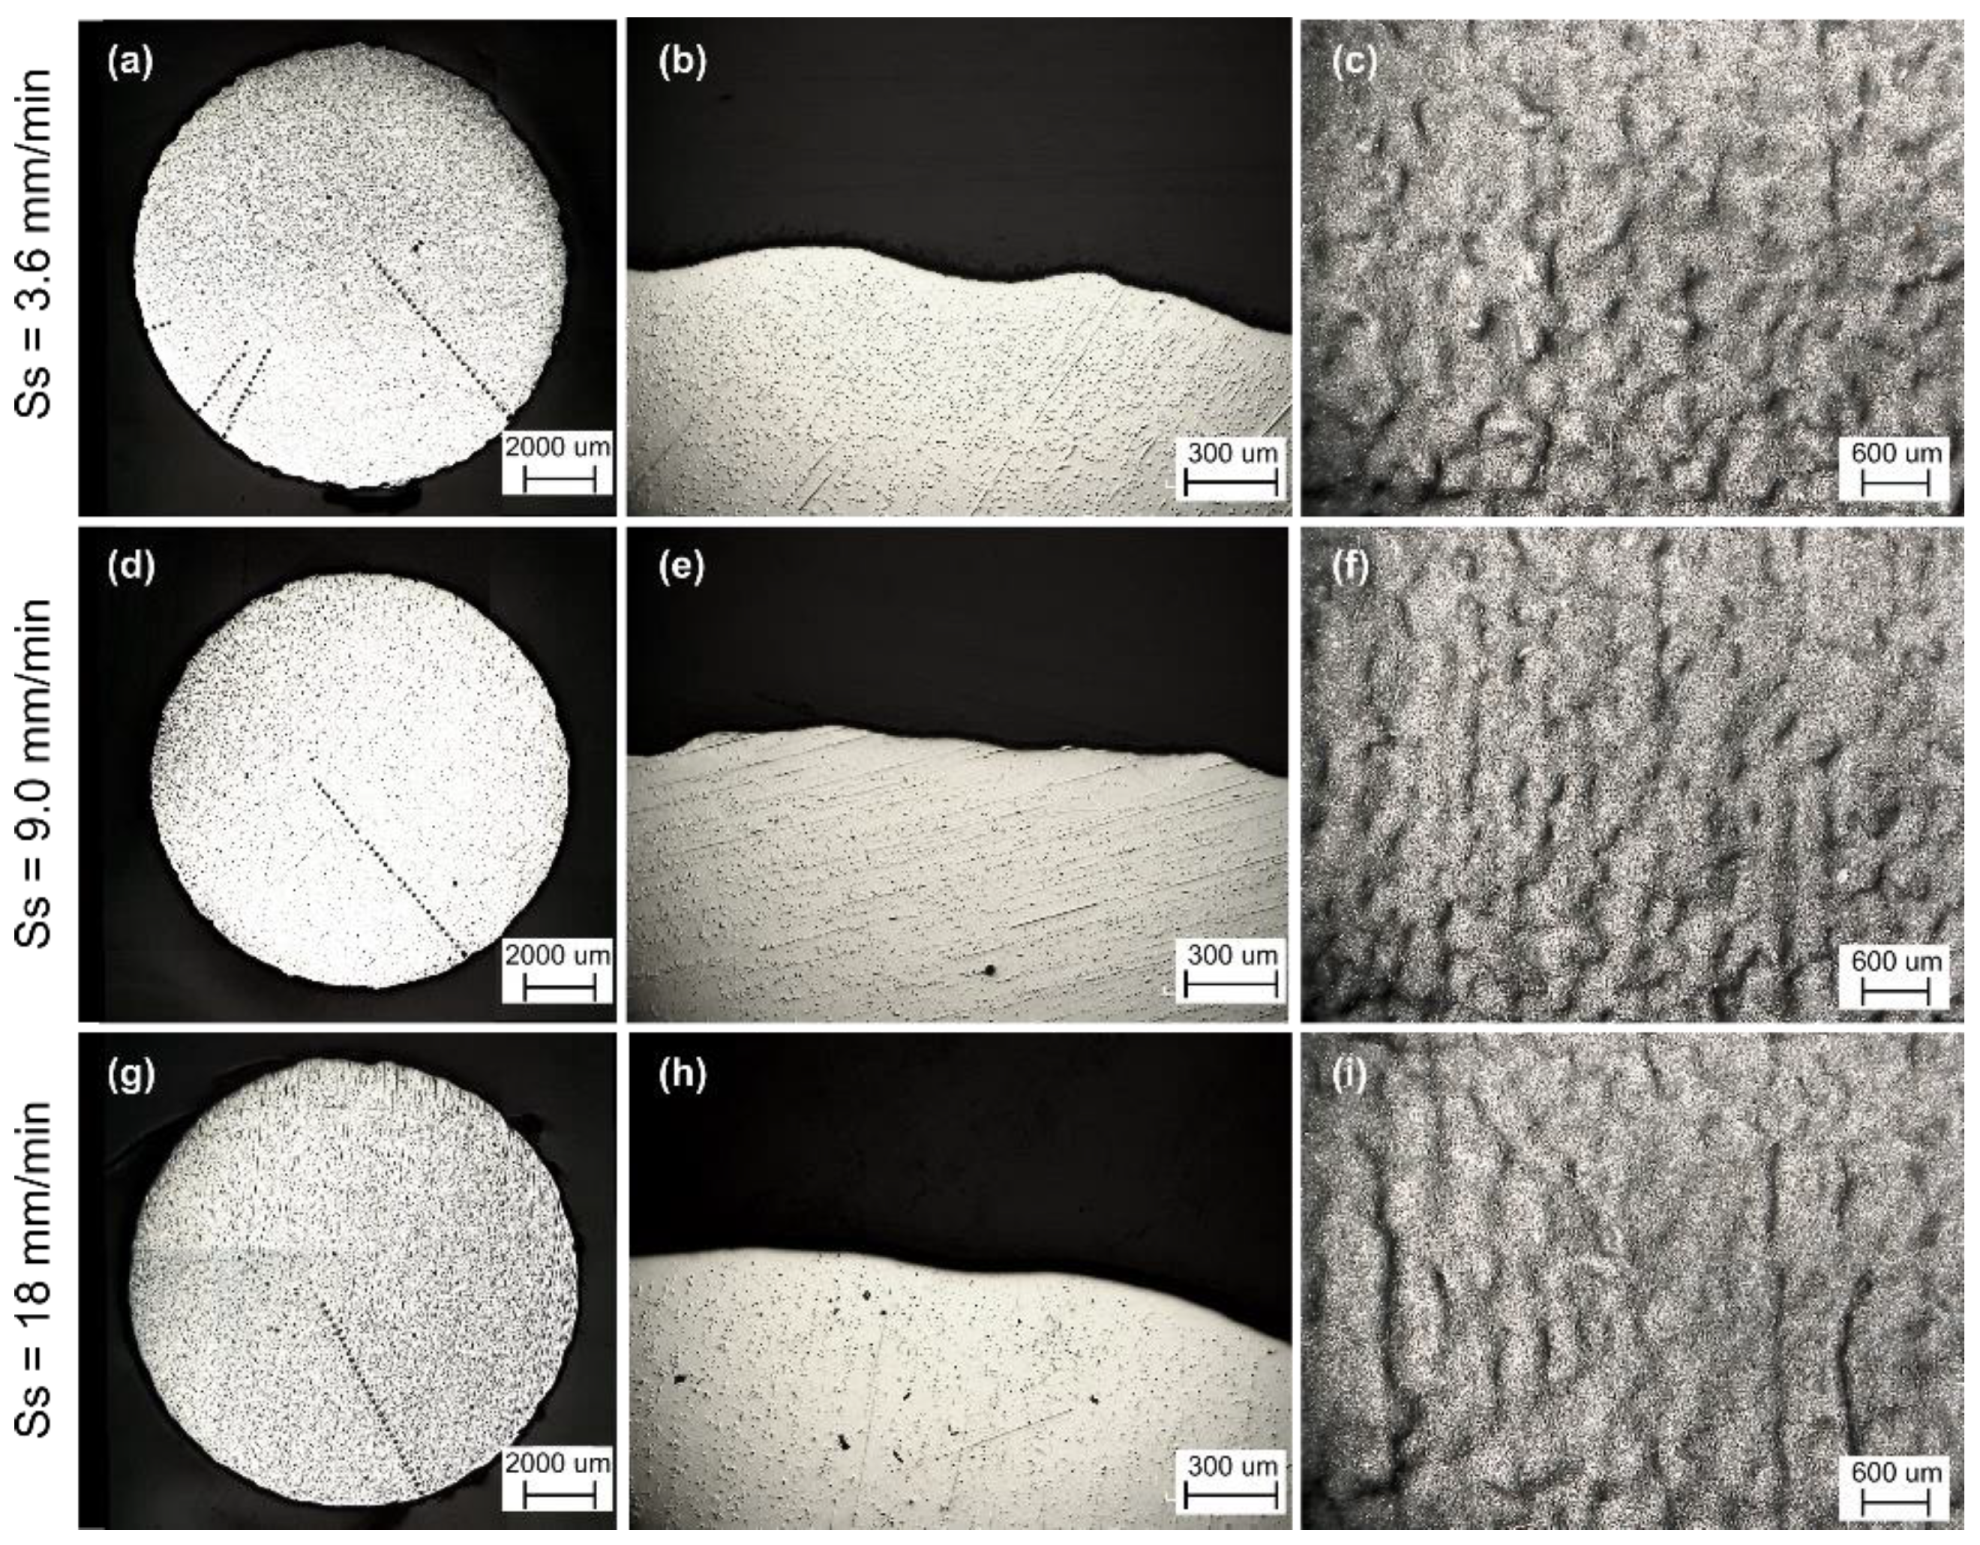
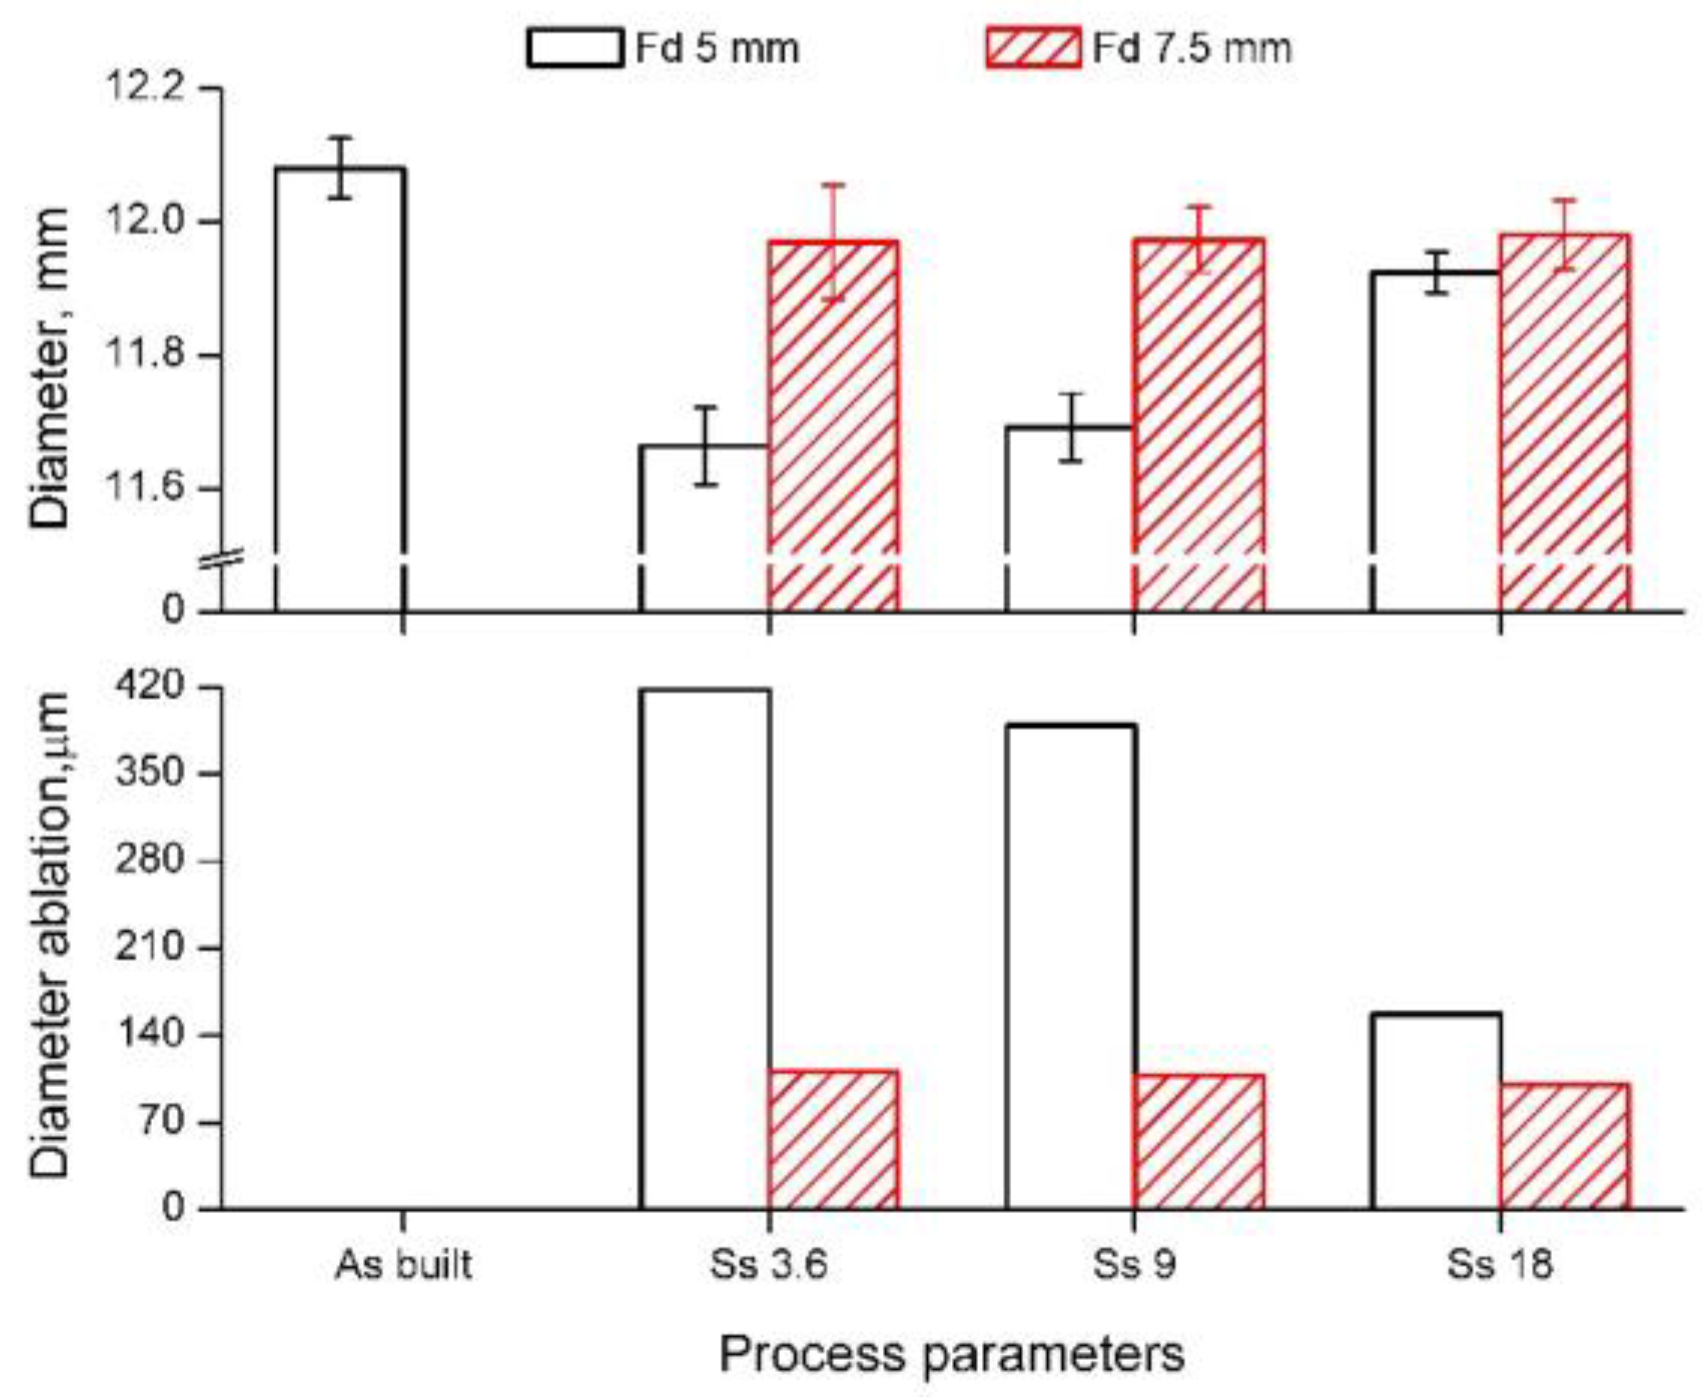
3.2. Morphological Analysis
3.3. Surface Roughness
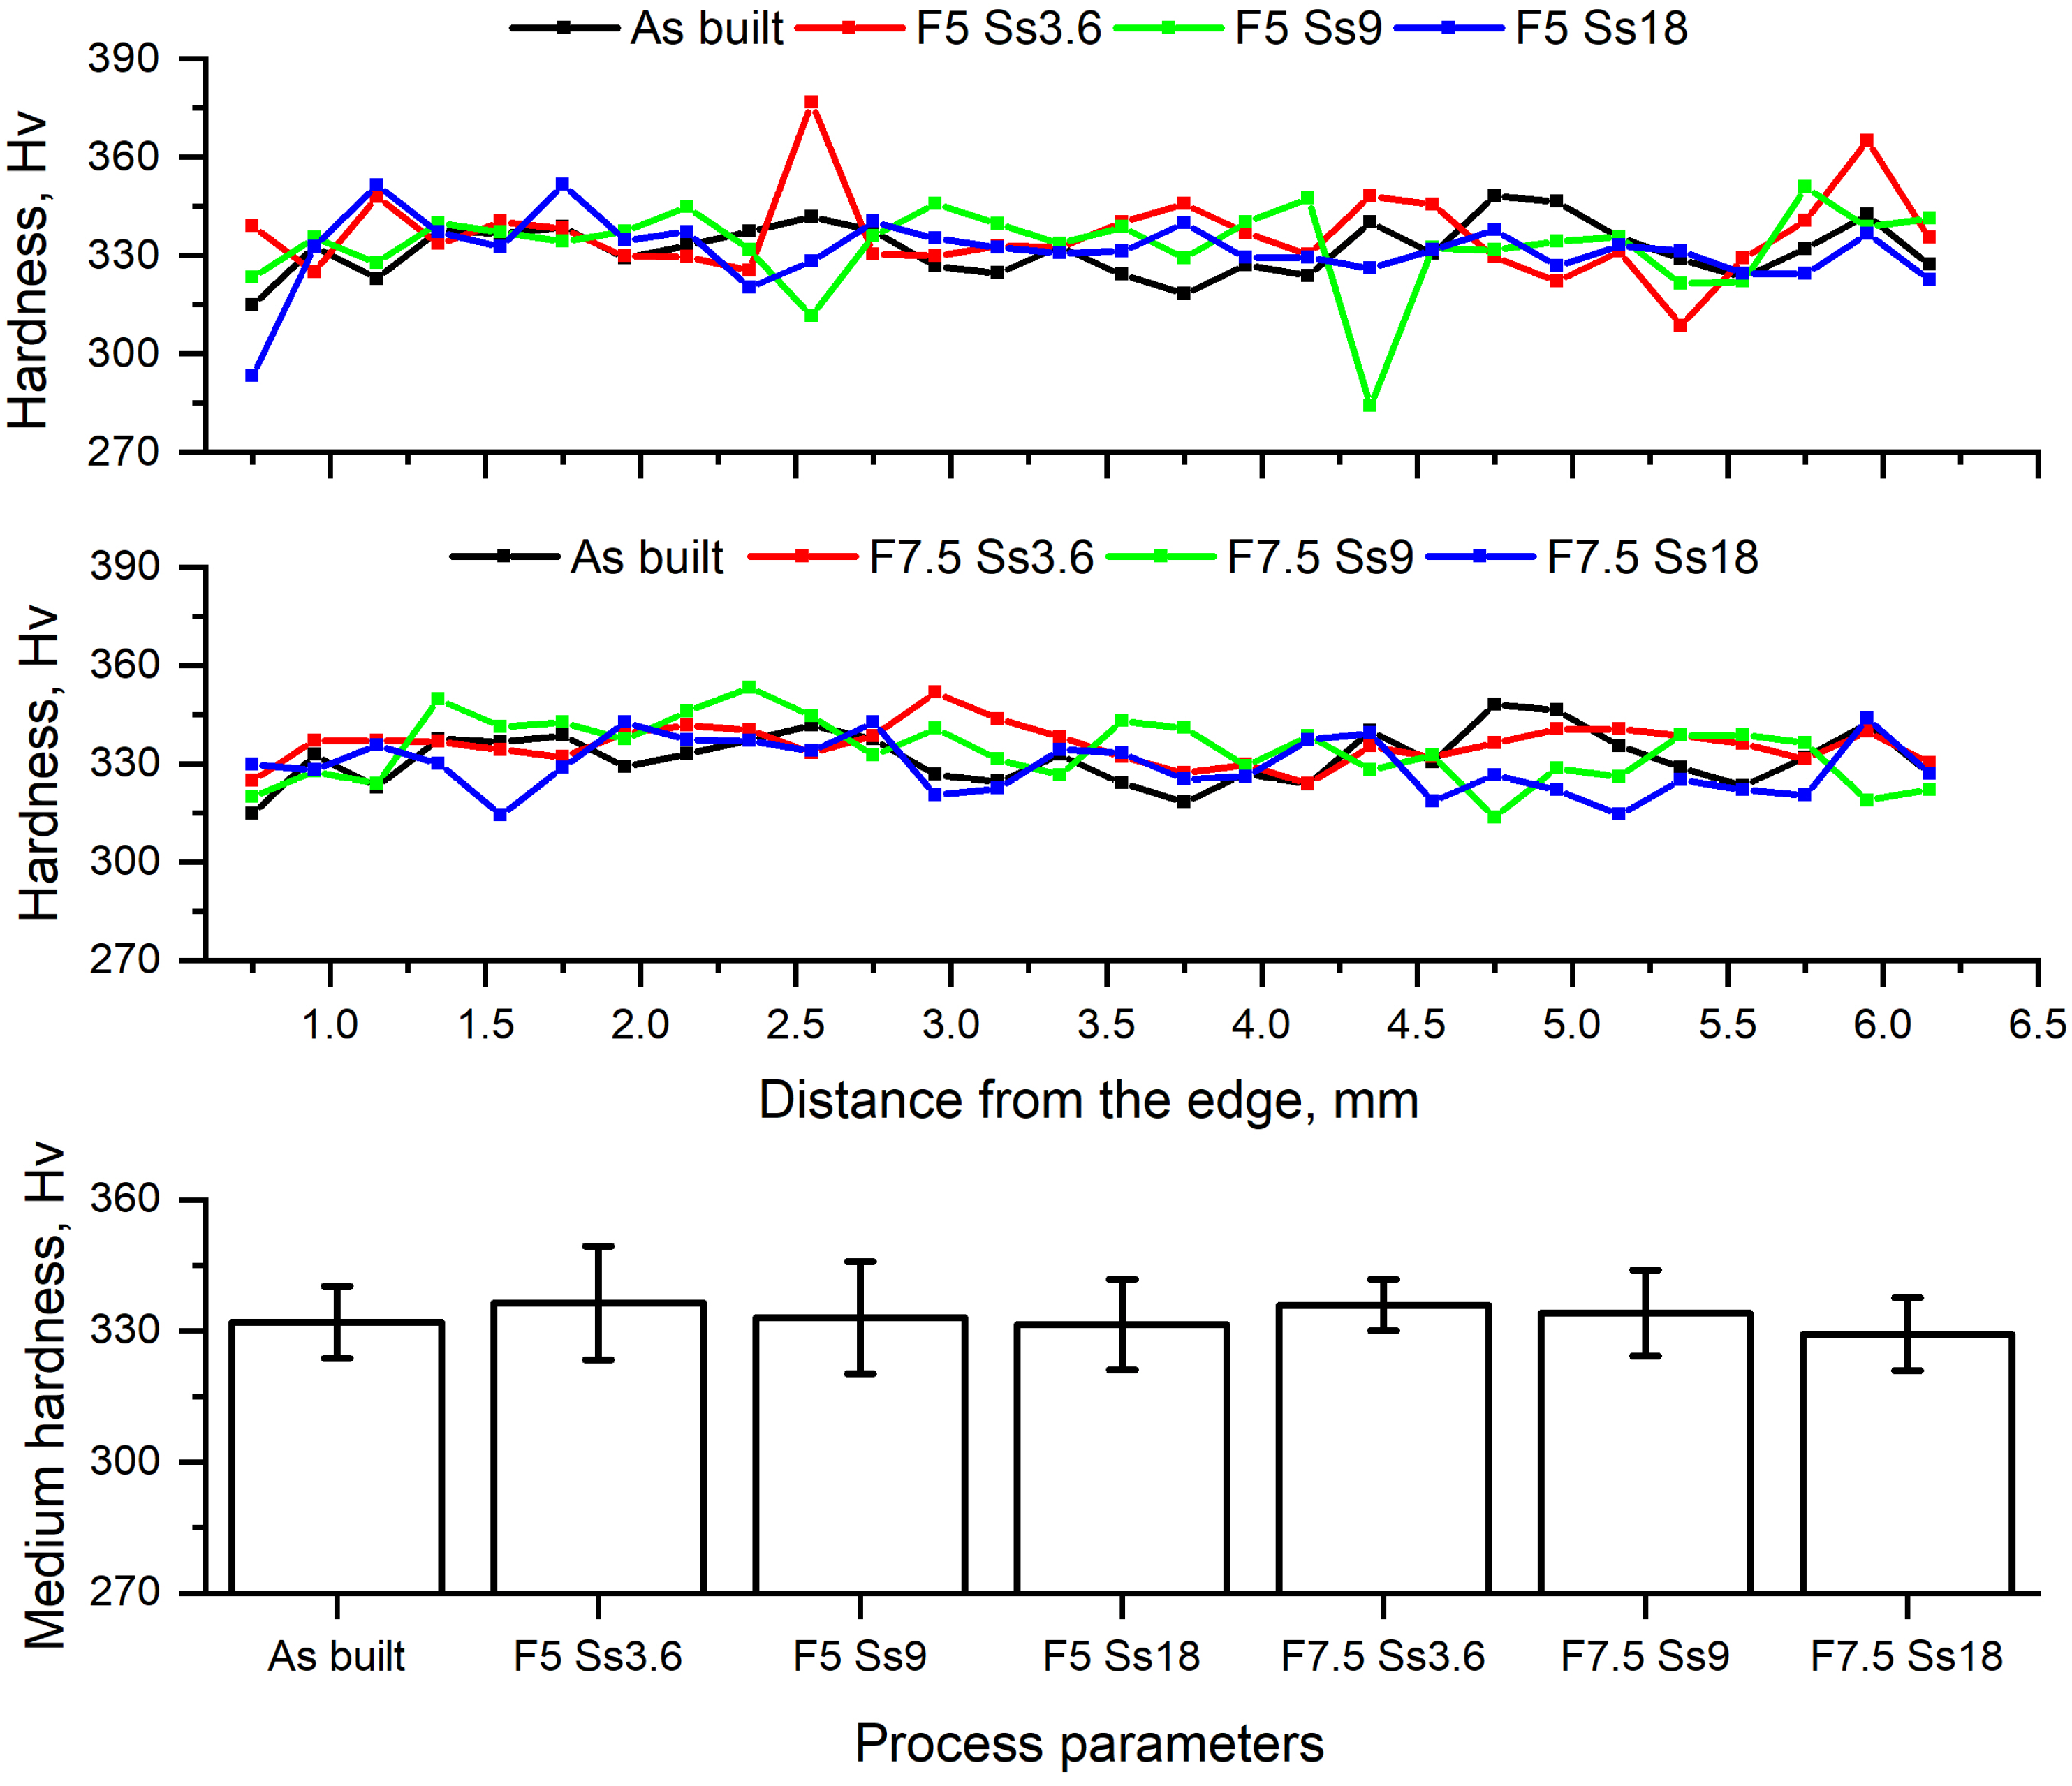
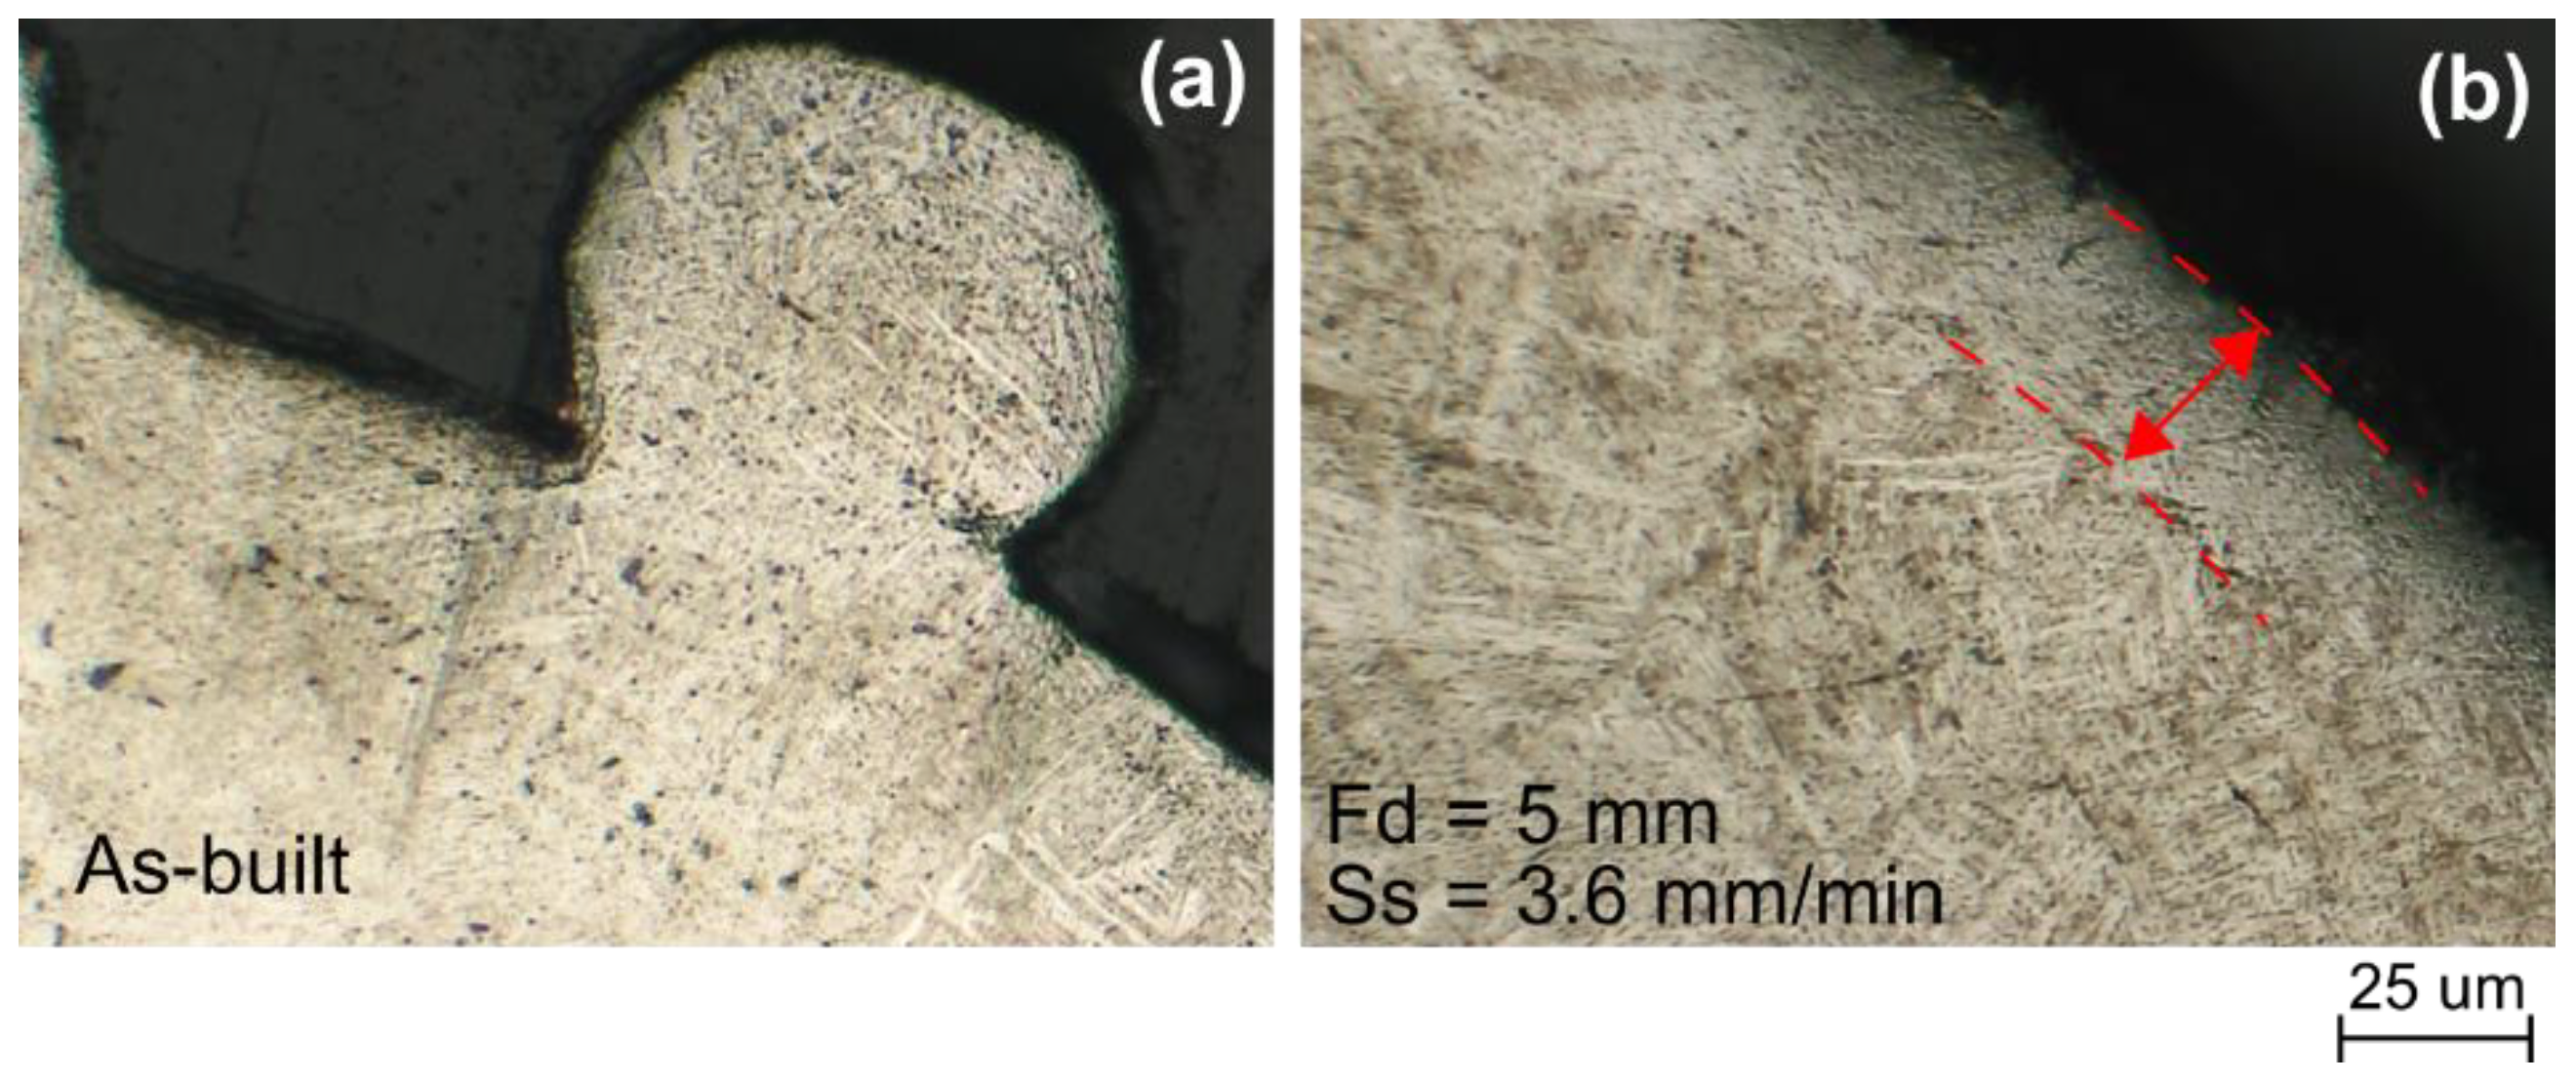
3.4. Microhardness Analysis
4. Conclusions
Author Contributions
Funding
Conflicts of Interest
References
- Bandyopadhyay, A.; Bose, S. Additive Manufacturing; CRC Press: Boca Raton, FL, USA, 2016. [Google Scholar]
- Atzeni, E.; Barletta, M.; Calignano, F.; Iuliano, L.; Rubino, G.; Tagliaferri, V. Abrasive Fluidized Bed (AFB) finishing of AlSi10Mg substrates manufactured by Direct Metal Laser Sintering (DMLS). Addit. Manuf. 2016, 10, 15–23. [Google Scholar] [CrossRef]
- Zhang, L.-C.; Liu, Y.; Li, S.; Hao, Y. Additive Manufacturing of Titanium Alloys by Electron Beam Melting: A Review. Adv. Eng. Mater. 2018, 20, 1700842. [Google Scholar] [CrossRef]
- Manfredi, D.; Calignano, F.; Ambrosio, E.P.; Krishnan, M.; Canali, R.; Biamino, S.; Pavese, M.; Atzeni, E.; Iuliano, L.; Fino, P.; et al. Direct Metal Laser Sintering: An additive manufacturing technology ready to produce lightweight structural parts for robotic applications. Metall. Ital. 2013, 105, 15–24. [Google Scholar]
- Chern, A.H.; Nandwana, P.; Yuan, T.; Kirka, M.M.; Dehoff, R.R.; Liaw, P.K.; Duty, C.E. A review on the fatigue behavior of Ti–6Al–4V fabricated by electron beam melting additive manufacturing. Int. J. Fatigue 2019, 119, 173–184. [Google Scholar] [CrossRef]
- Khaing, M.; Fuh, J.Y.; Lu, L. Direct metal laser sintering for rapid tooling: Processing and characterisation of EOS parts. J. Mater. Process. Technol. 2001, 113, 269–272. [Google Scholar] [CrossRef]
- Thijs, L.; Verhaeghe, F.; Craeghs, T.; Van Humbeeck, J.; Kruth, J.-P. A study of the microstructural evolution during selective laser melting of Ti–6Al–4V. Acta Mater. 2010, 58, 3303–3312. [Google Scholar] [CrossRef]
- Wycisk, E.; Emmelmann, C.; Siddique, S.; Walther, F. High Cycle Fatigue (HCF) Performance of Ti–6Al–4V Alloy Processed by Selective Laser Melting. Adv. Mater. Res. 2013, 816, 134–139. [Google Scholar] [CrossRef]
- Ahmed, N.; Abdo, B.M.; Darwish, S.; Moiduddin, K.; Pervaiz, S.; AlAhmari, A.M.; Naveed, M. Electron beam melting of titanium alloy and surface finish improvement through rotary ultrasonic machining. Int. J. Adv. Manuf. Technol. 2017, 92, 3349–3361. [Google Scholar] [CrossRef]
- Greitemeier, D.; Donne, C.D.; Syassen, F.; Eufinger, J.; Melz, T. Effect of surface roughness on fatigue performance of additive manufactured Ti–6Al–4V. Mater. Sci. Technol. 2016, 32, 629–634. [Google Scholar] [CrossRef]
- Bagehorn, S.; Wehr, J.; Maier, H. Application of mechanical surface finishing processes for roughness reduction and fatigue improvement of additively manufactured Ti–6Al–4V parts. Int. J. Fatigue 2017, 102, 135–142. [Google Scholar] [CrossRef]
- Nicoletto, G.; Konečná, R.; Frkáň, M.; Riva, E. Surface roughness and directional fatigue behavior of as-built EBM and DMLS Ti6Al4V. Int. J. Fatigue 2018, 116, 140–148. [Google Scholar] [CrossRef]
- Lamikiz, A.; Sanchez, J.A.; De Lacalle, L.L.; Arana, J.; Mentxaka, A.L.; De Lacalle, L.N.L. Laser polishing of parts built up by selective laser sintering. Int. J. Mach. Tools Manuf. 2007, 47, 2040–2050. [Google Scholar] [CrossRef]
- Temmler, A.; Willenborg, E.; Wissenbach, K. Laser Polishing. SPIE LASE 2012, 8243, 82430. [Google Scholar]
- Ukar, E.; Lamikiz, A.; De Lacalle, L.L.; Del Pozo, D.; Arana, J.; Mentxaka, A.L.; De Lacalle, L.N.L. Laser polishing of tool steel with CO2 laser and high-power diode laser. Int. J. Mach. Tools Manuf. 2010, 50, 115–125. [Google Scholar] [CrossRef]
- Ma, C.; Guan, Y.; Zhou, W. Laser polishing of additive manufactured Ti alloys. Opt. Lasers Eng. 2017, 93, 171–177. [Google Scholar] [CrossRef]
- Scherillo, F. Chemical surface finishing of AlSi10Mg components made by additive manufacturing. Manuf. Lett. 2019, 19, 5–9. [Google Scholar] [CrossRef]
- Tyagi, P.; Goulet, T.; Riso, C.; Garcia-Moreno, F. Reducing surface roughness by chemical polishing of additively manufactured 3D printed 316 stainless steel components. Int. J. Adv. Manuf. Technol. 2019, 100, 2895–2900. [Google Scholar] [CrossRef]
- Gora, W.S.; Tian, Y.; Cabo, A.P.; Ardron, M.; Maier, R.R.; Prangnell, P.; Weston, N.J.; Hand, D.P. Enhancing Surface Finish of Additively Manufactured Titanium and Cobalt Chrome Elements Using Laser Based Finishing. Phys. Procedia 2016, 83, 258–263. [Google Scholar] [CrossRef]
- Gisario, A.; Barletta, M.; Veniali, F. Surface reconstruction of porous substrates in sintered bronze by cw-high power diode laser. Opt. Lasers Eng. 2012, 50, 1306–1315. [Google Scholar] [CrossRef]
- Chang, C.-S.; Chen, T.-H.; Li, T.-C.; Lin, S.-L.; Liu, S.-H.; Lin, J.-F. Influence of laser beam fluence on surface quality, microstructure, mechanical properties, and tribological results for laser polishing of SKD61 tool steel. J. Mater. Process. Technol. 2016, 229, 22–35. [Google Scholar] [CrossRef]
- Campanelli, S.; Casalino, G.; Contuzzi, N.; Ludovico, A. Taguchi Optimization of the Surface Finish Obtained by Laser Ablation on Selective Laser Molten Steel Parts. Procedia CIRP 2013, 12, 462–467. [Google Scholar] [CrossRef]
- Ti6Al4V ELI Titanium Alloy Arcam EBM System. Available online: www.arcam.com (accessed on 17 July 2019).
- Gadelmawla, E.; Koura, M.; Maksoud, T.; Elewa, I.; Soliman, H. Roughness parameters. J. Mater. Process. Technol. 2002, 123, 133–145. [Google Scholar] [CrossRef]
- Kibria, G.; Lepcha, L.P.; Shivakoti, I.; Doloi, B.; Bhattacharyya, B. Pulsed Nd:YAG Laser Micro-turning of Alumina to Study the Effect of Overlap Factors on Surface Roughness Performance. IOP Conf. Ser. Mater. Sci. Eng. 2018, 377, 012185. [Google Scholar] [CrossRef]
- Wu, S.; Lu, Y.; Gan, Y.; Huang, T.; Zhao, C.; Lin, J.; Guo, S.; Lin, J. Microstructural evolution and microhardness of a selective-laser-melted Ti–6Al–4V alloy after post heat treatments. J. Alloys Compd. 2016, 672, 643–652. [Google Scholar] [CrossRef]
- Hahn, J.D.; Shin, Y.C.; Krane, M.J.M. Laser transformation hardening of Ti–6Al–4V in solid state with accompanying kinetic model. Surf. Eng. 2007, 23, 78–82. [Google Scholar] [CrossRef]


| Characteristics | Units | Value |
|---|---|---|
| Maximum build size | mm3 | 200 × 200 × 380 |
| Beam power | W | 3000 |
| Cathode type | -- | Tungsten filament |
| Min. beam diameter | µm | 250 |
| Max. EB translation speed | m/s | 8000 |
| Vacuum base pressure | mbar | 5 × 10⁻⁴ |
| Build atmosphere (partial pressure of He) | mbar | 2 × 10⁻³ |
| He consumption | l/h | 1 |
| CAD interface standard | -- | STL |
| Characteristics | Units | Value |
|---|---|---|
| Source type | -- | Yb-YAG |
| Wavelength | nm | 1070 |
| M2 factor | -- | 5.87 |
| Regime | -- | CW/QCW |
| Maximal average power | W | 450 (CW/QCW) |
| Maximal peak power | W | 4500 (in QCW) |
| Pulse duration | ms | 0.05–50 ms (in QCW) |
| Focal length | mm | 100 |
| Declared focal spot | μm | ≈60 |
| Control Factors | Labels | Low (−) | Middle (0) | High (+) | Unit |
|---|---|---|---|---|---|
| Scan speed | Ss | 3.6 | 9 | 18 | mm/min |
| Focal distance | Fd | 5 | -- | 7.5 | mm |
| Profile | Cutoff | Evaluation Length | |
|---|---|---|---|
| Rz (μm) | Ra (μm) | λ (mm) | ln (mm) |
| Up to 0.1 | Up to 0.02 | 0.08 | 0.4 |
| 0.1–0.5 | 0.02–1 | 0.25 | 1.25 |
| 0.5–10 | 1–2 | 0.8 | 4 |
| 10–50 | 2–10 | 2.5 | 12.5 |
| 50–200 | 10–80 | 8 | 40 |
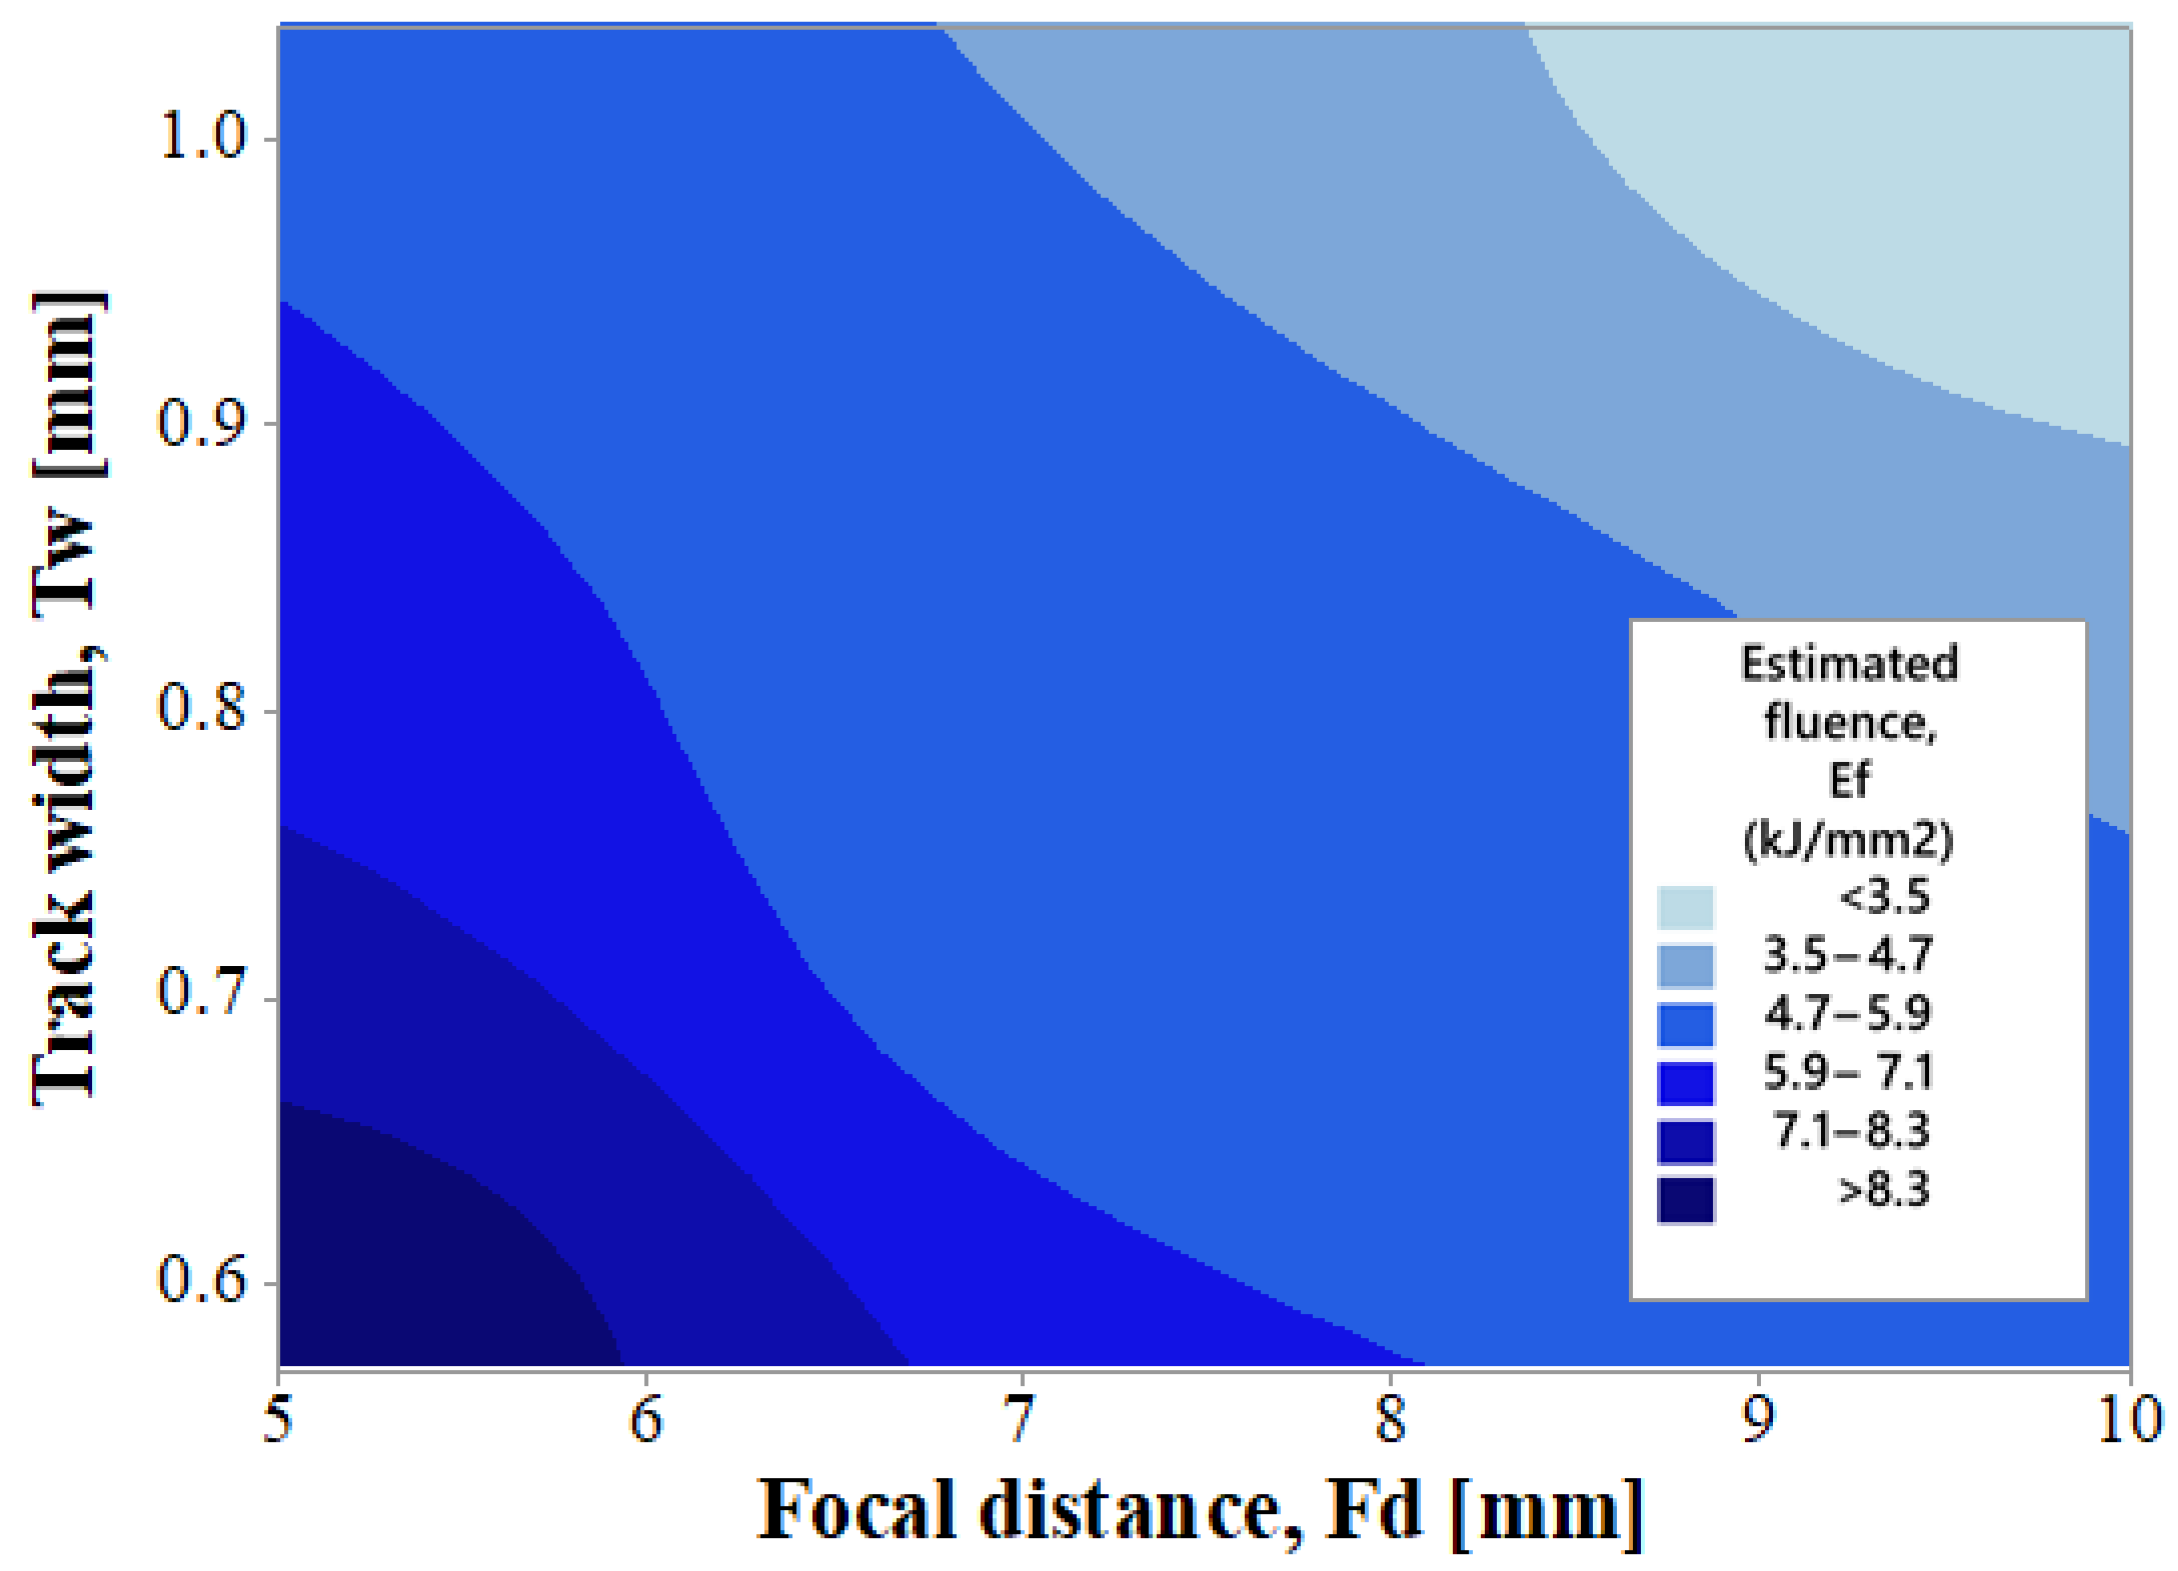
| Focal Distance, Fd (mm) | Track Width, Tw (mm) |
|---|---|
| 5 | 0.57 |
| 7.5 | 0.74 |
| 10 | 1.04 |
| Ss (mm/min) | Circumferential Overlap Percentage (%) | |
|---|---|---|
| Fd = 5 mm | Fd = 7.5 mm | |
| 3.6 | 97 | 98 |
| 9 | 92 | 94 |
| 18 | 84 | 88 |
| Source | DF | Adj SS | Adj MS | F-Value | p-Value |
|---|---|---|---|---|---|
| Fd (mm) | 1 | 623.46 | 623.463 | 142.26 | 0.000 |
| Ss (mm/min) | 2 | 149.35 | 74.673 | 17.04 | 0.003 |
| Fd (mm) × Ss (mm/min) | 2 | 194.40 | 97.199 | 22.18 | 0.002 |
| Error | 6 | 26.29 | 4.382 | ||
| Total | 11 | 993.50 | |||
| Model Summary | R2 97.35% | R2 (adj) 95.15% | R2 (pred) 89.41% |
© 2019 by the authors. Licensee MDPI, Basel, Switzerland. This article is an open access article distributed under the terms and conditions of the Creative Commons Attribution (CC BY) license (http://creativecommons.org/licenses/by/4.0/).
Share and Cite
Genna, S.; Rubino, G. Laser Finishing of Ti6Al4V Additive Manufactured Parts by Electron Beam Melting. Appl. Sci. 2020, 10, 183. https://doi.org/10.3390/app10010183
Genna S, Rubino G. Laser Finishing of Ti6Al4V Additive Manufactured Parts by Electron Beam Melting. Applied Sciences. 2020; 10(1):183. https://doi.org/10.3390/app10010183
Chicago/Turabian StyleGenna, Silvio, and Gianluca Rubino. 2020. "Laser Finishing of Ti6Al4V Additive Manufactured Parts by Electron Beam Melting" Applied Sciences 10, no. 1: 183. https://doi.org/10.3390/app10010183