1. Introduction
In the past few decades, energy crisis and environment problems became serious because of the increasing energy demand and the rapid economic development all over the world. Many efforts have been devoted into developing advanced energy conversion technologies to relieve the current challenging energy situation. For the existing energy sources (such as fossil fuels, solar, biomass, geothermal energy, and nuclear energy) and industrial waste heat sources, various novel energy conversion systems were proposed in place of the conventional ones to improve energy utilization [
1]. Among these proposed systems, the supercritical CO
2 power cycle (sCO
2) is considered to be a promising technology with great potential and competiveness owing to its advantages of a compact structure, environmental friendliness and high efficiency [
2,
3,
4]. The sCO
2 power cycle operates above the critical point of CO
2 (31.3 °C, 7.39 MPa). Due to the dramatic changes of thermodynamic properties near the critical point, the inlet state of its compressor is always designed just above the critical point so that the compressor work can be reduced significantly. Hence, cooling the CO
2 before compression process can be beneficial to the efficiency improvement [
5,
6,
7]. However, a huge amount of heat is inevitably rejected by the cooler during the cooling process. So, it is worthwhile to reuse this low-grade heat energy through waste heat recovery systems to improve the performance of the sCO
2 cycle [
8,
9].
Various waste heat power generation systems were adopted to recover the waste heat of the sCO
2 cycle. Chacartegui et al. [
10] applied an Organic Rankine Cycle (ORC) to reuse this waste heat for producing electric power, and compared the combined sCO
2/ORC system with two stand-alone closed CO
2 cycles. They conclu ded that the addition of ORC could improve the thermal efficiency by 7–12%. Akbari and Mahmoudi [
11] conducted a thermoeconomic analysis for a combined recompression sCO
2/ORC system. Compared to the stand-alone sCO
2 cycle, the exergy efficiency increased by up to 11.7% and the total product unit cost decreased by up to 5.7% for the combined sCO
2/ORC system. Wang and Dai [
12] compared a transcritical CO
2 cycle (tCO
2) with an ORC as the bottoming cycle for a recompression sCO
2 cycle. The sCO
2/tCO
2 system showed a better performance than the sCO
2/ORC system at a lower pressure ratio, while the latter had a slightly lower total product unit cost than the former. Besarati and Goswami [
13] chose ORC as the bottoming cycle for a simple sCO
2 cycle, a recompression sCO
2 cycle, and a partial cooling sCO
2 cycle. It was concluded that the recompression sCO
2/ORC system presented the maximum combined cycle efficiency. Some researchers also integrated a Kalina cycle with the sCO
2 cycle to enhance the overall system performances. Li et al. [
14] proposed a combined recompression sCO
2/Kalina cycle, and found out that the total product unit cost and exergy efficiency of the combined cycle were 5.5% lower and 8.02% higher than those of the sCO
2 cycle. Mahmoudi et al. [
15] studied the thermodynamic and economic performances for a stand-alone sCO
2 cycle and a combined sCO
2/Kalina cycle. Results showed that combining the Kalina cycle with the sCO
2 cycle could reduce the exergy destruction significantly.
In addition to the combined power generation systems above, establishing combined power and heat/cooling systems can also enhance the overall performance for the sCO
2 cycle. In the combined power and heat/cooling systems, the low-grade waste heat of the topping cycle is transformed into cooling energy or to produce heat in bottoming cycle, which can obtain better gains than transforming high-grade electric energy into low-grade heat/cooling energy because of the lower energy conversion efficiency in the electric power generation process [
16]. The absorption refrigeration cycle (ARC) is widely integrated with the sCO
2 cycle to provide electric power and cooling energy simultaneously. Wu et al. [
17] investigated an combined sCO
2 cycle/ammonia-water based ARC. The thermal efficiency, exergy efficiency, and total product unit cost of the combined cycle were 26.12% and 2.73% higher, and 2.03% lower than those of the stand-alone sCO
2 cycle, respectively. Li et al. [
18] coupled the lithium bromide-water ARC with a recompression sCO
2 cycle, and compared it with the recompression sCO
2 cycle/ammonia-water ARC. The single-objective optimization results showed that the sCO
2/LiBr-H
2O ARC system had a better performance than the sCO
2/ammonia-water ARC system. Recently, Balafkandeh et al. [
19] developed a tri-generation system by using biomass energy based on a sCO
2 cycle and a LiBr-H
2O ARC. Compared to the sCO
2 cycle, the proposed combined cycle presented a large performance improvement in terms of efficiency and environmental impacts.
A number of studies proposed combined heat and power (CHP) systems based on sCO
2 cycle to achieve heat and electric power cogeneration. Zhang et al. [
20] investigated a solar energy powered sCO
2 Rankine cycle, in which the thermal energy of recuperators was recovered by the heating water to provide heat for users directly. Moroz et al. [
21] studied several types of sCO
2 cycles in a CHP plant, and compared these sCO
2 cycles with steam CHP systems. They concluded that the sCO
2 cycle should be considered as a base for future CHP plants due to its excellent performances. However, in previous sCO
2-based CHP systems, the waste heat of the sCO
2 cycle was directly supplied to heat users. The temperature of waste heat is much higher than the heating temperature of heat users, which is inconsistent with the principle of energy cascade utilization. Thus, direct heating is not a high-efficiency method to sufficiently utilize the waste heat of the sCO
2 cycle. Compared with the conventional direct heating (DH) systems, the advantage of heat amplification makes absorption heat pump (AHP) a preferable choice that can produce more heat to satisfy the user demand [
22], especially when the waste heat of the sCO
2 cycle is limited or insufficient for users. However, very limited efforts were devoted to comprehensively analyzing the feasibility of AHP to recover the waste heat of the sCO
2 cycle based on the principle of energy cascade utilization. Consequently, the purpose of this study is to propose a combined sCO
2/AHP system for high-efficiency heat and power cogeneration, and to compare it with existing systems to present its advantages quantitatively.
On the other side, the most frequently used working fluids for AHP are an ammonia-water solution and a LiBr-H
2O solution. Both of them were frequently considered for comparison and discussion [
23,
24]. The LiBr-H
2O AHP has a smaller operational pressure and can be easier to achieve than the ammonia-water AHP. Besides, if the working fluid leaks, the water vapor in LiBr-H
2O AHP is much safer than the ammonia vapor in ammonia-water AHP. Therefore, the LiBr-H
2O AHP will be the main focus of this study while the ammonia-water AHP will be adopted as a comparison. To the best of the authors’ knowledge, the LiBr-H
2O AHP has never been applied as a bottoming cycle to recover the waste heat of the sCO
2 cycle. Thus, a combined sCO
2/LiBr-H
2O AHP system is first proposed in this study as a novel high-efficiency CHP system.
In this study, a preliminary design and analysis of a CHP system is carried out, in which the topping cycle is a sCO2 cycle driven by a nuclear reactor to generate electric power and the bottoming cycle is a LiBr-H2O AHP to recover the waste heat of topping cycle for producing heat. Firstly, the sCO2/LiBr-H2O AHP system is proposed and investigated in terms of energy, exergy, and exergoeconomics. A single sCO2 cycle, a sCO2/DH system, and a sCO2/ammonia-water AHP system are compared with the sCO2/LiBr-H2O AHP system in order to show its advantages. Then, parametric analysis is performed to reveal the influences of several key system parameters, namely the turbine inlet temperature, compressor pressure ratio, generator temperature and evaporator temperature, on the power generation, heating, and overall performances for these systems. Finally, performances of these systems are optimized and then compared by utilizing the particle swarm optimization (PSO) algorithm.
2. System Description and Assumptions
Figure 1a,b depict the schematic diagrams of the proposed sCO
2/LiBr-H
2O AHP system (supercritical CO
2 recompression Brayton cycle/LiBr-H
2O absorption heat pump system) and a sCO
2/DH system (supercritical CO
2 recompression Brayton cycle/direct heating system), respectively. In the sCO
2/DH system, a conventional direct heating system is applied to recover the waste heat in the cooler of the sCO
2 cycle. The waste heat is supplied to heat users through a direct heat exchanger (DHE). Thus, the sCO
2/DH system consists of a turbine, a main compressor (MC), a recompression compressor (RC), a high-temperature recuperator (HTR), a low-temperature recuperator (LTR), a cooler, and a DHE, as shown in
Figure 1b.
The following
Figure 1 shows the schematic diagrams of combined heat and power systems: (a) the sCO
2/AHP system; (b) the sCO
2/DH system.
Differently in the sCO
2/LiBr-H
2O AHP system, a part of the waste heat in the cooler is transferred to a LiBr-H
2O based AHP, so that the heat amount can be amplified to produce more heat for users, especially when the waste heat of the sCO
2 cycle is insufficient to satisfy the demand. The AHP includes a generator, an absorber, an evaporator, a condenser, a pump, and a solution heat exchanger (SHE), as shown in
Figure 1a.
As both LiBr-H
2O solution and ammonia-water solution are frequently utilized as working fluids, a sCO
2/ammonia-water AHP system is established in which an ammonia-water AHP is coupled with the sCO
2 cycle, so as to conduct a comparative study with the proposed sCO
2/LiBr-H
2O AHP system. As the structure and main components are the same for both combined systems,
Figure 1a also describes the sCO
2/ammonia-water AHP system.
Figure 1.
Schematic diagrams of combined heat and power systems: (a) sCO2/AHP system; (b) sCO2/DH system.
Figure 1.
Schematic diagrams of combined heat and power systems: (a) sCO2/AHP system; (b) sCO2/DH system.
2.1. Working Process of the sCO2/AHP System
As can be seen in
Figure 1a, the sCO
2/AHP system consists of four parts. The working process for each part is introduced below,
sCO2 topping cycle
- (a)
The CO2 working fluid (stream 4) absorbs heat from the reactor (stream 5) and expands in a turbine to drive an electric generator;
- (b)
After expansion, the vapor exhaust (stream 6) flows into the HTR to heat stream 3, and then the outlet working fluid (stream 7) flows into the LTR to heat stream 2;
- (c)
The working fluid after releasing heat (stream 8) is split into 8a and 8b;
- (d)
The stream 8a releases a part of heat to drive the AHP bottoming cycle, and then (stream 9) flows into the DHE (stream 10) and the cooler before compression (stream 1) in the main compressor and afterwards (stream 2) flows into the LTR to be heated (stream 3a);
- (e)
The stream 8b is compressed directly to stream 3b;
- (f)
The compressed stream 3a and stream 3b are mixed to stream 3 and then heated to stream 4 before moving into the reactor.
AHP bottoming cycle
- (a)
The diluted solution A3 (or ammonia-rich solution) absorbs heat in the SHE to state A4, and then is heated by stream 8a in the generator and separated into a strong solution A7 (or ammonia-poor solution) and a vapor stream A8;
- (b)
The stream A8 is cooled to the saturated liquid (stream A9) in the condenser, throttled by the valve 1, and then heated to saturated vapor (stream A1) in the evaporator. It is noted that the heat release in the condenser is applied to reheat the heating water;
- (c)
The strong solution A7 (or ammonia-poor solution) releases heat in the SHE and decompresses through the valve 2 to a low-pressure solution A5;
- (d)
The strong solution A5 (or ammonia-poor solution) absorbs the vapor A1 in the absorber. The merged diluted solution (or ammonia-rich solution) is cooled by the heating water, and pressured by the pump to the high-pressure solution A3.
Heating water cycle
- (a)
The low-temperature heating water from heat users is divided into stream H1 and stream H4;
- (b)
The stream H1 obtains heat from the absorber and the condenser of AHP to state H3;
- (c)
The stream H4 is heated by the CO2 working fluid (stream 9) to state H5, then mixed with stream H3 to the high-temperature heating water H6, and finally supplied to heat users.
Cooling water cycle
The cooling water (stream 11) absorbs heat in the cooler (stream 12), and then a part of it (stream 13) flows into the evaporator to heat the working fluid of AHP and finally back to the cooling tower, while another part of cooling water flows back directly to the cooling tower.
2.2. Working Process of the sCO2/DH System
The working process of the sCO
2 cycle in the sCO
2/DH system is same as that in
Section 2.1. The only difference is that the stream 8a in
Figure 1b releases heat only in the DHE, and all the heat release before the cooler is supplied to the heat users directly through the DHE.
2.3. Assumptions
The main assumptions for this study are listed as below,
- (a)
The systems are assumed to operate at a steady state, and the off-design performance or dynamic performance is not considered in this study;
- (b)
The variation of kinetic and potential energy is neglected;
- (c)
The pressure losses and heat losses of pipes and heat exchangers are neglected [
25];
- (d)
Isentropic efficiencies are assumed for the turbine, pump and compressors [
26];
- (e)
The liquid working fluid exiting the condenser (stream A9) and the generator (stream A7) is saturated liquid, while a subcooled degree of 3K is assumed at the outlet of absorber (stream A2) [
27];
- (f)
Vapor exiting the generator is assumed to be pure ammonia for the sCO
2/ammonia-water AHP system [
27,
28];
- (g)
A temperature difference or an effectiveness is assumed in each heat exchanger [
26].
4. Model Verifications
In this section, model verifications are conducted to ensure the reliability and accuracy of the thermodynamic models for the following performance evaluation and analysis. The results of present model are compared to the reported data in published studies under the same conditions. As the overall system proposed in this study contains two parts: a recompression sCO2 topping cycle and an AHP bottoming cycle, both of them should be validated. In addition, the verification of the AHP bottoming cycle is carried out for both LiBr-H2O solution and ammonia water.
By using the software Matlab, the thermodynamic and exergoeconomic simulation platform is constructed according to the mass, energy, and cost balance equations in
Section 3 to simulate the system performances under different conditions. Besides, the software REFPROP NIST is combined with Matlab to evaluate the physical and thermodynamic properties of CO
2, water, ammonia, and ammonia-water solution, but those of the LiBr-H
2O solution are not included. Therefore, according to Pátek and Klomfar [
48], a set of empirical formulas are utilized to calculate the pressure, enthalpy, entropy, density, and isobaric heat capacity of LiBr-H
2O solution in the temperature range of 273–500 K and the concentration range of 0–75 wt%. As the crystallization of LiBr-H
2O solution should be avoided during the system operation, the solubility curve of pure LiBr in water by Boryta [
49] is utilized to examine whether the crystallization occurs for all LiBr-H
2O streams. These formulas and methods cover the application range of LiBr-H
2O solution in this study and provide a solid foundation for the following analysis.
4.1. Verification of Recompression sCO2 Cycle Model
The first verification is conducted by comparing the results of the recompression sCO
2 cycle with the reported data by Sarkar and Bhattacharyya [
6] under the same conditions to validate the sCO
2 topping cycle model, as shown in
Table 6. Clearly, the simulated results of the present model show an excellent agreement with the published results. Thus, the developed thermodynamic model for the sCO
2 cycle is accurate and reliable enough to be applied for the following investigation and analysis.
Table 6 shows the comparison between the simulated results and the published data for the sCO
2 cycle.
Table 6.
Comparison between the simulated results and the published data for the sCO2 cycle.
Table 6.
Comparison between the simulated results and the published data for the sCO2 cycle.
| Parameters | x | ηth |
|---|
| Tmin (°C) | Tmax (°C) | Pmax (MPa) | PRc | Present | Published | Present | Published |
|---|
| 32 | 550 | 20 | 2.64 | 0.3332 | 0.334 | 41.18 | 41.18 |
| 32 | 550 | 30 | 3.86 | 0.3546 | 0.355 | 43.32 | 43.32 |
| 32 | 750 | 20 | 2.65 | 0.2212 | 0.223 | 46.07 | 46.07 |
| 32 | 750 | 30 | 3.94 | 0.2809 | 0.281 | 49.84 | 49.83 |
| 50 | 550 | 20 | 2.40 | 0.1842 | 0.184 | 36.71 | 36.71 |
| 50 | 550 | 30 | 2.80 | 0.2533 | 0.254 | 38.94 | 38.93 |
| 50 | 750 | 20 | 2.88 | 0.0962 | 0.109 | 43.50 | 43.50 |
| 50 | 750 | 30 | 3.08 | 0.1745 | 0.175 | 45.28 | 45.28 |
4.2. Verification of LiBr-H2O AHP Model
Then the AHP model using LiBr-H
2O solution is examined. Cheng and Shih [
47] conducted a detailed thermodynamic analysis for a LiBr-H
2O AHP and reported the main thermodynamic state points, as listed in
Table 7. By setting the same thermodynamic conditions with those in Reference [
47], the simulated results are obtained based on the present AHP model, and also listed in
Table 7 for comparison. In addition, the calculated
COHP is 1.695 here while the reported
COHP is 1.69. Obviously, the results of present model match reasonably with the published data, which proves the accuracy of the LiBr-H
2O AHP model in this study.
The following
Table 7 shows the comparison between the simulated results and the published data for LiBr-H
2O AHP.
Table 7.
Comparison between the simulated results and the published data for LiBr-H2O AHP.
Table 7.
Comparison between the simulated results and the published data for LiBr-H2O AHP.
| State Points | T (°C) | h (kJ/kg) |
|---|
| Present | Published | Present | Published |
|---|
| A7 | 164.85 | 162.75 | 369.49 | 365.80 |
| A4 | 142.63 | 140.76 | 313.86 | 310.30 |
| A2 | 91.99 | 92.94 | 216.03 | 217.87 |
| A6 | 106.75 | 106.90 | 280.22 | 265.63 |
| A8 | 160.52 | 162.75 | 2798.07 | 2797.36 |
| A1 | 51.85 | 51.85 | 2594.55 | 2595.19 |
| A9 | 96.85 | 96.85 | 405.88 | 404.90 |
4.3. Verification of Ammonia-Water AHP Model
Finally, the ammonia-water AHP model is validated by using the reported results in Wang and Ferreira’s work [
50]. The same assumptions and conditions are adopted in the simulation platform: (1) The temperatures of generator, condenser, absorber and evaporator are set to be 120 °C, 45 °C, 45 °C, and 10 °C; (2) The minimum temperature approach of SHE is set to be 5 K; (3) The solution leaving the absorber is assumed to have a subcooling of 3 K. Then, the comparison is shown in
Table 8, which indicates a high agreement between two groups of results.
Table 8 shows the comparison between the simulated results and the published data for ammonia-water based AHP.
Table 8.
Comparison between the simulated results and the published data for ammonia-water based AHP.
Table 8.
Comparison between the simulated results and the published data for ammonia-water based AHP.
| Parameters | Present Results | Published Results |
|---|
| yA2 | 0.481 | 0.481 |
| yA7 | 0.335 | 0.335 |
| qA4 | 0.023 | 0.024 |
| circulation ratio | 4.554 | 4.555 |
| COHP | 1.615 | 1.612 |
5. Results and Discussions
In this section, the energy, exergy, and economic performances of the proposed sCO
2/LiBr-H
2O AHP system are analyzed. Performance comparisons are conducted between the sCO
2/LiBr-H
2O AHP system with a single sCO
2 system, a sCO
2/DH system, and a sCO
2/ammonia-water AHP system. Parametric studies are carried out to find out the influences of some key parameters on the system performance indicators, including
COPP,
COHP, η
ex, and
ctotal, as defined in
Section 3.3. Then, the particle swarm optimization (PSO) algorithm is adopted to obtain the system optimal operation conditions.
The main input parameters and assumptions are listed in
Table 9. By using these input conditions, the parameters of system state points are calculated and summarized in
Table 10,
Table 11 and
Table 12 for the sCO
2/LiBr-H
2O AHP system, sCO
2/ammonia-water AHP system and sCO
2/DH system, respectively.
The following
Table 9 shows the main input conditions for the simulation.
Table 9.
The main input conditions for the simulation.
Table 9.
The main input conditions for the simulation.
| Items | Values |
|---|
| T0 (°C) | 25 |
| P0 (MPa) | 0.101325 |
| Qcore (MW) | 600 a |
| Tcore (°C) | 800 a |
| T1 (°C) | 35 a |
| P1 (MPa) | 7.4 a |
| ηmcom & ηrcom | 0.85 b |
| ηtur | 0.86 c |
| ηpump | 0.75 d |
| εHTR & εLTR | 0.86 b |
| ΔTDHE,end (°C) | 5 d |
| ΔTSHE,end (°C) | 5 d |
| TH6 (°C) | 60 e |
| TH1 (°C) | 45 e |
| Puser (MPa) | 1.0 e |
| Fuel cost ($/MWh) | 7.4 a |
Table 10 shows the thermodynamic properties and costs of exergy streams for the sCO
2/LiBr-H
2O AHP system.
Table 10.
Thermodynamic properties and costs of exergy streams for the sCO2/LiBr-H2O AHP system.
Table 10.
Thermodynamic properties and costs of exergy streams for the sCO2/LiBr-H2O AHP system.
| State Points | T | P | h | s | m | eph | ech | | c |
|---|
| (°C) | (MPa) | (kJ/kg) | (kJ/(kg·K)) | (kg/s) | (kJ/kg) | (kJ/kg) | ($/h) | ($/GJ) |
|---|
| 1 | 35.00 | 7.40 | 402.40 | 1.663 | 2309.66 | 216.60 | / | 26,077.65 | 14.480 |
| 2 | 110.06 | 20.72 | 444.87 | 1.680 | 2309.66 | 254.09 | / | 33,328.11 | 15.775 |
| 3 | 245.43 | 20.72 | 656.60 | 2.159 | 3099.68 | 322.95 | / | 57,628.04 | 15.991 |
| 4 | 393.02 | 20.72 | 841.06 | 2.473 | 3099.68 | 413.97 | / | 73,239.23 | 15.855 |
| 5 | 550.00 | 20.72 | 1034.63 | 2.734 | 3099.68 | 529.77 | / | 84,301.17 | 14.260 |
| 6 | 433.11 | 7.40 | 906.74 | 2.763 | 3099.68 | 392.97 | / | 62,533.52 | 14.260 |
| 7 | 271.71 | 7.40 | 722.28 | 2.467 | 3099.68 | 296.85 | / | 47,237.39 | 14.260 |
| 8 | 132.69 | 7.40 | 564.63 | 2.133 | 3099.68 | 238.91 | / | 38,017.79 | 14.260 |
| 9 | 106.60 | 7.40 | 532.82 | 2.052 | 2309.66 | 231.26 | / | 27,421.47 | 14.260 |
| 10 | 50.00 | 7.40 | 447.38 | 1.806 | 2309.66 | 218.94 | / | 25,959.82 | 14.260 |
| 11 | 25.00 | 0.1013 | 104.92 | 0.367 | 2485.38 | 0.00 | / | 0.00 | 0.000 |
| 12 | 35.00 | 0.1013 | 146.72 | 0.505 | 2485.38 | 0.69 | / | 0.00 | 0.000 |
| 13 | 35.00 | 0.1013 | 146.72 | 0.505 | 2287.10 | 0.69 | / | 0.00 | 0.000 |
| 14 | 29.00 | 0.1013 | 121.64 | 0.423 | 2287.10 | 0.11 | / | 0.00 | 0.000 |
| A1 | 26.00 | 0.0034 | 2548.32 | 8.535 | 24.74 | 8.06 | 478.83 | 477.82 | 11.017 |
| A2 | 55.00 | 0.0034 | 119.31 | 0.353 | 157.07 | 2.92 | 490.90 | 3252.42 | 11.648 |
| A3 | 55.00 | 0.0158 | 119.31 | 0.353 | 157.07 | 2.92 | 490.90 | 3252.71 | 11.649 |
| A4 | 91.60 | 0.0158 | 197.37 | 0.578 | 157.07 | 13.76 | 509.19 | 3462.53 | 11.710 |
| A5 | 60.00 | 0.0034 | 190.79 | 0.387 | 132.32 | 3.41 | 628.81 | 3535.42 | 11.739 |
| A6 | 60.00 | 0.0158 | 190.79 | 0.386 | 132.32 | 3.42 | 628.81 | 3535.42 | 11.739 |
| A7 | 110.00 | 0.0158 | 283.45 | 0.646 | 132.32 | 18.84 | 649.17 | 3735.49 | 11.739 |
| A8 | 110.00 | 0.0158 | 2705.90 | 8.288 | 24.74 | 239.39 | 478.83 | 653.86 | 10.221 |
| A9 | 55.00 | 0.0158 | 230.26 | 0.768 | 24.74 | 5.83 | 478.83 | 441.23 | 10.221 |
| A10 | 26.00 | 0.0034 | 230.26 | 0.787 | 24.74 | 0.31 | 478.83 | 441.23 | 10.338 |
| H1 | 45.00 | 1.00 | 189.30 | 0.638 | 3329.79 | 3.58 | / | 0.00 | 0.000 |
| H2 | 50.00 | 1.00 | 210.19 | 0.703 | 3329.79 | 5.05 | / | 803.80 | 13.280 |
| H3 | 54.40 | 1.00 | 228.59 | 0.760 | 3329.79 | 6.59 | / | 1030.05 | 13.045 |
| H4 | 45.00 | 1.00 | 189.30 | 0.638 | 1903.60 | 3.58 | / | 0.00 | 0.000 |
| H5 | 69.79 | 1.00 | 292.97 | 0.952 | 1903.60 | 13.70 | / | 1726.18 | 18.385 |
| H6 | 60.00 | 1.00 | 252.00 | 0.831 | 5233.39 | 8.87 | / | 2756.23 | 16.495 |
Table 11 shows the thermodynamic properties and costs of exergy streams for the sCO
2/ammonia-water AHP system.
Table 11.
Thermodynamic properties and costs of exergy streams for the sCO2/ammonia-water AHP system.
Table 11.
Thermodynamic properties and costs of exergy streams for the sCO2/ammonia-water AHP system.
| State Points | T | P | h | s | m | eph | ech | | c |
|---|
| (°C) | (MPa) | (kJ/kg) | (kJ/(kg·K)) | (kg/s) | (kJ/kg) | (kJ/kg) | ($/h) | ($/GJ) |
|---|
| 1 | 35.00 | 7.40 | 402.40 | 1.663 | 2309.66 | 216.60 | / | 26,077.65 | 14.480 |
| 2 | 110.06 | 20.72 | 444.87 | 1.680 | 2309.66 | 254.09 | / | 33,328.11 | 15.775 |
| 3 | 245.43 | 20.72 | 656.60 | 2.159 | 3099.68 | 322.95 | / | 57,628.04 | 15.991 |
| 4 | 393.02 | 20.72 | 841.06 | 2.473 | 3099.68 | 413.97 | / | 73,239.23 | 15.855 |
| 5 | 550.00 | 20.72 | 1034.63 | 2.734 | 3099.68 | 529.77 | / | 84,301.17 | 14.260 |
| 6 | 433.11 | 7.40 | 906.74 | 2.763 | 3099.68 | 392.97 | / | 62,533.52 | 14.260 |
| 7 | 271.71 | 7.40 | 722.28 | 2.467 | 3099.68 | 296.85 | / | 47,237.39 | 14.260 |
| 8 | 132.69 | 7.40 | 564.63 | 2.133 | 3099.68 | 238.91 | / | 38,017.79 | 14.260 |
| 9 | 108.26 | 7.40 | 534.91 | 2.057 | 2309.66 | 231.72 | / | 27,475.03 | 14.260 |
| 10 | 50.00 | 7.40 | 447.38 | 1.806 | 2309.66 | 218.94 | / | 25,959.82 | 14.260 |
| 11 | 25.00 | 0.1013 | 104.92 | 0.367 | 2485.38 | 0.00 | / | 0.00 | 0.000 |
| 12 | 35.00 | 0.1013 | 146.72 | 0.505 | 2485.38 | 0.69 | / | 0.00 | 0.000 |
| 13 | 35.00 | 0.1013 | 146.72 | 0.505 | 1801.09 | 0.69 | / | 0.00 | 0.000 |
| 14 | 29.00 | 0.1013 | 121.64 | 0.423 | 1801.09 | 0.11 | / | 0.00 | 0.000 |
| A1 | 26.00 | 1.0345 | 1627.18 | 5.779 | 44.37 | 323.24 | 19,805.29 | 71,903.43 | 22.363 |
| A2 | 55.00 | 1.0345 | 190.82 | 1.400 | 255.36 | 46.26 | 10,889.39 | 225,020.13 | 22.383 |
| A3 | 55.27 | 2.3111 | 193.01 | 1.402 | 255.36 | 47.95 | 10,889.39 | 225,116.94 | 22.390 |
| A4 | 93.26 | 2.3111 | 390.83 | 1.970 | 255.36 | 76.45 | 10,889.39 | 225,820.58 | 22.401 |
| A5 | 60.47 | 1.0345 | 178.12 | 1.331 | 210.99 | 22.81 | 9014.33 | 153,708.18 | 22.393 |
| A6 | 60.27 | 2.3111 | 178.12 | 1.327 | 210.99 | 24.21 | 9014.33 | 153,708.18 | 22.389 |
| A7 | 110.00 | 2.3111 | 417.55 | 1.996 | 210.99 | 64.20 | 9014.33 | 154,388.21 | 22.389 |
| A8 | 110.00 | 2.3111 | 1810.74 | 5.970 | 44.37 | 449.85 | 19,805.29 | 72,304.83 | 22.347 |
| A9 | 55.00 | 2.3111 | 609.26 | 2.347 | 44.37 | 328.52 | 19,805.29 | 71,871.72 | 22.347 |
| A10 | 26.00 | 1.0345 | 609.26 | 2.376 | 44.37 | 319.83 | 19,805.29 | 71,871.72 | 22.357 |
| H1 | 45.00 | 1.00 | 189.30 | 0.638 | 3144.32 | 3.58 | / | 0.00 | 0.000 |
| H2 | 49.65 | 1.00 | 208.72 | 0.699 | 3144.32 | 4.94 | / | 615.28 | 11.012 |
| H3 | 53.70 | 1.00 | 225.67 | 0.751 | 3144.32 | 6.33 | / | 1060.68 | 14.807 |
| H4 | 45.00 | 1.00 | 189.30 | 0.638 | 1903.60 | 3.58 | / | 0.00 | 0.000 |
| H5 | 70.39 | 1.00 | 295.50 | 0.959 | 1903.60 | 14.03 | / | 1778.22 | 18.491 |
| H6 | 60.00 | 1.00 | 252.00 | 0.831 | 5047.92 | 8.87 | / | 2838.90 | 17.614 |
Table 12 shows the thermodynamic properties and costs of exergy streams for the sCO
2/DH system.
Table 12.
Thermodynamic properties and costs of exergy streams for the sCO2/DH system.
Table 12.
Thermodynamic properties and costs of exergy streams for the sCO2/DH system.
| State Points | T | P | h | s | eph | m | | c |
|---|
| (°C) | (MPa) | (kJ/kg) | (kJ/(kg·K)) | (kJ/kg) | (kg/s) | ($/h) | ($/GJ) |
|---|
| 1 | 35.00 | 7.40 | 402.40 | 1.663 | 216.60 | 2309.66 | 26,014.53 | 14.445 |
| 2 | 110.06 | 20.72 | 444.87 | 1.680 | 254.09 | 2309.66 | 33,257.10 | 15.741 |
| 3 | 245.43 | 20.72 | 656.60 | 2.159 | 322.95 | 3099.68 | 57,527.04 | 15.963 |
| 4 | 393.02 | 20.72 | 841.06 | 2.473 | 413.97 | 3099.68 | 73,115.84 | 15.828 |
| 5 | 550.00 | 20.72 | 1034.63 | 2.734 | 529.77 | 3099.68 | 84,177.77 | 14.240 |
| 6 | 433.11 | 7.40 | 906.74 | 2.763 | 392.97 | 3099.68 | 62,441.98 | 14.240 |
| 7 | 271.71 | 7.40 | 722.28 | 2.467 | 296.85 | 3099.68 | 47,168.25 | 14.240 |
| 8 | 132.69 | 7.40 | 564.52 | 2.132 | 238.88 | 3099.68 | 37,957.41 | 14.240 |
| 10 | 50.00 | 7.40 | 447.38 | 1.806 | 218.94 | 2309.66 | 25,921.82 | 14.240 |
| 11 | 25.00 | 0.1013 | 104.92 | 0.367 | 0.00 | 8957.55 | 0.00 | 0.000 |
| 12 | 35.00 | 0.1013 | 146.72 | 0.505 | 0.00 | 8957.55 | 0.00 | 0.000 |
| H4 | 45.00 | 1.0 | 189.30 | 0.638 | 3.58 | 4314.5 | 1775.3 | 31.890 |
| H6 | 60.00 | 1.0 | 252.00 | 0.831 | 8.87 | 4314.5 | 4393.2 | 31.890 |
5.1. Parametric Analysis
The influences of several key parameters on the thermodynamic and exergoeconomic performances of the overall system are revealed through parametric analysis. The parameters studied include the turbine inlet temperature (T5), the compressor pressure ratio (PRc), the generator outlet temperature (TA8), and the evaporator outlet temperature (TA1). As the turbine outlet pressure is set as 7.4 MPa to keep the sCO2 topping cycle operating in the supercritical state, the PRc also represents the turbine inlet pressure. Both turbine inlet temperature and pressure are the vital parameters of sCO2 topping cycle that can influence the electric power generation significantly, while other two parameters are important to the AHP bottoming cycle that can greatly affect the heat production. The parametric analysis is carried out by changing only one parameter at a time with all other parameters fixed.
5.1.1. Effects of the Compressor Pressure Ratio (PRc)
Figure 2 depicts the influences of PRc on the system performance indicators, namely COPP, COHP, exergy efficiency η
ex and total product unit cost c
total, for a single sCO
2 system, sCO
2/DH system, sCO
2/ammonia-water AHP system, and sCO
2/LiBr-H
2O AHP system, respectively. Obviously in
Figure 2a, the thermodynamic and exergoeconomic performances for these four systems can be ranked according to η
ex and c
total as: sCO
2/LiBr-H
2O AHP > sCO
2/ammonia-water AHP > sCO
2/DH > sCO
2 (A > B means A is better than B). Thus, the combined cycles show better performances than the single sCO
2. This indicates that the performance of recompression sCO
2 cycle can be enhanced by assembling a waste heat recovery system based on the energy cascade utilization principle. Besides, by comparing three combined cycles, it can be concluded that AHP is a better choice than DH, and that the LiBr-H
2O solution is a better working fluid than the ammonia-water solution for AHP. Thus, the proposed sCO
2/LiBr-H
2O AHP system is a desirable waste heat recovery system for the sCO
2 cycle, with which the combined cycle could achieve a high exergy efficiency with a low cost.
Figure 2 shows the variation trends of system performance indicators with
PRc for different thermal systems: (a) η
ex and
ctotal; (b)
COPP and
COHP.
Figure 2.
Variation trends of system performance indicators with PRc for different thermal systems: (a) ηex and ctotal; (b) COPP and COHP.
Figure 2.
Variation trends of system performance indicators with PRc for different thermal systems: (a) ηex and ctotal; (b) COPP and COHP.
In
Figure 2a,
ctotal increases with
PRc due to the significant increments of capital investment, operation, and maintenance costs for the turbine, compressors and pressure vessels. Differently, η
ex increases firstly but then decreases with
PRc in the research range, indicating the existence of an optimal
PRc to maximize the exergy efficiency. As η
ex reflects the overall system performance considering both power generation and heat production, the above phenomenon can be analyzed and explained using these two aspects.
Figure 2b depicts the variations of
COPP and
COHP with
PRc.
COPP represents the power generation capacity while
COHP reflects the heat production capacity. Clearly,
COHP increases with
PRc, but
COPP increases firstly and then decreases.
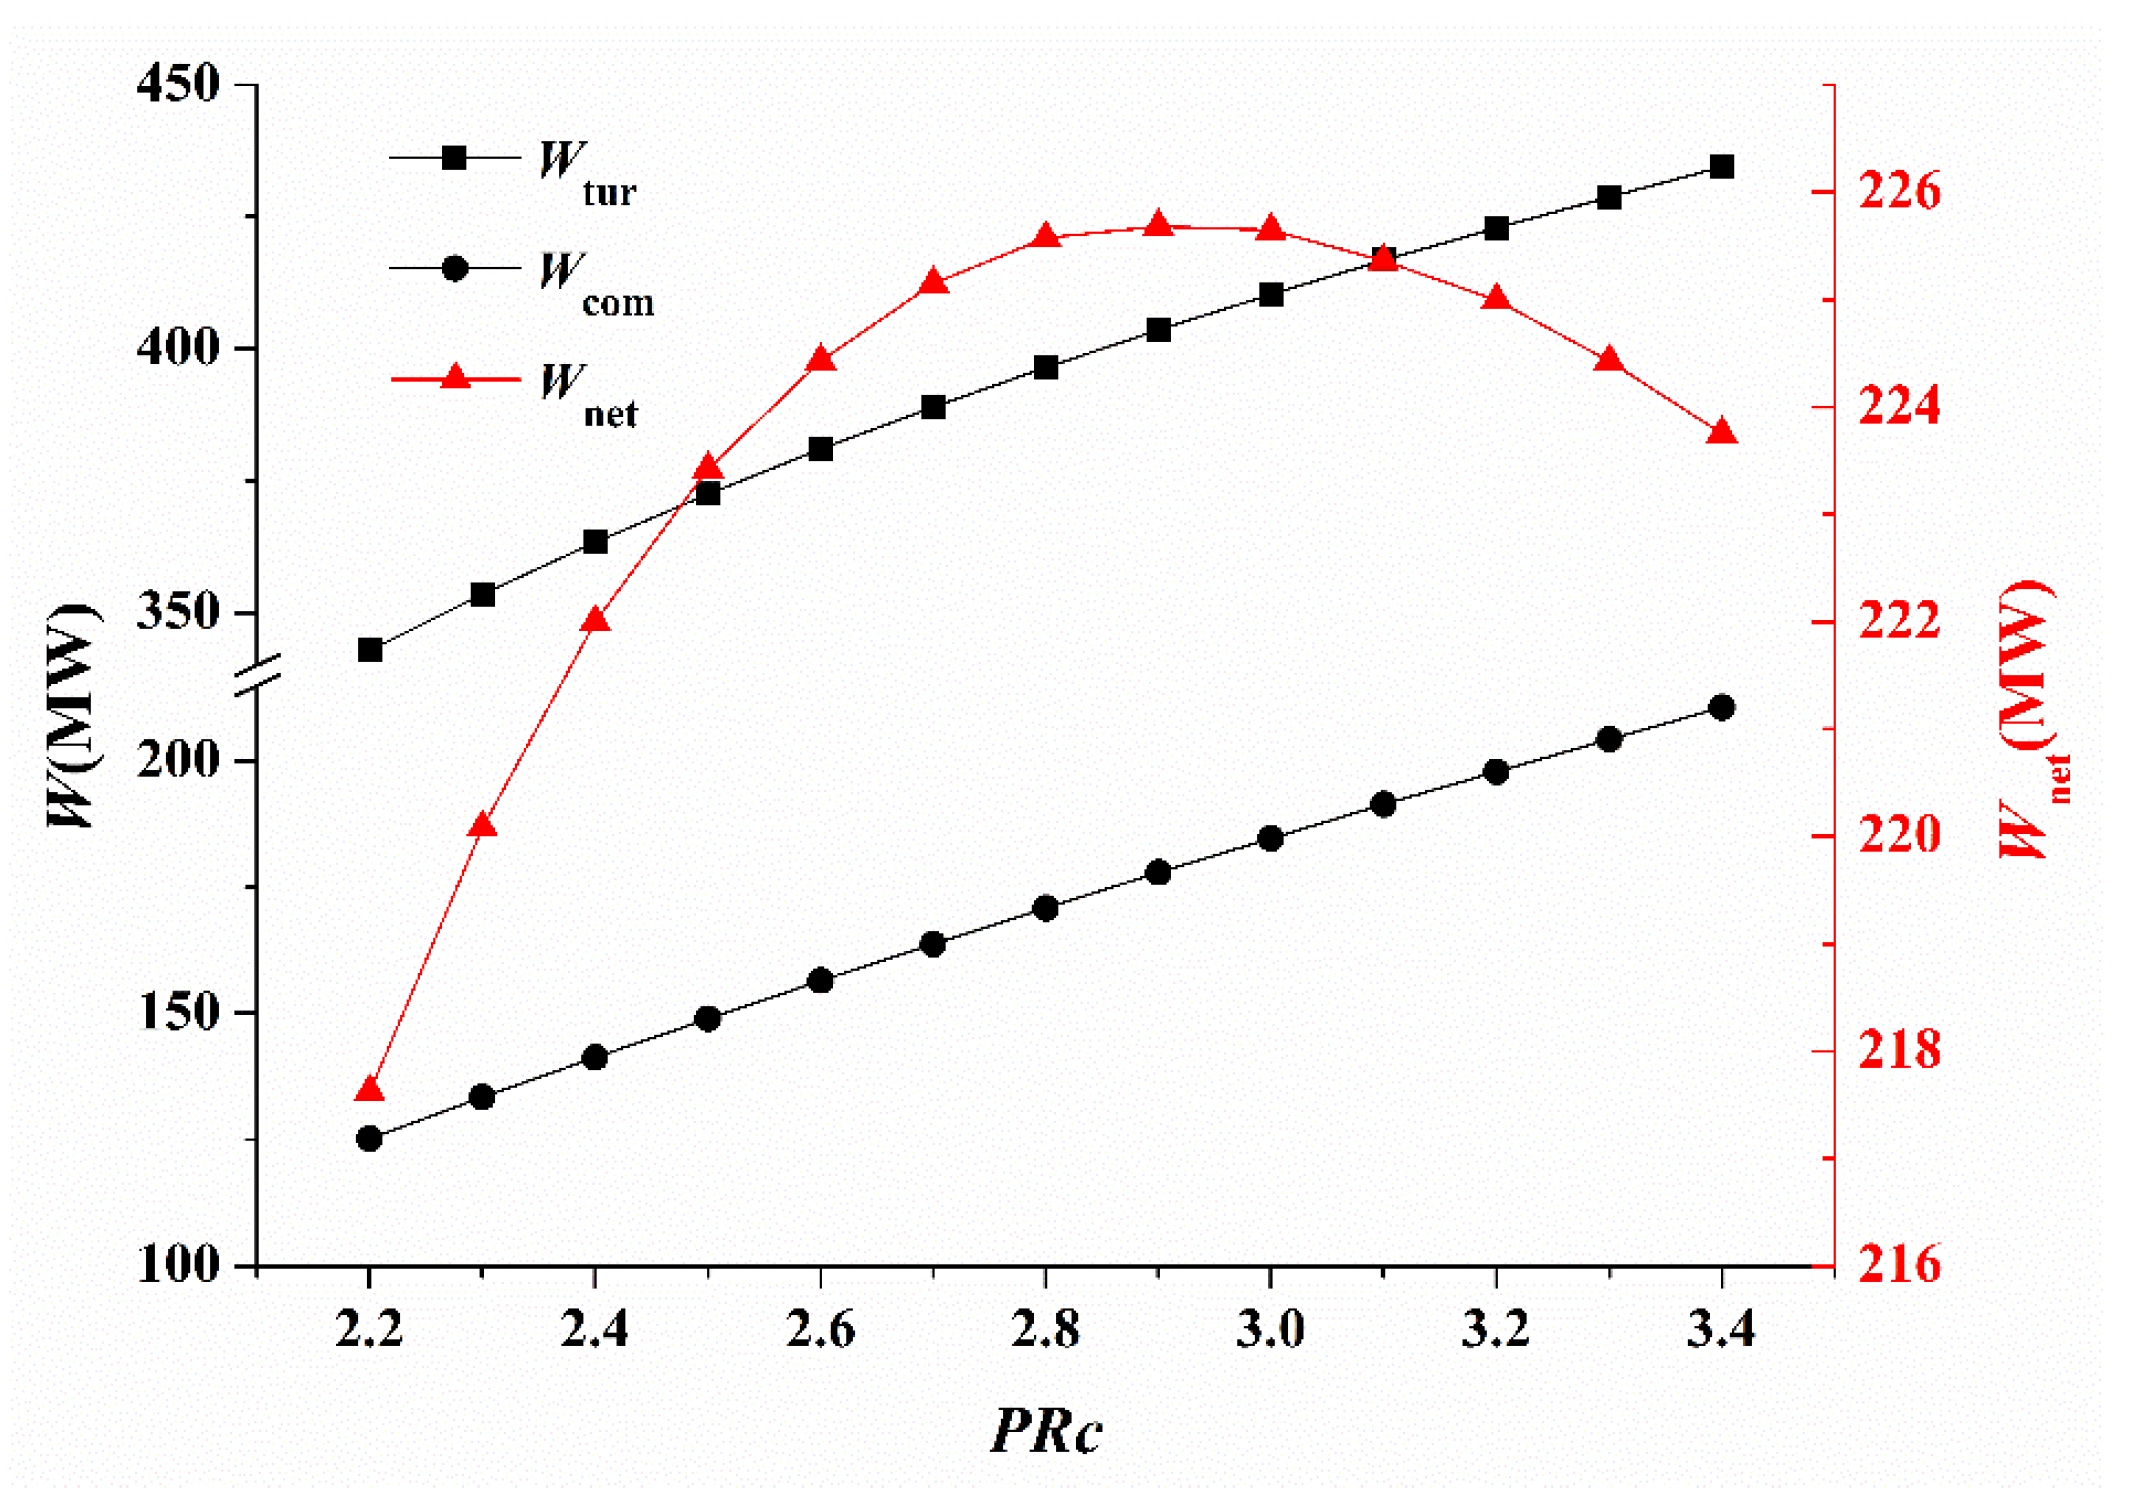
Figure 3 presents the turbine output power
Wtur, compressor power consumption
Wcom and net output power
Wnet varying with
PRc for the sCO
2/LiBr-H
2O AHP system. The increase of
PRc (turbine inlet pressure) strengthens the power generation capacity of the unit mass working fluid, and leads to the increase of
Wtur. At the same time, the increase of the turbine inlet pressure requires more power to drive the compressors and leads to the increase of
Wcom. So, with the increase of
PRc,
Wnet increases firstly when the increment of
Wtur is larger than that of
Wcom, and then decreases for the opposite situation. It explains why
COPP and η
ex increase firstly but then decrease with
PRc in
Figure 2a,b.
Figure 3 shows the variation trends of
Wtur,
Wcom, and
Wnet with
PRc for the sCO
2/LiBr-H
2O AHP system.
Figure 3.
Variation trends of Wtur, Wcom, and Wnet with PRc for the sCO2/LiBr-H2O AHP system.
Figure 3.
Variation trends of Wtur, Wcom, and Wnet with PRc for the sCO2/LiBr-H2O AHP system.
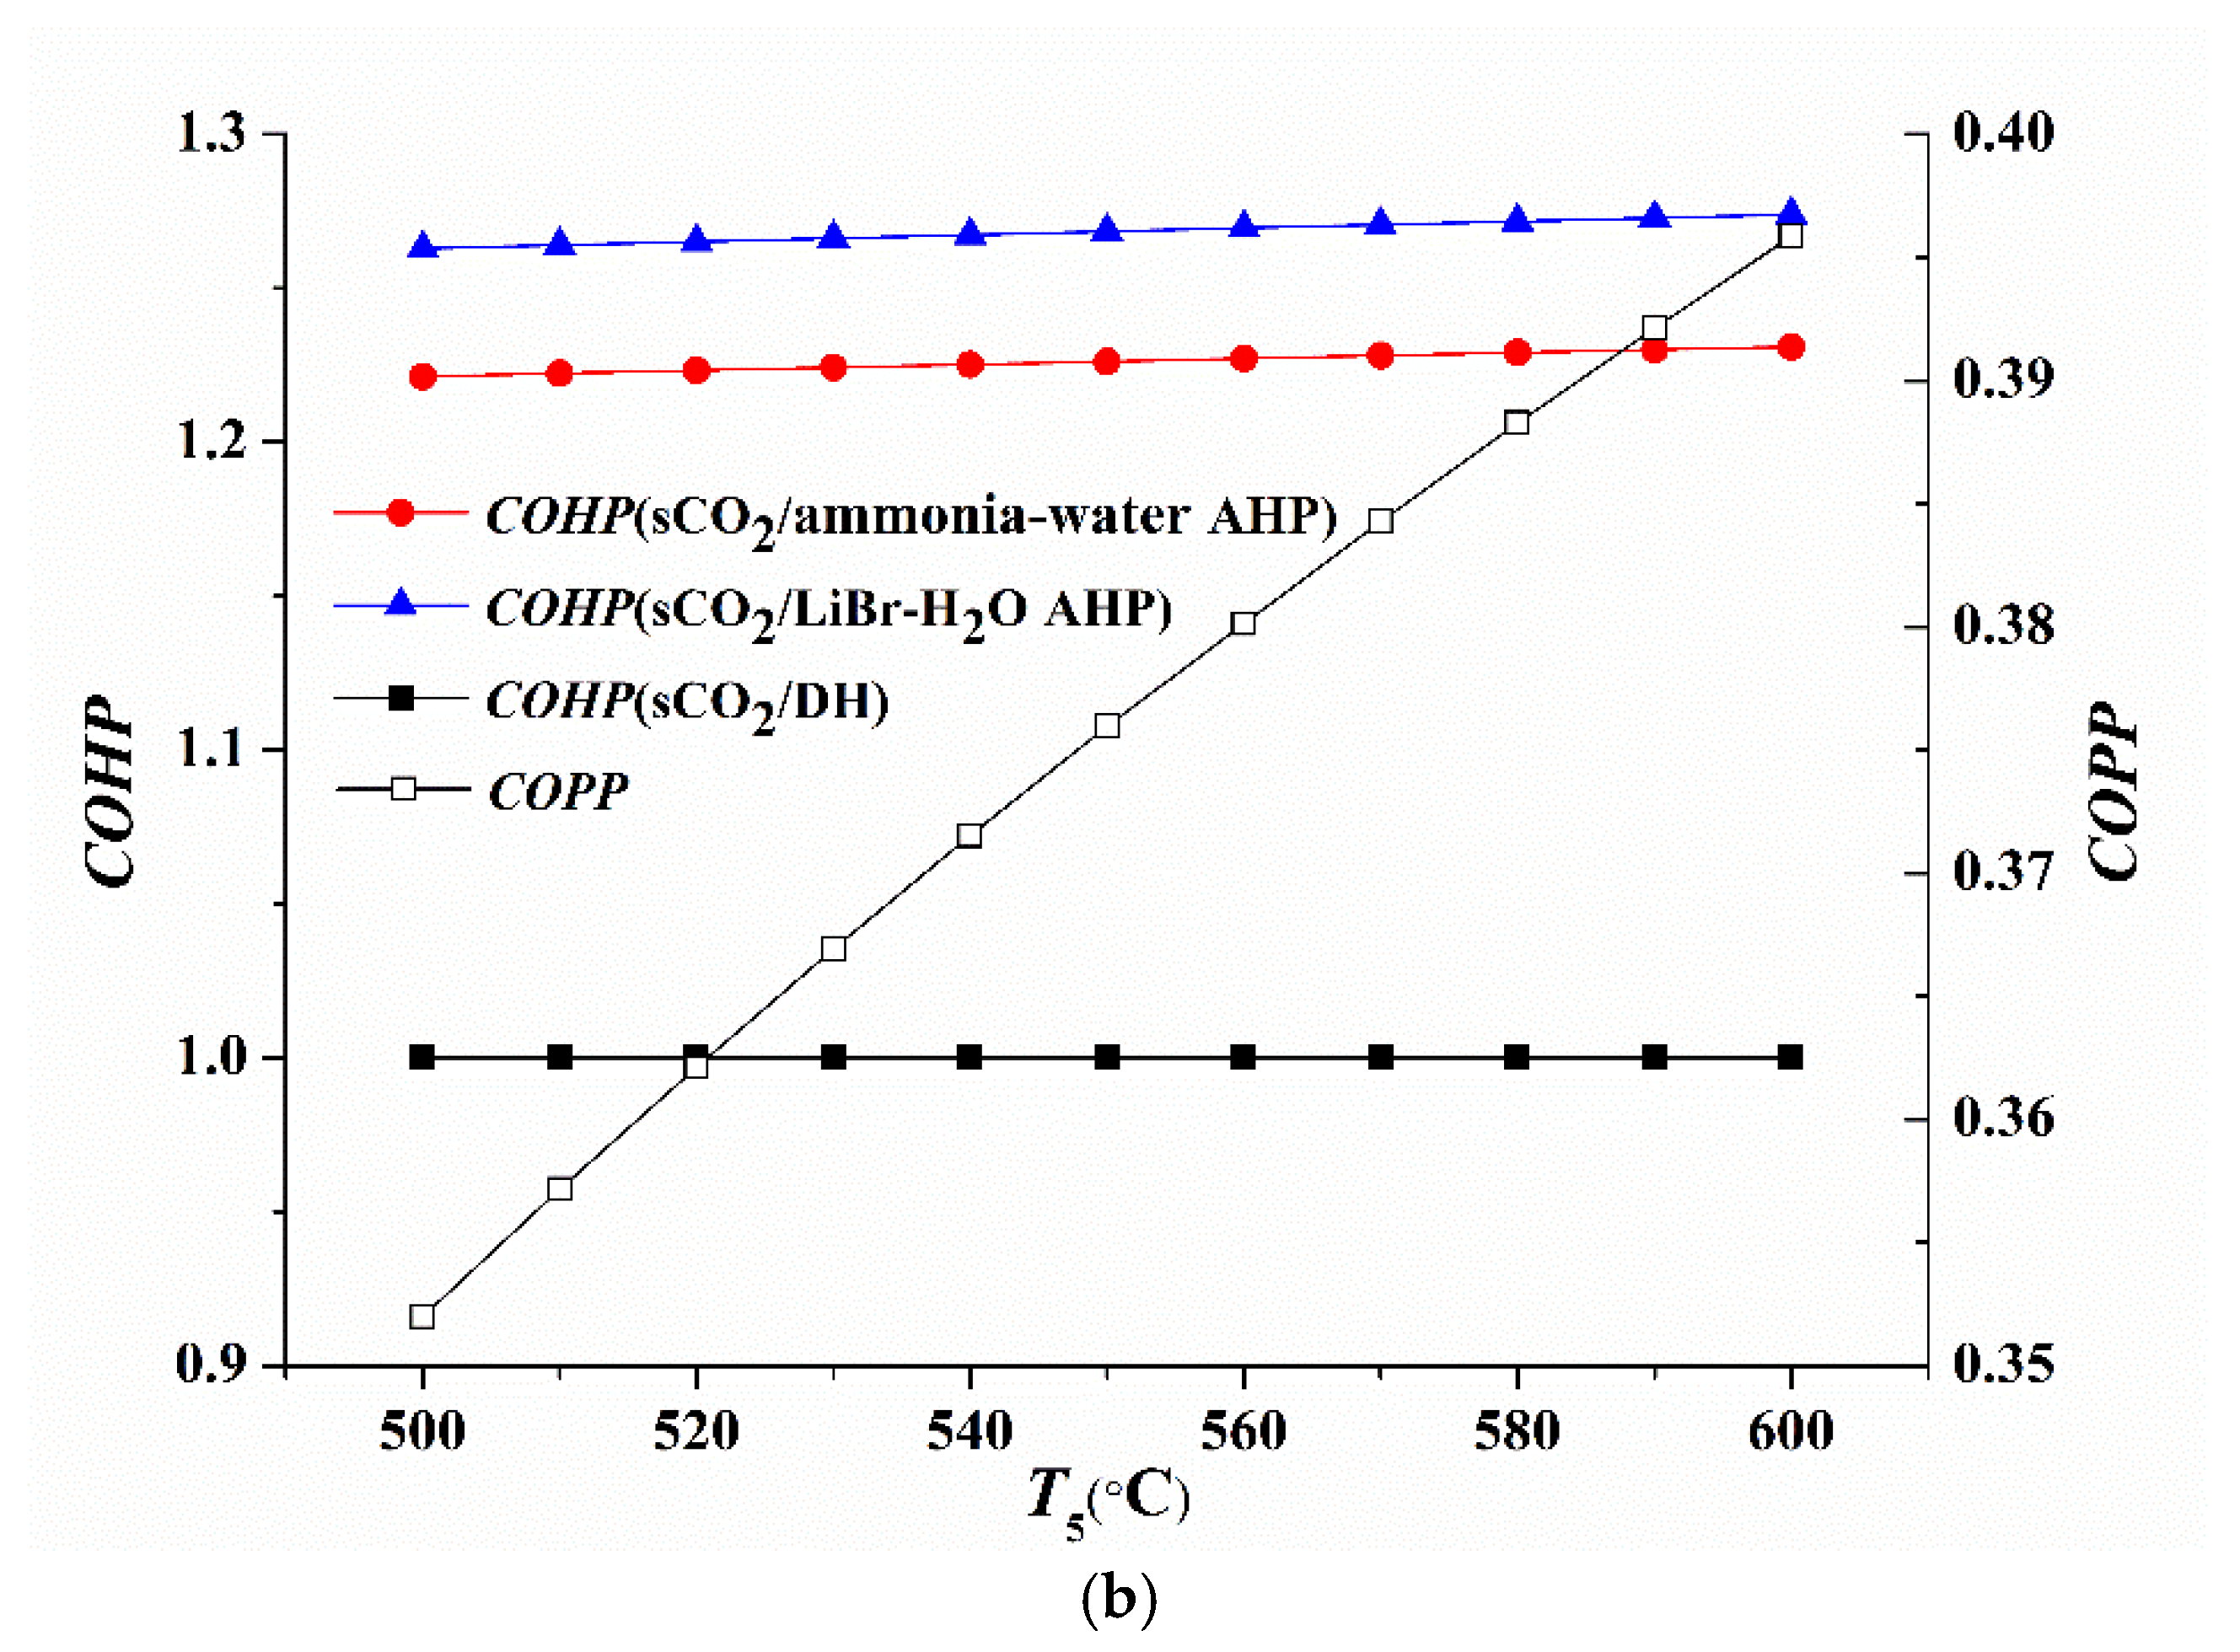
5.1.2. Effects of the Turbine Inlet Temperature (T5)
The effects of
T5 on η
ex,
ctotal,
COPP, and
COHP are displayed in
Figure 4 for four thermal systems. Clearly, η
ex increases with
T5 while
ctotal shows an opposite variation trend. It indicates that increasing
T5 could be beneficial to the improvement of system performances for these thermal systems.
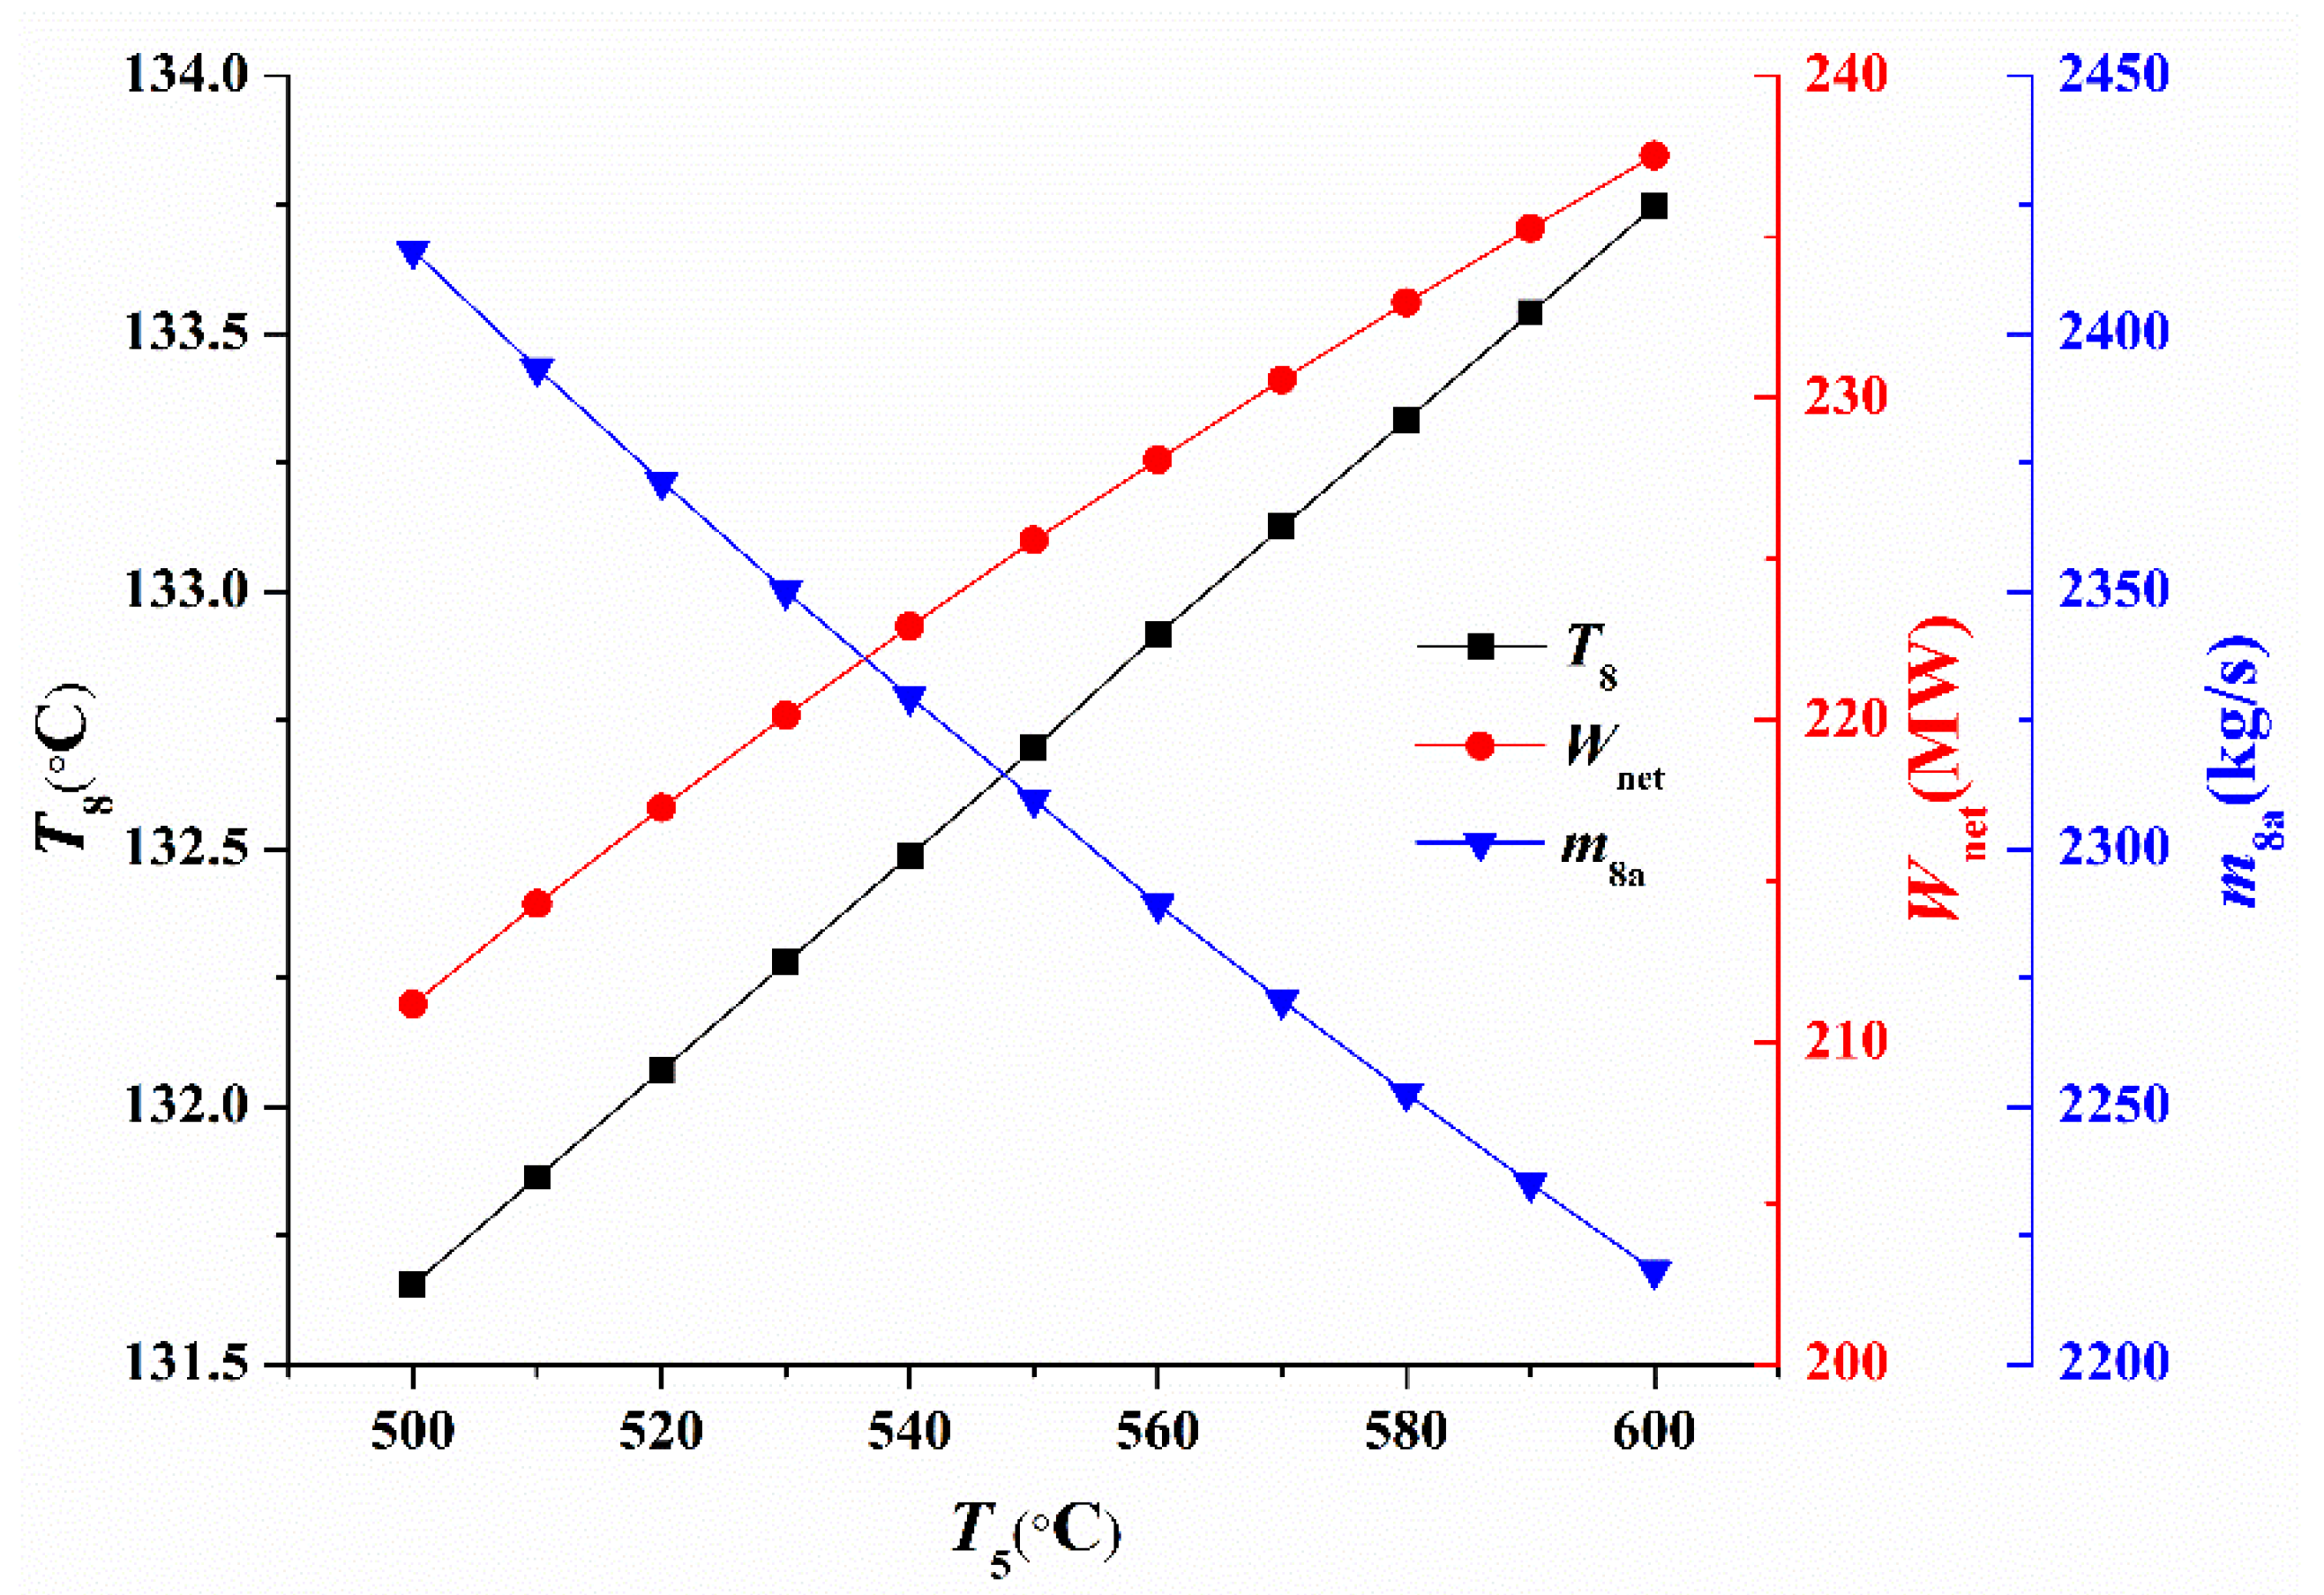
Figure 5 depicts the net output power
Wnet, the temperature of stream 8 (
T8) and the mass flow rate of 8a (
m8a) varying with
T5 for the sCO
2/LiBr-H
2O AHP system. When
T5 ascends, the working capacity of unit mass working fluid is strengthened, and
Wnet increases correspondingly. As a result,
COPP in
Figure 4b also increases with
T5. On the other side, the increase of
T5 enlarges the heat absorption amount of the unit mass flow rate CO
2 from the reactor, so that the mass flow rate of CO
2 decreases. Correspondingly,
m8a decreases with the increase of
T5, as shown in
Figure 5. It means that the mass flow rate of CO
2 flowing into AHP and DHE decreases, which in turn decreases the heat absorption amount of AHP and DHE from the topping cycle. At the same time,
T8 increases with
T5, so that the generator temperature ascends and the heat absorption amount of AHP and DHE from the topping cycle will increase. The opposite effects between
T8 and
m8a makes the
COHP of sCO
2/AHP systems change slightly, as shown in
Figure 4b. Thus, the increase of η
ex with
T5 is dominated by the increase of
COPP, i.e., the power generation capacity of sCO
2 topping cycle, while the increase of
T5 exerts slight influences on the performances of the bottoming cycle. As the increase of
T5 results in the decrement of mass flow rate of working fluid, the capital investment costs for the turbine, compressors, and pressure vessels decrease correspondingly and lead to the decline of
ctotal, as shown in
Figure 4a.
The following
Figure 4 shows the variation trends of system performance indicators with
T5 for different thermal systems: (a) η
ex and
ctotal; (b)
COPP and
COHP.
Figure 4.
Variation trends of system performance indicators with T5 for different thermal systems: (a) ηex and ctotal; (b) COPP and COHP.
Figure 4.
Variation trends of system performance indicators with T5 for different thermal systems: (a) ηex and ctotal; (b) COPP and COHP.
The following
Figure 5 shows the variation trends of
T8,
m8a, and
Wnet with
T5 for the sCO
2/LiBr-H
2O AHP system.
Figure 5.
Variation trends of T8, m8a, and Wnet with T5 for the sCO2/LiBr-H2O AHP system.
Figure 5.
Variation trends of T8, m8a, and Wnet with T5 for the sCO2/LiBr-H2O AHP system.
5.1.3. Effects of the Generator Outlet Temperature (TA8)
Then, the influences of key parameters of AHP bottoming cycle on the overall system performances are investigated. As the single sCO
2 cycle and the sCO
2/DH system have no AHP bottoming cycle, only the sCO
2/ammonia-water AHP system and the sCO
2/LiBr-H
2O AHP system are analyzed here.
Figure 6 shows the variation of η
ex and
ctotal with the generator outlet temperature
TA8 for these two combined systems. As
TA8 increases, η
ex increases to a peak and next goes down slightly, while
ctotal shows an opposite trend in
Figure 6a, which indicates that there exists a
TA8 to optimize the overall system performances for the sCO
2/ammonia-water AHP system. The
COHP also ascends firstly and then descends with
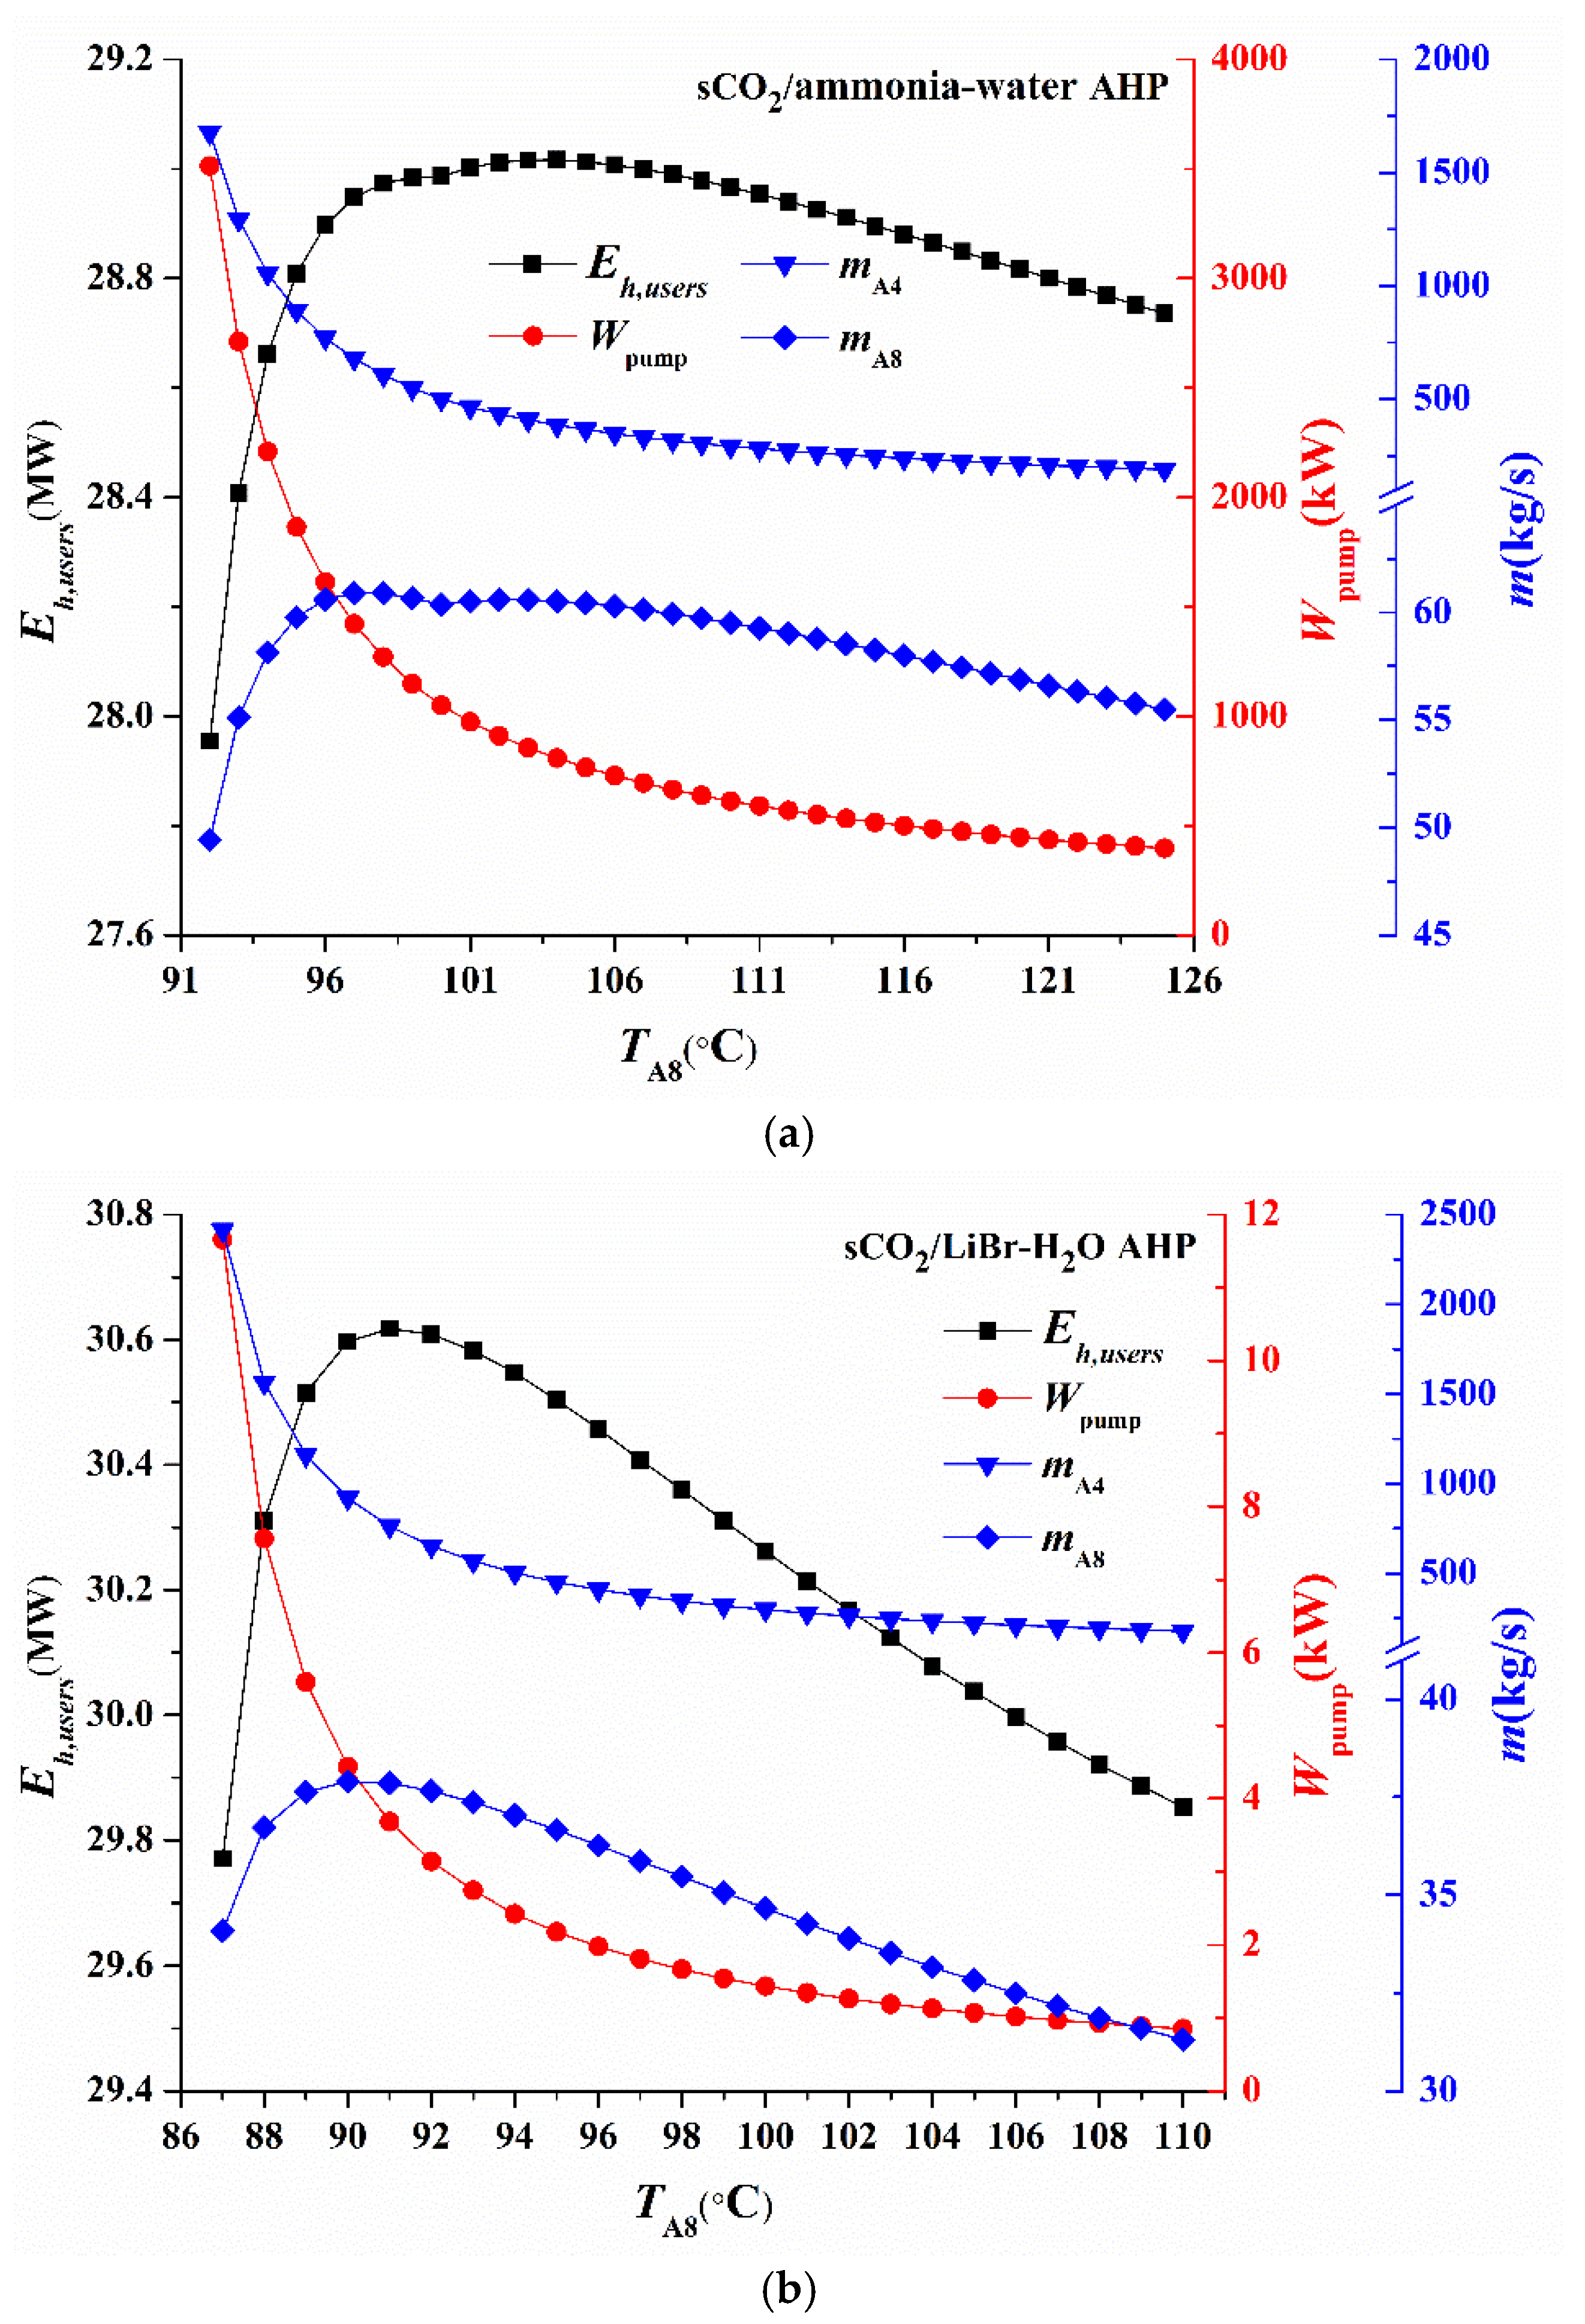
TA8. In order to explain this phenomenon,
Figure 7a presents the mass flow rate of stream A8 (
mA8), the total mass flow rate of ammonia water (
mA4), the pump power consumption (
Wpump), and the exergy that heat users obtain (
Eh,users) varying with
TA8. Clearly, as
TA8 increases, the heat absorption amount per unit mass flow rate from the topping cycle increases, so that the total mass flow rate
mA4 descends and then leads to the decline of
Wpump.
mA8 increases firstly with
TA8 as more working fluid is evaporated from the generator solution. More ammonia vapor flows into the condenser and releases the considerable latent heat to the heating water, so that
Eh,users increases correspondingly. Then, as the effect of decreasing
mA4 dominates when
TA8 is larger, both
mA8 and
Eh,users decrease with
TA8. Therefore,
COHP and η
ex increase and then decrease with
TA8 according to Equations (41) and (42).
Figure 6 shows the variation trends of η
ex,
ctotal, and
COHP with
TA8: (a) a sCO
2/ammonia-water AHP system; (b) a sCO
2/LiBr-H
2O AHP system.
Figure 6.
Variation trends of ηex, ctotal and COHP with TA8: (a) sCO2/ammonia-water AHP system; (b) sCO2/LiBr-H2O AHP system.
Figure 6.
Variation trends of ηex, ctotal and COHP with TA8: (a) sCO2/ammonia-water AHP system; (b) sCO2/LiBr-H2O AHP system.
The following
Figure 7 shows the variation trends of
mA8,
mA4,
Wpump, and
Eh,users with
TA8: (a) a sCO
2/ammonia-water AHP system; (b) a sCO
2/LiBr-H
2O AHP system.
Figure 7.
Variation trends of mA8, mA4, Wpump, and Eh,users with TA8: (a) a sCO2/ammonia-water AHP system; (b) a sCO2/LiBr-H2O AHP system.
Figure 7.
Variation trends of mA8, mA4, Wpump, and Eh,users with TA8: (a) a sCO2/ammonia-water AHP system; (b) a sCO2/LiBr-H2O AHP system.
For the sCO
2/LiBr-H
2O AHP system, the same trends can be observed for the
COHP,
mA4,
mA8,
Wpump, and
Eh,users in
Figure 6b and
Figure 7b, which will not be explained again here. It should be noted that the operational pressure of LiBr-H
2O AHP is much lower than that of ammonia-water AHP, so the pump power consumption
Wpump in LiBr-H
2O AHP is also lower than that in ammonia-water AHP, as shown in
Figure 7.
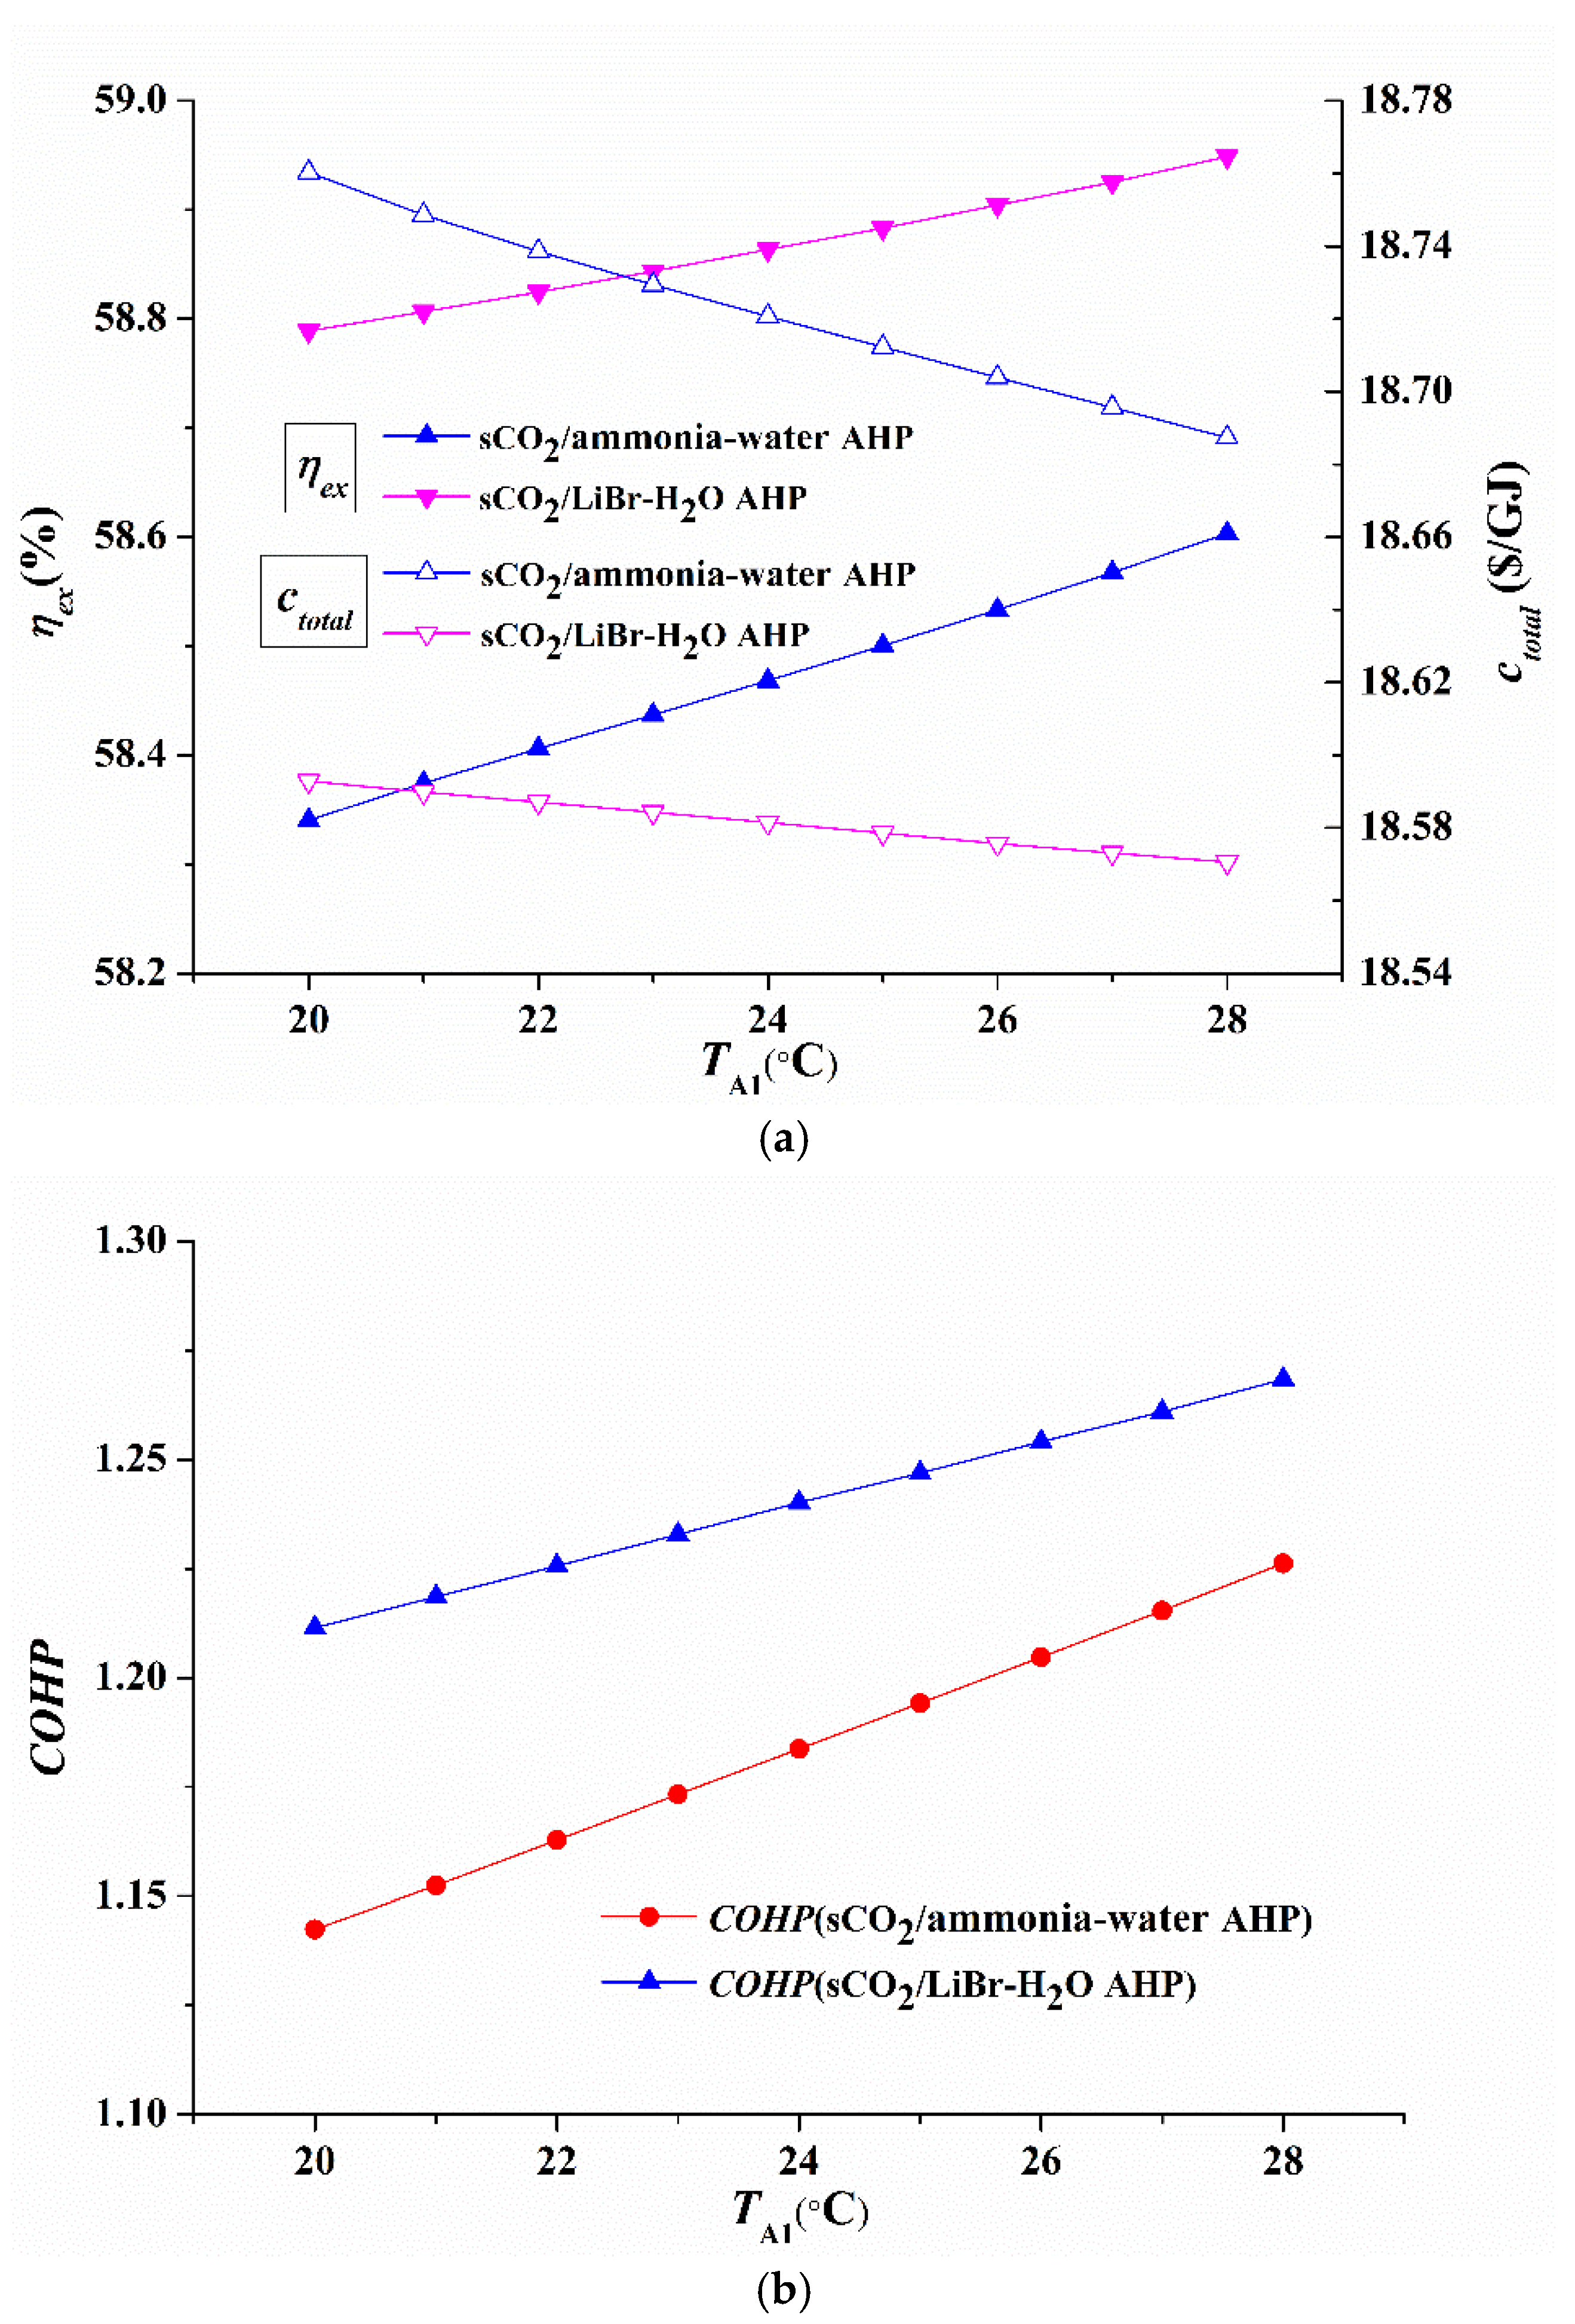
5.1.4. Effects of the Evaporator Temperature (TA1)
Figure 8 describes the variations of η
ex,
ctotal and
COHP with
TA1. When
TA1 increases, more heat is transferred to the heating water in the absorber. The heat absorption amount of heating water ascends correspondingly, and results in the increase of
COHP. As the pump work is very limited compared to the turbine output power, the variation of pump power consumption with
TA1 has ignorable effects on the net output power. Thus, the power generation capacity is hardly affected by the change of
TA1. This means that the overall system performances are mainly affected by the variation of heat production capacity when
TA1 changes. Therefore, the exergy efficiency η
ex has the same variation trend of
COHP and the total product unit cost
ctotal decreases with
TA1, indicating that the thermodynamic and economic performances of the sCO
2/AHP systems can be improved by increasing the evaporator temperature.
The following
Figure 8 shows the variation trends of system performance indicators with
TA1 for different thermal systems: (a) η
ex and
ctotal; (b)
COHP.
Figure 8.
Variation trends of system performance indicators with TA1 for different thermal systems: (a) ηex and ctotal; (b) COHP.
Figure 8.
Variation trends of system performance indicators with TA1 for different thermal systems: (a) ηex and ctotal; (b) COHP.
5.2. System Performance Optimization and Comparison
Finally, parameter optimizations are carried out in this section to provide references for the practical design and operation. The overall performances of a single sCO
2 system, sCO
2/DH system, sCO
2/ammonia-water AHP system and sCO
2/LiBr-H
2O AHP system are optimized by using the particle swarm optimization (PSO) algorithm, which was proposed by Kennedy and Eberhart [
54]. The PSO algorithm shows higher accuracy and converges faster compared to other optimization algorithms, and has been successfully applied to optimize performances for thermal systems [
55,
56]. A swarm of particles is included in the PSO algorithm to represent the candidate solutions. Each candidate solution has a velocity vector
and a position vector
. In addition, a best global position
and a best personal position
are stored for each particle. For each time step
t, the particles move to a better position in the space so that the velocity vector
and the position vector
update correspondingly, as shown in Equations (46) and (47):
where
ϕ1 and
ϕ2 denote the importance of
and
, respectively.
ϖ is the inertia weight that controls the velocity
.
In this study, the key parameters studied include the compressor pressure ratio
PRc, the turbine inlet temperature
T5, the generator outlet temperature
TA8, and the evaporator temperature
TA1. The constraints of key parameters for the PSO algorithm are displayed in
Table 13. The exergy efficiency η
ex and the total product unit cost
ctotal are chosen as the objective functions. The optimization is achieved by maximizing η
ex or minimizing
ctotal. So two optimal design cases are considered, namely, the exergy efficiency optimal design (EOD) case and the cost optimal design (COD) case. The inertia weight
and the swarm size for the PSO algorithm are chosen as 0.6 and 25, respectively. Both
ϕ1 and
ϕ2 are chosen as 1.8. In addition, a maximal velocity
vmax of 15% is adopted to constrain the velocity at each time step [
57].
The following
Table 13 shows the boundary conditions of decision variables for the PSO algorithm.
Table 13.
Boundary conditions of decision variables for the PSO algorithm.
Table 13.
Boundary conditions of decision variables for the PSO algorithm.
| Items | sCO2 | sCO2/DH | sCO2/Ammonia-Water AHP | sCO2/LiBr-H2O AHP |
|---|
| PRc | 2.2–3.3 | 2.2–3.3 | 2.2–3.3 | 2.2–3.3 |
| T5 (°C) | 500–600 | 500–600 | 500–600 | 500–600 |
| TA8 (°C) | / | / | 92–125 | 87–110 |
| TA1 (°C) | / | / | 23–28 | 23–28 |
Table 14 and
Table 15 show the optimized results of these four thermal systems for the EOD case and the COD case, respectively. Obviously, due to the different optimization targets, the exergy efficiencies η
ex for the EOD case are much higher than those for the COD case, while the total product unit costs
ctotal for the COD case are lower than those for the EOD case. The optimum
PRc for the COD case is smaller than that for the EOD case, meaning that the capital investment, operation, and maintenance costs for the turbine, compressors and pressure vessels are lower, which leads to a lower
ctotal in the COD case. The total product unit costs
ctotal of a sCO
2 system, sCO
2/DH system, sCO
2/ammonia-water AHP system, and sCO
2/LiBr-H
2O AHP system for the COD case are about 4.00%, 4.39%, 4.39%, and 3.87% lower than those for the EOD case. As for the expense, the exergy efficiencies η
ex of sCO
2 system, sCO
2/DH system, sCO
2/ammonia-water AHP system, and sCO
2/LiBr-H
2O AHP system for the COD case dropped by about 3.14%, 3.35%, 4.09%, and 4.13%, respectively. In both the COD case and the EOD case, the sCO
2/LiBr-H
2O AHP system has the highest η
ex with a lowest cost
ctotal, indicating that the overall system performances are greatly improved by combining the LiBr-H
2O AHP with sCO
2 cycle. In the the EOD case, η
ex of sCO
2/LiBr-H
2O AHP system is 13.39%, 3.53% and 1.13% higher than those of the sCO
2 system, sCO
2/DH system, and sCO
2/ammonia-water AHP system, respectively. In the the COD case,
ctotal of sCO
2/LiBr-H
2O AHP system is 8.66%, 1.27%, and 0.42% lower than those of sCO
2 system, sCO
2/DH system and sCO
2/ammonia-water AHP system, respectively. In addition, the
COHP of the sCO
2/LiBr-H
2O AHP system is much larger than those of the sCO
2/DH system and the sCO
2/ammonia-water AHP system. It indicates that the LiBr-H
2O AHP can maximize the recovery of waste heat from sCO
2 cycle to provide heat for users.
Table 14 shows the optimized results for the exergy efficiency optimal design case.
Table 14.
Optimized results for the exergy efficiency optimal design case.
Table 14.
Optimized results for the exergy efficiency optimal design case.
| Items | sCO2 | sCO2/DH | sCO2/Ammonia-Water AHP | sCO2/LiBr-H2O AHP |
|---|
| PRc | 3.1641 | 3.2599 | 3.2960 | 3.2803 |
| T5 (°C) | 600 | 600 | 600 | 599.31 |
| TA8 (°C) | / | / | 115.86 | 90.30 |
| TA1 (°C) | / | / | 28 | 27.92 |
| COPP | 0.3980 | 0.3979 | 0.3978 | 0.3975 |
| COHP | / | 1 | 1.282 | 1.410 |
| ηex (%) | 55.11 | 60.36 | 61.79 | 62.49 |
| ctotal ($/GJ) | 19.603 | 18.210 | 18.054 | 17.881 |
Table 15 shows the optimized results for the cost optimal design case.
Table 15.
Optimized results for the cost optimal design case.
Table 15.
Optimized results for the cost optimal design case.
| Items | sCO2 | sCO2/DH | sCO2/Ammonia-Water AHP | sCO2/LiBr-H2O AHP |
|---|
| PRc | 2.3693 | 2.3692 | 2.3449 | 2.3992 |
| T5 (°C) | 600 | 600 | 600 | 600 |
| TA8 (°C) | / | / | 114.31 | 96.98 |
| TA1 (°C) | / | / | 28 | 28 |
| COPP | 0.3855 | 0.3855 | 0.3845 | 0.3866 |
| COHP | / | 1 | 1.131 | 1.235 |
| ηex (%) | 53.38 | 58.34 | 59.26 | 59.91 |
| ctotal ($/GJ) | 18.819 | 17.410 | 17.262 | 17.189 |


