Abstract
An investigation into the aerodynamic characteristics has been presented for a bio-inspired flapping wing aircraft. Firstly, a mechanism has been developed to transform the usual rotation powered by a motor to a combined flapping and pitching motion of the flapping wing. Secondly, an experimental model of the flapping wing aircraft has been built and tested to measure the motion and aerodynamic forces produced by the flapping wing. Thirdly, aerodynamic analysis is carried out based on the measured motion of the flapping wing model using an unsteady aerodynamic model (UAM) and validated by a computational fluid dynamics (CFD) method. The difference of the average lift force between the UAM and CFD method is 1.3%, and the difference between the UAM and experimental results is 18%. In addition, a parametric study is carried out by employing the UAM method to analyze the effect of variations of the pitching angle on the aerodynamic lift and drag forces. According to the study, the pitching amplitude for maximum lift is in the range of 60°~70° as the flight velocity decreases from 5 m/s to 1 m/s during landing.
1. Introduction
Landing is a crucial stage for the safety and performance of aircraft flight. It is reported that 47% of aircraft accidents happen in the stage of landing. Flying animals in nature, such as birds, have demonstrated much advanced capability of short landing comparing with fixed-wing aircraft. By flapping the wings, birds can make use of the stall delay phenomenon and produce great aerodynamic lift and drag forces at large pitching angles and low flight velocity. By adjusting the flapping motion and pitching angle of the wings and body, the required lift and drag forces can be gained to achieve a safe short landing. As illustrated in Figure 1, the forward flight velocity of birds decreases rapidly during landing although the descending velocity in vertical direction increases. However, the forward velocity of a fixed-wing aircraft must be maintained to prevent stall and produce adequate lift for safe landing. Consequently, a fixed-wing aircraft usually lands with a certain runway distance.
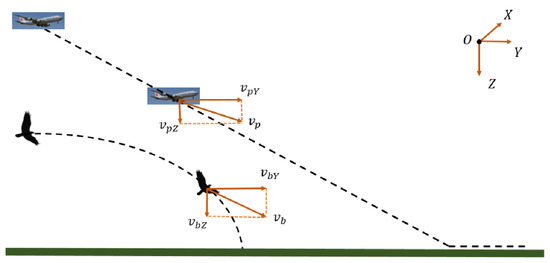
Figure 1.
The landing trajectories of a bird and fixed-wing aircraft.
Inspired by the superior flight performance of birds, research has been conducted on the kinematics of flapping wing motion during landing. Green et al. [1] observed large pitching angles between and of the wing together with the body of a pigeon during landing. Berg et al. [2,3] recorded the kinematics of motion of the flapping wing and body motion of a pigeon in descending flight. The study results pointed out that the body pitching angle combined with the wing twist plays an important role for a bird to achieve a short landing. The majority of lift and drag forces are produced by the modulation of the pitching angle during landing.
On the other hand, research efforts have been made on the theoretical analysis and numerical simulation of the aerodynamic performance of the flapping wing. Ellington et al. [4] revealed that the leading edge vortex generated by flapping wings led to a significant increase of lift coefficients compared to the steady-state aerodynamics of a fixed wing. Pesavento et al. [5] found that a flapping wing flight could save aerodynamic power compared to steady flight. Wu et al. [6,7,8] employed the CFD method to simulate the unsteady aerodynamics of an insect-like flapping wing and found that increased aerodynamic lift can be obtained at large flapping amplitude and large pitching angle (angle of attack, AOA) beyond the stall AoA. Based on potential flow theory [9,10] and Joukowski transformation [11,12], Ansari et al. [13] constructed an unsteady aerodynamic model (UAM) to calculate the aerodynamic force produced by the leading edge vortex [14,15,16] and trailing edge vortex [17,18,19]. Chen et al. [20] further developed the UAM to prevent the adverse effect of vortex penetration using a collision avoidance algorithm and enforced a zero-through-flow boundary condition for both two-dimensional (2D) and three-dimensional (3D) wings.
The previous research has established a solid base for aerodynamic analysis of flapping wings. However, less attention has been paid so far to the analysis of short landing performance of a bird-like aircraft. In this context, the investigation has been conducted into the kinematic of motion and associated aerodynamics of a flapping wing aircraft for short landing by employing the UAM validated by CFD. Experimental study of a bird-like flapping wing aircraft model was also carried out to measure the wing motion, inertia, and aerodynamic forces. The test data was used to compare and verify the numerical analysis results by UAM. In addition, a parametric study was carried out to evaluate effect of the kinematics of motion in particular the pitching angle and flapping frequency of flapping wings on the aircraft landing performance. The investigation results demonstrate the advantages of flapping wings in short landing performance compared to a fixed-wing aircraft.
2. Theoretical Analysis
2.1. UAM Method
The platform and geometry of the wing considered in the present study is shown in Figure 2a. It should be noted that the wings are assumed to be rigid and the deformation of wings are not considered, which serves a limitation of the study. A 2D airfoil of the rigid wing defined in an inertial coordinate system is illustrated in Figure 2b. The UAM developed in [20] is used to calculate the aerodynamic forces of the airfoil. The inertial coordinate system () remains fixed with respect to the Earth. The airfoil coordinate system () is fixed at the center of the airfoil and moves with it during flapping motion. The 2D airfoil has three degrees of freedom as illustrated in Figure 2, the pitching (), lunging (), and heaving (), where the dot () means the differentiation with respect to time.
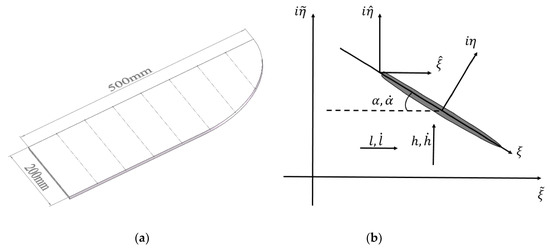
Figure 2.
(a) The 3D wing platform and dimension; (b) a 2D airfoil in inertial coordinate system.
As shown in Figure 3, the classical Joukowski transformation [11,12] can be used to uniquely map a circle of radius in the -plane into an airfoil in the -plane. The transformation can be expressed in -plane as follows:
where and 𝑧 are the complex coordinates in the -plane and the 𝑧-plane respectively; and are non-dimensional factors governing the thickness and the camber of the airfoil. is the angular displacement about the origin of the 𝑧-plane.
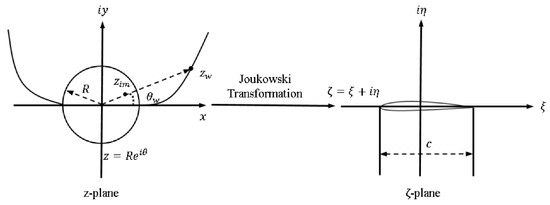
Figure 3.
Joukowski transformation of a circle to an airfoil.
According to the UAM [20], the aerodynamic force of a 2D airfoil of unit span can be expressed:
where refers to the complex conjugate of the incident velocity . is the air density. is the total quasi-steady wake-free bound circulation. is the vorticity in the aerofoil-wake system which can be decoupled into the aerofoil-bound component and the shed component . is the wake-free component of and is the wake-induced component. and are the trailing edge wake and the leading edge wake component of . R is the wing dimension as in Figure 3. In addition to the above parameters, the wing motion is represented by the pitching angle (), lunging () heaving amplitude () and incident velocity that are dimensional parameters in Equations (4)–(9) and illustrated in Figure 2b. The UAM takes into account the shedding process of the leading edge and trailing edge vortices considering the stall case in a very large AOA.
Since the UAM is based on 2D aerodynamic theory, the total aerodynamic force of a 3D wing can be obtained from the integration of number of 2D airfoil sections divided along the wing span with an approximate spanwise lift distribution. Since the wing, as shown in Figure 2, is of 63% uniform platform with the rest of wing chord reduced to zero at the tip, it is divided into eight sections with an elliptical shape of spanwise lift distribution to gain sufficient accuracy for the total aerodynamic force . The force is a complex value written as , and the real part and imaginary part refer to the force components in 90 degree phase difference. The aerodynamic forces acting on the airfoil are resolved into vertical lift force and horizontal drag force components in the inertial coordinate system :
As is the wing span, the total lift and drag forces of an entire 3D wing can expressed by Equations (11) and (12) as follows:
2.2. CFD Model of a Flapping Wing
In this research, the CFD simulation of the rigid wing is implemented by using the solver ANSYS-Fluent(ANSYS, Inc. Canonsburg, PA, USA). Generally, the program evaluates the effect of the wing motion on the initial mesh, and update the mesh to ensure that the mesh quality meets the requirements. In order to avoid long-time reconstruction and the poor quality of the dynamic mesh [21], the algebraic mesh generation method based on the transfinite interpolation theory [22] is used to generate a tetrahedral moving mesh around the flapping wing. The method is highly adaptable to the shape of the flapping wing and suitable for unsteady aerodynamic calculations.
As shown in Figure 4, the fluid field modelling is divided into inner-fluid and outer-fluid field. The inner-fluid field moves with the airfoil flapping and pitching, hence, will not be reconstructed during the calculation process. The whole structure contains five trailing surface meshes and three tetrahedral volume meshes. A grid resolution test is performed before the CFD method is implemented for the unsteady flow solution of the flapping wing. The effect of the grid density, time step and computational domain size on the solution have been taken into consideration. The radius of the interior circle is four times the wingspan and the radius of the far field circle is 10 times the wingspan. A non-dimensional time-step of 0.002 is taken so that 500 calculations are performed within one flapping cycle.
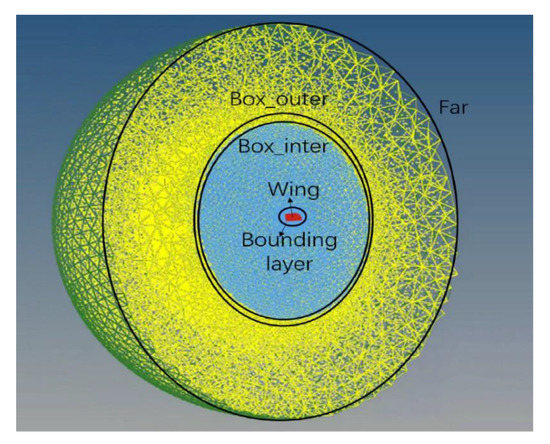
Figure 4.
The CFD grid structure and mesh of the fluid field.
3. Experimental Model Development
3.1. The Bird-Like Aircraft Model
The experimental aircraft model of flapping wings with the wing spar and root rib only is shown in Figure 5a. The wing is of semi-span 0.5 m and maximum chord 0.2 m. The flapping and pitching of the flapping wing is driven by a motor through a rotating shaft and a crank mechanism with further details shown in Figure 5b. The motor (2824MT) of mass 50 g is employed in the model. The motor can operate in a voltage range 7–12 V and current 4–8 A at maximum rotation speed 13,000 r/m. Connected to the crankshaft through the main connecting bar, the wing spar can flap about its root periodically along with the shaft rotation. In the same time, the wing rib connected to the crankshaft by a slave connecting bar makes the spar rotate and produce pitching variation associated with the flapping motion. The phase difference of the pitching from the flapping motion in a flapping cycle is determined by the connecting position of the phase angle bar. The flapping and pitching angles can be determined in a range by changing the dimension of the crankshaft and the connecting bars. Figure 5c shows the model mounted on a test rig when measuring the inertia force produced by the flapping motion.
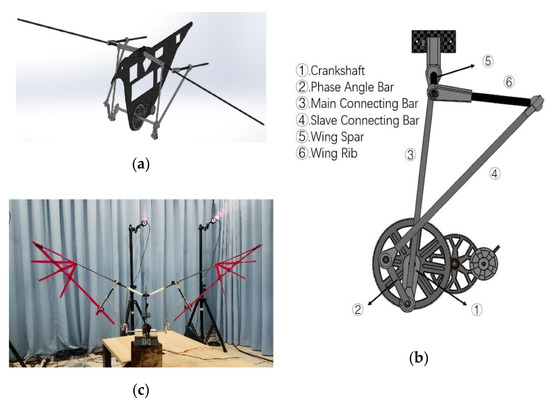
Figure 5.
(a) The flapping wing model, (b) the flapping mechanism, and (c) the test model without skin.
Table 1 shows the main parts and their mass of the experimental aircraft model. The wing spar and ribs and all the connecting bars are made of carbon/epoxy composite material; the shaft and ball joints are made of aluminum alloy. A high-precision six-axis force sensor, Nano 17 SI-25-0.25 (ATI Industrial Automation, Apex, NC, USA) was used to measure the forces produced by the flapping wing and mechanism during the experiment. The measurement ranges in different directions and the deviation of the Nano 17 are shown in Table 2.

Table 1.
Parts and mass of the experimental aircraft model.
Table 2.
The measurement ranges and deviation of the force sensor used in the experiment.
3.2. Test Rig and Experiment Setting
To validate the analytical method and results, an experimental platform was built to measure the flapping wing motion and forces of the aircraft model. As shown in Figure 6a, the test rig for force measurement consists of a carrier plate, craft splint, link span, force sensor, and bracket. Figure 6b shows the aircraft model mounted on the test rig at the bottom of the body 70 mm below the center of gravity of the whole model. The angle of the platform can be adjusted by tilting the carrier plate manually about the joint of the link span.
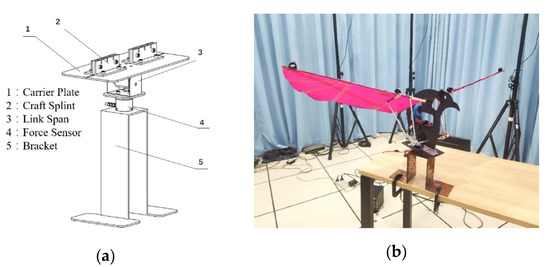
Figure 6.
(a) Test rig for force measurement, and (b) the aircraft model mounted on the test rig.
The platform also includes a module to measure the flapping wing motion utilizing the OptiTrack motion capture system with 12 three-dimensional space cameras (Prime 13, NaturalPoint, Inc. Corvallis, OR, USA) as shown in Figure 7. Parameters of the cameras are listed in Table 3. To capture the motion of the flapping wing and aircraft body, three reflective balls are mounted at the leading edge tip, root and trailing edge root of each wing. From the three ball locations, the geometric center of the closed triangle surface can be determined by the system to create a reference point for data processing. Similarly, three balls are fixed on the body of the aircraft model as shown in Figure 8.
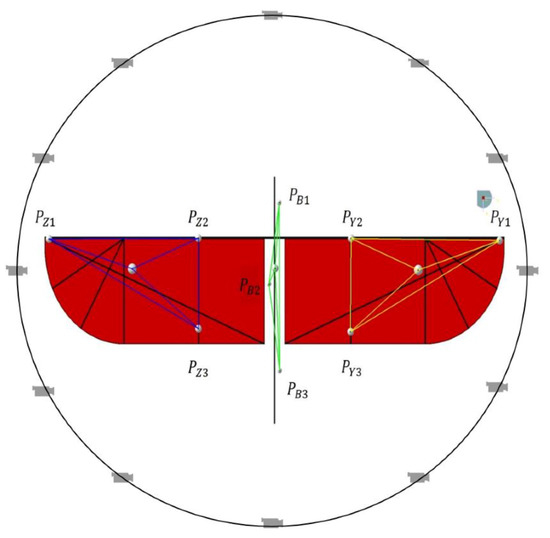
Figure 7.
The OptiTrack motion capture system with 12 cameras positioned around the test model.
Table 3.
The parameters of the cameras used in the experiment.
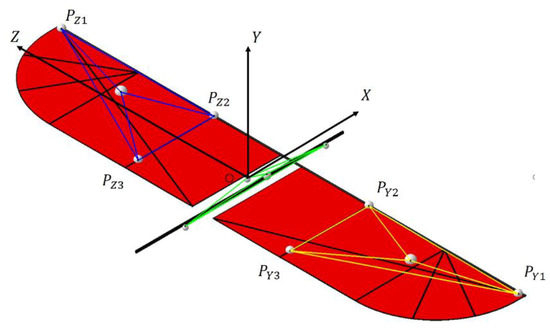
Figure 8.
The wing and reflective balls in the body coordinate system.
3.3. Data Acquisition and Processing
The OptiTrack motion system can capture the spatial displacement information of the balls moving with the wing as shown in Figure 7 to create a set of quaternion data [23,24]. The displacement data is measured in the body coordinate system formed by the camera. As shown in Figure 8, the body coordinate system is a left-hand coordinate system for the OptiTrack motion system. The origin of the coordinate system is set at a point on the body which may not coincide with the center of gravity of the model. The image data from the reflective balls is transformed from the body coordinate system to the inertial coordinate system [25].
The flapping angle of the wing is measured as the angle between the leading edge and its projecting line on the plane as shown in Figure 9. Therefore, the flapping angle is positive when the wing is above the plane and can be expressed as:
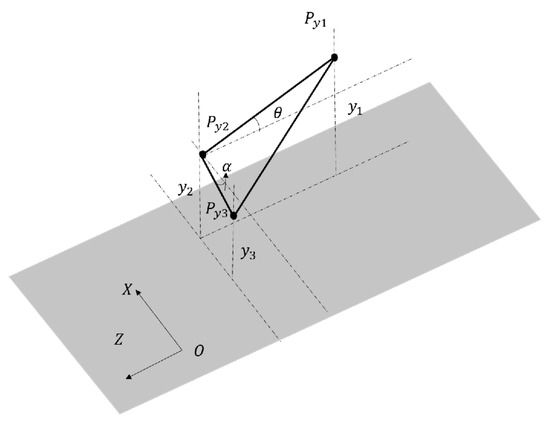
Figure 9.
The schematic diagram of the wing flapping and pitching angles.
The angle between the chord line and the plane is defined as the wing pitching angle and positive when the wing leading edge is greater than trailing edge, and can be expressed as:
3.4. Aerodynamic Force Acquisition and Processing
The dynamic forces acting on the aircraft are mainly from the flapping wing aerodynamic force and inertial force [26,27,28] including the body and flapping mechanism motion. The inertia force can be expressed as:
where and refer to the aircraft mass and acceleration, respectively.
The inertia force of the flapping wing and mechanism was measured by removing the skin of the flapping wing in a separate test. In the same approach as a previous research [29], the skin was cut to eight pieces and rolled onto the wing spar and ribs as shown in Figure 5c to make the mass distribution as close to the original skin as possible. The total inertia force of the model in a flapping cycle can be measured by the force sensor in the vertical direction and expressed as:
where is the inertia force of the flapping wing structure. is the inertia force of the linkage bars. is the inertia force of the body.
For the model with the wing skin as shown in Figure 5b, the total force measured in vertical direction can be expressed as:
where is the unsteady aerodynamic force produced by the flapping wing.
The measurement of the total vertical force with the skin and the inertia force without skin is synchronized by setting the maximum flapping amplitude in the same based on the two sets of flapping motion data obtained from the OptiTrack capture system. Therefore, these two points are selected as the start of a flapping cycle for comparison in the time domain. Since the inertia force remains the same for the same flapping condition, the aerodynamic lift force of the flapping wing, which varies with time in a flapping cycle can be calculated as follows:
Similarly, the aerodynamic drag or thrust of the wing is given by:
where and are the forces measured in horizontal direction by the load cell during tests.
4. Study Results and Discussion
4.1. Experimental Results
From the experiment, the flapping and pitching angles of the wing measured during one flapping cycle vary in the range of −26.1° to 25° and −18.2° to 43.9°, respectively, as shown in Figure 10. It is noted that there is a small asymmetry in the measured flapping and pitching angles and time delay between the wing up-stroke and down-stroke in a cycle. For example, when the flapping motion was started from 0° flapping angle where the wing was at the middle position in down-stroke, the pitching angle was about −10°; when the flapping wing is back to 0° again in up-stroke, the pitching angle was increased to the maximum 44°.
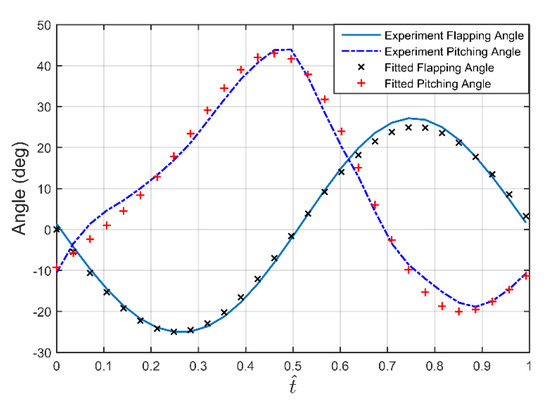
Figure 10.
Measured and fitted test data of flapping and pitching angles in one cycle ( refers to the non-dimensional time normalized by flapping cycle).
Based on the test data, the wing motion can be modelled by Sine function and Fourier function below. The measured flapping motion is idealized as a symmetric flapping and pitching angle functions with the amplitude varying from −25° to 25° and from −18° to 44°, respectively, as shown in Figure 10. The fitted data matches experimental data very well, and the R-squared values between experimental and fitting values of flapping and pitching angles are 0.9991 and 0.9921, respectively. Such slight fitting deviations are mainly caused by measurement errors of OptiTrack cameras and the fitting model as shown in Equations (20) and (21).
where and refer to the flapping angle and its amplitude of the wing. is the flapping frequency in radian. represents the pitching angle. , , , , are the correlation coefficients of the pitching amplitude. The pitching angle amplitude is defined as the difference between the smallest pitching angle to the largest pitching angle.
Figure 11a shows the measured forces of the model produced by the flapping wing with and without the wing skin in a stable flapping cycle at 2.1 Hz and zero flight velocity. To identify the main source that affects the results, the dynamic behavior of the model can be presented in the frequency domain as shown in Figure 11b by Fourier transformation. Three frequencies of 2.1 Hz, 4.3 Hz, and 6.5 Hz below 10 Hz can be identified from the experimental data. Since the 0 Hz mode can be ignored and the dominating 2.1 Hz is the flapping frequency, the additional modes of 4.3 Hz and 6.5 Hz remain as a concern. It can be speculated that those higher-order modes are from the test rig, which has little influence on the motion of the flapping wing and aerodynamic force.
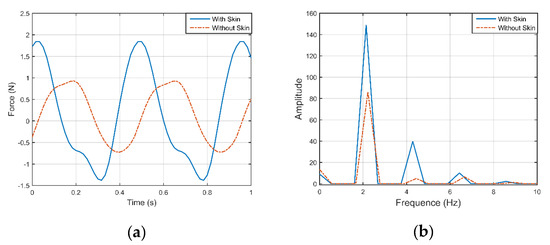
Figure 11.
Measured force with (a) and without skin; (b) transformed data in the frequency domain.
According to Equations (16) and (17), the difference between the measured force with and without the wing skin results in the aerodynamic lift as shown in Figure 12a. The corresponding drag force (negative value indicates thrust) can be also obtained and shown in Figure 12b. From the calculation, the measured peak value of lift force is 2.02 N and average lift in a flapping cycle is 0.123 N; the peak value of drag force is −0.68 N and the average drag is −0.43 N. It is noted that the average aerodynamic lift obtained from the experimental result is very low for the size of the wing. This is not only due to the relatively low flapping frequency (2.1 Hz) but also at zero flight velocity. The lift will increase significantly with the increase in flapping frequency and flight velocity as shown in the parametric study results in Section 4.3.
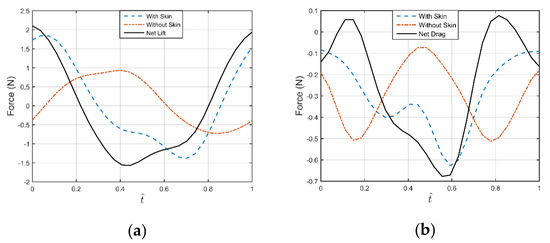
Figure 12.
The aerodynamic lift (a) and drag (or thrust), (b) extracted from the experimental data.
4.2. UAM Validation
Given the flapping wing motion as shown in Figure 9 obtained from the test data and Equations (20) and (21), the aerodynamic lift and drag forces are calculated using the UAM and CFD, and shown in Figure 13 and Figure 14 respectively. Aerodynamic lift and drag forces obtained in experiments refer to the net vertical and horizontal forces, respectively. As shown in Figure 13, it is noted that the aerodynamic lift forces by the three methods are of the same characteristics. In particular the UAM results agree with the experimental results very well considering the small difference of the idealized flapping motion from the measured one. The CFD results show more time delay comparing with the test data. In terms of average lift in a flapping cycle, the force 0.150 N calculated by UAM is very close to the CFD result of 0.152 N but greater than the measured force 0.123 N. Refer to the motion of the flapping wing, it can be found that when the wing is at the midpoint of the down-stroke and , all the lifting forces reach the peak value (UAM: 2.00 N, CFD: 1.96 N, and experiment: 2.02 N) with difference less than 3%. At this moment, the speed of flapping wing motion is at its maximum and the pitching angle is −10°, which should result in a thrust force (see Figure 14).
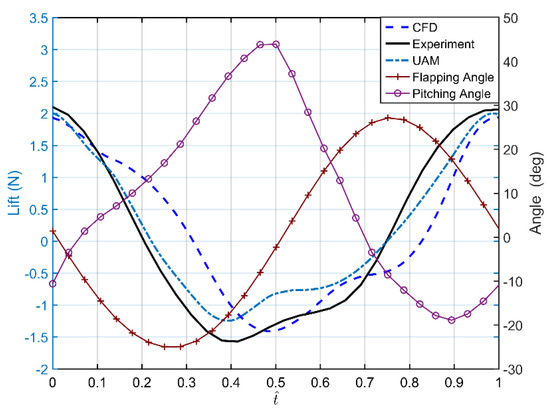
Figure 13.
Flapping motion and lift forces by UAM, CFD and experiment (lift force obtained in experiments refers to the net vertical force; down-stroke: = 0~0.25; up-stroke: = 0.25~0.75; down-stroke: = 0.75~1).
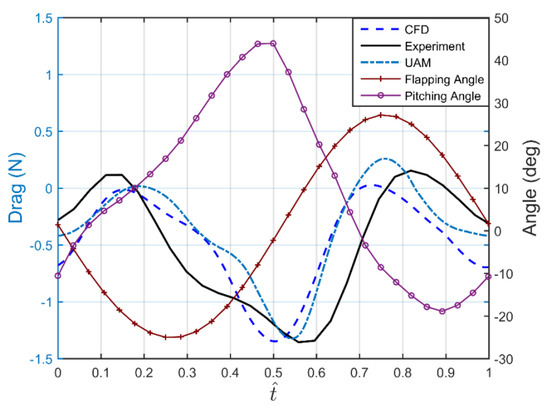
Figure 14.
Flapping motion and drag forces by UAM, CFD and experiment (drag force obtained in experiments refers to the net horizontal force).
It is observed from Figure 13 that the large difference between the forces occurs in the up-stroke during and . When the wing is moving close to the midpoint in upstroke at = 0.4~0.5, the lift forces reach the minimum value, and the timing for UAM and experiment is about 0.1T earlier than the CFD result. The values from UAM (−1.33 N) and CFD (−1.42 N) are of 13.1% and 6.3% difference from the experiment result (−1.53 N) respectively. At the end of the down-stroke ( = 0.25) when the flapping speed is nearly zero with pitching angle 18°, the lift from CFD shows a small positive value due to the wing rotation from negative to positive pitching angle, and soon reduces to zero during up-stroke motion at = 0.32. While the lift forces from UAM and experiment reach zero earlier at = 0.2~0.22. The same situation occurs at the end of up-stroke ( = 0.75) where the UAM and experimental results become zero, but the CFD result is still a negative value.
As shown in Figure 14, the two peak values of drag force in a flapping cycle occurring at = 0.19 and = 0.75 for the UAM are very close to the CFD and experimental results. The difference of average drag force in a flapping cycle by UAM (−0.37 N) and the CFD (−0.42 N) from the experimental result (−0.43 N) is 14% and 2.3%, respectively.
The results show that the UAM and CFD methods can capture the aerodynamic characteristics measured in the experiment including the force variation and peak values. In particular, the difference of maximum force values in down-stroke is less than 3%. The difference of the average force in a flapping cycle calculated by the UAM and CFD is only 1.3%. However, the difference of the results from the measured force obtained in the experiment is 18%. Although this is caused by a number of reasons, including the approximate wing motion measured at limited points and inertia force, the main reason is likely to be the ignorance of the skin flexibility of the wing in the UAM and CFD model. Nevertheless, the UAM provides a method of high efficiency and adequate accuracy to calculate the aerodynamic forces of the flapping wing model.
4.3. Parametric Study
4.3.1. Effect of Pitching Angle of Aerodynamics
A parametric study to evaluate the effect of varying pitching angle on the aerodynamics is carried out using UAM. This is because the aerodynamic lift is more sensitive to the pitching angle than the flapping angle. The study is aiming to find an optimal wing motion as a combination of pitching and flapping angles to achieve maximum lift and drag forces for short landing. The range of pitching angles considered in the study are extended to 0°~45° and 0°~60° in comparison with the experimental case −18°~44° used for validation. The lift and drag force results are shown in Figure 15 and Figure 16.
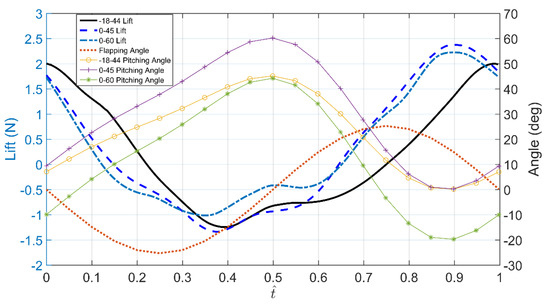
Figure 15.
The lift forces of the flapping wing in three cases of pitching angle variation.
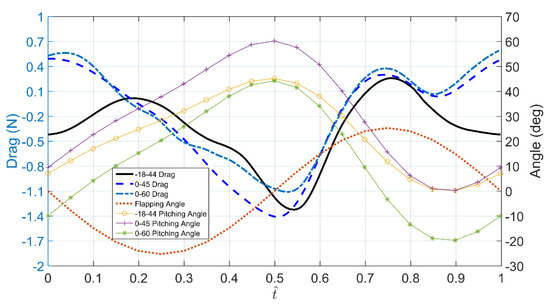
Figure 16.
The drag forces of the flapping wing in three cases of pitching angle variation.
The study shows that the average lift force 0.31 N for the pitching angle variation case 0°~60° is 19% greater than the case 0°~45° (0.25 N), and 52% greater than the experimental case −18°~44° (0.15 N). This is mainly because the negative lift force produced by the up-stroke wing is reduced due to large pitching angle 50°~60° during = 0.4~0.6 as shown in Figure 15. In addition, the maximum lift is increased in down-stroke during = 0.75~0.95. Regarding the drag results as shown in Figure 16, the average drag force −0.144 N (negative for thrust) in a flapping cycle for the case 0°~60° is 60% greater than the experimental case −18°~44° result of −0.359 N and 38% greater the case 0°~45° result of −0.234 N. The increased drag or reduced thrust (negative drag value) is preferable for short landing. This is also due to the increased pitching angle during the wing flapping motion.
According to the simulation results shown in Figure 15 and Figure 16, it is noted that small positive pitching angle of the wing in down-stroke results in the increase of lift, and a large pitching angle in the up-stroke results in a reduced negative lift and increased drag force. This can be demonstrated by a parametric study of extended range of pitching amplitude from 15° to 90°. The resultant average lift and drag forces are presented in Table 4 and Figure 17.
Table 4.
Average lift and drag forces produced by the wing of different pitching angle ranges.
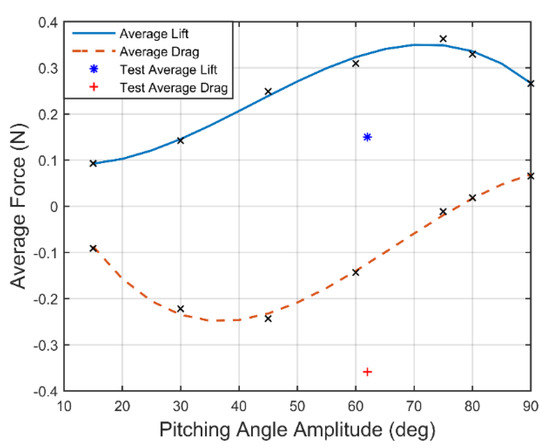
Figure 17.
Average lift and drag forces of the wing in a range of pitching amplitude 15°~90°.
As shown in Figure 17, the average lift increases to maximum with the pitching amplitude from 15° to 75° before decreases. In the same time, the average thrust (negative drag value) is produced by the wing from 15° and increases until reaching a maximum for pitching amplitude of 45°. Afterwards, the thrust starts to reduce to zero at about 75° and then becomes positive (drag) as the pitching amplitude keeps increasing. The average lift and drag forces from the experimental case are also marked in Figure 17 for comparison (the pitching amplitude is 62° for pitching angle variation −18°~44°).
From the above case study, it is noted that the maximum average lift force and zero drag force occur for pitching amplitude around 75°. Therefore, the further study is focused on a small range of pitching angles between 45° and 90°. Figure 18 shows the resulting lift and drag forces in the case of pitching angles varying within 0°~45°, 0°~75°, and 0°~90° for comparison. The results show that the lift force in the cases of 0°~75° and 0°~90° are very close, but the lift in the 0°~45° case is significantly smaller (larger negative) during the first half up-stroke period = 0.25~0.5 and continues until = 0.63. In the down-stroke period = 0.75~1 however, the smaller pitching angles 0°~45° result in a significantly greater positive lift force compared to the other two large pitching angle cases. It can be inferred that a much greater lift force can be generated if a quick increase of pitching angle from 45° to 75° can be made in the up-stroke period = 0.25~0.63 and a quick transition back from 75° to 45°~0° in the down-stroke period . The results indicate that an optimal kinematics of motion can produce a much greater lift force although additional driving power may be required.
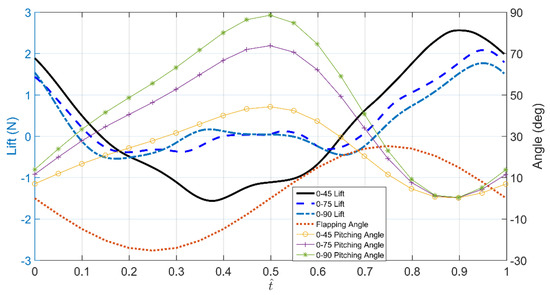
Figure 18.
The lift forces of flapping wing with pitching angle case 0°~45°, 0°~75° and 0°~90° (down-stroke: = 0~0.25; up-stroke: = 0.25~0.75; down-stroke: = 0.75~1).
The resulting drag forces in a flapping cycle for the three pitching angle cases 0°~45°, 0°~75° and 0°~90° is shown in Figure 19 with a similar feature to the lift variation. A large difference occurs between the drag forces in case 0°~45° and large pitching angle cases 0°~75° and 0°~90° in the up-stroke period = 0.25~0.6. In the first half of the up-stroke, negative drag forces (thrust) are produced in the case of a small pitching angle of 0°~45°, and achieves a peak value −1.4 N when the pitching angle reaches maximum 45° at the midpoint of up-stroke ( = 0.5). While a small positive drag force occurs in this period and reaches a peak value 0.22 N and 0.76 N at large pitching angles 0°~75° and 0°~90°, respectively. The drag forces keep small positive for the three cases in the down-stroke period = 0.75~1.
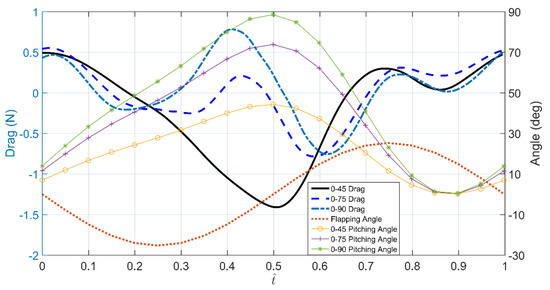
Figure 19.
The drag forces of the flapping wing with pitching angle 0°~45°, 0°~75°, and 0°~90°.
4.3.2. Effect of Flight Velocity
Based on the above results at zero flight velocity, the study is extended to the influence of flight velocity on the aerodynamic forces to evaluate the short landing behaviors of the aircraft. To validate the UAM used for the flapping wing of large pitching angle at low flight velocity, the lift and drag forces are calculated by CFD and UAM for a case of the pitching angle at 0°~60° at 4 m/s. As shown in Figure 20, the variation of the forces by the two methods is in very good agreement. The difference of average lift and drag forces between the UAM and CFD is only 2.3% and 2.1%, respectively. The results indicate that the UAM can also be utilized to calculate the aerodynamic forces of the flapping wing at low flight velocity.
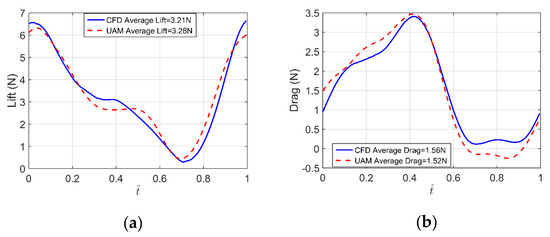
Figure 20.
The lift force (a) and drag force (b) of the flapping wing with pitching angle 0°~60° at 4m/s by UAM and CFD.
Figure 21 shows the average lift and drag forces of the flapping wing in full range of pitching amplitude 15°~90° at flight velocity 0~5 m/s during landing. The flight velocity in Figure 21 is also translated to the advance ratio (), which is the ratio of the flight speed to the speed of the wing tip. The advance ratio can be expressed by:
where is the amplitude of the flapping angle, is the flapping frequency and is the wing semi-span.
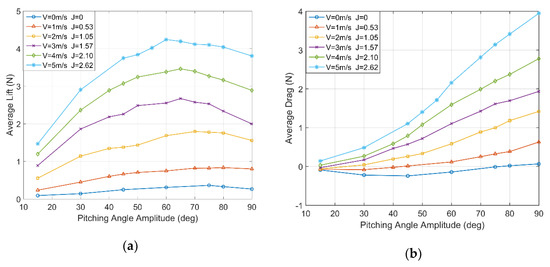
Figure 21.
Average lift (a) and drag (b) of different amplitudes under different flows.
The average lift and drag forces increase with the velocity above zero for any pitching amplitude. As shown in Figure 21a, the maximum average lift occurs within the range of pitching amplitude 60°~75°. In this range, the higher the velocity, the smaller the pitching amplitude required for maximum lift force. As shown in Figure 21b, the average drag force increases with the pitching amplitude for any flight velocity except zero. At zero velocity, however, the average drag is negative and reduced (thrust increases) until the pitching amplitude is increased to 45°, and then slowly increases (thrust reduces) to a small positive value at 90°.
Based on the above study results, it can be revealed that the pitching angle of the flapping wing for maximum lift in the above cases is in the range between 60° and 70° at the flight velocity range from 1 m/s to 5 m/s. For a pitching angle of the wing pre-determined by the flapping mechanism, the variation of the aircraft pitching angle can be altered by the changing the tail-plane.
The pitching angle is only one of the factors that affect the landing of the flapping wing aircraft. The flapping frequency and velocity of the incoming flow also play important roles in landing. Table 5 shows average lift force and drag force produced by the wing of different flapping frequencies with pitching angle 0°~60° at zero flight velocity. The average lift varies with flapping frequency in an almost linear relationship, but with the square of flight velocity. If an optimal kinematics of motion including all the above factors is obtained at different flight velocities and attitudes during landing, an optimal landing strategy may be achieved. However, this optimization process is beyond the scope of the present study.
Table 5.
Average lift and drag forces produced by the wing at different flapping frequency with pitching angle 0°~60° at zero flight velocity.
5. Conclusions
Based on validation by using CFD and experimental data, the UAM is suitable for the unsteady aerodynamic force calculation of a flapping wing with large pitching amplitude at low flight velocity. For the experimental case where the pitching angle is idealized as −18°~44° and flight velocity is zero, the average lift forces between the UAM and CFD method have a small difference of 1.3%, but a large difference of 18% occurs when compared to experimental result. For the study case of flight velocity at 4m/s and pitching angle 0°~60°, the average lift force difference of 2.3% and drag force difference 2.1% between the UAM and CFD remain in the same level as the zero velocity case.
From the parametric study of the flapping wing, it is revealed that an optimal pitching amplitude and change rate of pitching angle near the end of up-stroke play a critical role for the lift force. The kinematics of motion of a flapping wing can be improved by a quick reduction of pitching angle in up-stroke during = 0.25~0.5 to achieve maximum lift force.
For this aircraft model, the maximum lift occurs in the range of pitching angle amplitude between 60°~70° when the flight velocity is reduced from 5 m/s~0 m/s during landing. In general, the drag increases with the flight velocity. As the forward flight velocity decreases during landing, the aircraft should continuously increase the wing pitching angle up to 75° to gain maximum lift. In the same time, the increased pitching angle results in increased drag to decelerate the aircraft motion.
Author Contributions
Conceptualization: B.J., S.G., and Z.Z.; methodology: S.G.; software: Z.Z.; validation: Z.Z., Y.L. (Yushuai Li), and Q.Z.; formal analysis: F.Y.; investigation: F.Y. and Q.Z.; resources: S.C.; data curation: S.C. and Z.Z.; writing—original draft preparation: Z.Z.; writing—review and editing: Z.Z., B.J., and S.G.; visualization: Z.Z.; supervision: B.J., R.S., and Y.L. (Yibin Li). All authors have read and agreed to the published version of the manuscript.
Funding
This research was supported by National Key R&D Program of China, grant number 2018YFB1305400; the National Natural Science Foundation of China, grant number 61673246 and 81301294, and the Research and Development Program of Jinan, grant number 201907064.
Conflicts of Interest
The authors declare no conflict of interest.
References
- Green, P.R.; Cheng, P. Variation in kinematics and dynamics of the landing flights of pigeons on a novel perch. J. Exp. Biol. 1998, 201, 3309–3316. [Google Scholar] [PubMed]
- Berg, A.M.; Biewener, A.A. Kinematics and power requirements of ascending and descending flight in the pigeon (Columba livia). J. Exp. Biol. 2008, 211, 1120–1130. [Google Scholar] [CrossRef] [PubMed]
- Berg, A.M.; Biewener, A.A. Wing and Body Kinematics of Takeoff and Landing Flight in the Pigeon (Columba livia). J. Exp. Biol. 2010, 213, 1651–1658. [Google Scholar] [CrossRef] [PubMed]
- Ellington, C.P.; Van Den Berg, C.; Willmott, A.P.; Thomas, A.L. Leading-edge vortices in insect flight. Nature 1996, 384, 626–630. [Google Scholar] [CrossRef]
- Pesavento, U.; Wang, Z.J. Flapping wing flight can save aerodynamic power compared to steady flight. Phys. Rev. Lett. 2009, 103, 118102. [Google Scholar] [CrossRef]
- Zhou, C.; Wu, J.; Guo, S.; Li, D. study on the lift generated by a flapping rotary wing applied in a micro air vehicle. Proc. Inst. Mech. Eng. Part G J. Aerosp. Eng. 2013, 228, 2083–2093. [Google Scholar] [CrossRef]
- Li, H.; Guo, S.; Zhang, Y.L.; Zhou, C.; Wu, J.H. Unsteady aerodynamic and optimal kinematic analysis of a micro flapping wing rotor. Aerosp. Sci. Technol. 2017, 63, 167–178. [Google Scholar] [CrossRef]
- Wu, J.H.; Hu, J. Aerodynamic Analysis of the Rotor/Wing in Conversion Flight. AMM 2014, 670, 604–608. [Google Scholar] [CrossRef]
- Chadwick, E. A slender–wing theory in potential flow. Proc. R. Soc. A Math. Phys. Eng. Sci. 2005, 461, 415–432. [Google Scholar] [CrossRef]
- Singh, N.; Aikat, S.; Basu, B.C. Incompressible potential flow about complete aircraft configurations. Aeronaut J. 1989, 93, 335–343. [Google Scholar]
- Malonek, H.R.; De Almeida, R. A note on a generalized Joukowski transformation. Appl. Math. Lett. 2010, 23, 1174–1178. [Google Scholar] [CrossRef]
- Ysasi, A.; Kanso, E.; Newton, P.K. Wake structure of a deformable Joukowski airfoil. Phys. D 2011, 240, 1574–1582. [Google Scholar] [CrossRef]
- Ansari, S.A.; Żbikowski, R.; Knowles, K. Non-linear unsteady aerodynamic model for insect-like flapping wings in the hover. Part 1: Methodology and analysis. Proc. Inst. Mech. Eng. Part G J. Aerosp. Eng. 2006, 220, 61–83. [Google Scholar] [CrossRef]
- Muijres, F.T.; Johansson, L.C.; Barfield, R.; Wolf, M.; Spedding, G.R.; Hedenström, A. Leading edge vortex improves lift in slow-flying bats. Science 2008, 319, 1250–1253. [Google Scholar] [CrossRef]
- Muijres, F.T.; Johansson, L.C.; Winter, Y.; Hedenström, A. Leading edge vortices in lesser long-nosed bats occurring at slow but not fast flight speeds. Bioinspir. Biomim. 2014, 9, 25006. [Google Scholar] [CrossRef]
- Pitt Ford, C.W.; Babinsky, H. Lift and the leading-edge vortex. J. Fluid Mech. 2013, 720, 280–313. [Google Scholar] [CrossRef]
- Li, J.; Wu, Z. Unsteady lift for the Wagner problem in the presence of additional leading/trailing edge vortices. J. Fluid Mech. 2015, 769, 182–217. [Google Scholar] [CrossRef]
- ABID; MALEK. Nonlinear mode selection in a model of trailing line vortices. J. Fluid Mech. 2008, 605, 19–45. [Google Scholar] [CrossRef]
- Yang, K.; Zhang, L.; Xu, J. Simulation of aerodynamic performance affected by vortex generators on blunt trailing-edge airfoils. Sci. China Ser. E Technol. Sci. 2010, 53, 1–7. [Google Scholar] [CrossRef]
- Chen, S.; Li, H.; Guo, S.; Tong, M.; Ji, B. Unsteady aerodynamic model of flexible flapping wing. Aerosp. Sci. Technol. 2018, 80, 354–367. [Google Scholar] [CrossRef]
- Vatandas, E.; Hacioglu, A.; Ozkol, I. Vibrational genetic algorithm (VGA) and dynamic mesh in the optimization of 3D wing geometries. Inverse Prob. Sci. Eng. 2007, 15, 643–657. [Google Scholar] [CrossRef]
- Xie, H.; Song, W.P.; Song, B.F. Airfoil design of a micro-flapping wing based on CFD. Acta Aerodyn. Sinica 2009, 27, 227–233. [Google Scholar]
- Zhang, F. Quaternions and matrices of quaternions. Linear Algebra Appl. 1997, 251, 21–57. [Google Scholar] [CrossRef]
- Zhu, Y.; Xiang, H.; Wei, F.; Li, S. Trajectory Planning Algorithm Based on Quaternion for 6-DOF Aircraft Wing Automatic Position and Pose Adjustment Method. Chin. J. Aeronaut. 2010, 23, 707–714. [Google Scholar]
- Norris, A.N. Euler-Rodrigues and Cayley Formulae for Rotation of Elasticity Tensors. Math. Mech. Solids. 2008, 13, 465–498. [Google Scholar] [CrossRef]
- Nguyen, Q.V.; Park, H.C.; Goo, N.S.; Byun, D. Aerodynamic force generation of an insect-inspired flapper actuated by a compressed unimorph actuator. Chin. Sci. Bull. 2009, 54, 2871–2879. [Google Scholar] [CrossRef]
- Zhu, D.; Wang, Q.; Hu, M.L. The Inertia Force of Insect-Like Flapping Wing Micro Air Vehicle. Adv. Mater. Res. 2011, 327, 186–192. [Google Scholar] [CrossRef]
- Chen, M.W.; Zhang, Y.; Sun, M. Wing and body motion and aerodynamic and leg forces during take-off in droneflies. J. R. Soc. Interface 2013, 10, 20130808. [Google Scholar] [CrossRef]
- Guo, S.; Li, H.; Zhou, C.; Zhang, Y.L.; He, Y.; Wu, J.H. Analysis and Experiment of a Bio-inspired Flyable Micro Flapping Wing Rotor. Aerosp. Sci. Technol. 2018, 79, 506–517. [Google Scholar] [CrossRef]


© 2020 by the authors. Licensee MDPI, Basel, Switzerland. This article is an open access article distributed under the terms and conditions of the Creative Commons Attribution (CC BY) license (http://creativecommons.org/licenses/by/4.0/).