1. Introduction
Uranium metal is used in a variety of applications because of its high density and unique nuclear properties. In pure uranium metal, the body-centered-cubic (BCC) allotrope, γ, is only stable at elevated temperatures (776 °C < T < 1135 °C) [
1]. On cooling, uranium undergoes a solid-solid phase transformation to the tetragonal β phase (observed in a very small interval of temperatures and pressures), followed by a second transformation to the orthorhombic α phase, which is stable at room temperature and below. Among these phases, the γ phase has the best technical properties for nuclear engineering purposes, due to its cubic symmetry and elastic properties. However, γ-uranium is known to be stabilized at high temperatures by phonon-phonon coupling that is strongly anharmonic [
2]. Consequently, this phase is decidedly unstable at low temperatures (T < 776 °C) and quenching cannot suppress spontaneous transformation to non-cubic crystal structures [
3,
4,
5].
Uranium metal at low temperatures, where machining and other material processing may take place, exists in the α-uranium structure, which is less than ideal due to its brittle nature and tendency to form uranium-oxides. The poor corrosion resistance and undesirable combinations of strength and ductility observed in this structure have spurred numerous investigations into methods to destabilize this phase by introducing one or more alloying constituents [
3].
Most known alloying elements dissolve to only a very limited degree in the α and β forms of uranium, while, in γ-uranium, more extensive solid solubility can be achieved [
6]. For most applications, mechanical isotropy is a desirable property and much work has been focused on broadening the range of γ-phase stability by alloying. To achieve stability at room temperature, attempts have been made to alloy uranium with other γ soluble elemental metals, such as Mo [
7,
8], Nb [
9], Zr [
10], and Ti [
11,
12]. These elements have minimal solubility in β or α uranium [
7]; however, they can form
metastable alloys by rapidly quenching from the high-temperature γ phase. Among this group of γ soluble metals, Nb is somewhat unique because it does not form an intermetallic compound with uranium, although the possibility of the α″ metastable structure as an “ordered” phase has been addressed [
13]. The addition of niobium to uranium is particularly beneficial, as it significantly increases oxidation resistance [
14].
Figure 1 shows the equilibrium U-Nb phase diagram [
15,
16,
17,
18,
19]. There is complete solubility across the equilibrium U-Nb phase diagram in the high-temperature BCC (γ) phase [
18]. The uranium-niobium phase diagram displays a γ-phase miscibility gap at high temperatures with a critical temperature,
Tc = 950 ± 20 °C, and a critical concentration,
cc = 52.3 at.% Nb. At 647 °C an equilibrium monotectoid reaction is exhibited according to the formula γ
1(BCC) → γ
2(BCC) + α(orthorhombic). The γ
1 and γ
2 phases contain 13.3 and 70 ± 2 at.% Nb, respectively, whereas the α phase has less than 1 at.% Nb in solution. Upon slow cooling under equilibrium conditions, the γ
1 phase undergoes diffusional decomposition at 647 °C in order to form a two-phase structure consisting of unalloyed α-uranium and niobium-rich γ-phase (γ
2). At this composition, microstructures tend to consist of discrete niobium-rich γ-phase (γ
2) with a matrix of unalloyed α-uranium. This structure offers poor corrosion resistance due to the lack of niobium in solid solution, and also the two-phase structure gives rise to microscopic anodic and cathodic regions [
3].
Given its high melting point, good corrosion resistance, good conductivity, and continuous BCC region at high temperatures, U-Nb is considered to be a promising metallic fuel candidate for Gen-IV fast breeder reactors [
20]. However, the fuel exhibits various metastable phase transformations, resulting in microstructures that strongly and negatively affect performance (see, for instance, [
3,
4,
20,
21,
22]). Duong et al. [
20] studied discontinuous precipitation (DP) to a lamellar microstructure that is known to degrade U-Nb’s corrosion resistance and ductility [
23]. Zhang et al. [
24] reported experimental observations of general precipitation, followed by discontinuous precipitation. In the U-Nb system, DP occurs as part of the monotectoid decomposition:
in which, γ is a quenched BCC matrix, α is orthorhombic precipitate, and
is metastable BCC precipitate with an intermediate composition differing from that of stable γ
2 (see
Figure 2a). DC corresponds to discontinuous coarsening.
Djuric [
25] examined the decomposition of the γ phase in the U-21.2Nb (at.%) alloy. Based on post-XRD analyses of samples that were quenched from isothermal heat treatment, Djuric [
25] hypothesized that α and γ form two local equilibria (LE) with each other, one at an intermediate composition, γ′, and the other at the global equilibrium composition, γ
2. Due to the former LE, γ would decompose partially into α and metastable γ′, if its initial composition γ was greater than γ′. This explains the occurrence of DP. After a suitably long incubation time, the γ
2 phase will nucleate in the system and, since it corresponds to the
stable phase in equilibrium with α, it would evolve spontaneously, resulting in DC. As the isothermal holding temperature increased, Djuric [
25] observed that the composition of the γ′ precipitate gradually shifted towards Nb-lean compositions. Djuric schematically described energy profiles reproduced in
Figure 2b to demonstrate their hypothesis [
20,
25]. In this Figure the common tangent to the α and γ′ (γ
1–2 on
Figure 2b) phase curves is also given (dashed line). During the decomposition of the γ′ solid solution below the eutectoid temperature, the α + γ′ phase mixture, corresponding to this tangent, is formed. Of course, being metastable, it continues to transform to the equilibrium α + γ
2 (the common tangent solid line). The Gibbs energy schematic put forward by Djuric [
25] illustrates the generation of competing common tangent equilibria, but in all cases the common tangent between α and γ′ is always metastable with respect to the α and γ
2 equilibrium. Djuric [
25] mentioned that, upon Cahn’s theoretical argument [
26], during eutectoid decomposition the equilibrium composition of the product phases could only be achieved in the ideal case when the reaction rate approaches zero.
As has been mentioned here and in Ref. [
3], solid solution additions of elements, such as niobium, titanium, and zirconium metals, significantly improve uranium’s resistance to corrosion and substantially alter its mechanical properties. In practice, prior to machining, these alloys are typically heat-treated in the γ-phase (to form uranium alloy solid solutions) and then rapidly quenched to room temperature. Quenching uranium-niobium alloy compositions containing less than 9 at.% Nb to room temperature suppresses diffusion-controlled transformations to the equilibrium phases, resulting in an orthorhombic phase similar to unalloyed U. Because this phase is
supersaturated and its lattice parameters differ from the pure metal, it has been designated α′. Uranium alloys containing between 10 and 16 at.% Nb form additional supersaturated metastable phases [
5]. At room temperature after quenching, alloys containing 15.2 at.% Nb form a monoclinic distortion of the orthorhombic α phase (α″) and those with ~16.6 at.% Nb formed a tetragonal distortion of the BCC γ phase (γ
0) [
5]. The reactions producing α″ and γ
0 are generally regarded as
martensitic in nature, occurring by shear and/or displacive mechanisms requiring only cooperative, short-range motions of the atoms [
5,
7,
27]. The
highly supersaturated metastable α-phase solid solution exhibits far better corrosion resistance than unalloyed uranium and it is amenable to subsequent age hardening, permitting a wide range of mechanical properties through the selection of aging temperature and time [
16,
28].
In several investigations [
5,
7,
15,
29,
30,
31,
32] evidence was presented suggesting that the reaction path for these diffusion-less transitions proceeded progressively as:
where the notations, α′, α″, and γ
0 has been suggested by Lehmann and Hills [
33].
Multiple variations of the α and γ phases are known to exist depending on the Nb content [
13,
16,
29]. However, equilibrium conditions are not achieved without extended heat treating due to the low diffusivity of Nb in U. Because of this, metastable phase variants of α and γ
2, depending on the alloy content, form as indicated in
Figure 3 [
16,
29]. In this figure, corresponding paired lines represent the martensite start (M
S) and martensite finish (M
F) temperatures on cooling. Higher cooling rates favor martensitically-formed metastable phases by avoiding
diffusional decomposition of γ solution during cooling to room temperature. Because of the sluggish solid-state diffusion in this system, the monotectoid reaction is usually bypassed at even moderate cooling rates (20 °C/s or greater), which are easily achieved during water quenching [
3,
29].
Chebotarev and Utkina [
34] reported another
metastable phase, γ
s, in a 22.2 at.% Nb alloy that was quenched from the γ phase region and annealed for 300 h at 1200 °C. The structure was studied by a single-crystal XRD pattern and identified as a distorted cubic structure. The γ
s phase might be interpreted as a doubled BCC cell in two directions due to periodic displacement of central atoms in the unit cells.
Starikov et al. [
35] studied the structure and thermodynamic properties of cubic and tetragonal phases of pure uranium and U-Mo alloys. They focused on the metastable γ
0 phase that is formed in U-Mo alloys at low temperature. Upon heating, the tetragonal structure transforms into the cubic γ
s phase [
34]. γ
s phase transforms to γ phase with a quasi-body-centered cubic (
q-BCC) lattice at elevated temperatures, according to Starikov et al. [
35].
Starikov et al. [
35] mentioned that the structure of
metastable uranium alloys at low temperature does not exactly match the structure of γ-uranium. A following sequence of shear transformations between metastable phases takes place upon quenching from the high-temperature homogeneous γ solid solution [
7,
8,
31,
34,
36]:
One of the most important conclusions of Ref. [
35] is that γ
s has a quasi-body-centered cubic (
q-BCC) lattice. The local positions of uranium atoms in γ correspond to γ
s, but the orientations of the central atom displacements are disordered. At a low level of disorder (i.e., at low values of temperature or Mo concentration), the system exhibits long-range correlations in the “anisotropy direction”, and formation of γ
0 takes place. At a high level of disorder, long-range correlation in the “anisotropy direction” is disturbed, and the formation of γ
s with
q-BCC structure occurs. In this terminology [
35], the γ
s-phase is similar to the para-elastic state. It resembles the transformation between neptunium phases (β-Np → BCC-Np), which has been described in a similar manner [
37].
All of the studied structures of the U-Mo alloys have areas of stability on the
T − x diagram [
35]. Thus, in the atomic simulation the change of temperature results in the spontaneous phase transition.
Figure 4 shows the calculated phase diagram for U-Mo alloys presented in Ref. [
35]. Here, three phases are considered: γ
0, γ
s and γ.
U-Nb alloys exist in the BCC structure only at elevated temperatures, but the metastable phases, α′, α″, γ
0, and γ
s, can be obtained by rapid quenching to room temperature, as has been discussed above [
4,
7,
9,
19,
27,
30,
31,
32,
34]. Wu et al. [
29] found that increasing a Nb equivalent (Nb
eq) of the U-6 wt.% Nb alloy (adding some small amount of titanium at the expense of uranium) promotes the formation of the γ
0-tetragonal phase at the expense of the α″-monoclinic phase, resulting in a doubling of the yield strength relative to the water quenched (WQ) α″ phase and a strain induced transformation to the α″ phase with superelastic strains to 4.5%.
Here, we address the question of the phase stability in the U-Nb and U-Nb-Ti alloys from first-principles theory. We note that this approach is very accurate for both components of the alloy, namely, uranium and niobium. The ground-state phases are correctly predicted for both uranium [
38] and niobium [
39], and one can assume that the corresponding alloys are also accurately modeled within the same theoretical framework.
We also use first-principles theory to confirm that 25 at.% of BCC Nb (4d-transition metal) can stabilize the BCC-like metastable γ
s phase in the U
3Nb compound that was discovered by Chebotarev and Utkina [
34] and modeled by Starikov et al. [
35].
Uranium belongs to the series of actinide metals that display many interesting properties that are primarily driven by the nature of the 5f electrons that dominate the chemical bonding in all naturally occurring actinides [
37]. Fortunately, the electronic-structure theory founded on density-functional-theory (DFT) is very suitable and quite accurate in describing these metals. In
Section 2, we briefly introduce two techniques that are based on DFT to calculate, at zero temperature, the total energy of a particular metal, alloy, or compound. The two techniques are complimentary, as one is more accurate for metals and compounds while the other has the capability to treat disordered alloys efficiently and accurately. The results are presented in
Section 3, where the two computational techniques are utilized and compared to available experimental data. Finally, we conclude and summarize our investigation in
Section 4.
2. Computational Methods
We leverage a couple of numerical methods to study the U-Nb alloy system. These methods rely on density-functional theory that was conceived more than 50 years ago [
40,
41]. DFT is exact as a concept, but, in practice, approximations are necessary. For example, the electron exchange and correlation interactions, for which we use the generalized gradient approximation (GGA) [
42,
43], are more accurate for actinides than the older local density approximation (LDA) [
44]. For niobium, the solids-biased gradient approximation PBEsol [
45] is better, but since we are focusing on the uranium-rich side of the U-Nb phase diagram we adopt the GGA either in its original [
42] or similar but simplified form [
43]. There are discussions in the literature on applying an intra-atomic Coulomb interaction with a Hubbard
U parameter (DFT +
U) for metallic uranium fuels [
46], but we have previously proved that this ad hoc interaction does not improve the accuracy of the model, but rather worsens it [
47,
48,
49].
Regarding numerical details of the computations, we apply two methodologies. First, we employ a reliable [
50] all-electron full-potential linear muffin-tin orbital (FPLMTO) method [
51].
Our FPLMTO method makes no numerical approximations, except for that of the GGA. Basis functions, charge densities, and potentials are represented in spherical harmonics inside non-overlapping spheres that surround each atom and in Fourier series in the region between these muffin-tin spheres. The electron potential includes all relativistic terms, including spin-orbit interaction [
48]. Orbital polarization only operates on the d and f states.
Generally, the f-electron systems are exceptionally represented with 6s and 6p pseudocore states and 7s, 7p, 5f, and 6d valence-band states. The number of k points that are included in the calculations depends on the crystal structure, but we apply ~1000 k points for the simpler structures and fewer for the multi-atom phases. It should be mentioned that this method has been validated and proven accurate on actinide systems numerous times dating back to the early 1990′s up until very recently [
37,
38,
47,
48,
49,
52,
53,
54].
The calculations we have denoted as the Exact Muffin-Tin Orbitals (EMTO) method are performed while using the Green’s function formalism based on the improved screened Korringa-Kohn-Rostoker technique, where the one-electron potential is defined by optimized overlapping muffin-tin (OOMT) potential spheres [
55,
56]. Inside the potential spheres the potential is spherically symmetric, and it is permanent between the spheres. The radius of the potential spheres, the spherical potential inside these spheres, and the permanent value in the interstitial region are resolved by minimizing (i) the deviation between the exact and overlapping potentials and (ii) the errors that are caused by the overlay between the spheres. Within the EMTO scheme, the one-electron states are calculated exactly for the OOMT potentials. As a product of the EMTO calculations, one can determine self-consistent Green’s function of the system and the complete, non-spherically symmetric charge density. Lastly, the total energy is calculated while using the full charge-density approach [
57]. We consider, as the valence states, the 7s, 6p, 6d, and 5f states for U, 5s, 4p, and 4d states for Nb and 4s, 3p, and 3d for Ti. The corresponding Kohn–Sham orbitals are expanded in terms of spdf exact muffin-tin orbitals, i.e., we selected an orbital momentum cutoff,
lmax = 3. The EMTO orbitals, consecutively, consist of the spdf partial waves (solutions of the radial Schrödinger equation for the spherical OOMT potential wells) and the spdf screened spherical waves (solutions of the Helmholtz equation for the OOMT muffin-tin zero potential). The completeness of the muffin-tin basis was discussed in detail in [
56], and it was demonstrated that for metals crystallizing in close-packed lattices
lmax = 3 (spdf orbitals) leads to well-converged charge density and total energy. The generalized gradient approximation (GGA) is selected for the electron exchange and correlation energy functional [
43]. Integration over the Brillouin zone is implemented while using a 25 × 25 × 25 grid of k-points resolved according to the Monkhorst–Pack technique [
58]. The moments of the density of states, needed for the kinetic energy and valence charge density, are computed by integrating the Green’s function over a complex energy contour (with 2.8–3.0 Ry diameter) while using a Gaussian integration technique with 40 points on a semi-circle encircling the occupied states.
The EMTO method is coupled with the coherent potential approximation (CPA) in order to treat compositional disorder [
59,
60]. The ground-state properties of the chemically random alloys are obtained from EMTO-CPA computations that include the Coulomb screening potential and energy [
61,
62,
63]. The screening constants are obtained from supercell calculations adopting the locally self-consistent Green’s-function (LSGF) technique [
64] for a 1024 atoms supercell that represents the random equiatomic alloys. The
α and
β screening constants (see Refs. [
61,
62] for details) are found to be
αU =
αNb = 0.724 and
β = 1.411 for U-Nb alloys;
αU = 0.742,
αNb = 0.694,
αTi = 0.767, and
β = 1.101 for U-Nb-Ti alloys. The EMTO-CPA technique has been previously successfully utilized in order to define thermodynamic properties of the uranium-based metallic nuclear fuels, including: U-Zr, U-Pu-Zr, U-Mo, U-Ti, and U-Nb [
19,
65,
66,
67,
68,
69].
In order to ensure the accuracy of structural energetics of the EMTO method, it is compared with the more accurate FPLMTO method for elemental uranium, as described in the results section next.
3. Results
The primary objective of this study is to explain why the addition of a small amount of titanium (at the expense of uranium) in the U-6Nb alloy promotes the stabilization of the γ
0-tetragonal phase at the expense of the α″-monoclinic phase [
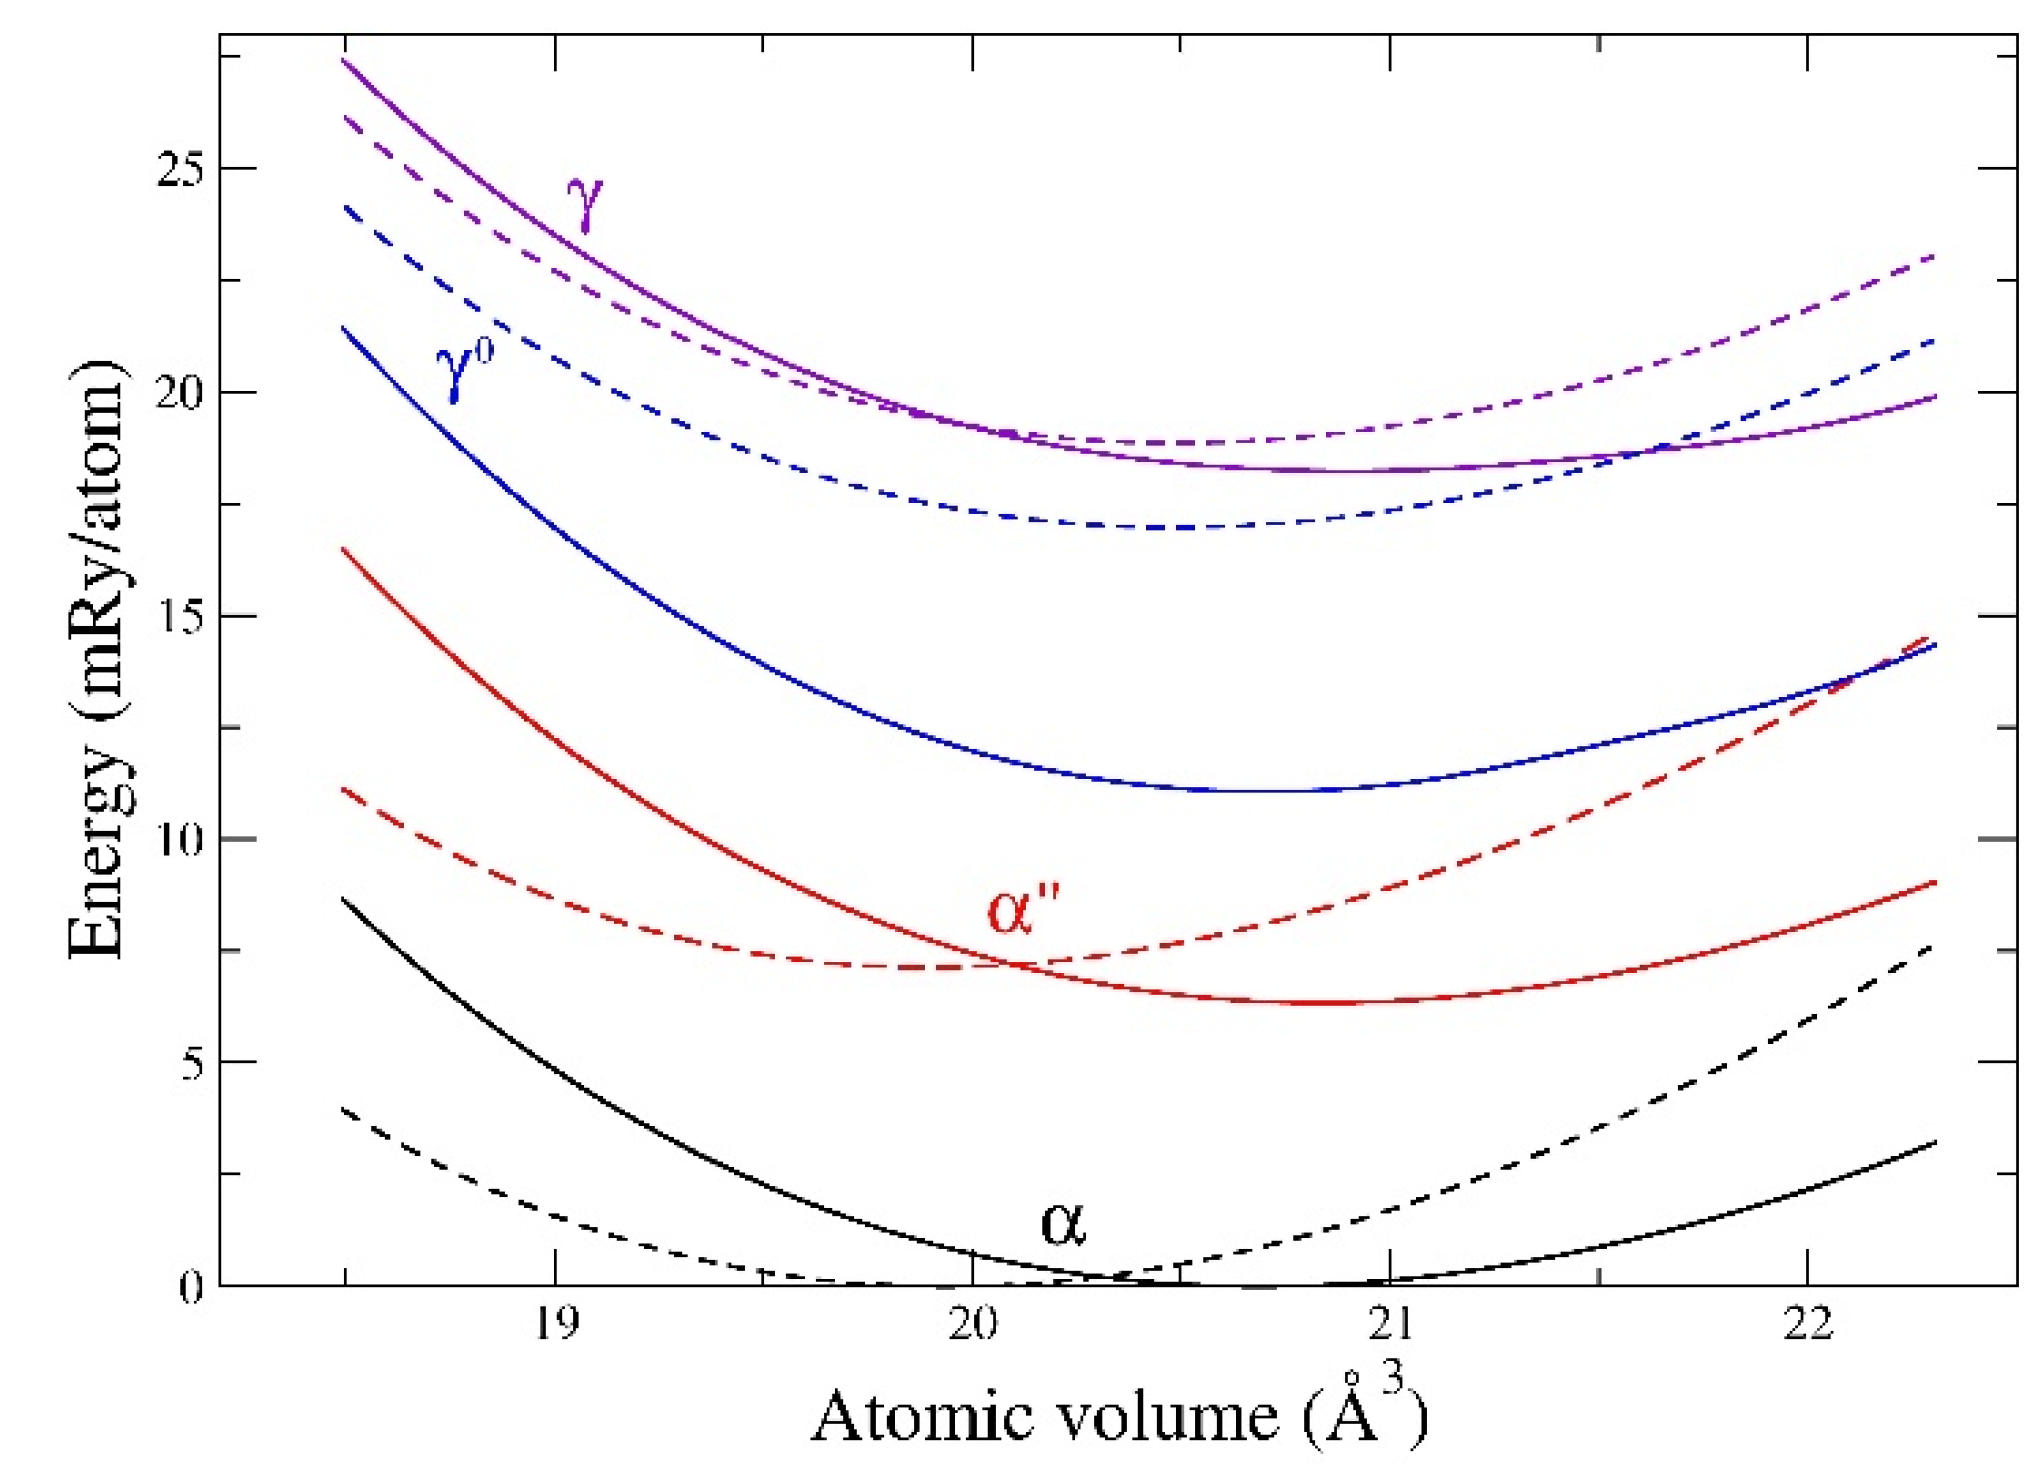
29]. However, we demonstrate the applicability of the DFT approach more generally for unalloyed uranium metal before addressing this particular alloy. For elemental metals, the most exact results are obtained from the FPLMTO method because of its lack of any structure-geometrical approximations. In
Figure 5, we show total energies for α, α″, γ
0, and γ uranium, as functions of the atomic volume for both FPLMTO and EMTO methods. In these calculations, the axial ratios, and internal parameters for α, α″, and γ
0 have been optimized (relaxed) in order to produce the lowest energy state utilizing the FPLMTO approach. The same structure (no further relaxation) is adopted for the EMTO computations. The details of these structures can be found in Refs. [
7,
13,
16,
18,
27,
31] (see
Appendix A). Importantly, we find that the ranking of the phases in terms of energy is the same for both methods with the ground-state α phase lowest and the BCC (γ) phase highest. The energy differences are also about the same, except for EMTO over-estimating γ
0 relative to FPLMTO. There are also slight shifts in the equilibrium volumes between these two methods, where EMTO predicts smaller values than both FPLMTO and experiments. For example, FPLMTO predicts an α-phase volume of 20.67 Å3, while EMTO concludes 19.94 Å3. The smaller volumes that were obtained from EMTO calculations originate from neglecting the spin-orbit coupling [
49,
67] (in the present study only scalar relativistic EMTO calculations are performed). The experimental zero-Kelvin volume is very close to the FPLMTO value, 20.55 Å
3 [
70].
In
Figure 6 we illustrate the FPLMTO energy landscape associated with γ (BCC) and γ
0 (tetragonal) phases at a constant atomic volume 20.3 Å
3. Interestingly, there are no local maxima or minima, except at the locations of γ
0 and γ phases, on this two-dimensional energy surface. The optimized γ
0 structure (c/a = 0.94 and z = 0.13) is adopted for the EMTO calculations of this phase. Uranium metal also has a complicated 30-atom tetragonal β phase that only exists at high temperatures [
1] and it is less important for the U-Nb system. Therefore, we have not included β-U in our current modeling.
In
Figure 7, we show the total energies for α″, γ
0, and γ structures, mentioned above for uranium, calculated for pure uranium and niobium metals within both FPLMTO and EMTO methods. The total energy of the α (monoclinic) structure is assumed to be equal to zero (as the reference point). As in the case of uranium, for niobium metal, the axial ratios and internal parameters for α, α″, and γ
0 have been optimized (relaxed) in order to produce the lowest energy state utilizing the FPLMTO approach. The same structure (no further relaxation) is adopted for the EMTO computations for niobium. The γ (BCC) structure is the ground state for niobium that lies 13 and 14 mRy/atom, for FPLMTO and EMTO, respectively, below the energy of the optimized α-U-type structure for niobium (the reference point), as can be seen from
Figure 7. The energy of the γ
0-type uranium structure for niobium converges to the energy of the ground state γ structure when the structure is relaxed (or optimized) according to both FPLMTO and EMTO calculations. The optimized α″-uranium structure for niobium has the energy of +7.9 mRy/atom and +12.7 mRy/atom with respect to the reference system (α-Nb), for FPLMTO and EMTO calculations, respectively, although the corresponding energies are very “close” in the case of uranium metal.
In
Figure 7, we connect the energies of U and Nb metals of the same structures with dashed lines. Although calculations for U
1-xNb
x alloys require the optimization of the axial ratios and internal parameters for α, α″, and γ
0 structures at each value of the concentration “
x”, the result for the γ (BCC) structure (no optimization is necessary) brings us to an interesting conclusion. According to FPLMTO and EMTO calculations, the γ structure becomes the
stable structure in the U-Nb system when the amount of niobium exceeds 60 at.%, as can be seen from
Figure 7. The U-Nb phase diagram, Refs. [
15,
19], at 647 °C an equilibrium monotectoid reaction occurs according to the formula γ
1(BCC) → γ
2(BCC) + α(orthorhombic), as is mentioned in the Introduction section [
4]. The γ
1 and γ
2 phases contain 13.3 and 70 ± 2 at.% Nb, respectively, whereas, the α phase has less than 1 at.% Nb in solution [
15,
19]. From FPLMTO and EMTO calculations, the estimated range of the
stable niobium rich γ-phase (>60 at.% of Nb) of the U-Nb solid solution corresponds to the upper Nb concentration limit (70 ± 2 at.% Nb) of the
stable, γ
2 phase, the so-called “niobium-rich BCC solid solutions” formed as the result of the
diffusional monotectoid reaction: γ
1(BCC) → γ
2(BCC) + α(orthorhombic).
We can now return to the primary objective of the present study, namely, to explain why the addition of a small amount of titanium to the U-6Nb alloy promotes the stabilization of the γ
0-tetragonal phase (recently established experimentally in Ref. [
29]).
Figure 8a shows the calculated (DFT-EMTO) energies for two
metastable α″ and γ
0 phases of the U
86.23Nb
13.77 alloy as functions of the atomic volume. The amount of Nb (13.77 at.%) in the U-Nb alloy corresponds to the value that is presented in Table 1 of Ref. [
29] for the alloy named the “Powder 1” in the first row: “As-built = 137,000 ± 400” ppm. The
metastable α″ phase of the U
86.23Nb
13.77 alloy exhibits a lower energy than the
metastable γ
0 phase indicating the stability of the α″ phase over the γ
0 phase observed in this alloy, as can be seen from
Figure 8a [
29].
Figure 8b shows the calculated (DFT-EMTO) energies for two
metastable α″ and γ
0 phases of the U
83.56Nb
13.84Ti
2.60 alloy as function of the atomic volume. The amount of Nb (13.84 at.%) in the U-Nb-Ti alloy corresponds to the value that is presented in Table 1 of Ref. [
29] for the alloy named the “Powder 2” in the first row: “As-built = 138,400 ± 300 ppm”. The
metastable γ
0 phase of the U
83.56Nb
13.84Ti
2.60 alloy exhibits a lower energy than another
metastable α″ phase indicating the stability of the γ
0 phase over α″ phase observed in this alloy, as can be seen from
Figure 8b [
29]. Hence, the effect of Ti is to favor γ
0 over α″.
The authors of the experimental results, as presented in Ref. [
29], tried to keep the amount of Nb constant: 13.77 at.% (7.80 wt.% in the U-Nb alloy and 13.84 at.% (6.04 wt.%) in the U-Nb-Ti alloy. The addition of some amount (2.60 at.%) of titanium metal to the U-Nb alloy was only possible by decreasing the amount of uranium metal in that alloy from 86.23 at.% (U-Nb) to 83.56 at.% (U-Nb-Ti), in order to fulfill this condition. As a result of alloying the U-Nb alloy with Ti, the so-called “Nb equivalent” (Nb
eq (at.%) = Nb (at.%) + Σ
impurities (at.%)) increases from 13.77 at.% (U-Nb alloy) to 13.84 + 2.60 = 16.44 at.%. As has been mentioned in the Introduction, depending on the Nb concentration, the U-Nb alloys exhibit the following room-temperature structures on quenching from the γ phase: α′ orthorhombic (0 to 9 at.%); α″ monoclinic (9 to 15 at.%); and, γ
0 tetragonal (16 to 20 at.%). By keeping the amount of niobium metal almost the same as was in the original U-Nb alloy and adding 2.60 at.% of titanium, the authors [
29] increased the Nb equivalent, Nb
eq, from 13.77 at.% (U-Nb) to 16.44 at.% (U-Nb-Ti). Nb
eq (at.%) = 13.77 at.% corresponds to the stability region of the metastable α″-monoclinic structure, but Nb
eq (at.%) = 16.44 at.% corresponds to the stability region of the γ
0-tetragonal structure, as has been mentioned above. These arguments explain why the addition of some small amount of titanium metal to the U-6Nb alloy promotes the stabilization of the γ
0-tetragonal phase at the expense of the α″-monoclinic phase, resulting in better mechanical properties of U-6Nb alloys [
28].
According to numerous investigations summarized in Ref. [
16] and presented in
Figure 3, the reaction path for
diffusion-less transitions in U-Nb alloys progressively proceeds as (see the expression (2)): γ → γ
0 → α″ → α′.
However, the additional metastable phase, γ
s, could be quenched in the U-22.2 at.% Nb alloy, according to the experiments of Chebotarev and Utkina [
34] and recent modeling of Starikov et al. [
35]. Starikov et al. [
35] suggested that the
diffusion-less transitions in the U-Nb system can follow the scheme (see the expression (3)): γ → γ
s → γ
0 → α″ → α′.
In
Figure 3, we schematically show the metastable phases for the U-Nb phase diagram [
16,
29]. Because of the sluggish solid-state diffusion in the U
1-xNb
x alloys, the metastable phase variants of the stable α and γ
2 phases, α′, α″, and γ
0, form depending on the niobium content. According to
Figure 3, increasing Nb content leads to a sequence of the metastable phases: α′ → α″ → γ
0 [
16,
29]. This progression is consistent with the results shown in
Figure 5 where the
stable α phase of uranium metal has the lowest energy followed by the
metastable α″ and γ
0 phases, and finally the
stable γ uranium phase. As was experimentally established in Ref. [
34], another metastable phase, γ
s, in a U-22.2 at.% Nb alloy could be quenched from the γ phase region. Of course, it makes sense that a relatively large amount of the BCC metal Nb (>20 at.%) can “stabilize” this
metastable γ phase. Actually, a simple approximate model where one is substituting uranium with niobium atoms (without allowing for any disorder or structural relaxations) explains this stabilization, see
Figure 9. In this model, it is clear that 25 at.% Nb favors γ over α uranium. Intuitively, one associates the “stabilization” of the metastable γ phase as being due to alloying with a metal of the same structure (Nb is also BCC). However, this is not the driving force of the stabilization, but rather more generally the presence of 4d electrons that belongs to the transition metal. The α phase originates from the bonding 5f states of the uranium atom [
37,
38], while the BCC phase is a result of a balance between 5f and 4d states, where the latter provides the preference for the BCC phase [
39]. To show this, we illustrate in
Figure 9 that replacing the Nb atom with an atom from a metal that is face-centered cubic (FCC), namely Rh, actually has a greater effect on stabilizing the γ phase than Nb itself (dashed lines in the middle panel). This might seem counterintuitive, but the reason is that Rh provides more 4d electrons than Nb and these electrons help in stabilizing the γ phase. However, for practical purposes, Rh is far too rare and expensive to be considered a viable stabilizer.
Lastly, we show the energetics of the metastable γ
s phase of the U
3Nb compound in
Figure 10. In this figure, the parameter
x distorts the BCC γ phase (
x = 0.25) and defines the γ
s phase. As opposed to the calculation in
Figure 9, the structures are all fully relaxed and for the U
3Nb compound, the α phase remains slightly below the BCC (γ) phase. The metastable γ
s phase is observed for the specific U
77.5Nb
22.2 alloy with the specific value of the parameter,
x = 0.241 ± 0.001, according to Chebotarev and Utkina [
34]. In
Figure 10, we notice that energetics of the metastable γ
s phase of the U
3Nb compound, within the interval 0.242 ≤
x ≤ 0.248, is only slightly higher either then that of the γ or α forms of this compound.
4. Summary and Conclusions
U-6Nb is a
metastable alloy that is most often produced with a microstructure that forms
martensitically during rapid cooling from the high-temperature phase, γ (BCC). This alloy is primarily α″ (monoclinic), but it can also contain γ
0 (tetragonal) in high Nb regions of the microstructure [
16,
29]. Wu et al. [
29] investigated the microstructure-property behaviors of two U-6Nb alloys with different impurity levels that were fabricated while using laser powder bed-based additive manufacturing (AM). Two powder alloys have been investigated, which differ in composition, such that one alloy (referred to as the high impurity alloy, HI) contains a significantly higher amount of Ti than the other (referred to as the low impurity alloy, LI) [
29]. Both HI and LI alloys contain 13.6–13.9 at.% (5.9–6.0 wt.%) Nb; however, the HI alloy contains 2.37 at.% (0.49 wt.%) of Ti and LI alloy contains almost no Ti − 0.0022 at.% (0.00044 wt.%). Neutron diffraction measurements of the LI alloy indicated a mixed phase in the as-built condition, resembling 42% γ
0 and 58% α″ [
29]. After homogenization and water quenching from high to room temperatures (WQ), the LI alloy had approximately 100% α″ structure and this structure was not affected by aging at 200 °C for 2 h [
29]. The HI alloy possessed approximately 50% γ
0 and 50% α″ in the as-built condition; however, after homogenization and WQ, the HI alloy had 100% γ
0 structure and aging also did not affect this structure [
29]. The mechanical properties of these two alloys were affected by their different microstructures: after homogenization/WQ/aging, the HI alloy with 100% γ
0-structure showed a yield strength increase of 550 MPa, over 2× that of the LI alloy, which contained 100% α″-structure. This increase in yield strength was accompanied by super-elastic strains up to 4.5% [
29].
In addition to the significant amount of Ti in the HI alloy, LI and HI alloys both contain a very small amount of Mo, Zr, V, Ta, W, Fe, Al, Ni, Cu, Mn, and O. We assumed that the LI alloy had no impurities at all and is represented as the U86.23Nb13.77 alloy with 7.80 wt.% Nb in order to simplify our modeling conditions. We also assumed that the HI alloy had no impurities, except 2.60 at.% of Ti, and it is represented as the U83.56Nb13.84Ti2.60 alloy with 6.04 wt.% Nb.
Our calculations show that the addition of 2.60 at.% of Ti at the expense of U to the U-6Nb alloy promotes the formation of the γ
0-tetragonal phase at the expense of the α″ monoclinic phase, which is in perfect accord with the experimental results [
29]. We explain this phenomenon by comparing the Nb equivalent for the U
86.23Nb
13.77 alloy (Nb
eq (at.%) = 13.77 at.%) with one for the U
83.56Nb
13.84Ti
2.60 alloy (Nb
eq (at.%) = 16.44 at.%). At intermediate Nb content (9–15 at.% Nb), the metastable α″-monoclinic structure is formed and at the higher Nb content (16–20 at.% Nb) the metastable γ
0-tetragonal structure is formed. We argue that the U
86.23Nb
13.77 alloy has a Nb
eq (at.%) = 13.77 at.%, which corresponds to the stability region of the α″-monoclinic structure, but the U
83.56Nb
13.84Ti
2.60 alloy has a Nb
eq (at.%) = 16.44 at.%, which corresponds to the stability region of the γ
0-tetragonal structure.
The microstructure and properties that are associated with quenched U-6 wt.% Nb are markedly different and far more desirable than slow cooled U-6 wt.% Nb, as mentioned in Ref. [
3]. During quenching from high to room temperatures (WQ), the
diffusion-controlled transformations to the equilibrium phases can be easily suppressed and other transformation alternatives, usually resulting in
metastable phases, take place. The high cooling rate forces the γ-phase solid solution to transform
martensitically to variants of the low temperature α-phase in which the alloying elements are retained in
supersaturated solid solution. These
highly supersaturated metastable α-phase U-Nb solid solutions exhibit far better corrosion resistance than unalloyed uranium and they are amenable to subsequent age hardening permitting a wide range of mechanical properties through the selection of aging temperature and time [
3]. Adding a small amount (~2–3 at.%) of Ti to the U-6Nb alloy substantially alters its mechanical properties [
29], although Nb and Ti both form
metastable supersaturated solutions with uranium in the quenched U-6Nb-Ti alloy. The present
ab inito DFT calculations were able to reproduce the preference of the
metastable γ
0-tetragonal structure over another
metastable α″-monoclinic structure observed [
29] in the WQ U-6Nb-Ti alloy.


