4.1. Performance Analysis of MA-SM with Maximum-Likelihood Receiver
In the following, we derive the closed-form formula for the error probability of the MA-SM system. For the sake of simplicity, the upper bound on the error probability is derived assuming
. The generalization is straightforward. Let
be defined as two received codewords, where
and
are the rotation angles associated with the antenna combination
and
, respectively. The PEP is defined as:
where
is the Gaussian tail function, or simply the
Q-function. The unconditional pairwise error probability (UPEP) is obtained by taking the expectation of (
8) over the channel matrix
. A closed-form formula of (
8) is given as follows [
2]:
where:
and the square Euclidean distance between the two vector symbols is given by:
In (10),
is the signal-to-noise ratio (SNR). At high SNR, the asymptotic pairwise error probability is approximated as follows:
Finally, the union bound on the UPEP is obtained by averaging over all the hypotheses of the transmit vectors as follows:
where
M is the spectral efficiency of the MA-SM system,
is the number of antenna combinations that can be used for transmission, and
is the frequency associated with the term
. The derivation of the
terms depends on the distance,
where
is the logical exclusive or operation.
4.2. Analysis of the MA-SM Performance for Configuration I and II
In this subsection, the performance of configuration I and II from
Table 1 are analyzed because they have the same
and
. The distance,
has three distinct values: 0, 2 and 4. These values are analyzed in the following.
Case 1:.
This case occurs when the combinations
and
are equal, which implies that there is no error in the spatial symbol. In this case, the two symbols in the transmitted vector and those in the estimated vector are located at the same index. In other words, the signal symbols in both vectors are transmitted from the same antennas. Accordingly,
,
and
. Based on the first and second columns of
Table 1, the frequency of this term is equal to 4. The
term is given by:
Therefore, the error probability will depend on the Euclidean distance among the signal symbols transmitted from the same antenna.
Case 2:.
In this case, one signal symbol from the transmitted vector and one in the estimated vector are located at the same index. The second symbols in the transmitted and estimated vectors are located at different indexes. This corresponds to one of the following equiprobable four cases:
,
,
↔
and
. The corresponding
term is given by:
,
,
↔
and
. The corresponding
term is given by:
,
,
↔
and
, leading to
,
,
↔
and
. The
term is given by:
Case 3:.
In this case, the two signal symbols in the transmitted vector and those in the estimated vector are located at different indexes. The two possibilities leading to
are:
,
,
↔
,
↔
and
. The
term is given by:
Note that the two signal symbols are drawn from the same PSK/QAM constellation. Based on (
15)–(
20),
and
are excluded from the cost function of the optimization problem because they do not depend on the rotation angles. Also, the weights associated with each of the terms
to
are equal. Therefore, they can be removed from the multi-objective optimization without affecting the end result. However, they should be used in the evaluation of error performance as they might dominate the sum in (
13). Finding the set of angles that reduces the error probability is formulated as a multi-objective optimization problem as follows:
where
is a vector of length of 4. The optimal angles are obtained using the Matlab optimization tool. First, we analyze the obtained angles in the case of PSK modulation. The general form of the optimal angles obtained using (
21) is given by:
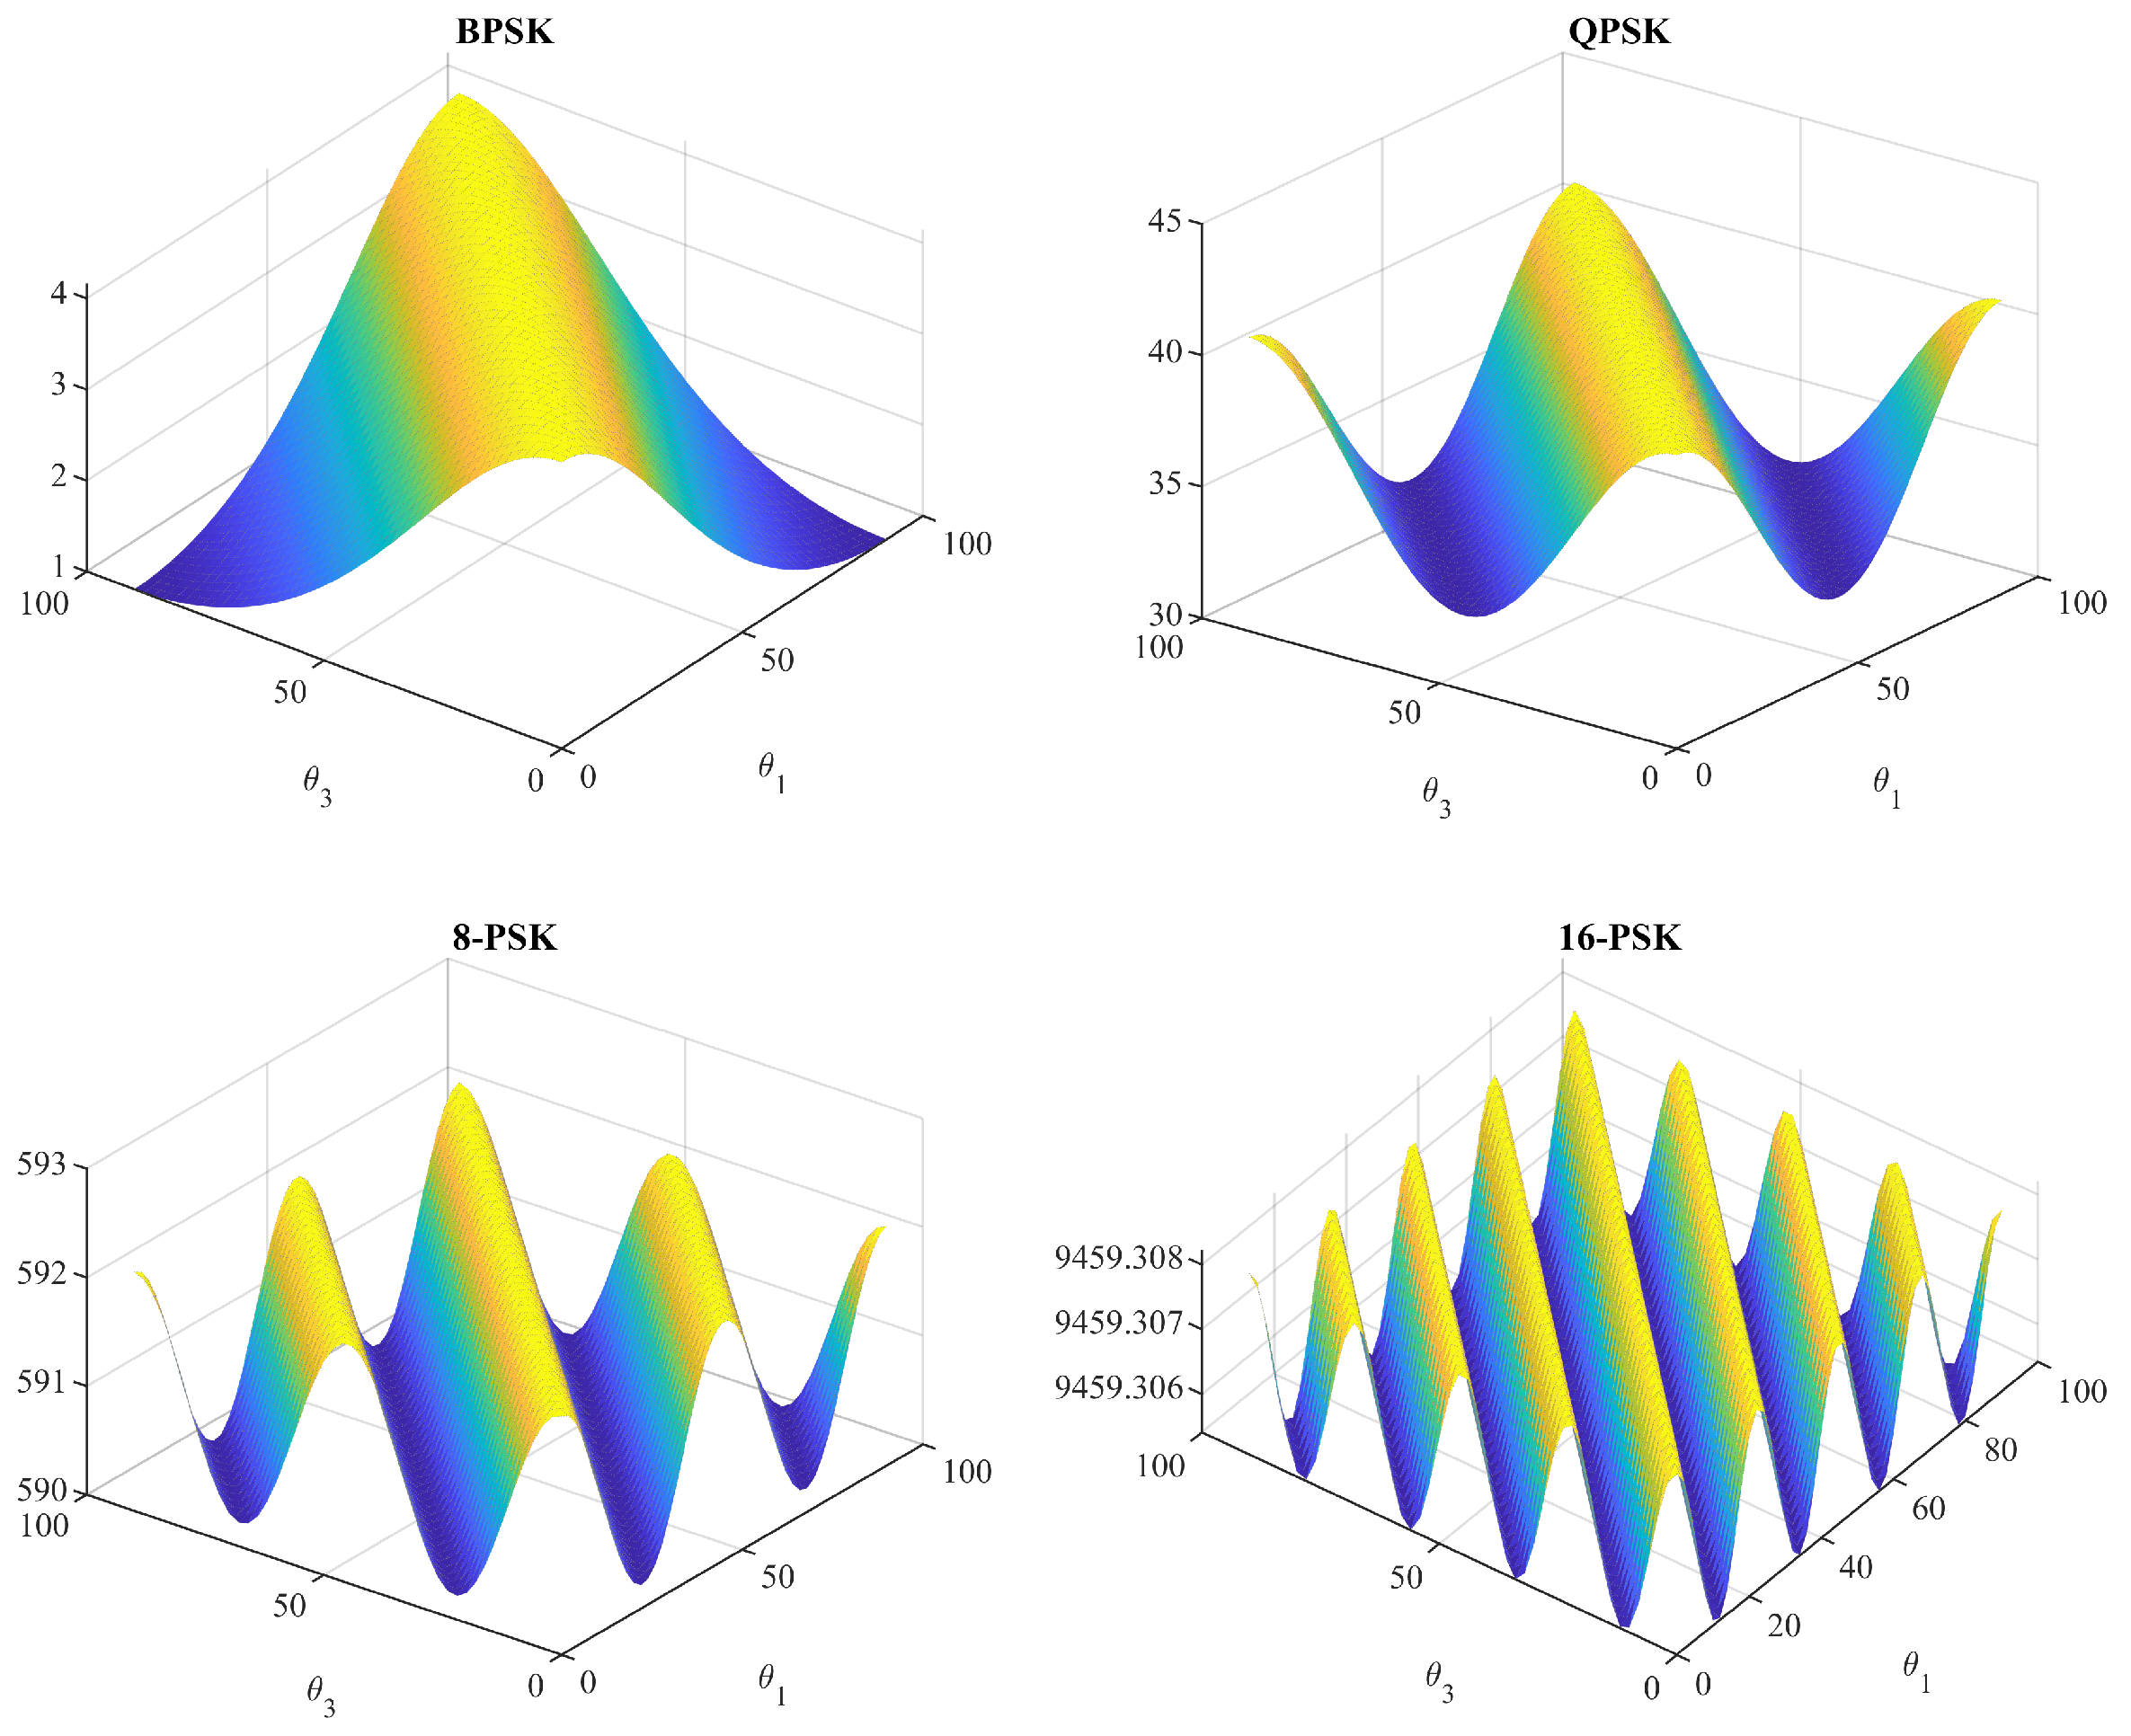
To verify the formula in (
22), a three-dimensional graph is generated for four different PSK modulation schemes and illustrated in
Figure 1. The value of the cost function depends on the difference between the angles rather than on individual values. As presented in
Figure 1, we can conclude that the difference in the value of the cost function in (
21) using the optimal angles and non-optimal angles vanishes as the modulation order increases.
Table 2 depicts the minimum value of the cost function when the optimal angles are used and the maximum value of the cost function assuming
,
for several modulation schemes. The cost values are obtained using (21) by substituting the corresponding values of the rotation angles. For modulation orders 16 or higher, the value of the cost function becomes independent of the rotation angles. As shown in
Figure 1, the change in the function’s value (y-axis value) is marginal for the case of 16-PSK.
The error performance of the MA-SM, assuming the whole set of
terms, is considered and analyzed using PSK modulation.
is simplified as follows:
Figure 2 depicts the weighted values of
, weighted by their corresponding frequency
f, on the left
y-axis and the value of
weighted by
on the right
y-axis. The
x-axis represents the iteration number of the optimization process given in (
21). The 8-PSK modulation is used for the generation of both graphs. The number of receive antennas is equal to 3 and 5 in the left and right sub-figure, respectively. Based on (
13), the upper bound on the pairwise error probability depends on the weighted sum of the six
terms. When the optimization algorithm converges to the optimal solution for
,
is about 6094 (
=4,
, from (
15)) and
(
and
, from (
23)), and the sum of the terms that depend on the rotation angles is about 1180. Note that the values of
are obtained by substituting the values of the optimal rotation angles in (
15)–(
20) for any modulation set. Therefore, the error probability will be dominated by the terms that do not depend on the rotation angles. Further dominance is remarked as
increases, where
From the previous analysis and for
, we conclude that:
For a given modulation order, the effect of the rotation angle on the upper bound on the pairwise error probability vanishes as increases.
For a given , the effect of the rotation angle on the upper bound on the pairwise error probability vanishes as the modulation order increases.
It is therefore expected that the change in the rotation angles would have minimal impact, if any, on the error performance of the MA-SM system. The error performance is verified in
Section 5 using simulations.
The optimization of the rotation angles is analyzed for the case when both signal symbols are drawn from the same L-QAM constellation with
. Based on the result of the optimization process, the optimal rotation angle is given as:
Equation (
22) is satisfied only for
= 2 or 3. For
= 4 and 6, we remarked that
leads to a better performance than values in (
22). Several other sets of angles that are not symmetric achieve similar performances.
Figure 3 depicts the weighted
terms that depend on the rotation angles on the left y-axis, and the weighted
on the right
y-axis, versus the iteration number of the multi-objective optimization process. The value of
is neglected as it is much smaller than
. For instance,
approximately equals 72 for 64-QAM. Based on the depicted graphs, we can draw the same conclusion of PSK modulation that the error probability will be dominated by the terms that do not depend on the rotation angles. Therefore, the rotation angles would have negligible effect on the error performance.
Table 3 presents a comparison between the value of the cost function in (
21) using the optimal rotation angles suggested in [
20] and the conventional system without rotation for 16 and 64-QAM schemes. For both scenarios, the optimal rotation angles minimize the cost function.
4.3. Analysis of the MA-SM Performance for Configuration III
Based on the last configuration in
Table 1, the size of the set
is equal to 8. Therefore, there are 64 codeword error events. The event
, where the spatial symbol is received without error, is repeated eight times. This leads to a single
term, denoted by
in
Table 4. Note that
is the only term that does not depend on the rotation angles. Also, since the probability of the error event
is equal to
, there are 28 other
terms, each is repeated twice. Out of the 28 terms, 19 have a similar form to
, where there are two terms of the squared Euclidean distance between two rotated signal symbols and two power terms of a signal symbol. The remaining nine terms include a single term of the squared Euclidean distance between two rotated signal symbols and four power terms, as in
.
Table 4 gives a partial list of the
expressions.
In
Table 4, the term with more occurrences of the rotation angles has more impact on the end result of the optimization process. For instance,
is a function of only two rotation angles each with a single frequency. On the other hand,
is a function of
and
, where each angle occurred twice. We can therefore conclude that
has more impact on the obtained optimal rotation angle that does
.
Table 5 shows the obtained optimal rotation angles for QPSK and 16-QAM and several values of receive antennas. The values of the cost function (the sum term in (
13) with
,
, and
, for
i = 2,⋯, 29) is also included using the optimal angles, the angles given in [
20] and the all-zero angles. In all scenarios, the optimal rotation angles derived in this paper reduced the values of the cost function. We remarked that several sets of rotation angles produce almost the same value of the multi-objective cost function.
Table 5 lists a single example. Unlike in the case of configuration I and II, it is difficult to obtain a closed-form expression for the rotation angles.


