Abstract
The accumulation of organochlorines (OCs) in mussel tissue depends on the physiological and biochemical status of the organism and its interaction with the environment. Mytilus galloprovincialis, 2- and 1-year-old mussels, sampled from Mali Ston Bay, a reference area, and transplanted to Kaštela Bay in cages, were used for the assessment of OC levels and influence of biological parameters on accumulation. Results of bimonthly exposures during one year highlighted that OC accumulation decreases with increasing mussel age. Polychlorinated biphenyls (PCBs) and p,p′-dichlorodiphenyltrichloroethane (p,p′-DDTs) increased, while organochlorine pesticide (OCP; i.e., HCB, lindane, heptachlor, and aldrin) variations were very low. Statistical analysis generally did not confirm the significant effect of lipid content on the accumulation of OCs in mussel tissue. OC levels in mussels were below the maximum permitted levels for human consumption (European Commission).
1. Introduction
The most environmentally widespread organic contaminants, persistent organic pollutants (POPs), are polychlorinated biphenyls (PCBs) and organochlorine pesticides (OCPs). They are resistant to degradation and their toxic properties may result in serious consequences for the environment and human health. Coastal areas are particularly exposed to these chemicals of anthropogenic origin, mainly from direct industrial and urban wastewater discharges, runoffs from agricultural, watershed areas, and rivers, and the atmosphere [1,2,3,4,5].
Kaštela Bay has been recognized as a pollution hotspot in the middle eastern Adriatic coast [6,7,8]. It has been endangered by the fast population growth, industry traffic, and trade development since the 1950s. Results of the analysis of a long-term data series of dissolved oxygen, nutrients, transparency, and phytoplankton have shown a continuous increase of eutrophication in the Bay [9].
The bivalve genus Mytilus has been extensively used as a suitable indicator of contamination for marine environments because of their sessile life, filter-feeding activity, and low metabolic capacity for contaminant degradation,which leads to accumulation of contaminants in the mussel tissue and contributes to the identification of spatial and temporal trends in coastal pollution [3,10,11,12].
OC accumulation in mussel tissue depends on the physiological and biochemical status of the organism and its interaction with the environment.
Studies on the accumulation of OCs in mussel tissue associated with mussel age have been conducted in relation to body size and lipid content on the bioaccumulation of PCBs in zebra mussels, Dreissena polymorpha [13], age- and size-dependent changes in parameters of energy metabolism in wild mussels Mytilus edulis (L.) from the White Sea [14], and the influence of confounding biological factors when estimating bioaccumulation of PCBs with passive samplers in aquatic ecosystems [15]. Small mussels (15 mm shell length) had higher bioconcentration factors and faster uptake kinetics for PCBs and polycyclic aromatic hydrocarbon congeners compared to larger (21 mm shell length) mussels. Also, high lipid, pre-spawning mussels had greater bioconcentration factors and faster uptake kinetics for the highly hydrophobic compounds than low lipid, post-spawning mussels [13]. Sukhotin and Pörtner [14] showed significantly lower growth rates and feeding rates associated with the aging process. The effects of age and size on the bioaccumulation of PCBs in mussels were documented by Figueiredo et al. [15], showing that the concentration of PCBs in mussel tissues decreases with size and age.
The effect of biological factors on the accumulation of OCs in mussels has also been investigated in relation to lipid content and condition index observed OCP levels in Ensis siliqua [16]; specimen size (2.5–3.5 cm in shell length) and contaminant levels and profiles in caged mussels Mytilus trossulus, translocated in cages in a southern Baltic Sea coastal area of Poland [10]; mussels at different reproductive stages and nutritive states [17], and physiological conditions [18]. Assessment of the relationship between the age (size) of mussels and OC accumulation is limited to the area of the Adriatic Sea.
The aim of this study is to investigate the effect of mussel age dependence on biological parameters (shell length, soft tissue, condition index (CI) and lipid content) on OC accumulation by applying the mussels’ transplantation technique from a reference station (Mali Ston Bay) to Kaštela Bay. The assessment of contaminant accumulation was based on bimonthly exposure of 1- and 2-year-old mussels for one year. The 1- and 2-year-old mussels responded quickly to the changes in the environment after transplantation from the reference station (Mali Ston Bay) to Kaštela Bay, with the OC accumulation trend being inversely proportional to the age of mussels.
2. Materials and Methods
2.1. Biomonitoring and Sample Preparation
Two groups of mussels Mytilus galloprovincialis (1-year-old and 2-years-old) were sampled bimonthly from Mali Ston Bay (S0), a shellfish breeding farm, and transplanted to Kaštela Bay into four experimental stations, S1–S4 (Figure 1). The experiments were designed: 1-year-old mussels measuring 4.9 ± 0.1 cm and 2-year-old mussels measuring 6.3 ± 0.3 cm were placed separately in 10 round-type net-like baskets (diameter = 40 cm, height = 10 cm), with 50 specimens/basket. Baskets with 1-year old mussels were hung on oneside of the rope, attached to buoys, and baskets with 2-year-old mussels were hung on the other side of the rope. The baskets were placed 1.5–2 m above the sea bottom, and the system was anchored to the bottom by means of ballast weight, positioned at 50–400 m from the coast, with the water depth of 10 m at the selected stations.
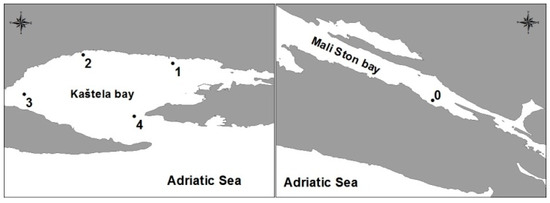
Figure 1.
Kaštela Bay and Mali Ston Bay—the studied stations.
The sampled mussels were transferred to a laboratory in live conditions and placed in 10 L of seawater (previously filtered through 0.45 μm and aerated) for 24 h in order to clear the gut contents. For chemical analysis, 20 specimens were used, previously depurated with removed befouling and byssus threads, and shell length was measured. The soft tissue was weighed and stored at −20 °C in hexane-clean Al foil, and lyophilized. A stainless steel blender was used for the lyophilized sample homogenization and powdering. The CI was calculated from the dry tissue weight and shell length ratio, using the formula CI = soft tissue dry weight (g)/shell length (cm).
2.2. Analysis
2.2.1. Standards and Reagents
Dichloromethane, n-hexane, sulfuric acid (96%), florisil® (0.15–0.25 mm), and anhydrous sodium sulfate were purchased from Merck (Darmstadt, Germany). Standard solutions of HCB, lindane, heptachlor, aldrin, p,p′-dichlorodiphenyldichloroethylene (p,p′-DDE), p,p′-dichlorodiphenyldichloroethane (p,p′-DDD), p,p′-dichlorodiphenyltrichloroethane (p,p′-DDT), and PCB congeners (IUPAC nos. 28, 52, 101, 105, 118, 138, 153, 156, 180, and 194), as well as ε-HCH and PCB-29, were purchased from DrEhrenstorfer GmbH (Augsburg, Germany).
2.2.2. OCs—Extraction and Determination
Briefly, 5 g of freeze-dried sample was extracted after 8h with 240 mL of n-hexane (Soxhlet apparatus) [19]. The extract was evaporated under a gentle stream of nitrogen up to 10 mL. A 10-µL extract aliquot was used for the gravimetric determination of n-hexane-extractable organic matter (EOM). Lipids from the residuary extract were removed using concentrated sulfuric acid and centrifuged. The recovered n-hexane was concentrated up to 1 mL. Using a column chromatography on florisil (0.5% deactivated with distilled water), the two fractions (CPs and PCBs) were separated. The fraction with HCB, heptachlor, aldrin, p,p′-DDE, and PCB congeners was eluted with n-hexane, and the second fraction with lindane, p,p′-DDT, and p,p′-DDD was eluted with n-hexane/dichloromethane (70:30). By rotary evaporation, both fractions were concentrated, followed by a gentle stream of nitrogen up to 1 mL.
Gas chromatography (Agilent Technologies, model 6890N) with a 63Ni electron capture detector (µc-ECD) was used for the final extract analysis. A fused silica HP-5 capillary column (J&W Scientific: 30 m × 0.32 mm × 0.25 µm) was used for the separation. A splitless mode was applied: injection 1 µL and a splitter closing time of 0.8 min. The regime of the oven temperature program was the following: 70 °C/2 min to 260 °C at 3 °C min−1, and then held for 25 min. The temperature of the injector was 250 °C and the temperature of the detector was 300 °C. The carrier (1 mL min−1) and a make-up (60 mL min−1) gas was nitrogen (purity: 5.0 for ECD). By comparing with external standards, the qualitative and quantitative analysis of OCs was performed.
2.2.3. Quality Assurance and Quality Control
Quality assurance and quality control were performed through the use of certified reference materials and the analysis of procedural blanks. Procedural blanks were measured with each batch of 5 samples to ensure that the analytical system was free of contaminants. Before extraction, PCB-29 and ε-HCH (internal standards) were added to each sample in order to control the recovery efficiency of the overall analytical procedure. The recoveries amounted to 83.3% ± 8.1% and 80.5% ± 7.8% for PCB-29 and ε-HCH, respectively. The results (samples analyzed in duplicate) were expressed in ng g−1 on a dry weight basis (dw). A check of analytical method accuracy was performed by a run of the reference material (IAEA-432) every two-sample set. Analytically determined values of investigated OCs lay within the 95% confidence interval of the assigned reference values. The performance of the analytical method was assessed through participation in interlaboratory studies organized by the International Atomic Energy Agency-Marine Environment Laboratory. The method detection limit (MDL) was 0.05–0.09 and 0.12 ng g−1dw for chlorinated pesticides and PCBs, respectively.
2.2.4. Statistical Analysis
Software package Statistica v.7.0 (StatSoft Inc., Tulsa, OK, USA) was used for statistical data analysis. “Not detected” concentration of contaminant was assigned as half of the detection limit. The Kolmogorov–Smirnov test was used for the data check for normal distribution. The data were log-transformed prior to analysis in the case when the data did not meet the assumptions of the test. Differences in variables between sites, seasons, and mussel age were evaluated by ANOVA, one-way analysis of variance. Posthoc comparisons between sites, seasons, and mussel age were assessed by Tukey’s test when ANOVA F-test was significant (p < 0.05). The possible existence and strength of relationships between biological and chemical parameters were checked with Pearson’s product-moment coefficient.
3. Results
3.1. Temperature, Salinity, Oxygen Saturation
Sea surface temperature in Kaštela Bay at S1–S4 (Figure 1) varied between 7.84 and 25.54 °C, and the bottom layer temperature varied between 10.33 and 25.26 °C. The highest temperature variations were at S1, due to a more stratified area compared to central and western areas, with a lower sea circulation [20]. Salinity values in the surface layer fluctuated from 32.4 to 37.6 psu, with the maximum value in the summer and minimum in the winter due to Jadro River’s freshwater inflow, land vicinity, and the specific dynamic properties of the Bay [20]. The salinity in the bottom layer was 34.7–38.33 psu. The lowest variations were recorded at S4, located at the Bay entrance, with the highest values recorded at S2, followed by S1 and S3. Oversaturation observed in the surface layer indicated the prevalence of primary production over the decomposition of organic matter that mostly occurred in the summer, reflecting the anthropogenic influence in Kaštela Bay.
3.2. Biological Parameters
Biological parameters (shell length, tissue weight, lipid content—EOM and CI) in 1- and 2-year-old mussels monitored over one year, from Mali Ston Bay, and the ones transplanted to KaštelaBay, are presented as temporal and spatial variations in Figure 2.
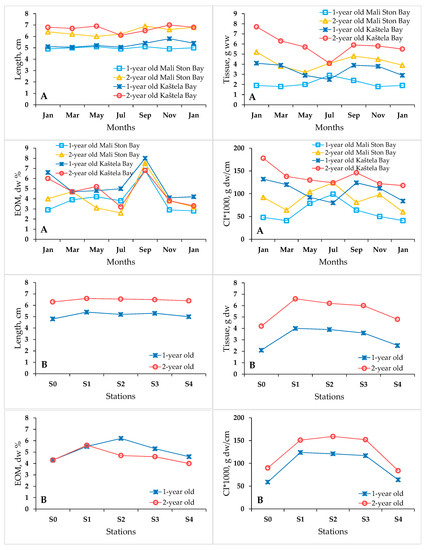
Figure 2.
Biological parameters (shell length, tissue weight, lipid content— extractable organic matter (EOM) and condition index (CI)), in 1- and 2-year-old mussels from Mali Ston Bay and the ones transplanted to Kaštela Bay. A—temporal variations; B—spatial variations.
The shell length in Kaštela Bay ranged from 4.9 to 5.9 cm for 1-year-old mussels (coefficient of variation, CV = 4.58%) and 6.1 to 7.1 cm for 2-year-old mussels (CV = 4.04%), and soft tissue weight varied from 1.75 to 5.42 g for 1-year-old mussels (CV = 28.64%) and 3.39 to 8.73 g for 2-year-old mussels (CV = 24.68%). In Mali Ston Bay, the shell length ranged from 4.7 to 5.1 cm for 1-year-old mussels (CV = 2.75%) and 6.0 to 6.8 cm for 2-year-old mussels (CV = 4.06%), and soft tissue weight varied from 1.71 to 2.93 g for 1-year-old mussels (CV = 18.51%) and 3.42 g to 5.32 g for 2-year-old mussels (CV = 15.4%). The CI gives information on somatic growth and induced reproductive cycle. CI was in range from 49.46 to 185.54 g cm−1dw (CV = 38.18%; Kaštela Bay) and from 41.14 to 96.53 g cm−1dw (CV = 32.4%; Mali Ston Bay) for 1-year-old mussels and 57.96 to 255.17 g cm−1dw (CV = 35.26%; Kaštela Bay) and 66.32 to 125.87 g cm−1dw (CV = 22.9%; Mali Ston Bay) for 2-year-old mussels. The lipid content (EOM) in 1-year-old mussels from Kaštela Bay ranged from 3.04% to 10.45% dw (CV = 33.38%), and from Mali Ston Bay, from 3.02 to 6.73% dw (CV = 32.0%), while in 2-year-old mussels, the lipid content was from 2.33% to 9.44% dw (CV = 35.42%; Kaštela Bay) and 2.65% to 7.46% dw (CV = 36.1%; Mali Ston Bay) (Figure 2). According to Bruner et al. [13], the decrease of lipid content is related to the spawning of mussels. In this study, EOM declines observed after maximum values indicate that the spawning of mussels presumably occurs in Kaštela Bay two times a year, in late May with a smaller intensity and in late September with a higher intensity. A similar EOM pattern was observed for mussels from Mali Ston Bay. Spatial variations revealed a decreasing trend in the average values of the biological parameters as S1 > S2 > S3 > S4 for both 1- and 2-year-old mussels, which is in accordance with prevailing hydrodynamic cycling and environmental conditions (Figure 2).
3.3. OC Accumulation
Results in Figure 3 present temporal variations of PCBs, p,p′-DDTs, and OCPs in 1- and 2-year old mussels in Mali Ston Bay and the ones transplanted to Kaštela Bay. PCBs are presented as the sum of ten PCB congeners (CB 28, 52, 101, 105, 118, 138, 153, 156, 180, 194), p,p′-DDTs are presented as the sum of p,p′-DDE, p,p′-DDT, and p,p′-DDD (ΣDDE, DDD and DDT), and OCPs are presented as the sum of HCB, lindane, heptachlor, and aldrin.
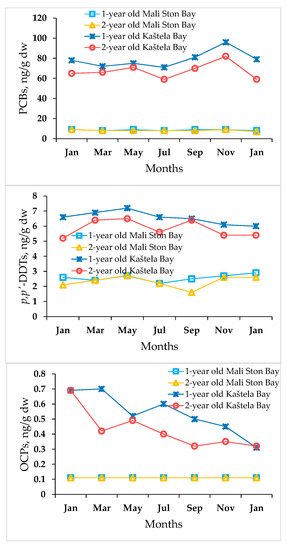
Figure 3.
Polychlorinated biphenyls (PCBs), p,p′-dichlorodiphenyltrichloroethane (p,p′-DDTs) and organochlorine pesticides (OCPs) in 1- and 2-year-old mussels in Mali Ston Bay and the ones transplanted to Kaštela Bay, expressed as temporal variations.
In Kaštela Bay, the concentrations of p,p′-DDTs in 1- and 2-year-old mussels were higher than of other chlorinated pesticides analyzed. In overall, p,p′-DDTs varied from 4.37 to 9.06 ng g−1dw (CV = 22.9%) in 1-year-old mussels and from 4.47 to 8.90 ng g−1dw (CV = 19.9%) in 2-year-old mussels. The same range of HCB content (<MDL-0.38 ng g−1dw) was observed for both 1- and 2-year-old mussels, revealing higher variations in 1-year-old mussels (CV = 81.9%) than 2-year-old mussels (64.4%). The concentrations of lindane ranged from <MDL to 0.41 ng g−1dw (CV = 80%) in 1-year-old mussels and <MDL to 0.22 ng g−1dw (CV = 71.6%) in 2-year-old mussels. Heptachlor content varied from <MDL to 0.43 ng g−1dw in 1-year-old mussels and <MDL to 0.38 ng g−1dw in 2-year-old mussels, showing variations of 75.5% and 91.0%, respectively. Aldrin concentrations varied from <MDL to 0.37 ng g−1dw in 1-year-old mussels and <MDL to 0.52 ng g−1dw in 2-year-old mussels, with CV = 72.2% and 99.5%, respectively (Figure 3).
In Mali Ston Bay, the concentration of p,p′-DDTs in 1- and 2-year-old mussels varied from 2.2 to 2.9 ng g−1dw (CV = 9.76%) in 1-year-old mussels and from 1.63 to 2.69 ng g−1dw (CV = 15.8%) in 2-year-old mussels. Individually, DDE content varied in the narrow range from 1.37 to 1.76 ng g−1dw (CV = 10.5%) in 1-year-old mussels and from 1.01 to 1.91 ng g−1dw (CV = 21.5%) in 2-year-old mussels. DDD content varied from 0.32 to 0.80 ng g−1dw (CV = 35.0%) in 1-year-old mussels and 0.36 to 0.60 ng g−1dw (CV = 18.9%) in 2-year-old mussels. Regarding DDT content, it ranged similarly from 0.19 to 0.82 ng g−1dw (CV = 41.8%) in 1-year-old mussels and 0.19 to 0.69 ng g−1dw (CV = 45.0%) in 2-year-old mussels. The concentrations of PCBs varied similarly in the narrow range from 6.92 to 8.02 ng g−1dw (CV = 6.15%) in 1-year-old mussels and 5.5 to 8.14 ng g−1dw (CV = 6.65%) in 2-year-old mussels (Figure 3).
Bimonthly monitoring of OCs among S1–S4 at Kaštela Bay in transplanted 1- and 2-year-old mussels is shown in Figure 4.
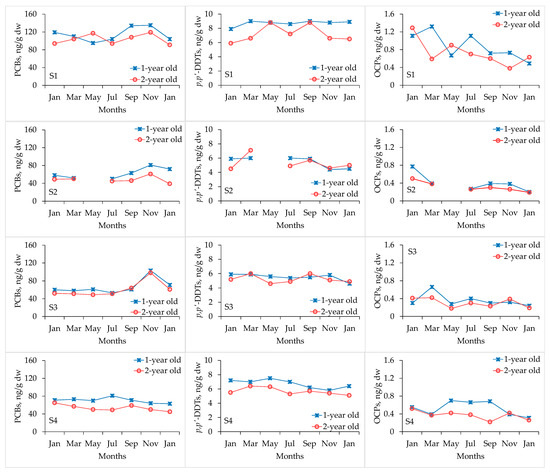
Figure 4.
Variation of organochlorine pesticides (OCPs), p,p′-dichlorodiphenyltrichloroethane (p,p′-DDTs (ΣDDE, DDD, and DDT)), and polychlorinated biphenyls (PCBs) during bimonthly exposure of transplanted mussels to Kaštela Bay as spatial and temporal accumulation. Mussels set at S2 were not found in May.
Spatial distribution pointed to some differences in the accumulation of p,p′-DDTs (Figure 4). DDTs average content prevailed at S1 in comparison to other stations, both in 1-year-old (8.8 ng g−1dw) and 2-year-old (7.2 ng g−1dw) mussels. It was to be expected because S1 is directly influenced by the Jadro River and the inflow of contaminants through wastewater discharges and agricultural activities in the past in the eastern part of the Bay. At other stations, average p,p′-DDTs concentrations in 1-year-old mussels were almost similar, revealing a decreasing order of S4 (6.8 ng g−1dw), S3 (5.4 ng g−1dw), and S2 (5.4 ng g−1dw). In 2-year-old mussels, a similar decreasing order S4 (5.7 ng g−1dw), S3 (5.2 ng g−1dw), and S2 (5.2 ng g−1dw) was observed. Individually, DDE content varied from 2.33 to 5.77 ng g−1dw (CV = 28.2%) in 1-year-old mussels and from 1.32 to 5.05 ng g−1dw (CV = 23%) in 2-year-old mussels. DDD varied from 0.61 to 2.34 ng g−1dw (CV = 29.6%) in 1-year-old mussels and 0.84 to 3.01 ng g−1dw (CV = 36.1%) in 2-year-old mussels. The concentrations of PCBs varied from 51.48 to 136.6 ng g−1dw (CV = 31.9%) in 1-year-old mussels and 39.14 to 118.4 ng g−1dw (CV = 37.1%) in 2-year-old mussels. Average PCB concentration was undoubtedly the highest at S1, both in 1-year-old (114.8 ng g−1dw) and 2-year-old (102.8 ng g−1dw) mussels. The level of PCBs at other stations decreased in the order of S4 (69.5 ng g−1dw) > S3 (65.9 ng g−1dw) > S2 (64.3 ng g−1dw) in 1-year-old mussels and S3 (60.0 ng g−1dw) > S4 (52.7 ng g−1dw) > S2 (49.1 ng g−1dw) in 2-year-old mussels, depending on the environmental conditions in the Bay (Figure 4).
Bimonthly transplanted Mytilus galloprovincialis mussels from Mali Ston Bay to Kaštela Bay responded quickly to changes in environmental conditions, resulting in an average 10.7-fold increase of PCBs and a 2.57-fold increase of p,p′-DDTs in 1-year-old mussels and an average 10.51-fold increase of PCBs and a 2.55-fold increase of p,p′-DDTs in 2-year-old mussels in relation to the initial values of the reference station. The intensity of changes was negligible for OCPs in both 1- and 2-year-old mussels from Kaštela Bay (Figure 3 and Figure 4).
The accumulation pattern of chlorinated biphenyl (CB) congeners, CBs homologs, and chlorinated pesticides in 1- and 2-year-old mussels from Mali Ston Bay and the ones transplanted to Kaštela Bay is presented in Figure 5.
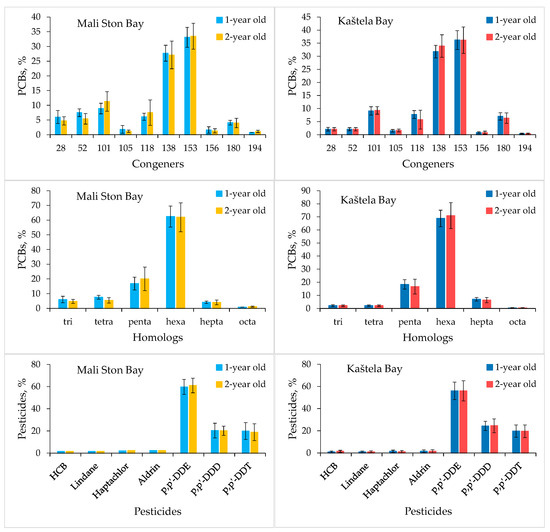
Figure 5.
Accumulation pattern of chlorinated biphenyl CB congeners, CB homologs, and chlorinated pesticides in 1- and 2-year-old mussels from Mali Ston Bay and the mussels transplanted to Kaštela Bay.
The individual contribution of chlorinated pesticides relative to the total contamination by pesticides is almost the same between Kaštela Bay and Mali Ston Bay, showing no significant differences in relation to the age of the mussels. An overview of individual CB congeners in relation to total PCBs accumulated in 1- and 2-year-old mussels showed an average predominance of CB 153 and CB 138. CB homologs revealed the major average accumulation of hexachlorinated and pentachlorinated congeners in both 1- and 2-year-old mussels (Figure 5).
The mussels’ biometric parameters varied depending on age (size), station, and season (Table 1 and Table 2).

Table 1.
One-way ANOVA analysis of biological parameters and OC content in mussels in relation to seasonal, spatial, and age accumulation in Kaštela Bay and Mali Ston Bay. * Significant at p < 0.05.
Table 2.
Pearson’s product-moment correlation coefficients between biological parameters and OC content in 1- and 2-year-old mussels in Mali Ston Bay and the ones transplanted to Kaštela Bay. * Significant at p < 0.05.
With regard to mussel age in Mali Ston Bay, one-way ANOVA analysis indicated significant (p < 0.05) differences in tissue weight (p = 0.000 *), length (p = 0.000 *), and CI (p = 0.014 *) but no significant difference in EOM content (p = 0.970). Temporally, ANOVA analysis revealed significant differences only in EOM (p = 0.015 *; Table 1). Statistically, a positive relation was observed in 1-year-old mussels for biological parameters, revealing a significant relationship between tissue weight and CI (r = 0.949 *). Regarding the 2-year-old mussels, CI showed low negative relationship with length (r = −0.246) and a high negative relationship with EOM content (r = −0.746; Table 2) that may be primarily associated with the quality of environmental conditions in Mali Ston Bay and mussel reproductive status.
In Kaštela Bay, with regard to mussel age, one-way ANOVA analysis (Table 1) indicated significant (p < 0.05) differences in tissue weight (p = 0.016 *), length (p = 0.000 *), and CI (p = 0.000 *), but no significant difference in EOM content (p = 0.108). Nevertheless, tissue weight (p = 0.894), shell length (p = 0.680), and CI (p = 0.201) showed no significant temporal variations except EOM content (p = 0.000 *). Spatial variation of tissue weight showed significant differences in tissue weight (p = 0.023 *) between S1 and S4. Moreover, significant differences were observed as well for CI (p = 0.000 *) between S1_S4, S2_S4, and S3_S4. No significant variations were observed for the shell length (p = 0.894) and EOM content (p = 0.218) (Table 1). Statistically, shell length was significantly related to tissue weight (r = 0.509 *) and CI (r = 0.386 *) but not to EOM content (r = −0.026) regarding 1-year-old mussels (Table 2). Moreover, tissue weight was highly related to CI (r = 0.949 *) and moderately to EOM content (r = 0.489 *). Furthermore, CI and EOM were positively correlated (r = 0.465 *), which could be primarily attributed to mussel reproductive stages and quality of food sources and environmental conditions [17,21,22]. Regarding 2-year-old mussels, tissue weight was significantly related to shell length (r = 0.617 *) and CI (r = 0.816 *), while CI was related to EOM content (r = 0.552 *) (Table 2).
4. Discussion
4.1. Accumulation of OCs
A similar finding to our results was observed by Ueno et al. [23], who reported 9.27- and 6.1-fold increases of PCBs and 14.6- and 2.08-fold increases of p,p′-DDTs in blue mussels during an 8-week exposure in two different bays. Translocation of mussels Mytilus trossulus to the Gulf of Gdańsk revealed up to a 2-fold increase of PCB7, DDT, and its derivatives levels during an 8-week period [10]. Bimonthly accumulation of target contaminants in this study, according to one-way ANOVA analysis (p < 0.05), indicated mostly no significant temporal differences in tissue levels of 1- and 2-year-old mussels except for lindane (p = 0.000 *), heptachlor (p = 0.041 *), p,p′-DDT (p = 0.022 *), CB 28 (p = 0.001 *), CB 105 (p = 0.009 *), and CB 180 (p = 0.015 *) (Table 1). Seasonal variations of contaminants in mussel tissue most likely originate from variability in environmental parameters such as temperature and food availability [24,25]. Another source of contaminants for biota could be sediment and its resuspension [1,10], which is controlled by the prevailing circulation in the Bay, mainly induced by wind [20]. OC concentration in mussels sampled from Kaštela Bay was mostly positively related to shell length both for 1- and 2-year-old mussels. Regarding shell length, 1-year-old mussels revealed significant relationships with CB 101, CB 138, CB 153, CB 180, and CB 194, while 2-year-old mussels had a significant relationship only with CB 180, showing a poor relationship with chlorinated pesticides. The majority of OCs were positively related to the tissue weight of 1- and 2-year old mussels, pointing to a significant correlation with HCB, CB 118, and CB 180 in 2-year-old mussels. Moreover, there was a significant relationship between temporal variations of CI and lipid content, both for 1-year-old (r = 0.465 *) and 2-year-old (r = 0.552 *) mussels. Concerning seasonal changes of CI and lipid content in relation to seasonal changes of chlorinated hydrocarbon contents in mussel tissue, no correlation of their changes was established for the 1-year-old species. Regarding the 2-year-old species, a significant relationship was observed between CI and congener CB 118 (r = 0.703 *) and CB 156 (r = 0.482 *). Moreover, concentrations of p,p′-DDE, CB 28, CB 52, and CB 105 in the tissue of the 2-year-old species increased significantly with EOM content increase (Table 2).
A lack of apparent statistical correlations among biological parameters and contaminant concentrations in this research can be attributed to the selection of the initial species, regarding the age and size of mussels. The significance of the biological parameters’ influence differs depending on the sampling location and its contamination level [12,21,26,27,28]. In the case of the shallow Kaštela Bay, the effect of environmental factors may prevail over the effect of biological factors that change over a longer time scale. This particularly refers to the changes in chlorinated hydrocarbon bioavailability in the Bay. As mussels are fed by the continual filtering of seawater, the gills have a key role in ensuring a constant supply of nutrients. The intake of chlorinated hydrocarbons from suspended organic matter is much more important than direct uptake from water since the amount of lipophilic contaminants in the soluble phase of seawater is very low [18]. One-way ANOVA analysis and posthoc Tukey’s test suggest significant spatial differences in OC accumulation in mussels between study areas (Table 1). The levels of CPs and PCBs were the highest at S1 due to intensive contaminant inputs by industrial and urban wastewaters, biological activity, and sediment resuspension in that area. The intensity of environmental parameters at other stations was lower, mostly revealing a decreasing counterclockwise direction influenced by wind-induced circulation in the Bay [20]. Concentrations of OCPs presented as the sum of HCB, lindane, heptachlor, and aldrin were in the order of S1 > S4 > S2 > S3, as well as of p,p′-DDTs. However, PCB concentrations revealed a somewhat different decreasing trend in the order of S1 > S3 > S4 > S2 (2-year-old mussels) and S1 > S4 > S3 > S2 (1-year-old mussels) as a result of the prevailing water circulation in the Bay during the experimental period. Overall, the spatial distribution of PCB content in mussels points to higher levels of PCBs than chlorinated pesticides (Figure 4).
4.2. OC Accumulation in Relation to Biological Parameters
The accumulation of OCs in mussels depends on the complex interaction between the environment and the organism. Physiological parameters such as size, age, and lipid content and its composition may influence contaminant accumulation in mussels [10,13,14,15,16,17,18], while the contaminant content in soft mussel tissue depends, to a large extent, on their concentration in the water [15,18].
Pearson analysis (Table 2) confirmed that accumulation of OCs in mussels decreases with age by revealing a relationship between the age of the mussels and OCPs, p,p′-DDTs, and PCBs, as well as ANOVA analysis (Table 1) showing significant differences in tissue levels of p,p′-DDTs (p = 0.039 *) and PCBs (p = 0.037 *) between 1- and 2-year-old mussels, except for OCPs levels (p = 0.085). Somatic growth (CI) increased 1.85- and 1.56-fold, respectively, in 1- and 2-year-old mussels transplanted to Kaštela Bay, and 1.07- and 1.11-fold in Mali Ston Bay, respectively (Figure 2). Pearson analysis also showed a relationship between CI and OC content in 1-year-old (1-ym) and 2-year-old (2-ym) mussels, with values of OCPs: r1-ym = 0.159 and r2-ym= 0.119; p,p′-DDTs: r1-ym = 0.127 and r2-ym = 0.048; PCBs: r1-ym= 0.198 and r2-ym = 0.214 (Table 2).
It is quite certain that the main reason for contaminants decreasing with mussel age is related to the metabolism and physiology of the mussels [13,14,15]. Since large and aged mussels tended to pump less water through their body per body unit, the intake of contaminants is lower than in smaller species, due to their faster growth rate. Respiration rate and other physiological parameters (ingestion rate, filtration rate, excretion rate, and others) depend strongly on body size [22,26].
Results in this study are in accordance with the results from other studies investigating the effect of age (body size) on the accumulation of organic lipophilic compounds in mussels [13,14,15]. Contrarily, the increase of PCB content in mussels with increased body size was reported by Grilo et al. [29] in bivalve Scrobiscularia plana and Schäfer et al. [30] in Dreissena polymorpha and D. bugensis.
Variations of PCB content in mussels are often explained by differences in lipid content [12,30,31]. Lipids in mussels are the primary sites where chlorinated hydrocarbons are stored. Seasonal changes in OC content in mussel tissues are considered to be attributed to specific metabolic processes of storing and mobilizing lipid reserves during the reproductive cycle (gametogenesis, spawning, and dormancy) and changes in the mass of total tissue and organs during the reproductive cycle [32].
In our experiment, the statistical analysis did not generally confirm the significant influence of lipid content on the accumulation of OCs in mussel tissue because mussels of the same size and age were selected. The significant influence of lipids on OCs accumulation was observed for 2-year-old mussels (p < 0.05; OCPs: r = 0.449 *; p,p′-DDTs: r = 0.492 *) but not for PCBs (r = 0.331). For 1-year-old mussels, the relation was rather small (r = −0.065). Lipid content in tissues of 1-year-old mussels during bimonthly exposures increased 1.33-fold, while in 2-year-old mussels, it increased 1.23-fold (Kaštela Bay). In Mali Ston Bay, lipid content increased 1.01-fold and 1.14-fold in 1- and 2-year-old mussels, respectively (Figure 2).
Many environmental parameters may affect the feeding activity of the mussels and their physiology, such as climate change factors (salinity, pH, temperature) [24,33], fluctuations in phytoplankton, algal, and chlorophyll concentration, and phytoplankton species [11,34]. Mussels from the S1 are the best fed because S1 is located at the shallowest part of Kaštela Bay, where the availability of suspended matter rich in organic content is the highest. Although the levels of analyzed contaminants in mussels were most elevated at S1, the differences between the stations in the Bay are far less significant than the differences between Kaštela Bay and Mali Ston Bay (Figure 4).
4.3. OCs—Accumulation Pattern
Unlike DDTs (Kaštela Bay 93.1% and Mali Ston Bay 95.3%), the contribution of HCB, lindane, heptachlor and aldrin in Kaštela Bay is rather low, showing mean values for 1-year-old mussels of 1.63%–2.13% and 2-year-old musselsof 1.93%–1.89% (Figure 5). With regard to p,p′-DDTs compound accumulation patterns in mussels in Kaštela Bay, their average contribution decreases equally in the order of DDE(56.0%) > DDD(24.4%) > DDT(19.6%) for 1- and 2-year-old mussels. No significant difference was observed in relation to mussel age. For Mali Ston Bay, the average contribution of DDE:DDD:DDT was 59.7%:24%:20.3% and 61%:20.1%:18.9% for 1- and 2-year-old mussels, respectively (Figure 5). The prevailed contribution of p,p′-DDE is attributed to its high chemical stability, hydrophobia, long half-life, and persistence in abiotic and biotic aquatic compartments [35]. Similar findings were reported by Ramu et al. [36], but a difference was found in mussels from Korea (29.6%:43%:27.5%) [37].
Predominantly accumulated congeners in Kaštela Bay and Mali Ston Bay were CB 153 and CB 138, due to their ability to attach to particulate matter. In Kaštela Bay, the contribution of the hexachlorinated biphenyls CB 153 was 36.69% of the total in 1-year-old mussels and 36.74% of the total in 2-year-old mussels, and CB 138 was 32.23% of the total in 1-year-old mussels and 34.47% of the total in 2-year-old mussels. The significant prevalence of CBs 138 and 153 has been reported in several bivalves [12,27,38].
Increased contribution of low chlorinated congeners (CB 28 and CB 52) was observed in mussels from the reference location compared to Kaštela Bay (Figure 5). Similar findings were observed by Galvao et al. [27] and Deudero et al. [38].
No significant differences were observed in CB accumulation profiles between young and old mussels. However, CB congeners with more than five chlorine atoms and parachlorine atoms, such as CB 118, CB 138, CB 153, and CB 180, have higher metabolic resistance and their elimination from the organism is much slower, resulting in stronger bioaccumulation than low chlorinated congeners [39]. The predominant groups of PCB congeners accumulated in mussels, grouped by the number of chlorine atoms, were hexa-, followed by penta-, tetra-, tri-, hepta-, and octachlorinated biphenyls for the reference station and penta-, hepta-, tetra-, tri-, and octachlorinated biphenyls in Kaštela Bay, respectively. With regard to mussel age, no significant differences in homolog CB accumulation patterns were evident between 1- and 2-year-old mussels (Figure 5). Our findings are in accordance with Suárez et al. [4].
Regarding human exposure to contaminants, concentrations of chlorinated pesticides and six indicator PCBs expressed on a wet weight basis are much lower than the maximum concentrations set by the European legislation [40,41]. The following values of maximum concentrations of chlorinated pesticides and six indicator PCBs (in ng g−1 wet weight) in the samples from Mali Ston Bay and Kaštela Bay were determined: HCBa 0.06; lindanea 0.07; heptachlora 0.08; aldrina 0.06; DDT3 1.71, and 6PCBs 24.1. The corresponding maximum residue levels (MRL, ng g−1) are HCBa 20; lindanea 2; heptachlora 20; aldrina 20; DDT3 100, and 6PCBs 75. A comparison of chlorinated pesticides such as HCB, lindane, heptachlor, aldrin, DDTs, and PCBs by data obtained in this study for Mali Ston and Kaštela Bay, with levels found in mussels Mytilus galloprovincialis sampled from other regions, showed values usually found in low (Mali Ston Bay) to moderately contaminated (Kaštela Bay) areas of the Mediterranean Sea [26,38].
5. Conclusions
PCBs and DDTs were detected in all samples, which show their persistence in Kaštela Bay. Spatial and temporal variations of biological parameters, lipid contents, and CI revealed similar behavior for 1- and 2-year-old mussels. Among the investigated OCs, PCBs were the most abounded. The PCB profile in mussels from Kaštela Bay was dominated by two hexachlorinated congeners, CB 153 followed by CB 138. The most prevalent p,p′-DDTs was p,p′-DDE. OCPs revealed negligible variations, showing a decreasing trend over the experimental period. OC concentration decreased with the increasing age of mussels. Statistical analysis did not generally confirm the significant influence of lipid content on the accumulation of OCs in mussel tissue. OC levels in mussels were below the maximum permitted levels for human consumption set by the European Commission.
By determining the contaminant levels in mussels, coastal monitoring, which is affected by physiological and environmental parameters, is of great importance for getting insight into contaminant levels in coastal environments, especially in urban and industrial areas such as Kaštela Bay.
Author Contributions
Conceptualization, V.M., D.G., and T.L.D.; data curation, V.M., D.G., S.R., T.Š., J.I., and T.L.D.; formal analysis, V.M.; investigation and methodology, V.M., D.G., S.R., T.Š., J.I., and T.L.D.; visualization, D.G. and T.L.D.; writing—original draft, V.M., D.G., S.R., T.Š., J.I., and T.L.D.; writing—review and editing, D.G. and T.L.D. All authors have read and agreed to the published version of the manuscript.
Funding
This research was funded by the Ministry of Science and Education, The Republic of Croatia (Grant No. 001-0013077-0845).
Acknowledgments
We kindly acknowledge the assistance of the technical staff of the Institute of Oceanography and Fisheries, Split, Croatia. We would like to express our gratitude to our proofreader Dijana Njerš, MA, senior lecturer.
Conflicts of Interest
The authors declare no conflict of interest.
References
- Gómez-Gutiérrez, A.; Garnacho, E.; Bayona, J.M.; Albaigés, J. Assessment of the Mediterranean sediments contamination by persistent organic pollutants. Environ. Pollut. 2007, 148, 396–408. [Google Scholar] [CrossRef] [PubMed]
- Guo, Z.; Chen, T.; Wang, X.; Zhang, L.; Wang, L.; Dong, D.; Hua, X. Addition of Carbonaceous Material to Aquatic Sediments for Sorption of Lindane and p,p’-Dichlorodiphenyldichloroethylene. Appl. Sci. 2019, 9, 1722. [Google Scholar] [CrossRef]
- Lehtonen, K.K.; d’Errico, G.; Korpinen, S.; Regoli, F.; Ahkola, H.; Kinnunen, T.; Lastumäki, A. Mussel Caging and the Weight of Evidence Approach in the Assessment of Chemical Contamination in Coastal Waters of Finland (Baltic Sea). Front. Mar. Sci. 2019, 6, 688. [Google Scholar] [CrossRef]
- Suárez, P.; Ruiz, Y.; Alonso, A.; San Juan, F. Organochlorine compounds in mussels cultured in the Ría of Vigo: Accumulation and origin. Chemosphere 2013, 90, 7–19. [Google Scholar] [CrossRef]
- Wang, L.; Pang, S.; Zhou, G. Recent Advances in Spectroscopy Technology for Trace Analysis of Persistent Organic Pollutants. Appl. Sci. 2019, 9, 3439. [Google Scholar] [CrossRef]
- Bajt, O.; Ramšak, A.; Milun, V.; Andral, B.; Romanelli, G.; Scarpato, A.; Mitrić, M.; Kupusović, T.; Kljajić, Z.; Angelidis, M.; et al. Assessing chemical contamination in the coastal waters of the Adriatic Sea using active mussel biomonitoring with Mytilus galloprovincialis. Mar. Pollut. Bull. 2019, 141, 283–298. [Google Scholar] [CrossRef]
- Milun, V.; Bogner, D.; Barić, A.; Zvonarić, T. Distribution of polychlorinated biphenyls (PCBs) in surface sediments from the middle and south Adriatic coastal waters. Fres. Environ. Bull. 2006, 15, 997–1002. [Google Scholar]
- Milun, V.; Zvonarić, T. Monitoring of chlorinated pesticides and PCBs in the eastern Adriatic coastal waters using Mytilus galloprovincialis as indicator. Fres. Environ. Bull. 2008, 17, 1891–1900. [Google Scholar]
- Margeta, J.; Barić, A. Rational approach to the solution of the problem of wastewaters management-the Kaštela Bay case. Glob. Nest J. 2001, 3, 117–130. [Google Scholar]
- Dabrowska, H.; Kopko, O.; Turja, R.; Lehtonen, K.K.; Góra, A.; Polak-Juszczak, L.; Warzocha, J.; Kholodkevich, S. Sediment contaminants and contaminant levels and biomarkers in caged mussels (Mytilus trossulus) in the southern Baltic Sea. Mar. Environ. Res. 2013, 84, 1–9. [Google Scholar] [CrossRef]
- Mizuta, D.D.; Wikfors, G.H. Depth selection and in situ validation for offshore mussel agriculture in northeast United States federal waters. J. Mar. Sci. Eng. 2019, 7, 293. [Google Scholar] [CrossRef]
- Rodil, R.; Villaverde-de-Sáa, E.; Cobas, J.; Quintana, J.B.; Cela, R.; Carro, N. Legacy and emerging pollutants in marine bivalves from the Galician coast (NW Spain). Environ. Int. 2019, 129, 364–375. [Google Scholar] [CrossRef] [PubMed]
- Bruner, K.A.; Fisher, S.W.; Landrum, P.F. The role of the zebra mussel, Dreissena polymorpha, in contaminant cycling: I. The effect of body size and lipid content on the bioconcentration of PCBs and PAHs. J. Great Lakes Res. 1994, 20, 725–734. [Google Scholar] [CrossRef]
- Sukhotin, A.A.; Pörtner, H.O. Age-dependence of metabolism in mussels Mytilus edulis (L.) from the White Sea. J. Exp. Mar. Biol. Ecol. 2001, 257, 53–72. [Google Scholar] [CrossRef]
- Figueiredo, K.; Mäenpää, K.; Lyytikäinen, M.; Taskinen, J.; Leppänen, M.T. Assessing the influence of confounding biological factors when estimating bioaccumulation of PCBs with passive samplers in aquatic ecosystems. Sci. Total Environ. 2017, 601–602, 340–345. [Google Scholar] [CrossRef] [PubMed]
- Carro, N.; García, I.; Ignacio, M.; Mouteira, A. Organochlorine pesticide levels in Ensis siliqua (Linnaeus, 1758) from Ría de Vigo, Galicia (N.W. Spain): Influence of season, condition index and lipid content. Bull. Environ. Contam. Toxicol. 2012, 88, 491–496. [Google Scholar] [CrossRef]
- Gonzàlez-Fernàndez, C.; Albentosa, M.; Sokolova, I. Interactive effects of nutrition, reproductive state and pollution on molecular stress responses of mussels, Mytilus galloprovincialis Lamarck, 1819. Mar. Environ. Res. 2017, 131, 103–115. [Google Scholar] [CrossRef]
- Voets, J.; Talloen, W.; de Tender, T.; Van Dongen, S.; Covaci, A.; Blust, R.; Bervoets, L. Microcontaminant accumulation, physiological condition and bilateral asymmetry in zebra mussels (Dreisena polymorpha) from clean and contaminated surface waters. Aquat. Toxicol. 2006, 79, 213–225. [Google Scholar] [CrossRef]
- UNEP/IOC/IAEA/FAO. Sample Work-Up for the Analysis of Chlorinated Hydrocarbons in the Marine Environment; Reference Methods for Marine Pollution Studies; UNEP: Nairobi, Kenya, 2011; Volume 71, pp. 1–48. [Google Scholar]
- Beg Paklar, G.; Zore-Armanda, M.; Dadić, V. Currents in the Kaštela Bay: Empirical analysis and results of a numerical model. Acta Adriat. 2002, 43, 33–64. [Google Scholar]
- Carro, N.; Cobas, J.; García, I.; Ignacio, M.; Mouteira, A. Distribution and trend of organochlorine pesticides in Galicia coast using mussels as bioindicator organisms. Possible relationship to biological parameters. Chemosphere 2014, 102, 37–47. [Google Scholar] [CrossRef]
- Tantanasarit, C.; Babel, S.; Englande, A.J.; Meksumpun, S. Influence of size and density on filtration rate modeling and nutrient uptake by green mussel (Perna viridis). Mar. Pollut. Bull. 2013, 68, 38–45. [Google Scholar] [CrossRef] [PubMed]
- Ueno, D.; Takahashi, S.; Tanabe, S.; Ikeda, K.; Koyama, J. Uptake kinetics of persistent organochlorines in mussels through the transplantation experiment. J. Environ. Chem. 1999, 9, 369–378. [Google Scholar] [CrossRef]
- Múgica, M.; Sokolova, I.M.; Izagirre, U.; Marigómez, I. Season-dependent effects of elevated temperature on stress biomarkers, energy metabolism and gamete development in mussels. Mar. Environ. Res. 2015, 103, 1–10. [Google Scholar] [CrossRef] [PubMed]
- Ninčević-Gladan, Ž.; Bužančić, M.; Kušpilić, G.; Grbec, B.; Matijević, S.; Skejić, S.; Marasović, I.; Morović, M. The response of phytoplankton community to anthropogenic pressure gradient in the coastal waters of the eastern Adriatic Sea. Ecol. Indic. 2015, 56, 106–115. [Google Scholar] [CrossRef]
- Bellas, J.; Albentosa, M.; Vidal-Liñán, L.; Besada, V.; Ángeles Franco, M.; Fumega, J.; González-Quijano, A.; Viñas, L.; Beiras, R. Combined use of chemical, biochemical and physiological variables in mussels for the assessment of marine pollution along the N-NW Spanish coast. Mar. Environ. Res. 2014, 96, 105–117. [Google Scholar] [CrossRef] [PubMed]
- Galvao, P.; Henkelmann, B.; Longo, R.; Dorneles, P.R.; Torres, J.P.M.; Malm, O.; Schramm, K.W. Partition of organochlorine concentrations among suspended solids, sediments and brown mussel Perna perna, in tropical bays. Chemosphere 2014, 114, 9–15. [Google Scholar] [CrossRef]
- Milun, V.; Grgas, D.; Landeka Dragičević, T. Assessment of PCB and chlorinated pesticide accumulation in mussels at Kaštela Bay (Eastern Adriatic). Sci. Total Environ. 2016, 562, 115–127. [Google Scholar] [CrossRef]
- Grilo, T.F.; Cardoso, P.G.; Pato, P.; Duarte, A.C.; Pardal, M.A. Organochlorine accumulation on a highly consumed bivalve (Scrobicularia plana) and its main implications for human health. Sci. Total Environ. 2013, 461–462, 188–197. [Google Scholar] [CrossRef]
- Schäfer, S.; Hamer, B.; Treursić, B.; Möhlenkamp, C.; Spira, D.; Korlević, M.; Reifferscheid, G.; Claus, E. Comparison of bioaccumulation and biomarker responses in Dreissena polymorpha and D. bugensis after exposure to resuspended sediments. Arch. Environ. Con. Tox. 2012, 62, 614–627. [Google Scholar] [CrossRef]
- Bergen, B.J.; Nelson, W.G.; Quinn, J.G.; Jayaraman, S. Relationships among total lipid, lipid classes, and polychlorinated biphenyl concentrations in two indigenous populations of ribbed mussels (Geukensia demissa) over an annual cycle. Environ. Toxicol. Chem. 2001, 20, 575–581. [Google Scholar] [CrossRef]
- Ferreira, A.M.; Vale, C. Seasonal and inter-annual variations of PCB and DDT contents in the oyster Crassostrea angulata from the Sado estuary (Portugal). Cienc. Mar. 2001, 27, 255–268. [Google Scholar] [CrossRef]
- Freitas, R.; De Marchi, L.; Bastos, M.; Moreira, A.; Velez, C.; Chiesa, S.; Wrona, F.J.; Figueira, E.; Soares, A.M.V.M. Effects of seawater acidification and salinity alterations on metabolic, osmoregulation and oxidative stress markers in Mytilus galloprovincialis. Ecol. Indic. 2017, 79, 54–62. [Google Scholar] [CrossRef]
- Jasprica, N.; Carić, M.; Bolotin, J.; Rudenjak-Lukenda, M. The Mediterranean mussel (Mytilus galloprovincialis Lmk.) growth rate response to phytoplankton and microzooplankton population densities in the Mali Ston Bay (Southern Adriatic). Period. Biol. 1997, 99, 255–264. [Google Scholar]
- Galvao, P.; Henkelmann, B.; Longo, R.; Torres, J.P.M.; Malm, O.; Schramm, K.W. The brown mussel Perna perna (L., 1758) as a sentinel species for chlorinated pesticide and dioxin-like compounds. Environ. Sci. Pollut. Res. 2015, 22, 13522–13533. [Google Scholar] [CrossRef]
- Ramu, K.; Kajiwara, N.; Lam, P.K.S.; Jefferson, T.A.; Zhou, K.; Tanabe, S. Temporal variation and biomagnification of organohalogen compounds in finless porpoises (Neophocaena phocaenoides) from South China Sea. Environ. Pollut. 2006, 144, 516–523. [Google Scholar] [CrossRef]
- Choi, J.Y.; Yang, D.B.; Hong, G.H.; Kim, K.; Shin, K.H. Ecological and human health risk from polychlorinated biphenyls and organochlorine pesticides in bivalves of Cheonsu Bay, Korea. Environ. Eng. Res. 2016, 21, 373–383. [Google Scholar] [CrossRef]
- Deudero, S.; Box, A.; March, D.; Valencia, J.M.; Grau, A.M.; Tintore, J.; Calvo, M.; Caixach, J. Organic compounds temporal trends at some invertebrate species from the Balearics, Western Mediterranean. Chemosphere 2007, 68, 1650–1659. [Google Scholar] [CrossRef]
- Letcher, R.J.; Klassom-Wehler, E.; Bergman, Å. Methyl sulfone and hydroxylated metabolite of polychlorinated biphenyls. In The Handbook of Environmental Chemistry, Part K: New Types of Persistent Halogenated Ccompounds; Paasivirta, J., Ed.; Springer: Berlin/Heidelberg, Germany, 2000. [Google Scholar]
- European Commission (EC). Regulation no 396/2005 of the European Parliament and of the council of 23 February 2005 on maximum residue levels of pesticides in or on food and feed of plant and animal origin and amending council directive 91/414/EEC. Off. J. Eur. Union L 2005, 70, 16. [Google Scholar]
- European Commission (EC). Regulation no 1259/2011 of 2 December 2011 amending regulation (EC) no 1881/2006 as regards maximum levels for dioxins, dioxin-like PCBs and non dioxin-like PCBs in food staffs. Off. J. Eur. Union L 2011, 320. [Google Scholar]


© 2020 by the authors. Licensee MDPI, Basel, Switzerland. This article is an open access article distributed under the terms and conditions of the Creative Commons Attribution (CC BY) license (http://creativecommons.org/licenses/by/4.0/).