Ten Points for High-Quality Statistical Reporting and Data Presentation


Featured Application
Abstract
1. Introduction
2. Materials and Methods
2.1. Prework
- Search for papers evaluating the use and misuse of statistics in medical articles.
- Search for papers evaluating statistical reporting and data presentation.
- Review medical statistics textbooks.
- Review statistical reporting guidelines, including journal guidelines for authors.
- Assess my experience as a handling editor and referee for medical and medicine-related journals.
- Was Statistical analysis subsection included?
- Was there a sample size justification before the study?
- Did authors state how variables were described and summarized?
- Did authors state which methods were used to evaluate the statistical significances?
- Did authors identify the variables for each analysis and mentioned all the statistical methods used?
- Was extended description of some specific procedures provided?
- Did authors verify how data conformed to assumptions of the methods used?
- Was statistical software reported?
- Was missing data addressed?
- Were references to statistical literature provided?
- Was subject attrition or exclusion addressed?
- How any outlying data were treated in the analysis?
- Was a table included where the basic characteristics of the study subjects were summarized with descriptive statistics?
- Were total and group sample sizes reported for each analysis in all tables and figures?
- Did all tables and figures have a clear and self-explanatory title?
- Were statistical abbreviations explained in all tables and figures?
- Were summary statistics, tests or methods identified and named in all tables and figures?
- Were p-values reported properly (e.g., no expressions like NS, p < 0.05, p = 0.000)
- Was the total number of reported p-values and confidence intervals in tables and figures less than 100?
- Were all tables and figures appropriate?
2.2. Ten Items to Assess the Quality of Statistical Reporting and Data Presentation
2.2.1. Item 1: Was a Table Included Where the Basic Characteristics of the Study Subjects Were Summarized with Descriptive Statistics?
2.2.2. Item 2: Was the Total Number of Participants Provided in all Tables and Figures?
2.2.3. Item 3: Were Summary Statistics, Tests, and Methods Identified and Named in all Tables and Figures?
2.2.4. Item 4: Were Tables and Figures Well Prepared?
- -
- Messy, inferior, or substandard overall technical presentation of data.
- ○
- A table or a figure did not have a clear title.
- ○
- The formatting of a table resembled a spreadsheet, and the lines of the same size between each row and each column did not help to clarify the different data presented in the table.
- ○
- In a figure, data values were not clearly visible.
- ○
- Data values were not defined.
- ○
- Obvious errors in presented numbers or data elements.
- -
- Tables or figures included unnecessary features:
- ○
- In a figure, nondata elements (gridlines, shading, or three dimensional perspectives) competed with data elements and they did not serve a specific explanatory function in the graph.
- ○
- A table or a figure was unnecessary because the data had too few values. Authors could have presented their results clearly in a sentence or two. For example, a sentence is preferred to a pie char.
- -
- General guiding principles for reporting statistical results were not followed:
- ○
- p-Values were denoted with asterisks or with a system of letters in tables or figures, and actual p-values were not reported. Actual p-values should be reported, without false precision, whenever feasible. Providing the actual p-values prevents problems of interpretation related to p-values close to 0.05 [12,22]. Very small p-values do not need exact representation and p < 0.001 is usually sufficient.
- ○
- Numbers were not reported with an appropriate degree of precision in tables. In interpreting the findings, the reader cannot pay attention to the numbers presented with several decimals.
- ○
- The standard error of the mean (SE) was used to indicate the variability of a data set.
- ○
- Confidence intervals were not reported with the effect sizes (regression coefficients, ORs, HRs, or IRRs) in regression analyses or meta-analyses. The results of the primary comparisons should always be reported with confidence intervals [27].
- ○
2.2.5. Item 5: Was a Statistical Analysis (or Data Analysis) Subsection Provided in the Methods Section?
2.2.6. Item 6: Did Authors Identify the Variables and Methods for Each Analysis?
2.2.7. Item 7: Was It Verified that the Data Conformed to the Assumptions and Preconditions of the Methods Used to Analyze Them?
2.2.8. Item 8: Were References to Statistical Literature Provided?
2.2.9. Item 9: Was the Statistical Software Used in the Analysis Reported?
2.3. Total Score
- 9–10 Excellent
- 7–8 Good
- 5–6 Acceptable
- 3–4 Weak
- 0–2 Poor
2.4. Set of Articles
2.5. Data Analysis
3. Results
3.1. Characteristics of the Evaluated Articles
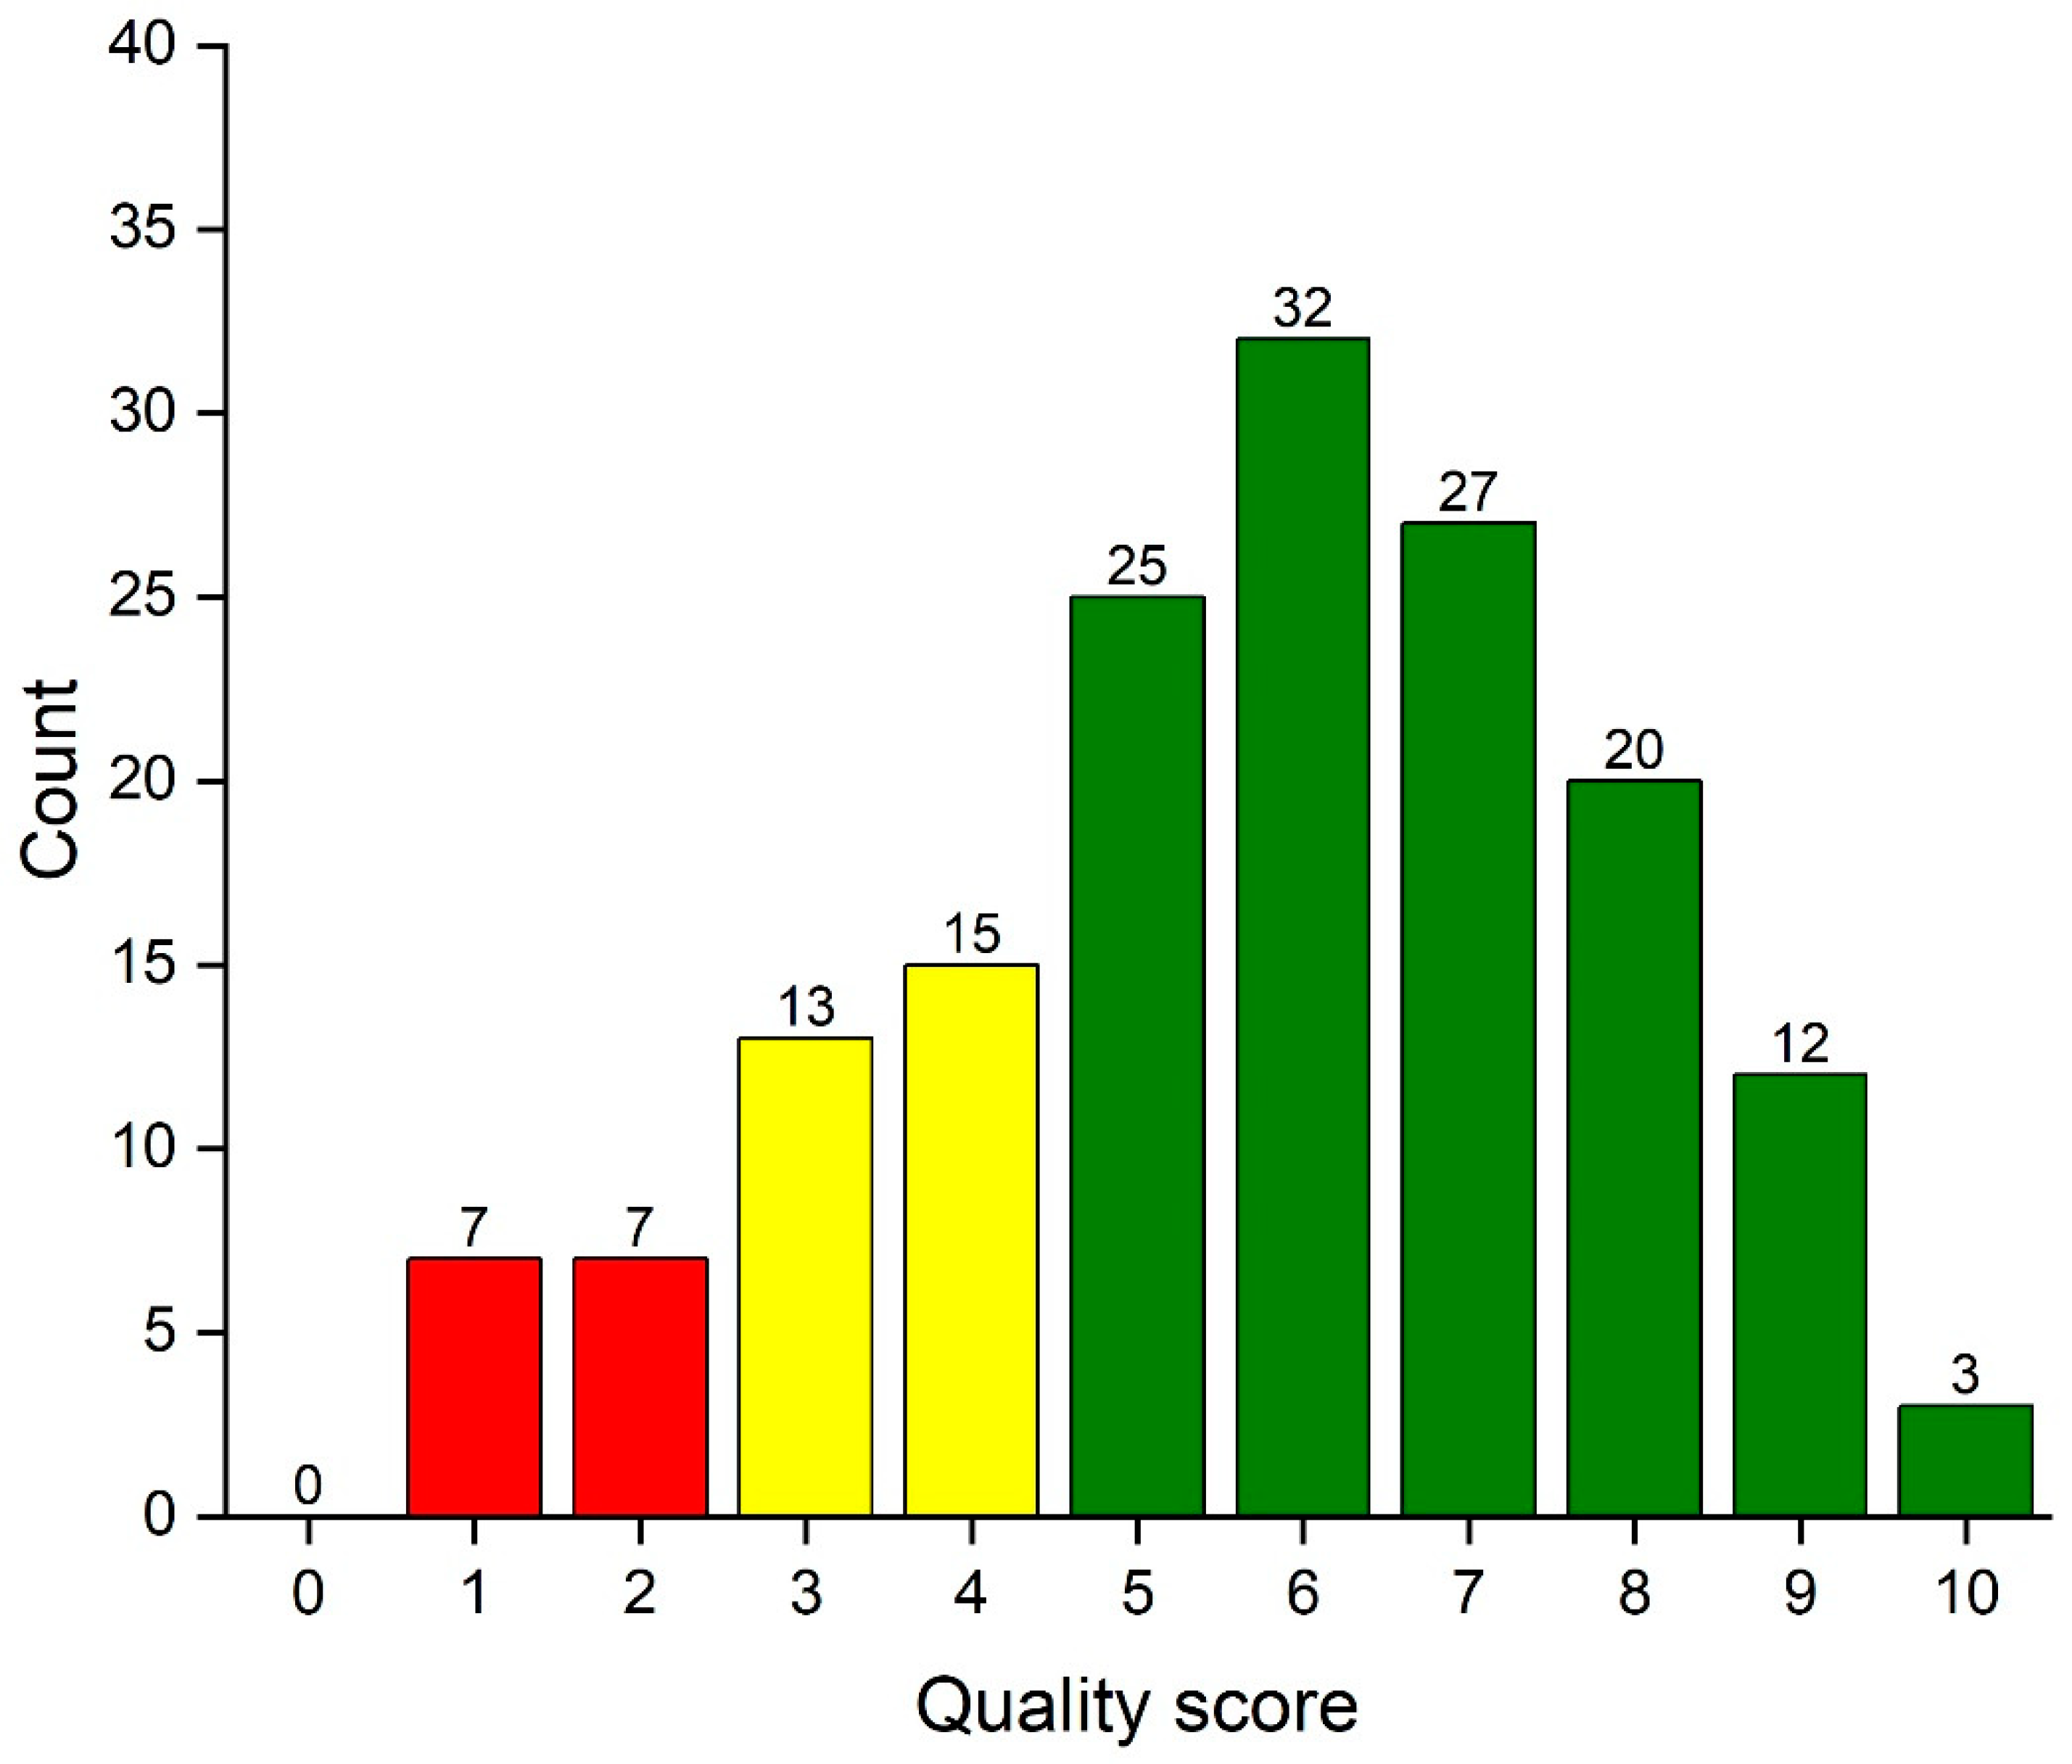
3.2. Distribution of the Total Quality Score
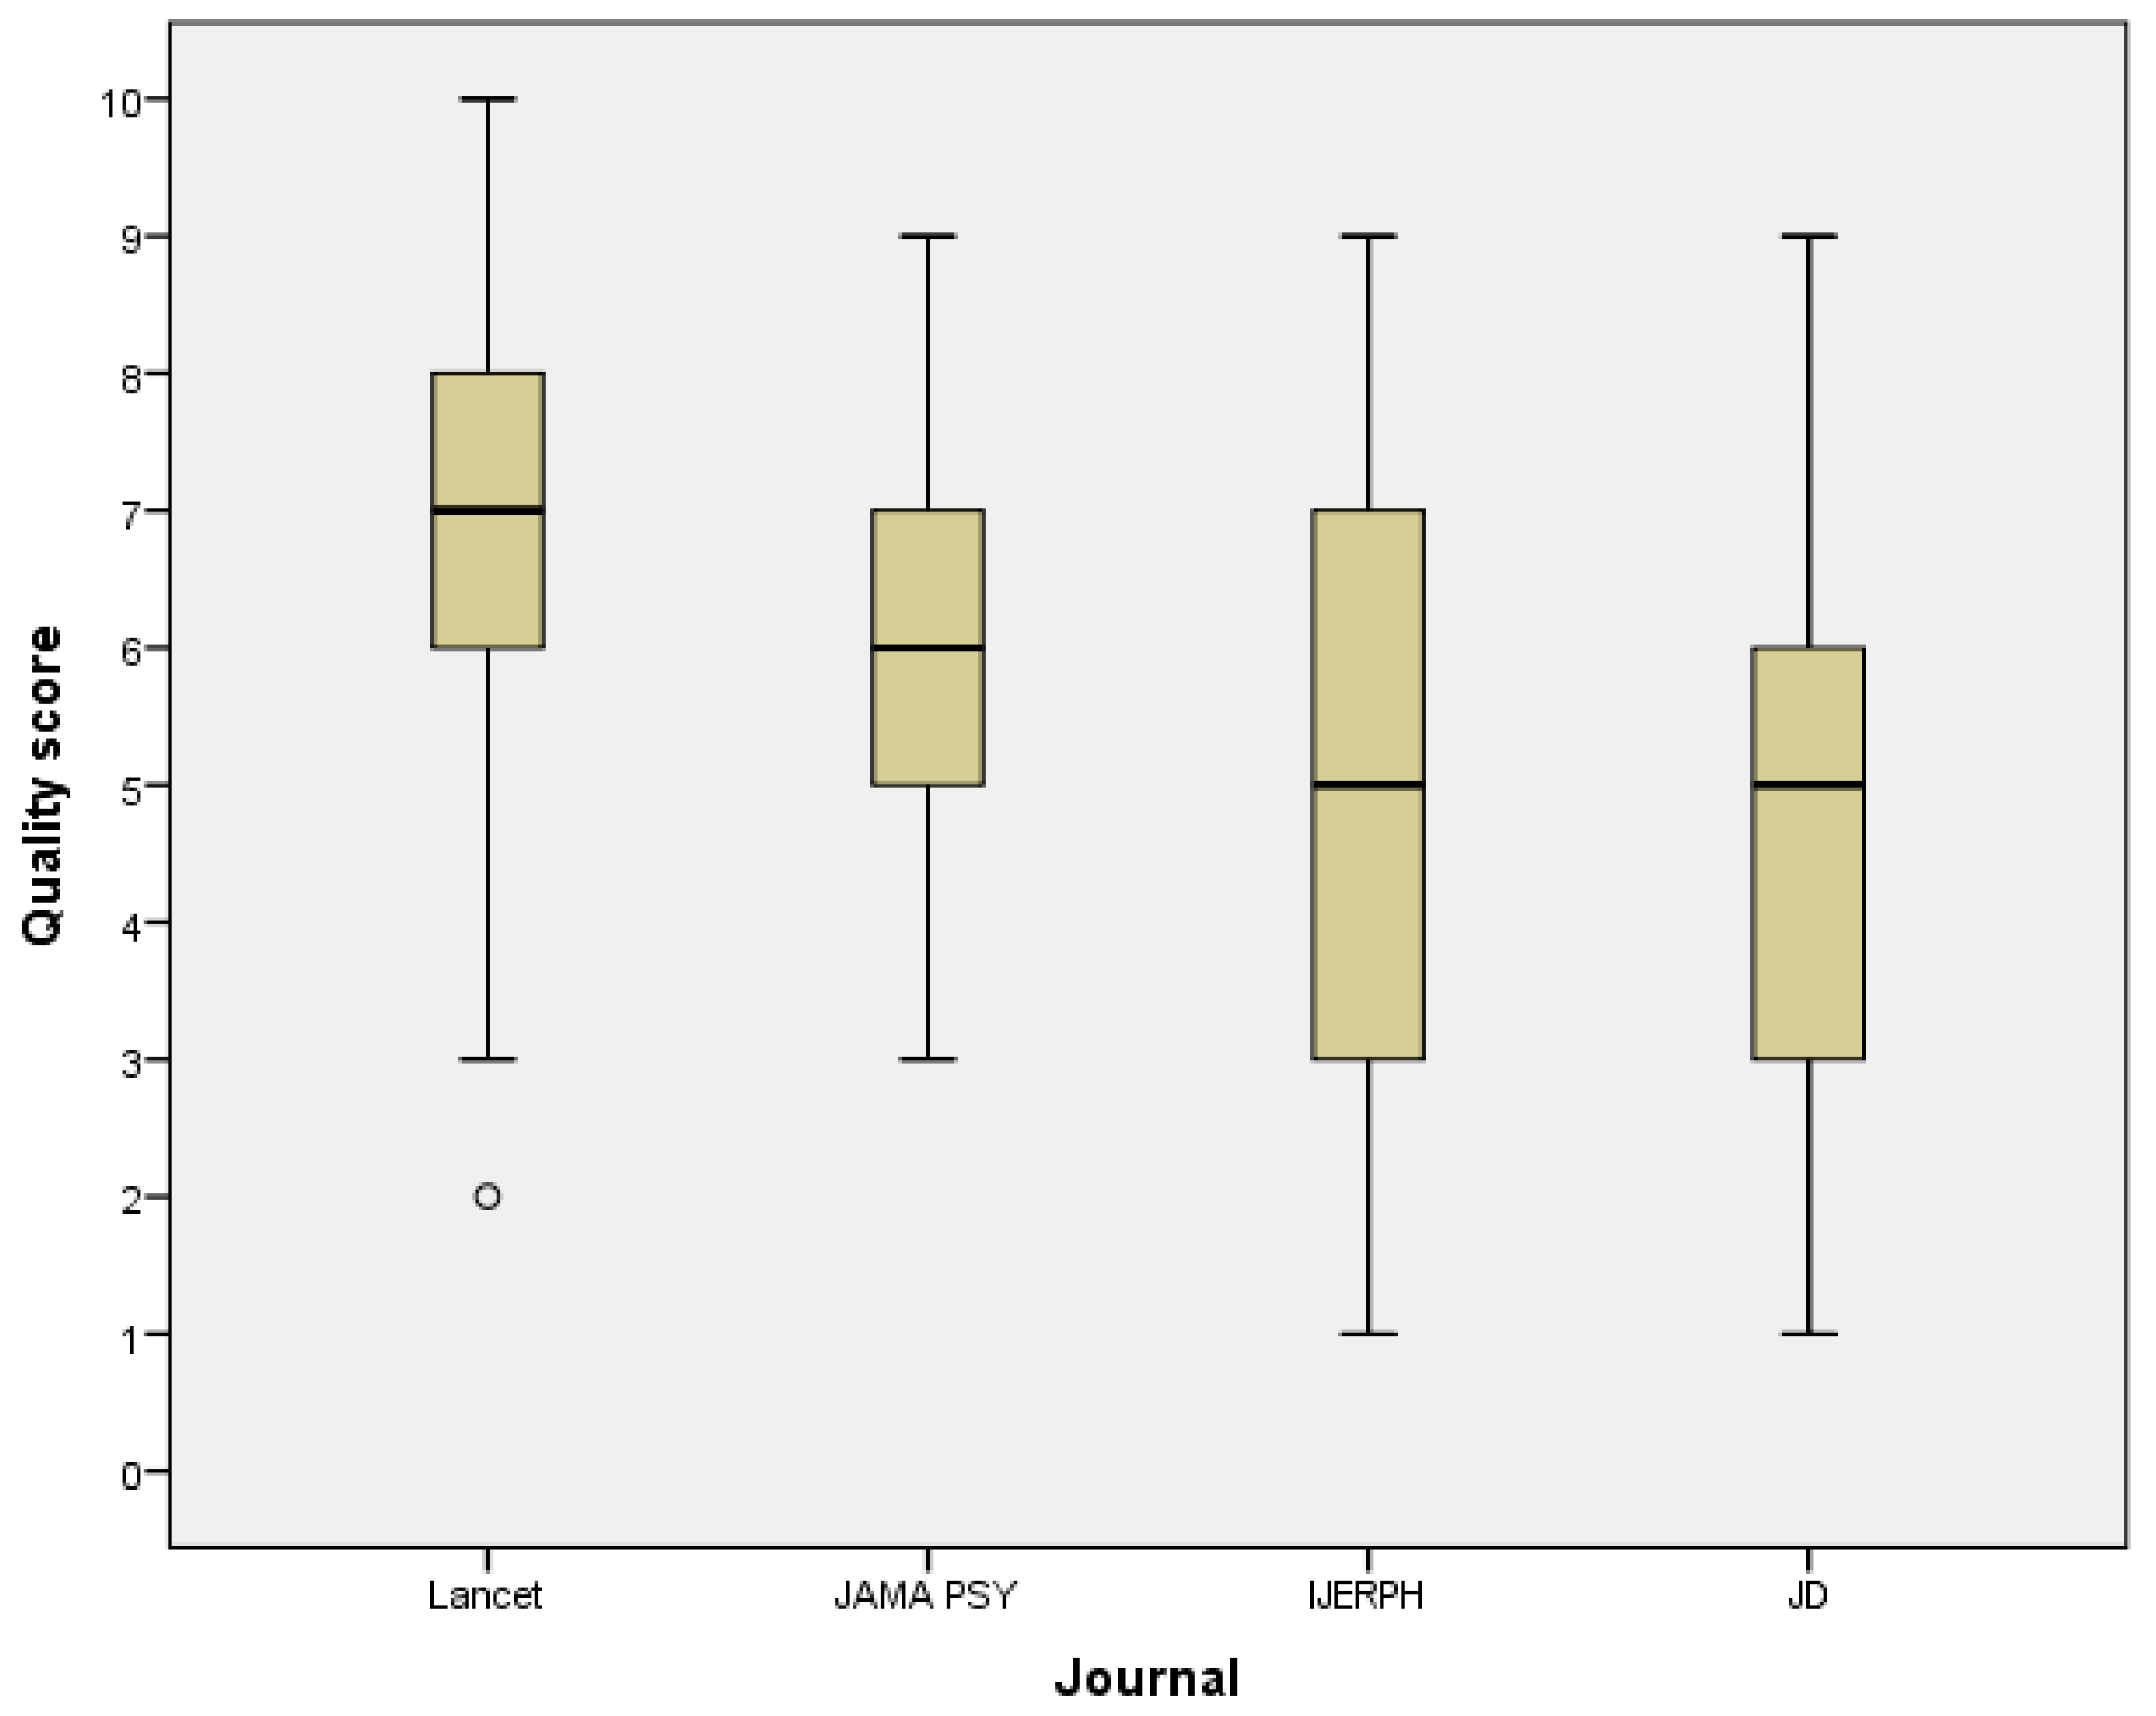
3.3. Quality of Statistical Reporting and Data Presentation by the Journal
3.4. Interrater and Test-Retest Reliability
4. Discussion
5. Conclusions
Author Contributions
Funding
Acknowledgments
Conflicts of Interest
References
- Sato, Y.; Gosho, M.; Nagashima, K.; Takahashi, S.; Ware, J.H.; Laird, N.M. Statistical Methods in the Journal—An Update. N. Engl. J. Med. 2017, 376, 1086–1087. [Google Scholar] [CrossRef] [PubMed]
- Nieminen, P.; Miettunen, J.; Koponen, H.; Isohanni, M. Statistical methodologies in psychopharmacology: A review. Hum. Psychopharmacol. Clin. Exp. 2006, 21, 195–203. [Google Scholar] [CrossRef] [PubMed]
- Norström, F. Poor quality in the reporting and use of statistical methods in public health—The case of unemployment and health. Arch. Public Health 2015, 73, 56. [Google Scholar] [CrossRef] [PubMed]
- Diong, J.; Butler, A.A.; Gandevia, S.C.; Héroux, M.E. Poor statistical reporting, inadequate data presentation and spin persist despite editorial advice. PLoS ONE 2018, 13, e202121. [Google Scholar] [CrossRef] [PubMed]
- Altman, D.G. Poor-quality medical research: What can journals do? JAMA 2002, 287, 2765–2767. [Google Scholar] [CrossRef]
- Nieminen, P.; Carpenter, J.; Rucker, G.; Schumacher, M. The relationship between quality of research and citation frequency. BMC Med. Res. Methodol. 2006, 6, 42. [Google Scholar] [CrossRef]
- McClean, M.; Silverberg, J. Statistical reporting in randomized controlled trials from the dermatology literature: A review of 44 dermatology journals. Br. J. Dermatol. 2015, 173, 172–183. [Google Scholar] [CrossRef]
- Dexter, F.; Shafer, S.L. Narrative Review of Statistical Reporting Checklists, Mandatory Statistical Editing, and Rectifying Common Problems in the Reporting of Scientific Articles. Anesth. Analg. 2017, 124, 943–947. [Google Scholar] [CrossRef]
- Vandenbroucke, J.P.; Von Elm, E.; Altman, D.G.; Gøtzsche, P.C.; Mulrow, C.D.; Pocock, S.J.; Poole, C.; Schlesselman, J.J.; Egger, M. Strengthening the Reporting of Observational Studies in Epidemiology (STROBE): Explanation and elaboration. PLoS Med. 2007, 4, 1628–1654. [Google Scholar] [CrossRef]
- Moher, D.; Altman, D.G.; Schultz, K.F.; Simera, I.; Wager, E. Guidelines for Reporting Health Research. User’s Manual; John Wiley & Sons, Ltd.: Chichester, UK, 2014. [Google Scholar]
- EQUATOR Network. Available online: https://www.equator-network.org/ (accessed on 30 March 2020).
- Lang, T.A.; Michelle, S. How to Report Statistics in Medicine: Annotated Guidelines for Authors, Editors and Reviewers, 2nd ed.; American College of Physicians: Philadelphia, PA, USA, 2006. [Google Scholar]
- Strasak, A.M.; Zaman, Q.; Pfeiffer, K.P.; Gobel, G.; Ulmer, H. Statistical errors in medical research—A review of common pitfalls. Swiss Med. Wkly. 2007, 137, 44–49. [Google Scholar]
- Lee, S. Avoiding negative reviewer comments: Common statistical errors in anesthesia journals. Korean J. Anesthesiol. 2016, 69, 219–226. [Google Scholar] [CrossRef] [PubMed]
- Altman, D.G. Statistical reviewing for medical journals. Stat. Med. 1998, 17, 2661–2674. [Google Scholar] [CrossRef]
- Nieminen, P.; Virtanen, J.I.; Vähänikkilä, H. An instrument to assess the statistical intensity of medical research papers. PLoS ONE 2017, 12. [Google Scholar] [CrossRef] [PubMed]
- Bland, M. An Introduction to Medical Statistics; Oxford University Press: Oxford, UK, 2015; ISBN 0199589925. [Google Scholar]
- Pickering, R.M. Describing the participants in a study. Age Ageing 2017, 46, 576–581. [Google Scholar] [CrossRef] [PubMed]
- Lang, T.A.; Altman, D.G. Basic statistical reporting for articles published in Biomedical Journals: “The Statistical analyses and methods in the published literature” or the SAMPL guidelines. Int. J. Nurs. Stud. 2015, 52, 5–9. [Google Scholar] [CrossRef]
- Nieminen, P.; Kaur, J. Reporting of data analysis methods in psychiatric journals: Trends from 1996 to 2018. Int. J. Methods Psychiatr. Res. 2019, 28. [Google Scholar] [CrossRef]
- Nieminen, P.; Vähänikkilä, H. Use of data analysis methods in dental publications: Is there evidence of a methodological change? Publications 2020, 8, 9. [Google Scholar] [CrossRef]
- Thiese, M.S.; Ronna, B.; Ott, U. P value interpretations and considerations. J. Thorac. Dis. 2016, 8, E928–E931. [Google Scholar] [CrossRef]
- Motulsky, H. Intuitive Biostatistics, 3rd ed.; Oxford University Press: New York, NY, USA, 2014; ISBN 9780199946648. [Google Scholar]
- American Medical Association. AMA Manual of Style: A Guide for Authors and Editors, 11th ed.; Oxford University Press: New York, NY, USA, 2020; ISBN 978-0190246556. [Google Scholar]
- Oberg, A.L.; Poland, G.A. The process of continuous journal improvement: New author guidelines for statistical and analytical reporting in VACCINE. Vaccine 2012, 30, 2915–2917. [Google Scholar] [CrossRef]
- American Psychological Assiciation. Publication Manual of the American Psychological Assiciation, 6th ed.; American Psychological Assiciation: Washington, DC, USA, 2017; ISBN 978-1-4338-0561-5. [Google Scholar]
- Gardner, M.J.; Altman, D.G. Confidence intervals rather than P values: Estimation rather than hypothesis testing. Br. Med. J. (Clin. Res. Ed.) 1986, 292, 746–750. [Google Scholar] [CrossRef]
- Spector, R.; Vesell, E.S. Pharmacology and statistics: Recommendations to strengthen a productive partnership. Pharmacology 2006, 78, 113–122. [Google Scholar] [CrossRef] [PubMed]
- ECMJE Recommendations for He Conduct, Reporting, Editing, and Publication of Scolarly Work in Medical Journals. Available online: http://www.icmje.org/recommendations/ (accessed on 25 May 2020).
- Lang, T.A.; Altman, D.G. Statistical Analyses and Methods in the Published Literature: The SAMPL Guidelines. In Guidelines for Reporting Health Research: A User’s Manual; John Wiley & Sons, Ltd.: Oxford, UK, 2014; pp. 264–274. ISBN 9780470670446. [Google Scholar]
- Simundic, A.-M. Practical recommendations for statistical analysis and data presentation in Biochemia Medica journal. Biochem. Med. 2012, 22, 15–23. [Google Scholar] [CrossRef] [PubMed]
- Mayo, D. Statistical Inference as Severe Testing. How to Get beyond the Statistical Wars; Cambridge University Press: Cambridge, UK, 2018; ISBN 978-1-107-66464-7. [Google Scholar]
- Indrayan, A.; Malhotra, R.K. Medical Biostatistics, 4th ed.; CRC Press: Cambridge, UK, 2018; ISBN 1498799531. [Google Scholar]
- Indrayan, A. Reporting of Basic Statistical Methods in Biomedical Journals: Improved SAMPL Guidelines. Indian Pediatr. 2020, 57, 43–48. [Google Scholar] [CrossRef] [PubMed]
- Gwet, K.L. Handbook of Inter-Rater Reliability, 4th ed.; Advances Analytics, LLS: Gaithersburg, MD, USA, 2014; ISBN 9780970806284. [Google Scholar]
- Glasziou, P.; Altman, D.G.; Bossuyt, P.; Boutron, I.; Clarke, M.; Julious, S.; Michie, S.; Moher, D.; Wager, E. Reducing waste from incomplete or unusable reports of biomedical research. Lancet 2014, 383, 267–276. [Google Scholar] [CrossRef]
- The Academy of Medical Sciences Reproducibility and Reliability of Biomedical Research: Improving Research Practice; The Academy of Medical Sciences: London, UK, 2015.
- Vetter, T.R.; McGwin, G.; Pittet, J.F. Replicability, Reproducibility, and Fragility of Research Findings-Ultimately, Caveat Emptor. Anesth. Analg. 2016, 123, 244–248. [Google Scholar] [CrossRef]
- Smaldino, P.E.; McElreath, R. The natural selection of bad science. R. Soc. Open Sci. 2016, 3, 9. [Google Scholar] [CrossRef]
- Shetty, A.C.; Al Rasheed, N.M.; Albwardi, S.A. Dental professionals’ attitude towards biostatistics. J. Dent. Oral Hyg. 2015, 7, 113–118. [Google Scholar]
- Hannigan, A.; Hegarty, A.C.; McGrath, D. Attitudes towards statistics of graduate entry medical students: The role of prior learning experiences. BMC Med. Educ. 2014, 14, 70. [Google Scholar] [CrossRef]
- Batra, M.; Gupta, M.; Dany, S.S.; Rajput, P. Perception of Dental Professionals towards Biostatistics. Int. Sch. Res. Not. 2014, 2014, 1–6. [Google Scholar] [CrossRef]
- Altman, D.G.; Goodman, S.N.; Schroter, S. How statistical expertise is used in medical research. JAMA 2002, 287, 2817–2820. [Google Scholar] [CrossRef]
- Belia, S.; Fidler, F.; Williams, J.; Cumming, G. Researchers misunderstand confidence intervals and standard error bars. Psychol. Methods 2005, 10, 389–396. [Google Scholar] [CrossRef]
- Moher, D. Reporting guidelines: Doing better for readers. BMC Med. 2018, 16, 18–20. [Google Scholar] [CrossRef]
- Glonti, K.; Cauchi, D.; Cobo, E.; Boutron, I.; Moher, D.; Hren, D. A scoping review on the roles and tasks of peer reviewers in the manuscript review process in biomedical journals. BMC Med. 2019, 17, 1–14. [Google Scholar] [CrossRef] [PubMed]
- Greenwood, D.C.; Freeman, J.V. How to spot a statistical problem: Advice for a non-statistical reviewer. BMC Med. 2015, 13, 1–3. [Google Scholar] [CrossRef] [PubMed]
- Kyrgidis, A.; Triaridis, S. Methods and Biostatistics: A concise guide for peer reviewers. Hippokratia 2010, 14, 13–22. [Google Scholar] [PubMed]
- Patel, J. Why training and specialization is needed for peer review: A case study of peer review for randomized controlled trials. BMC Med. 2014, 12, 1–7. [Google Scholar] [CrossRef] [PubMed]
- Horbach, S.P.J.M.; Halffman, W. The changing forms and expectations of peer review. Res. Integr. Peer Rev. 2018, 3, 1–15. [Google Scholar] [CrossRef]
- Hardwicke, T.E.; Goodman, S.N. How often do leading biomedical journals use statistical experts to evaluate statistical methods? The results of a survey. MetArXiv Prepr. 2020, 1–29. [Google Scholar]
- Hardwicke, T.E.; Frank, M.C.; Vazire, S.; Goodman, S.N. Should Psychology Journals Adopt Specialized Statistical Review? Adv. Methods Pract. Psychol. Sci. 2019, 2, 240–249. [Google Scholar] [CrossRef]
- Overgaard, K.; Roberts, J.; Schaeffer, M.B.; Pessin, R. the Trenches. Sci. Ed. 2015, 38, 2015. [Google Scholar]
- Curtis, M.J.; Alexander, S.; Cirino, G.; Docherty, J.R.; George, C.H.; Giembycz, M.A.; Hoyer, D.; Insel, P.A.; Izzo, A.A.; Ji, Y.; et al. Experimental design and analysis and their reporting II: Updated and simplified guidance for authors and peer reviewers. Br. J. Pharmacol. 2018, 175, 987–993. [Google Scholar] [CrossRef]
- Fresco-Santalla, A.N.A.; Hernández-Pérez, T. Current and evolving models of peer-review. Ser. Libr. 2014, 67, 373–398. [Google Scholar] [CrossRef]
- Vercellini, P.; Buggio, L.; Vigano, P.; Somigliana, E. Peer review in medical journals: Beyond quality of reports towards transparency and public scrutiny of the process. Eur. J. Intern. Med. 2016, 31, 15–19. [Google Scholar] [CrossRef]
- Nuijten, M.B.; Hartgerink, C.H.J.; van Assen, M.A.L.M.; Epskamp, S.; Wicherts, J.M. The prevalence of statistical reporting errors in psychology (1985–2013). Behav. Res. Methods 2016, 48, 1205–1226. [Google Scholar] [CrossRef] [PubMed]
- Vahanikkila, H.; Tjaderhane, L.; Nieminen, P. The statistical reporting quality of articles published in 2010 in five dental journals. Acta Odontol. Scand. 2015, 73, 76–80. [Google Scholar] [CrossRef] [PubMed]
- Lukic, I.; Marusic, M. Appointment of statistical editor and quality of statistics in a small medical journal. Croat. Med. J. 2001, 42, 500–503. [Google Scholar] [PubMed]
- Pouwels, K.B.; Widyakusuma, N.N.; Groenwold, R.H.H.; Hak, E. Quality of reporting of confounding remained suboptimal after the STROBE guideline. J. Clin. Epidemiol. 2016, 69, 217–224. [Google Scholar] [CrossRef]
- Mokkink, L.B.; Terwee, C.B.; Patrick, D.L.; Alonso, J.; Stratford, P.W.; Knol, D.L.; Bouter, L.M.; de Vet, H.C.W. The COSMIN study reached international consensus on taxonomy, terminology, and definitions of measurement properties for health-related patient-reported outcomes. J. Clin. Epidemiol. 2010, 63, 737–745. [Google Scholar] [CrossRef]


| TABLES AND FIGURES IN RESULTS SECTION: | No | Yes |
|---|---|---|
| 1. Was a table included where the basic characteristics of the study participants were summarized with descriptive statistics? | 0 | 1 |
| 2. Was the total number of participants provided in all tables and figures? | 0 | 1 |
| 3. Were summary statistics, tests and methods identified and named in all tables and figures? | 0 | 1 |
| 4. Were tables and figures well prepared? | ||
| 0 = more than 50% of the tables and figures had presentation issues | 0 | |
| 1 = 50% or fewer of the tables and figures had presentation issues | 1 | |
| 2 = no presentation issues in any of the tables and figures | 2 | |
| MATERIALS AND METHODS SECTION: | ||
| 5. Was the statistical analysis (or data analysis) subsection provided in the Materials and Methods section? | 0 | 1 |
| 6. Did authors identify the variables (and methods) for each analysis done in the study? | 0 | 1 |
| 7. Was it verified that the data conformed to the assumptions and preconditions of the methods used to analyze them? | 0 | 1 |
| 8. Were references to statistical literature provided? | 0 | 1 |
| 9. Was the statistical software reported? | 0 | 1 |
| TOTAL SCORE: | ||
| Lancet n (%) | JAMA Psy n (%) | IJERPH n (%) | JD n (%) | All n (%) | |
|---|---|---|---|---|---|
| Study design | |||||
| Observational studies | 11 (27.5) | 27 (67.5) | 27 (67.5) | 13 (32.5) | 78 (48.8) |
| Experimental studies | 27 (67.5) | 9 (22.5) | 6 (15.0) | 6 (15.0) | 48 (30.0) |
| Reliability | 1 (2.5) | 0 | 2 (5.0) | 2 (5.0) | 5 (3.1) |
| Laboratory works | 0 | 0 | 4 (10.0) | 14 (35.0) | 18 (11.3) |
| Meta-analysis | 1 (2.5) | 4 (10.0) | 1 (2.5) | 5 (12.5) | 11 (6.9) |
| Sample size | |||||
| <99 | 0 | 3 (7.5) | 14 (35.0) | 20 (50.0) | 37 (23.1) |
| 100–499 | 5 (12.5) | 12 (30.0) | 12 (30.0) | 8 (20.0) | 37 (23.1) |
| 500–2999 | 22 (55.0) | 7 (17.5) | 6 (15.0) | 5 (12.5) | 40 (25.0) |
| >3000 | 12 (30.0) | 18 (45.0) | 5 (12.5) | 3 (7.5) | 38 (23.8) |
| Missing | 1 (2.5) | 0 | 3 (7.5) | 4 (10.0) | 8 (5.0) |
| Total number of articles | 40 | 40 | 40 | 40 | 160 |
| Number of Articles | Mean | Standard Deviation | |
|---|---|---|---|
| Study design | |||
| 78 | 5.5 | 2.2 |
| 48 | 6.5 | 1.8 |
| 5 | 5.4 | 2.6 |
| 18 | 3.9 | 1.9 |
| 11 | 7.4 | 2.2 |
| Sample size | |||
| 37 | 4.7 | 2.2 |
| 37 | 5.6 | 2.0 |
| 40 | 7.2 | 1.5 |
| 38 | 6.0 | 1.9 |
| 8 | 2.9 | 1.0 |
| All articles | 160 | 5.7 | 2.2 |
| Item | Lancet n (%) | JAMA Psy n (%) | IJERPH n (%) | JD n (%) | All n (%) | p-Value of the Chi-Squared Test |
|---|---|---|---|---|---|---|
| Tables and figures in results section: | ||||||
| Basic characteristics reported in a table | 35 (87.5) | 27 (77.5) | 27 (67.5) | 12 (30.0) | 101 (63.1) | <0.001 |
| Total number of participants provided | 27 (67.5) | 9 (22.5) | 12 (30.0) | 7 (17.5) | 55 (34.4) | <0.001 |
| Statistics, tests and methods identified | 34 (85.0) | 17 (42.5) | 20 (50.0) | 20 (50.0) | 91 (56.9) | <0.001 |
Presentation issues:
| 2 (5.0) 16 (40.0) 22 (55.0) | 6 (15.0) 14 (35.0) 20 (50.0) | 10 (25.0) 18 (45.0) 12 (30.0) | 10 (25.0) 20 (50.0) 10 (25.0) | 28 (17.5) 68 (42.5) 64 (40.0) | 0.029 |
| Materials and methods section | ||||||
| Statistical analysis subsection provided | 37 (92.5) | 37 (92.5) | 30 (75.0) | 28 (70.0) | 132 (82.5) | 0.011 |
| Variables identified | 23 (57.5) | 35 (87.5) | 22 (55.0) | 22 (55.0) | 102 (63.7) | 0.005 |
| Assumptions verified | 14 (35.0) | 14 (35.0) | 11 (27.5) | 15 (37.5) | 54 (33.8) | 0.858 |
| Software reported | 32 (80.0) | 31 (77.5) | 29 (72.5) | 31 (77.5) | 123 (76.9) | 0.911 |
| References to statistical literature | 14 (35.0) | 25 (62.5) | 14 (35.0) | 11 (27.5) | 64 (40.0) | 0.008 |
| Software reported | 32 (80.0) | 31 (77.5) | 29 (72.5) | 31 (77.5) | 123 (76.9) | 0.911 |
| Total number of articles | 40 | 40 | 40 | 40 | 160 |
© 2020 by the author. Licensee MDPI, Basel, Switzerland. This article is an open access article distributed under the terms and conditions of the Creative Commons Attribution (CC BY) license (http://creativecommons.org/licenses/by/4.0/).
Share and Cite
Nieminen, P. Ten Points for High-Quality Statistical Reporting and Data Presentation. Appl. Sci. 2020, 10, 3885. https://doi.org/10.3390/app10113885
Nieminen P. Ten Points for High-Quality Statistical Reporting and Data Presentation. Applied Sciences. 2020; 10(11):3885. https://doi.org/10.3390/app10113885
Chicago/Turabian StyleNieminen, Pentti. 2020. "Ten Points for High-Quality Statistical Reporting and Data Presentation" Applied Sciences 10, no. 11: 3885. https://doi.org/10.3390/app10113885
APA StyleNieminen, P. (2020). Ten Points for High-Quality Statistical Reporting and Data Presentation. Applied Sciences, 10(11), 3885. https://doi.org/10.3390/app10113885