A Site-Specific Response Analysis: A Case Study in Hanoi, Vietnam

 , ,
, ,
Abstract
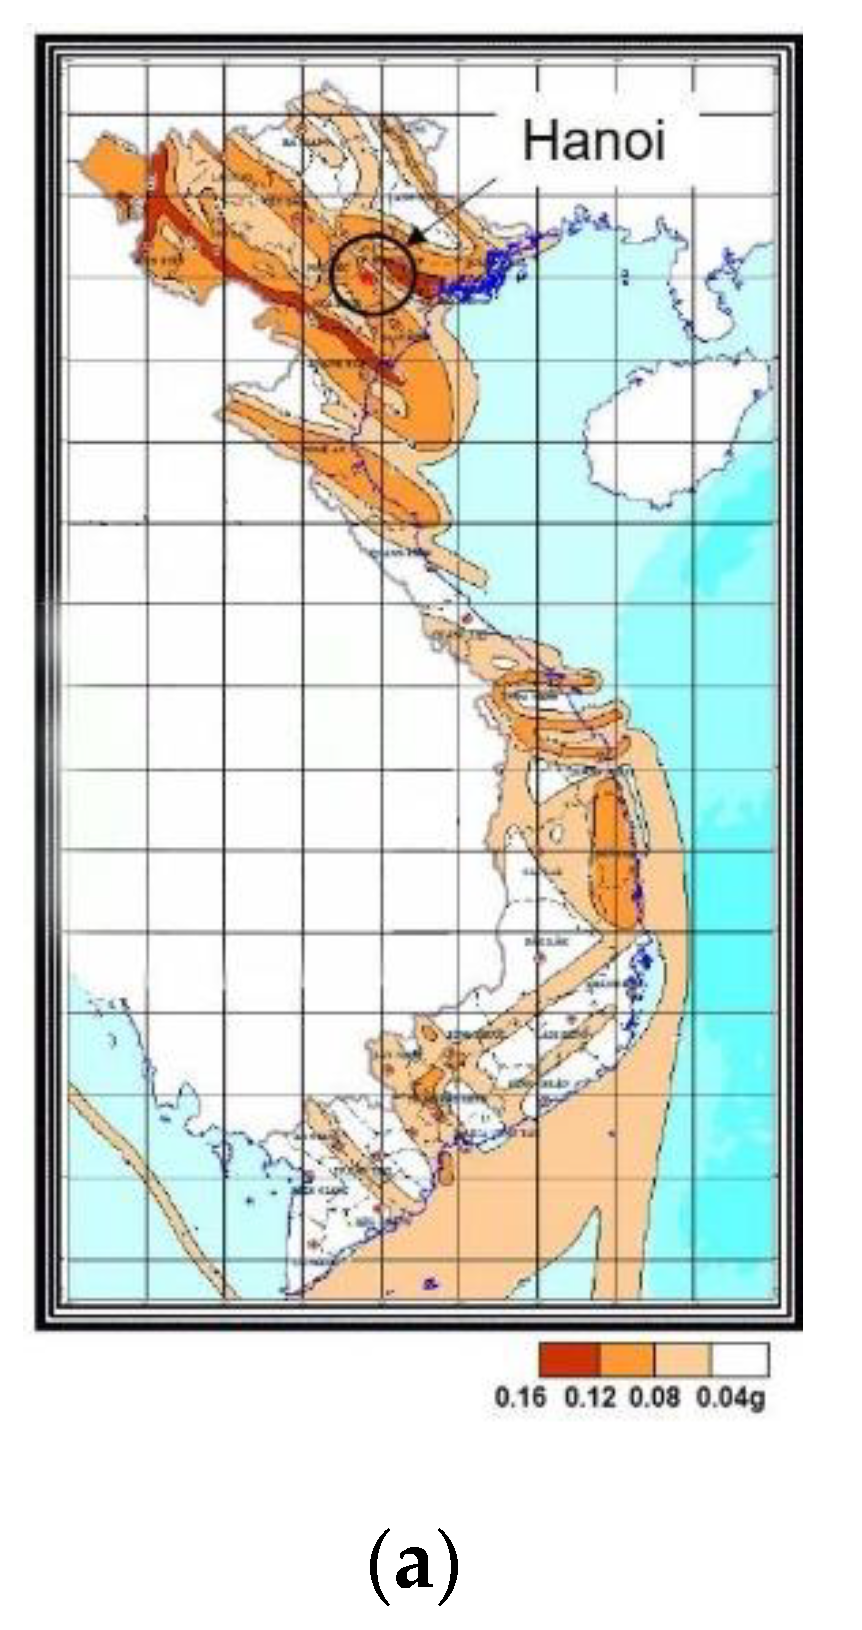
:1. Introduction
2. An Insight of the Vietnamese Seismic Design Code TCVN 9386: 2012
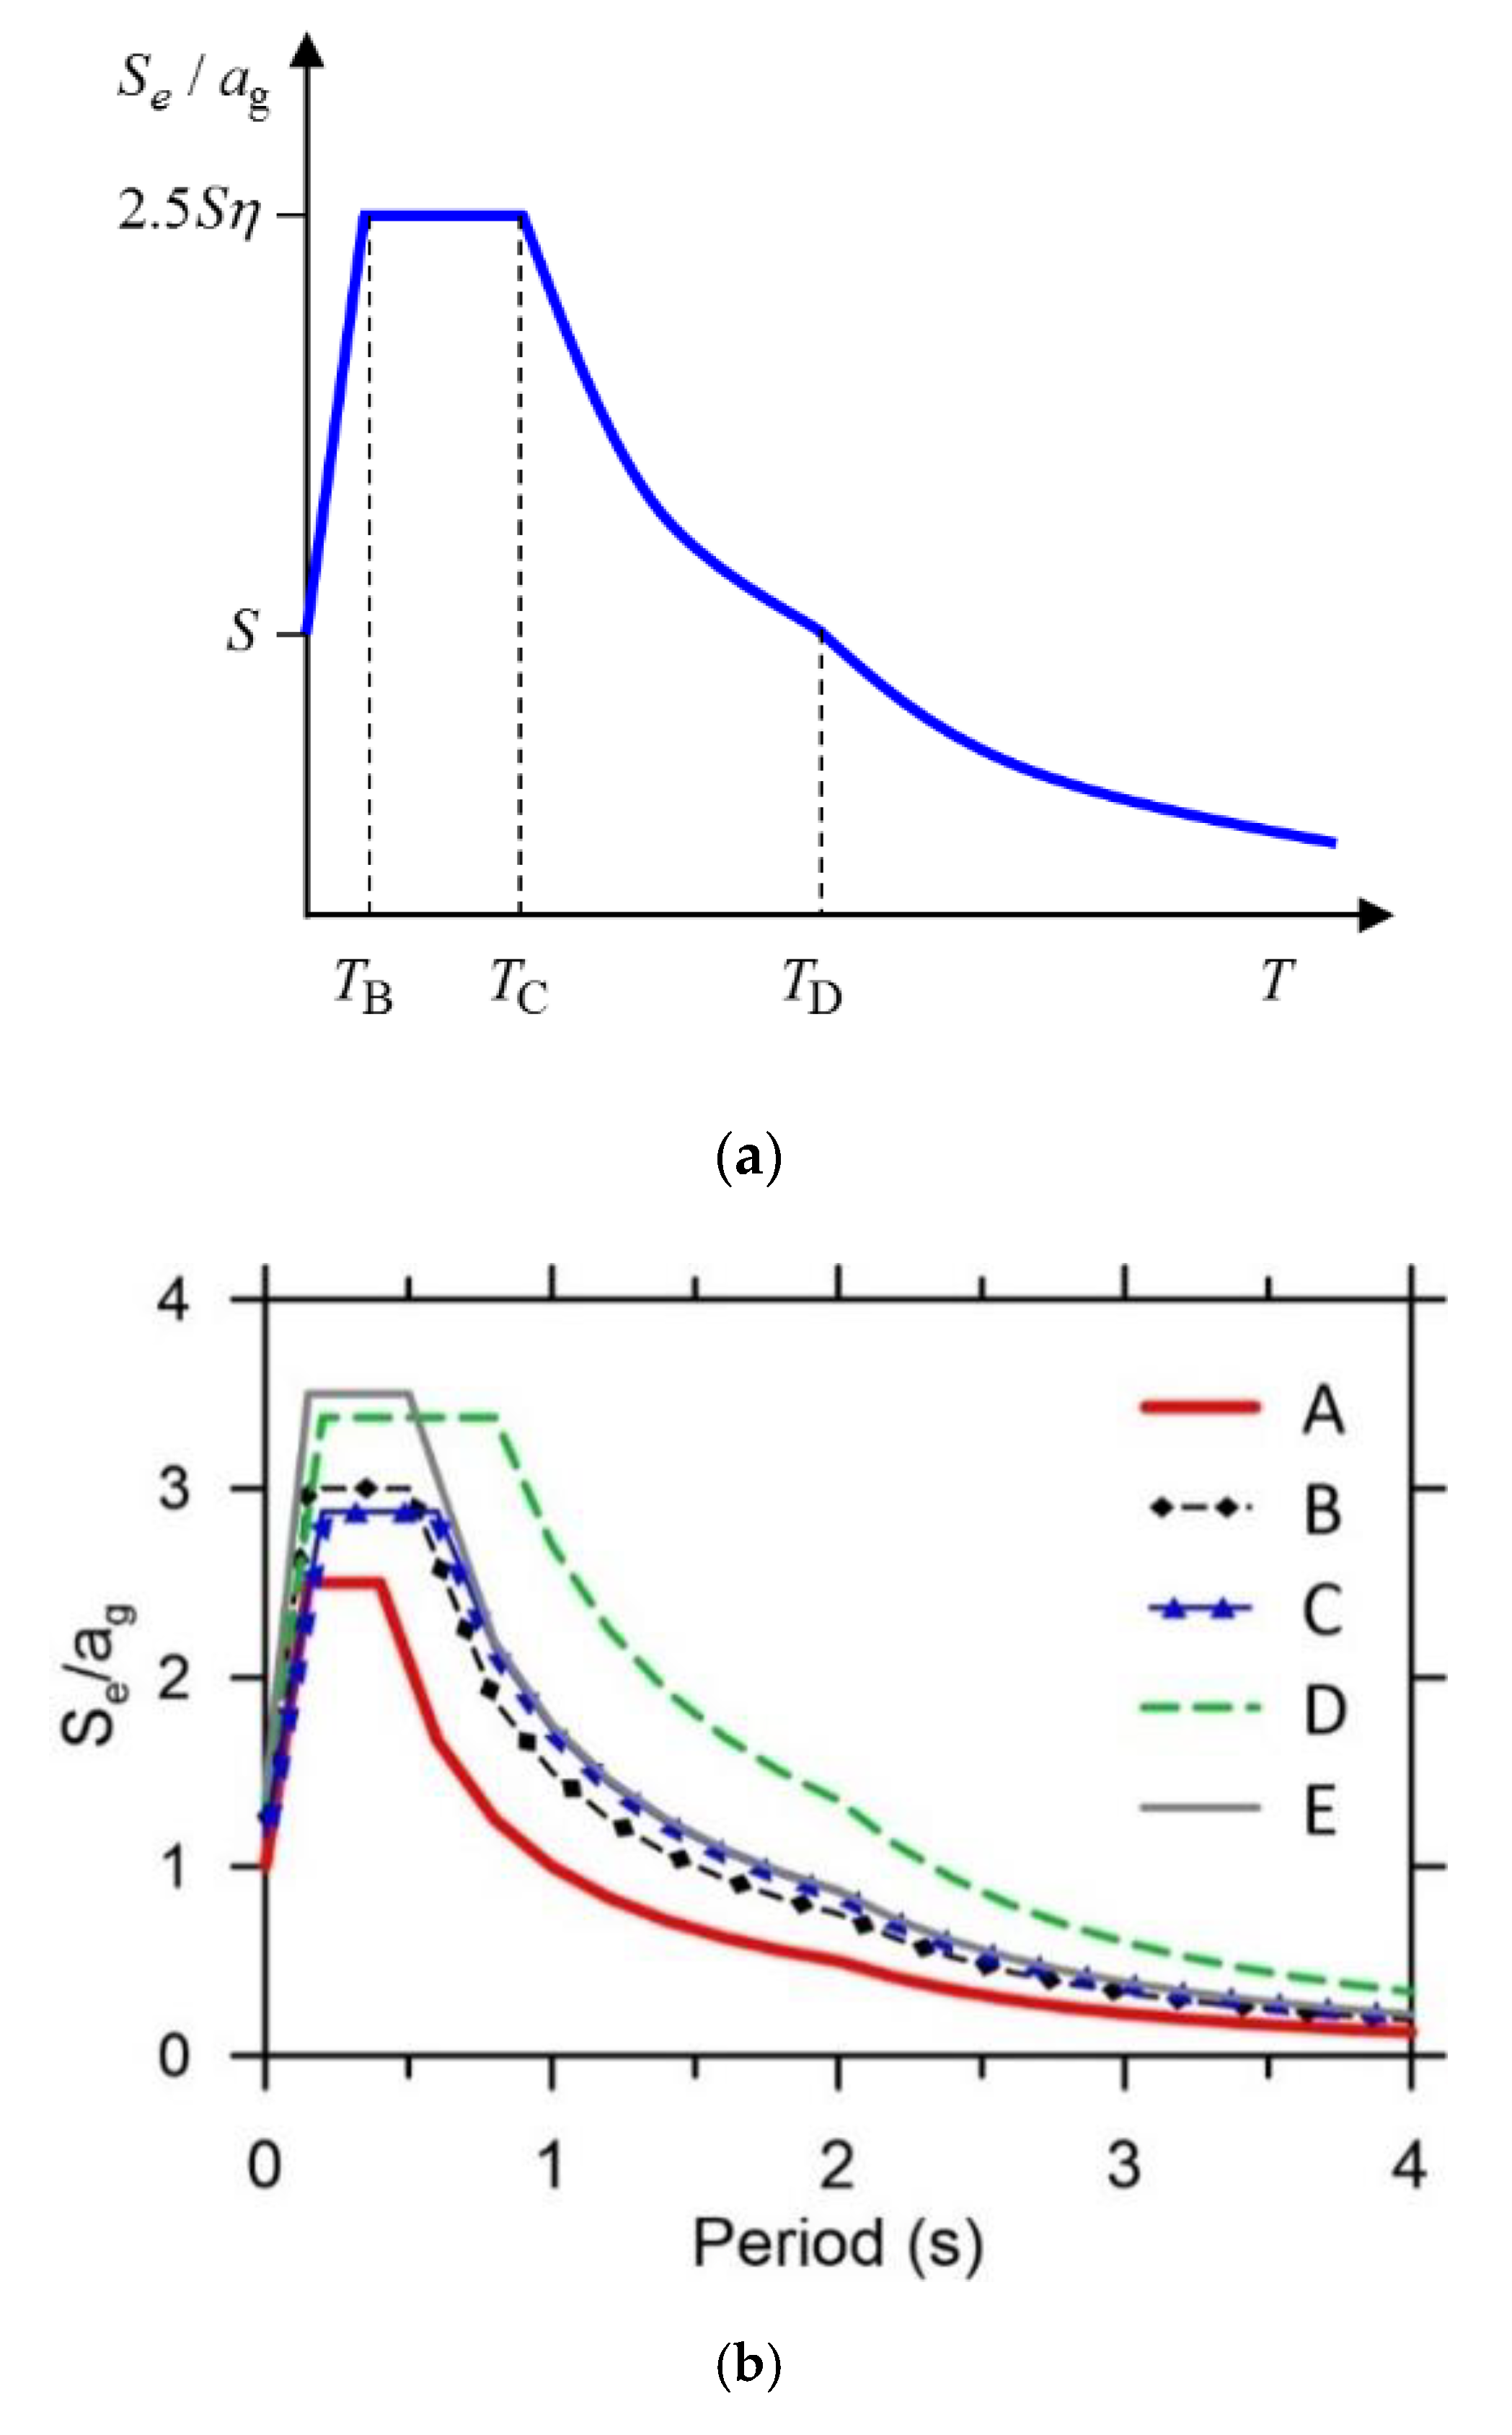
- : is the elastic response spectrum.
- : is the vibration period of a linear single-degree-of-freedom system.
- : is the design ground acceleration on type A ground ().
- : is the lower limit of the period of the constant spectral acceleration branch.
- : is the upper limit of the period of the constant spectral acceleration branch.
- : is the value defining the beginning of the constant displacement response range of the spectrum.
- : is the soil factor.
- : is the damping correction factor with a reference value of η = 1 for viscous damping ξ = 5%
3. Site Response Analysis Methodology
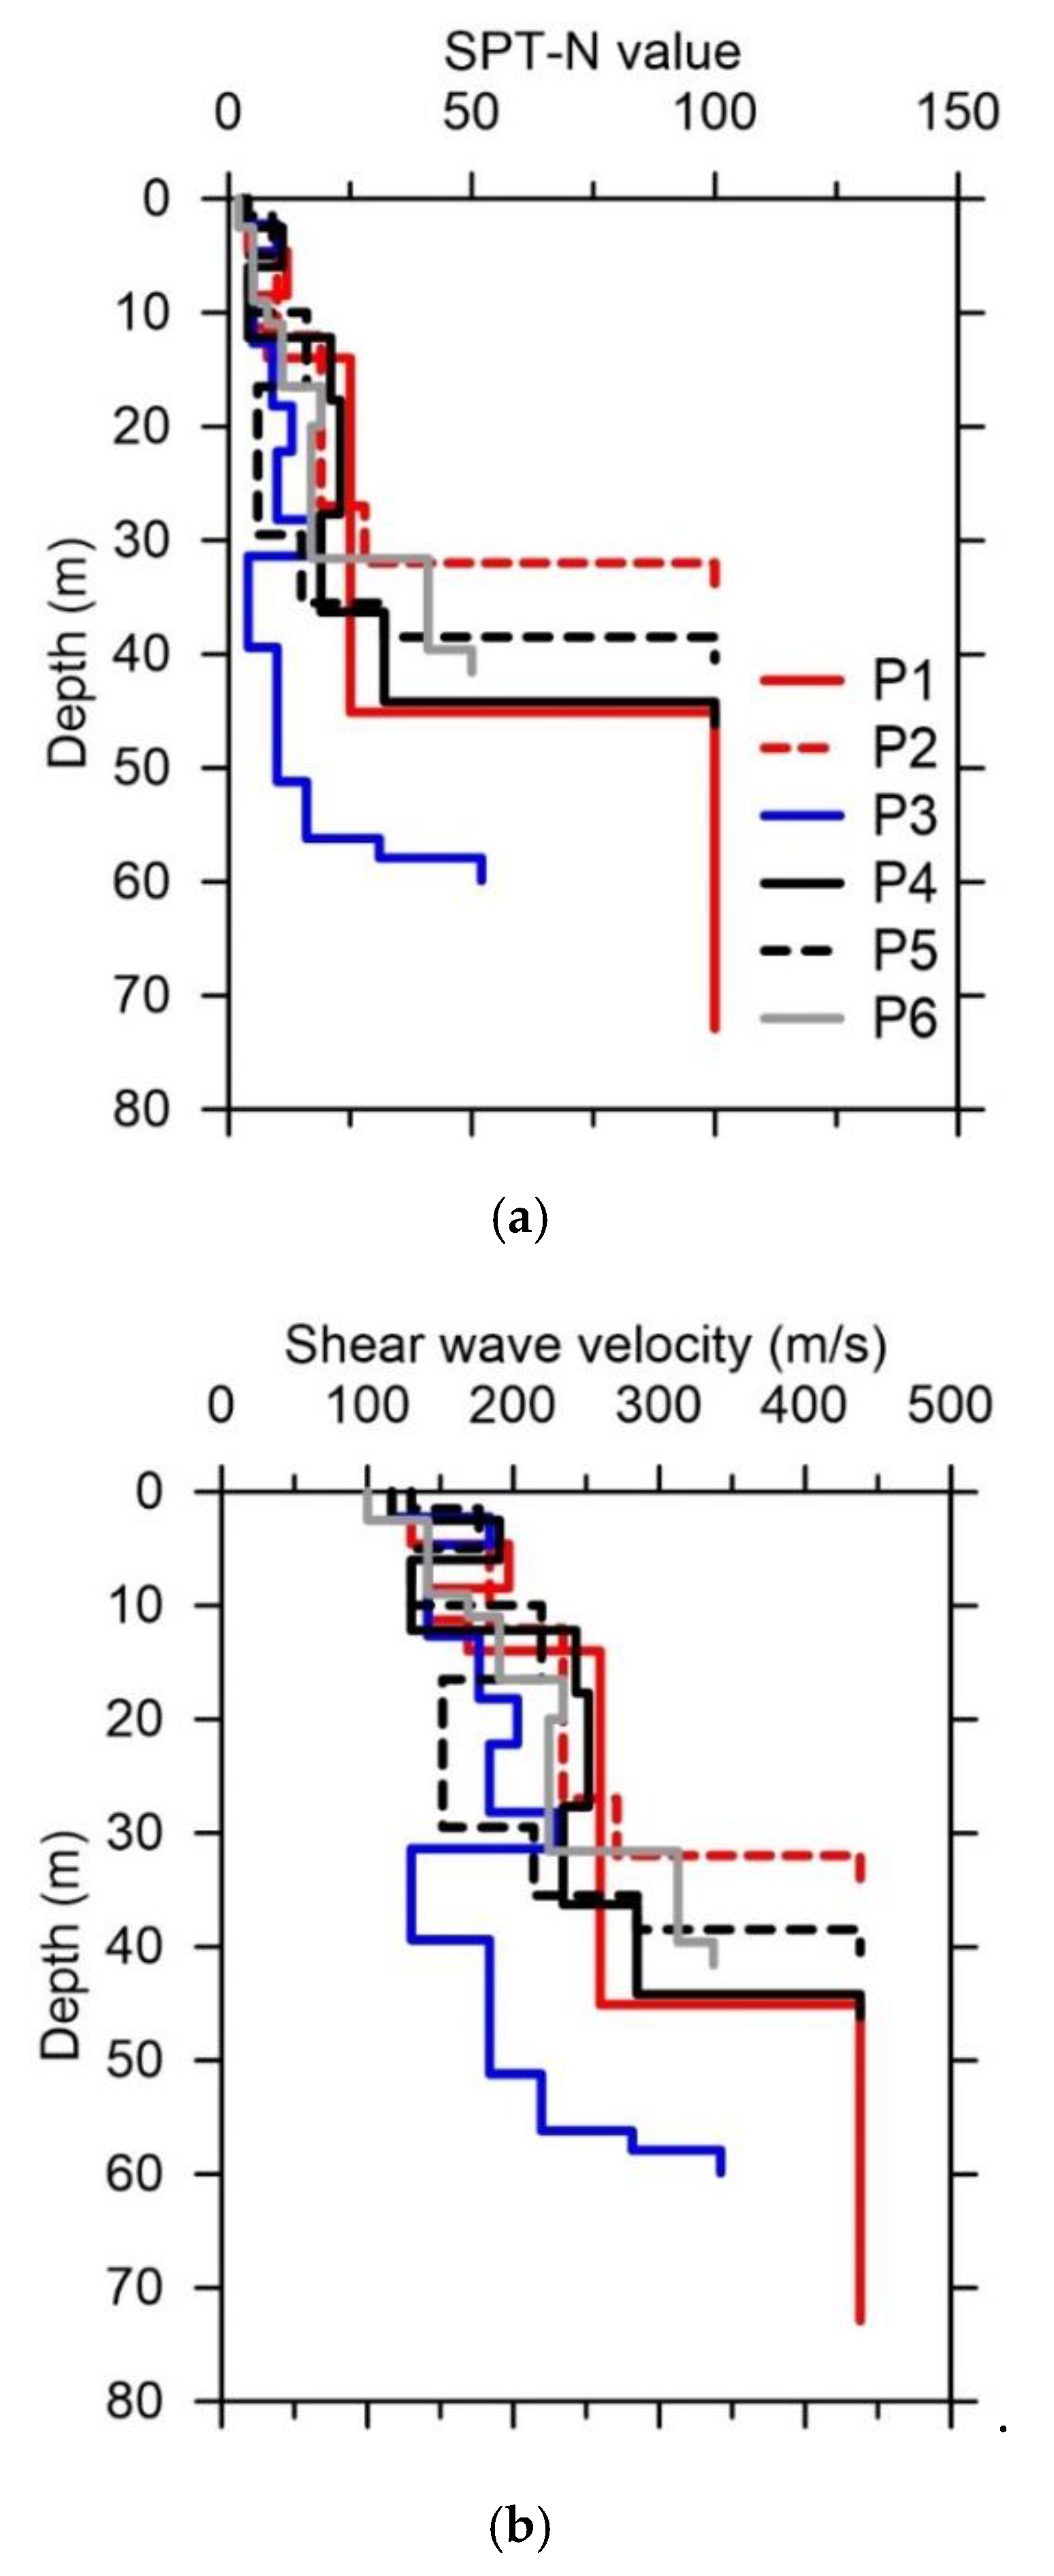
3.1. Soil Profiles
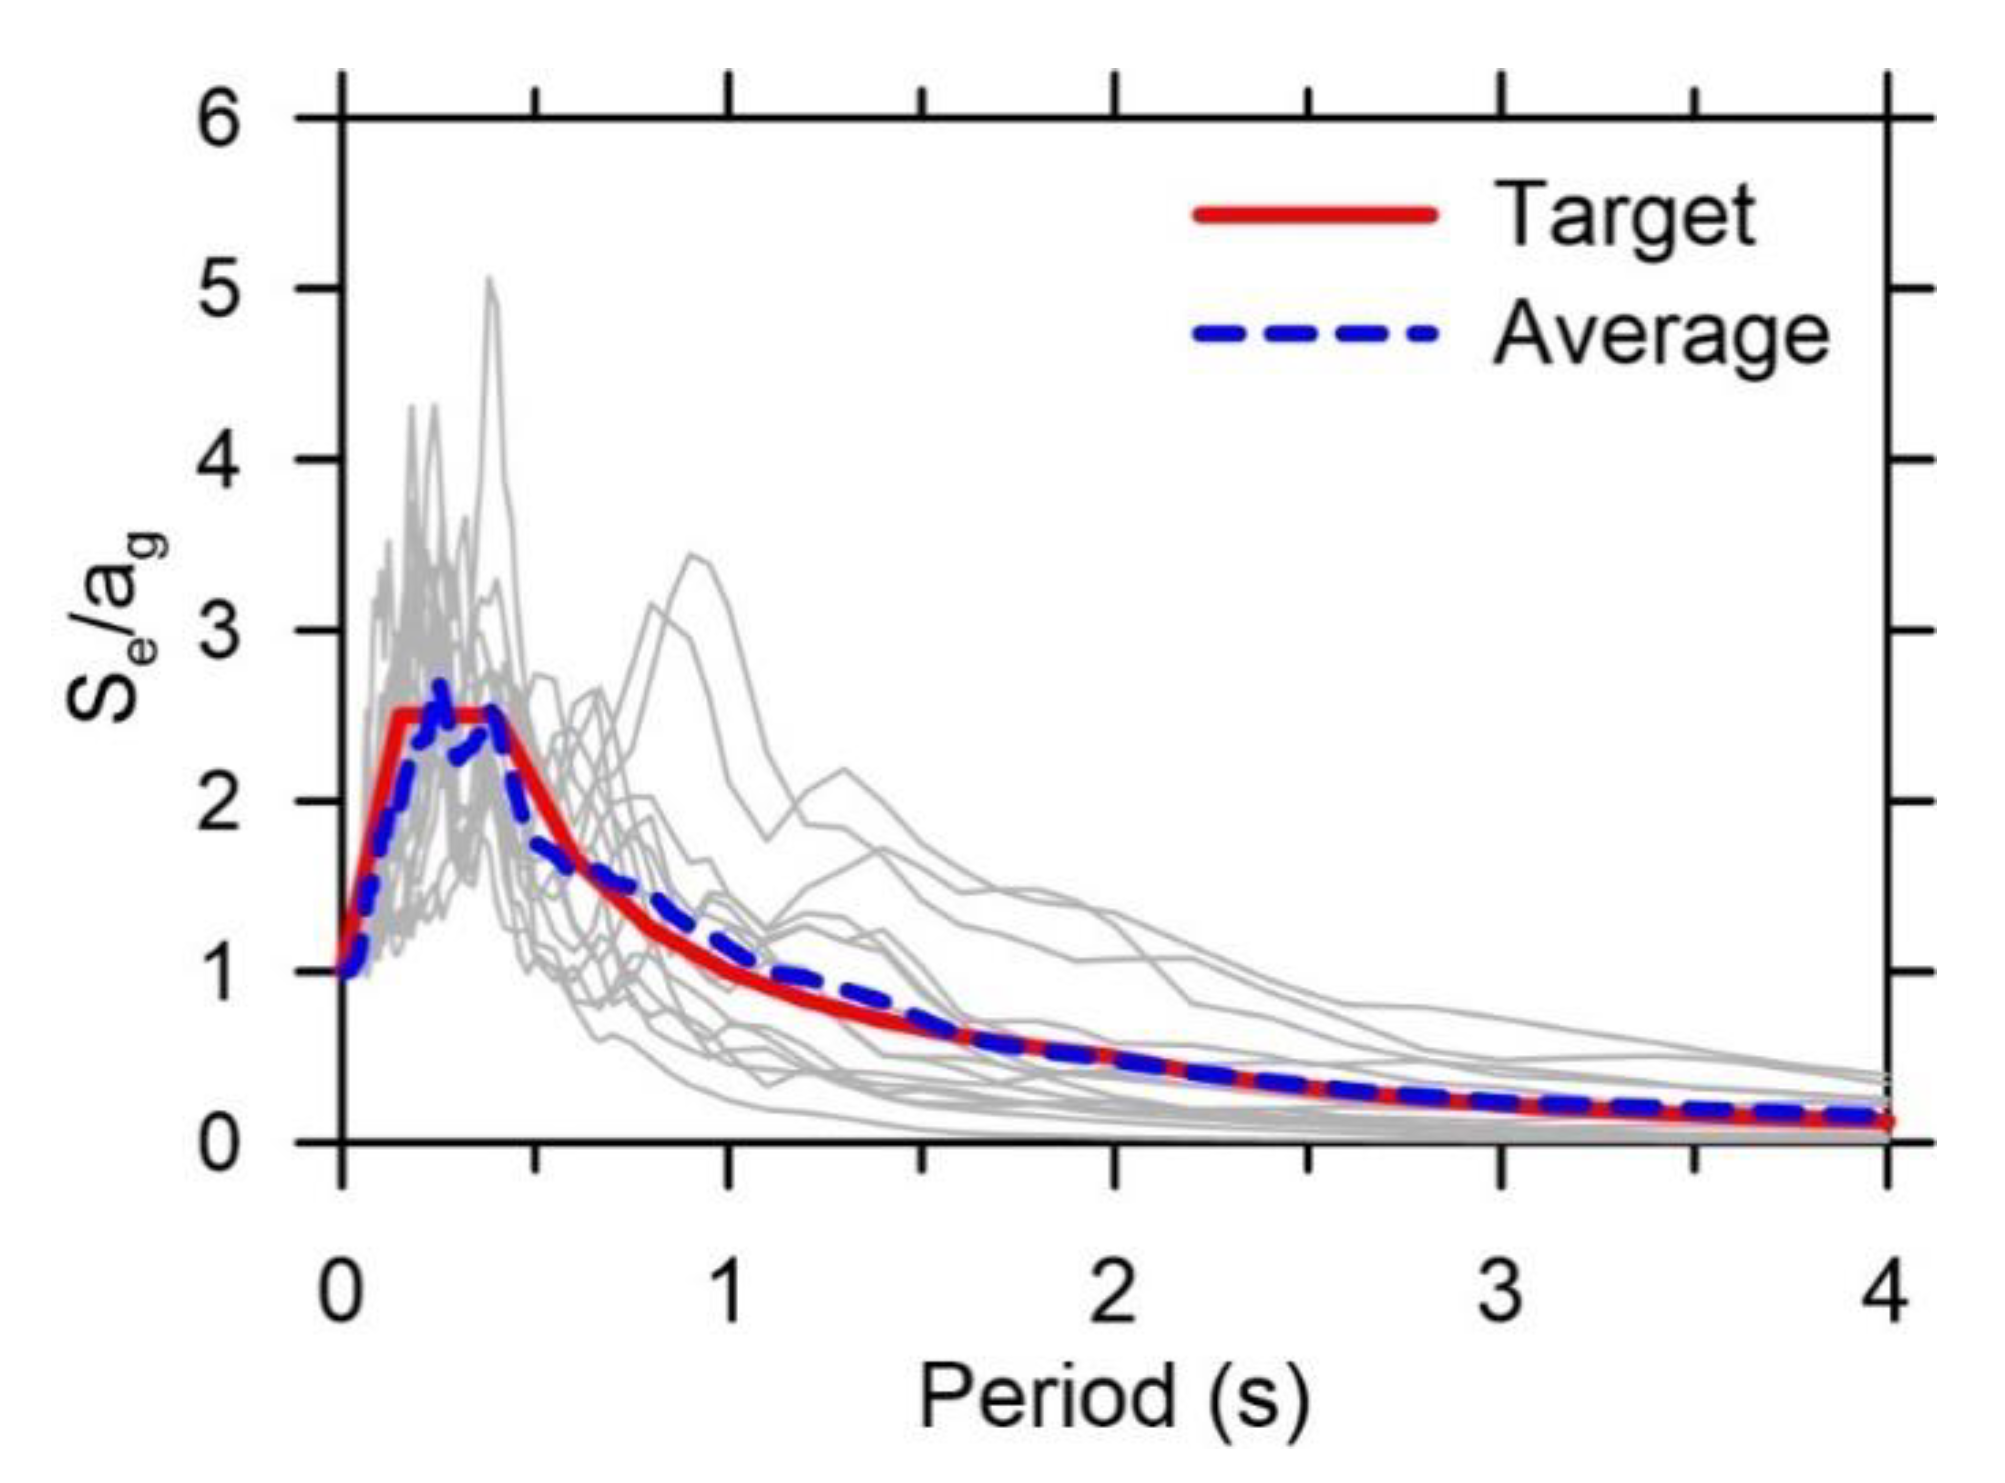
3.2. Input Ground Motions
- A range of moment magnitudes (Mw) 5.5–7.0.
- Rupture distance (Rrup) 0.92–85.17 km.
- VS30 of 760–1500 m/s.
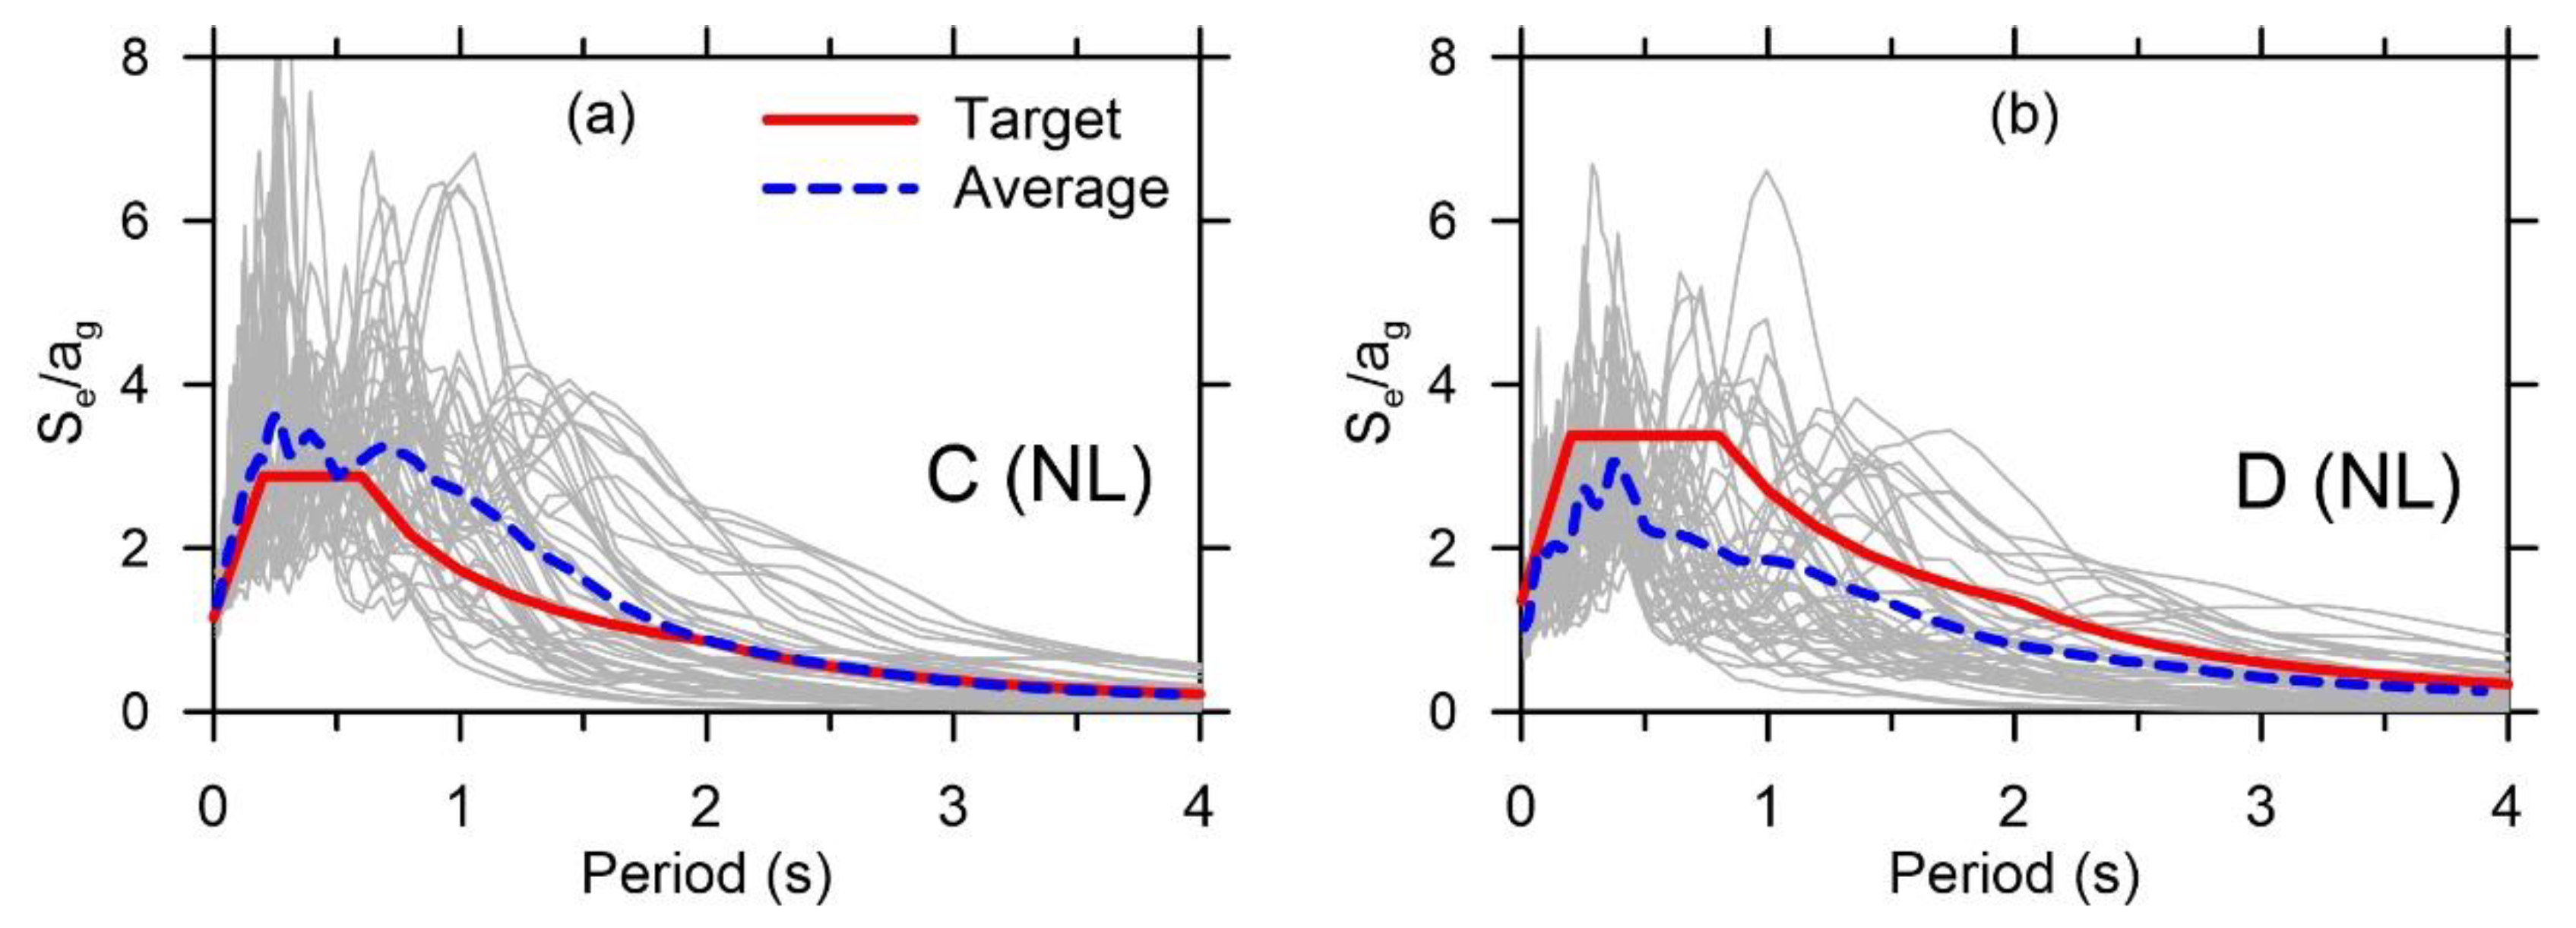
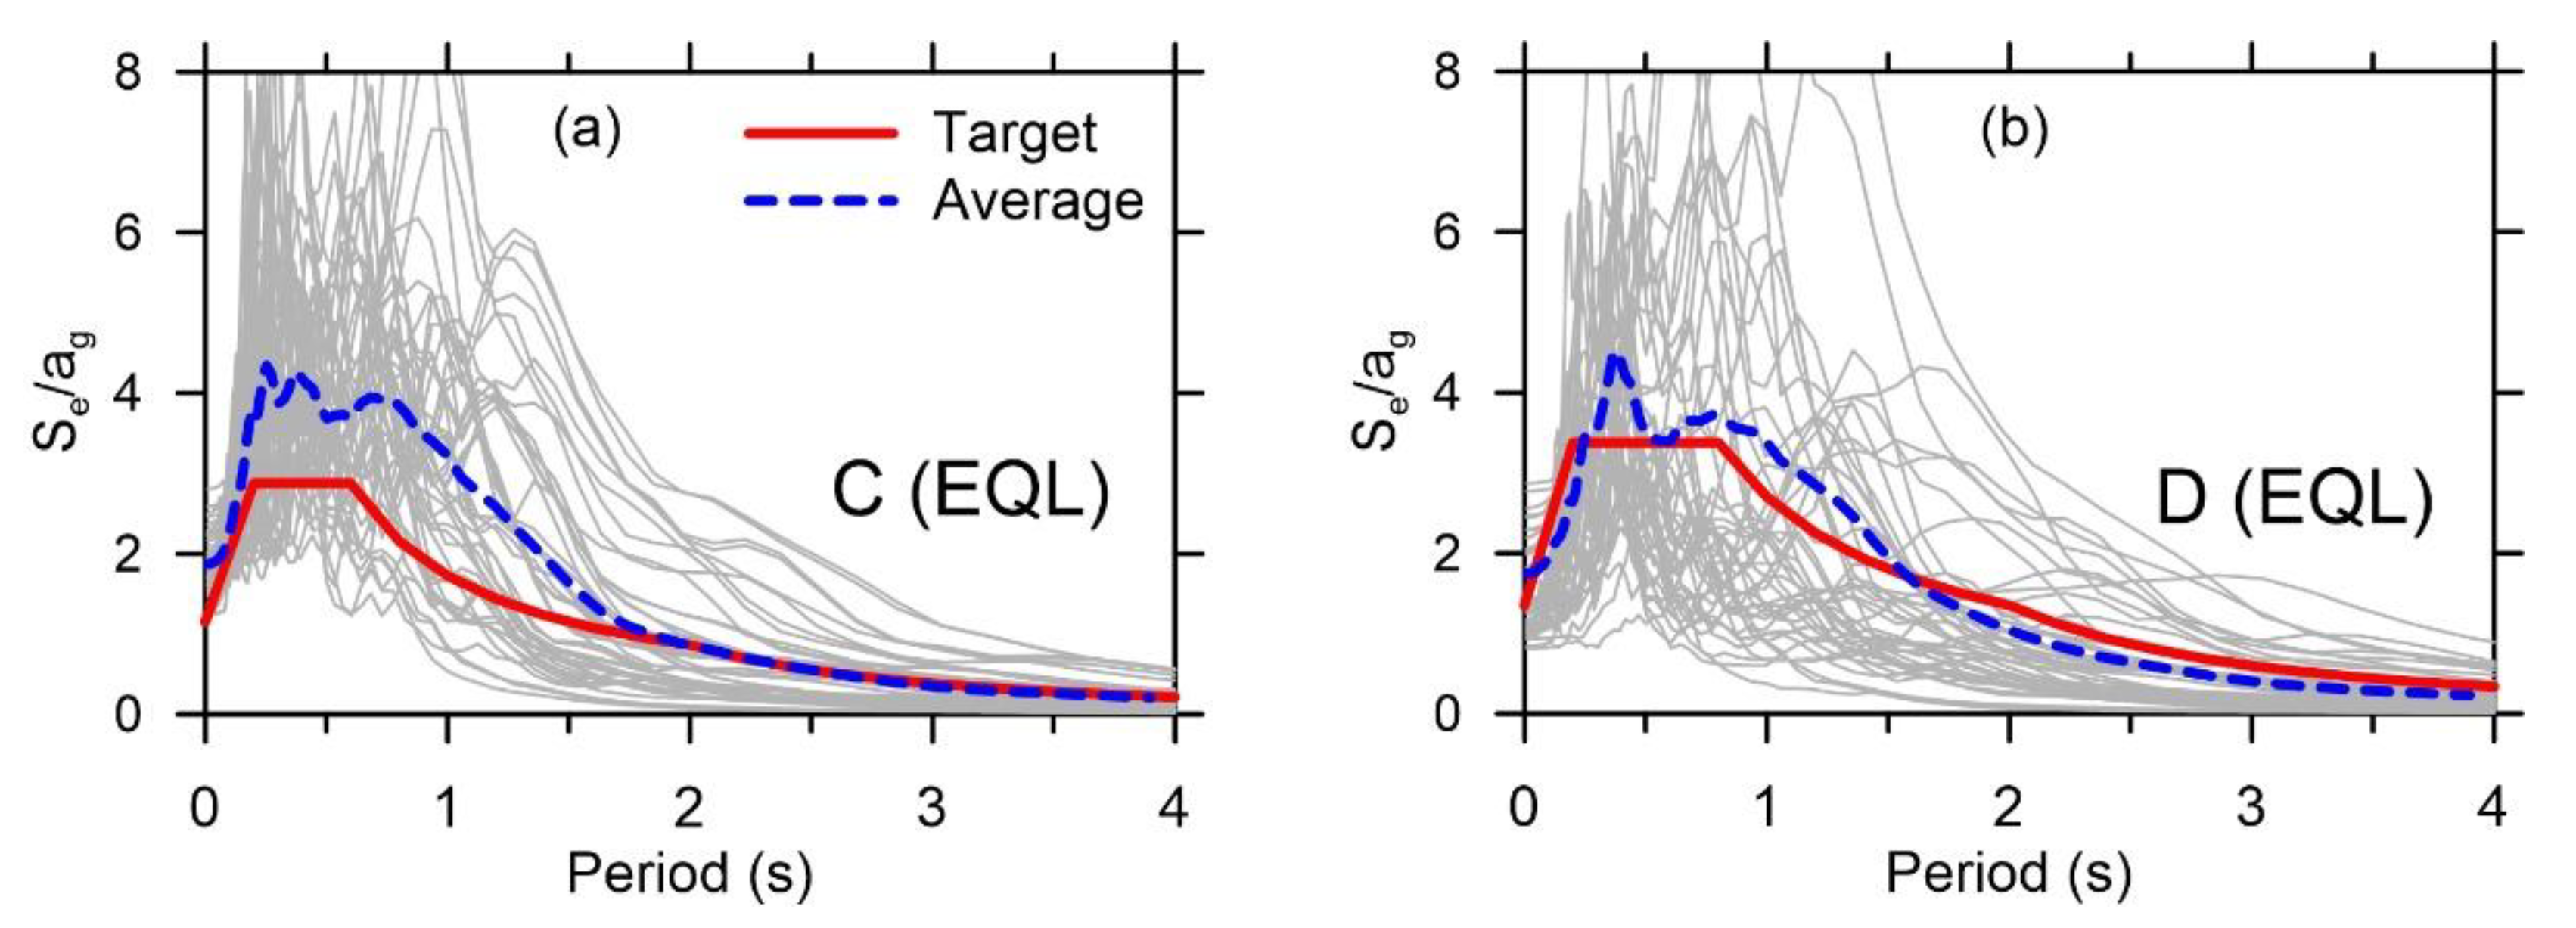
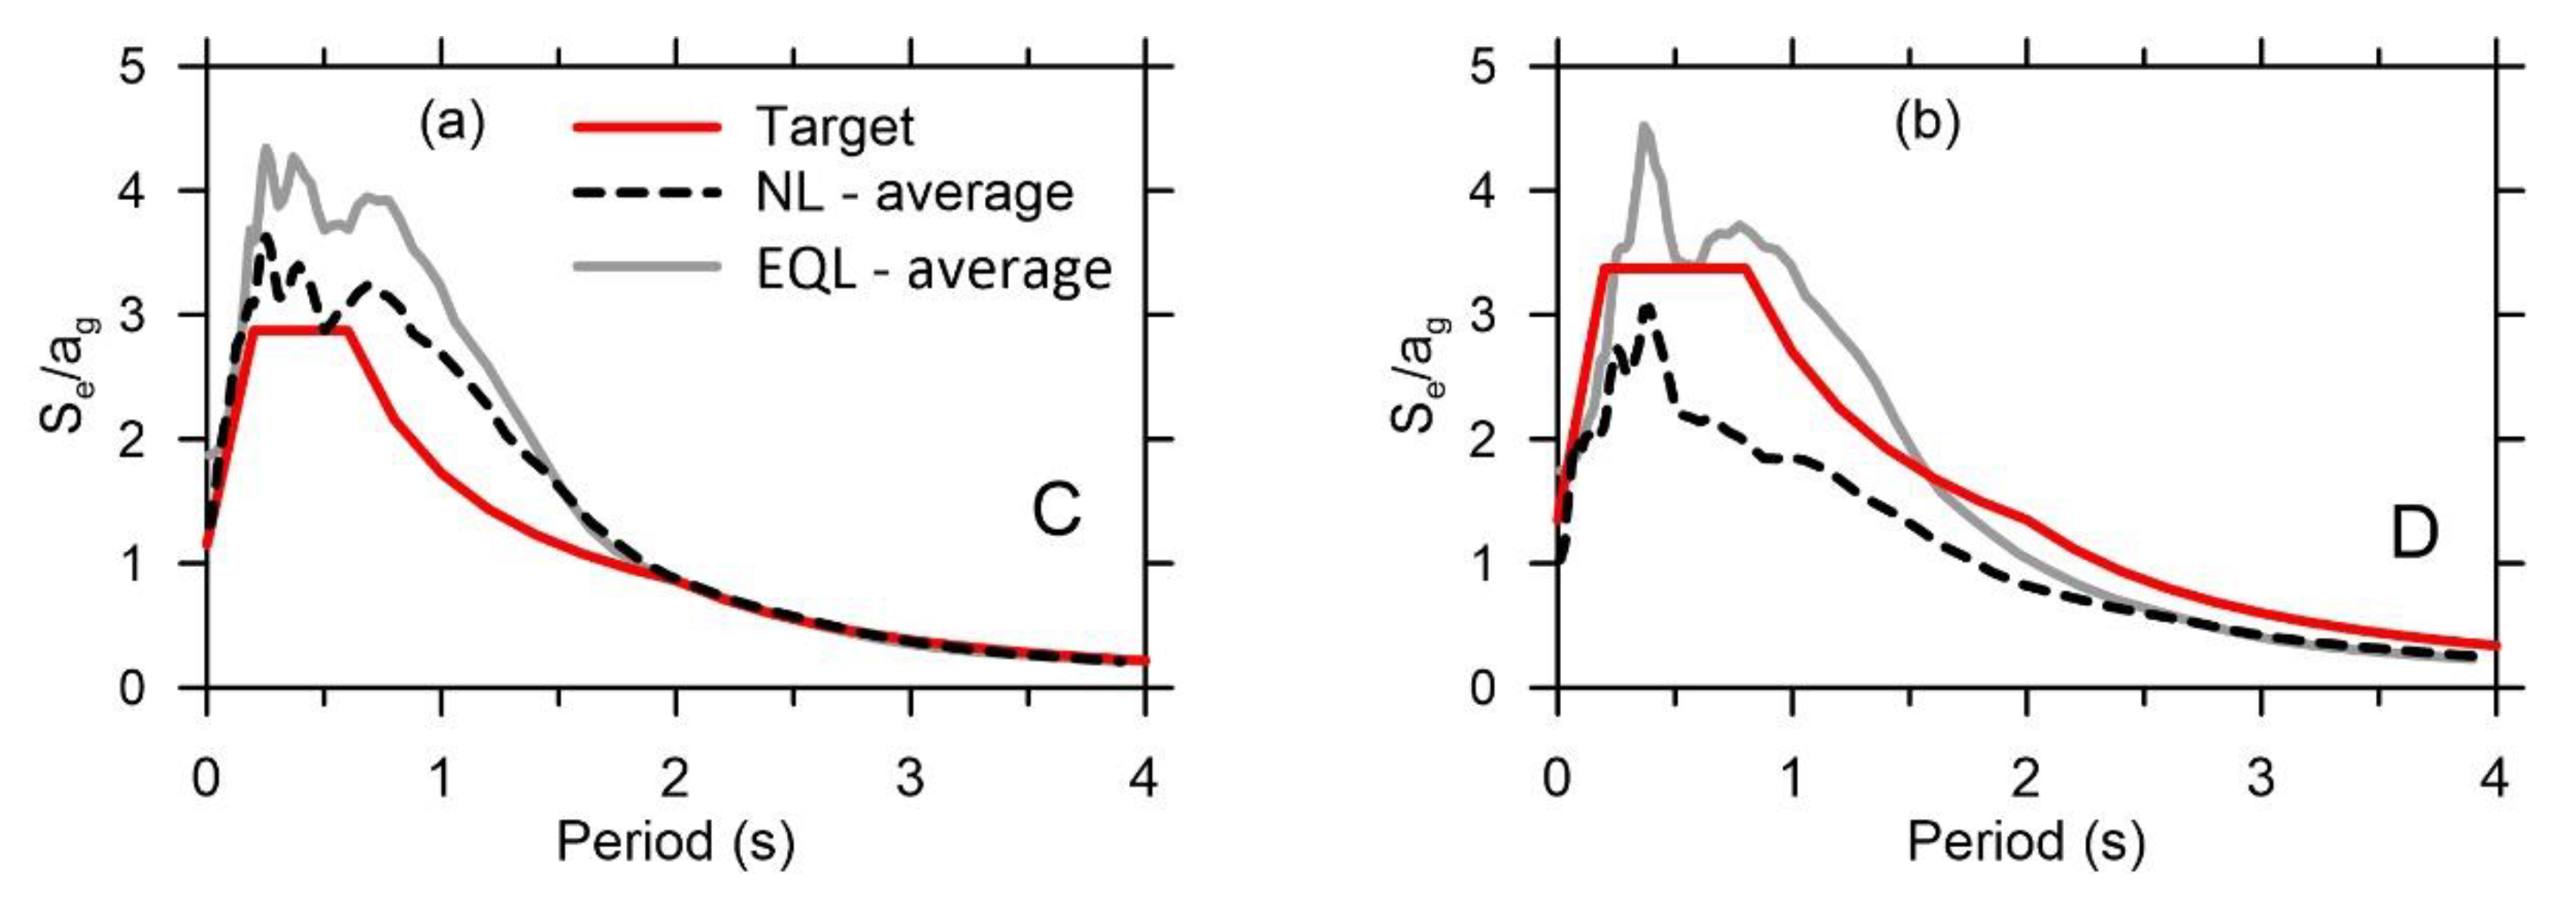
4. Spectral Shapes
5. Maximum Shear Strain and PGA
5.1. Maximum Shear Strain
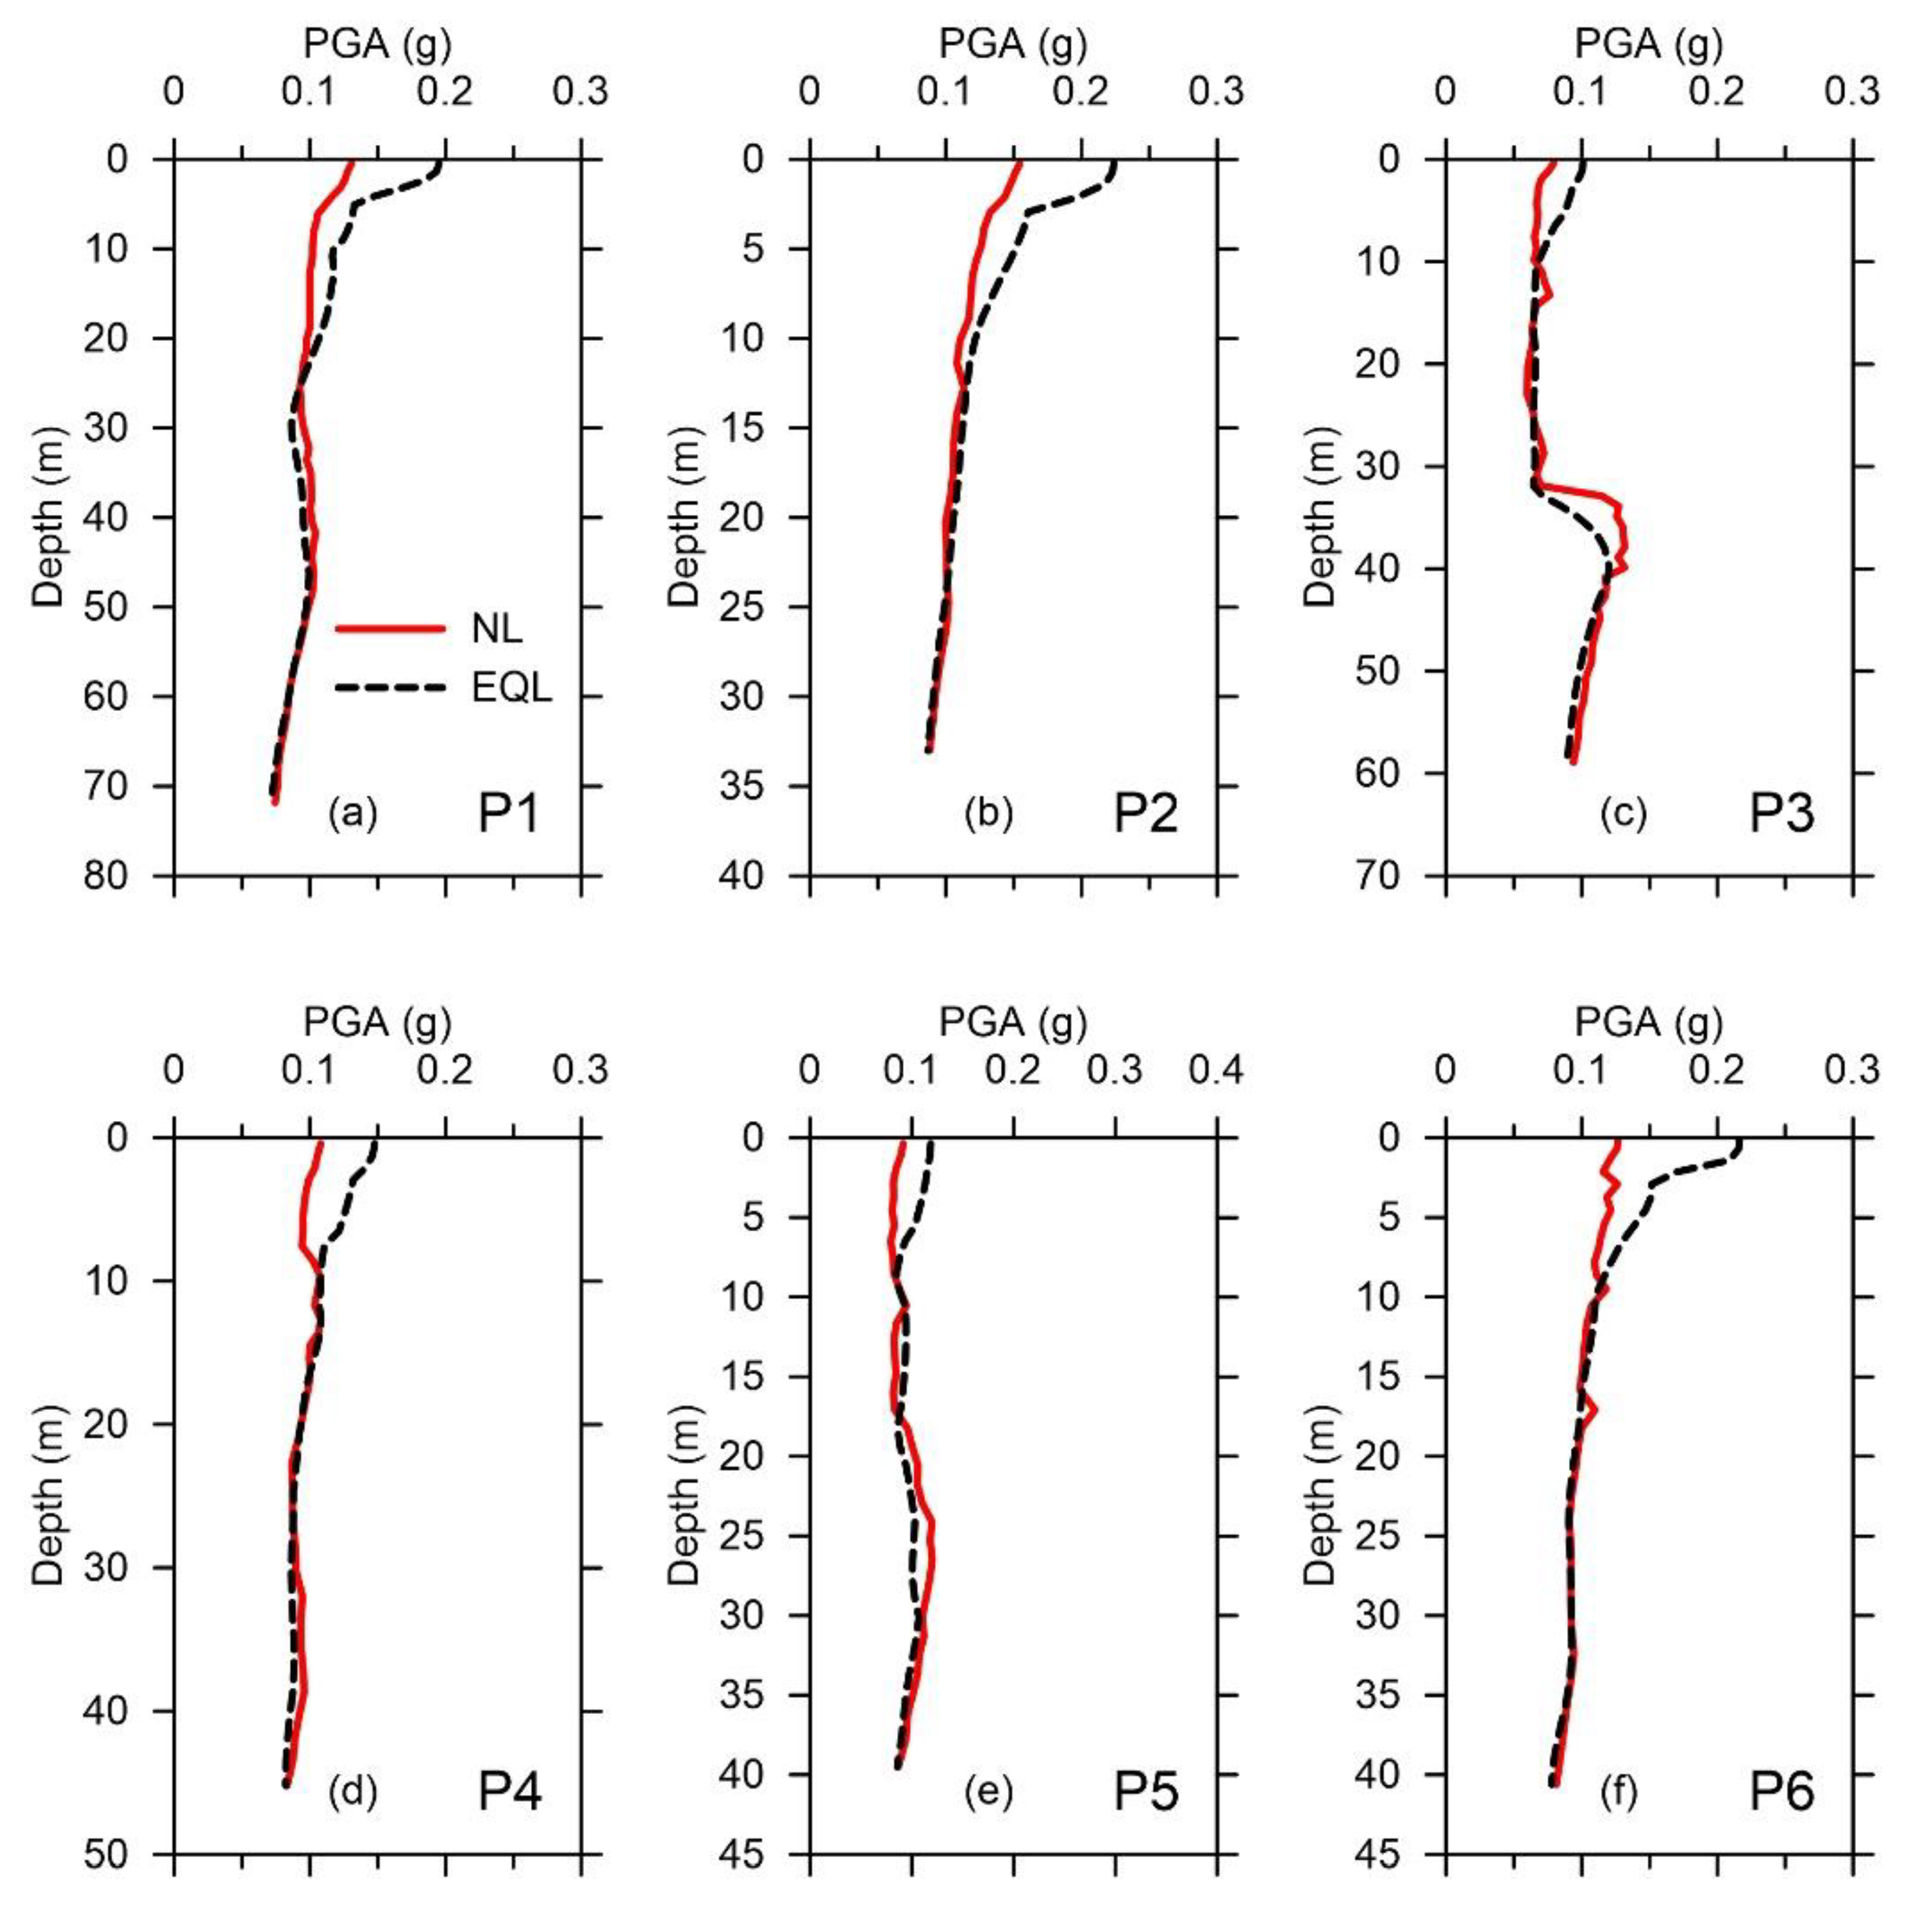
5.2. Maximum PGA
6. Conclusions
Author Contributions
Funding
Acknowledgments
Conflicts of Interest
References
- Kramer, S.L. Geotechnical Earthquake Engineering; Prentice-Hall: Upper Saddle River, NJ, USA, 1996. [Google Scholar]
- Tapponnier, P.; Lacassin, R.; Leloup, P.H.; Schärer, U.; Dalai, Z.; Haiwei, W.; Xiaohan, L.; Shaocheng, J.; Lianshang, Z.; Jiayou, Z. The Ailao Shan/Red River metamorphic belt: Tertiary left-lateral shear between Indochina and South China. Nature 1990, 343, 431. [Google Scholar] [CrossRef]
- Lin, T.-L.; Wu, Y.-M.; Huang, B.-S.; Chang, C.-H.; Huang, W.-G.; Le, T.S.; Nguyen, Q.C. The first peak ground motion attenuation relationships for North of Vietnam. J. Asian Earth Sci. 2012, 43, 241–253. [Google Scholar]
- Ngo, T.; Nguyen, M.; Nguyen, D. A review of the current Vietnamese earthquake design code. Spec. Issue Electron. J. Struct. Eng. (EJSE) Earthq. Eng. Low Moderate Seism. Reg. Southeast Asia Aust. 2008, 8, 32–41. [Google Scholar]
- Shylamoni, P.; Choudhury, D.; Ghosh, S.; Ghosh, A.; Basu, P.C. Seismic ground response analysis of KK-NPP site in the event of NCO earthquake using DEEPSOIL. In Proceedings of the Geo-Congress 2014: Geo-characterization and Modeling for Sustainability, Atlanta, GA, USA, 23–26 February 2014; pp. 840–849. [Google Scholar]
- Grasso, S.; Maugeri, M. The seismic microzonation of the city of Catania (Italy) for the maximum expected scenario earthquake of January 11, 1693. Soil Dyn. Earthq. Eng. 2009, 29, 953–962. [Google Scholar] [CrossRef]
- Naik, N.; Choudhury, D. site specific ground response analysis for typical sites in Panjim city, Goa. In Proceedings of the Indian Geotechnical Conference, Roorkee, India, 22–24 December 2013. [Google Scholar]
- Aaqib, M.; Sadiq, S.; Park, D.; Hashash, Y.M.; Pehlivan, M. Importance of implied strength correction for 1D site response at shallow sites at a moderate to low seismicity region. In Proceedings of the Geotechnical Earthquake Engineering and Soil Dynamics V, Austin, TX, USA, 10–13 June 2018; pp. 445–453. [Google Scholar]
- Mahmood, K.; Farooq, K.; Memon, S.A. One dimensional equivalent linear ground response analysis—A case study of collapsed Margalla Tower in Islamabad during 2005 Muzaffarabad Earthquake. J. Appl. Geophys. 2016, 130, 110–117. [Google Scholar] [CrossRef] [Green Version]
- Nhung, B.T.; Phuong, N.H.; Nam, N.T. Assessment of earthquake-induced liquefaction hazard in urban areas of Hanoi city using LPI-based method. Vietnam J. Earth Sci. 2018, 40, 78–96. [Google Scholar] [CrossRef] [Green Version]
- Alexandr, G.; Chi, T.N. Liquefaction possibility of soil layers during earthquake in Hanoi. Int. J. GEOMATE 2017, 13, 148–155. [Google Scholar] [CrossRef]
- Alexandr, G.; Chi, T.N. The impact of earthquakes on the tunnel from hanoi metro system when the tunnel has a horseshoe shape cross-section. Int. J. Civ. Eng. Technol. 2019, 10, 79–86. [Google Scholar]
- Wen, K.-L.; Lin, C.-M.; Kuo, C.-H.; Phuong, N.H.; Hung, N.T.; Son, L.T. Site response analysis from microtremor survey in the Hanoi, Vietnam. In Proceedings of the Geophysics-Cooperation and Sustainable Development, Hanoi, Vietnam, 30 September 2012. [Google Scholar]
- TCVN9386:2012. TCVN 9386:2012—Design of Structures for Earthquake Resistances; Construction Publishing House: Hanoi, Vietnam, 2012. (In Vietnamese) [Google Scholar]
- Code, P. Eurocode 8: Design of structures for earthquake resistance-part 1: General rules, seismic actions and rules for buildings. In Brussels European Commission Standard; CEN: Brussels, Belgium, 2005. [Google Scholar]
- Xuyen, N.D. Research and Forecasting Earthquakes and Ground Movements in Vietnam; Vietnam Institute of Geophysics: Hanoi, Vietnam, 2005. (In Vietnamese) [Google Scholar]
- Hashash, Y.; Musgrove, M.; Harmon, J.; Ilhan, O.; Groholski, D.; Phillips, C.; Park, D. DEEPSOIL 7.0, User Manual; University of Illinois at Urbana-Champaign: Springfield, IL, USA, 2017. [Google Scholar]
- Matasović, N.; Vucetic, M. Cyclic characterization of liquefiable sands. J. Geotech. Eng.-ASCE 1993, 119, 1805–1822. [Google Scholar] [CrossRef]
- Darendeli, M.B. Development of a New Family of Normalized Modulus Reduction and Material Damping Curves. Ph.D. Thesis, University of Texas at Austin, Austin, TX, USA, 2001. [Google Scholar]
- Sadiq, S.; Nguyen, V.Q.; Jung, H.; Park, D. Effect of Flexibility Ratio on Seismic Response of Cut-and-Cover Box Tunnel. Adv. Civ. Eng. Mater. 2019, 2019. [Google Scholar] [CrossRef] [Green Version]
- Hashash, Y.M.; Dashti, S.; Musgrove, M.; Gillis, K.; Walker, M.; Ellison, K.; Basarah, Y.I. Influence of Tall Buildings on Seismic Response of Shallow Underground Structures. J. Geotech. Geoenviron. Eng. 2018, 144, 04018097. [Google Scholar] [CrossRef]
- Ding, Y.; Wang, G.; Yang, F. Parametric investigation on the effect of near-surface soil properties on the topographic amplification of ground motions. Eng Geol. 2020, 273, 105687. [Google Scholar] [CrossRef]
- Harmon, J.; Hashash, Y.M.; Stewart, J.P.; Rathje, E.M.; Campbell, K.W.; Silva, W.J.; Xu, B.; Musgrove, M.; Ilhan, O. Site Amplification Functions for Central and Eastern North America—Part I: Simulation Data Set Development. Earthq. Spectra 2019, 35, 787–814. [Google Scholar] [CrossRef]
- Nguyen, D.-D.; Park, D.; Shamsher, S.; Nguyen, V.-Q.; Lee, T.-H. Seismic vulnerability assessment of rectangular cut-and-cover subway tunnels. Tunn. Undergr. Space Technol. 2019, 86, 247–261. [Google Scholar] [CrossRef]
- Nguyen, D.-D.; Lee, T.-H.; Nguyen, V.-Q.; Park, D. Seismic damage analysis of box metro tunnels accounting for aspect ratio and shear failure. Appl. Sci. 2019, 9, 3207. [Google Scholar] [CrossRef] [Green Version]
- Jacky, J. Pressure in soils. In Proceedings of the 2nd International Conference of Soil Mechanic and Foundation Engineering, Rotterdam, The Netherlands, 21–30 June 1948. [Google Scholar]
- Marto, A.; Tan, C.S.; Leong, T.K. Universal correlation of shear wave velocity and standard penetration resistance. Electron. J. Geotech. Eng. 2013, 18, 2727–2738. [Google Scholar]
- Trung, G.K.; Vinh, N.D.; Men, D.T. Soil Classification and Seismic Site Response Analysis for Some Areas in Hanoi City. VNU J. Sci. Earth Envr. Sci. 2018, 34. [Google Scholar] [CrossRef] [Green Version]
- Moghadam, M.R.; Baziar, M.H. Seismic ground motion amplification pattern induced by a subway tunnel: Shaking table testing and numerical simulation. Soil Dyn. Earthq. Eng. 2016, 83, 81–97. [Google Scholar] [CrossRef]
- Rathje, E.; Kottke, A. Relative differences between equivalent linear and nonlinear site response methods. In Proceedings of the 5th International Conference on Earthquake Geotechnical Engineering, Santiago, Chile, 10–13 January 2011; pp. 10–13. [Google Scholar]
- Kim, B.; Hashash, Y.M.; Stewart, J.P.; Rathje, E.M.; Harmon, J.A.; Musgrove, M.I.; Campbell, K.W.; Silva, W.J. Relative differences between nonlinear and equivalent-linear 1-D site response analyses. Earthq. Spectra 2016, 32, 1845–1865. [Google Scholar] [CrossRef]
- Kaklamanos, J.; Baise, L.G.; Thompson, E.M.; Dorfmann, L. Comparison of 1D linear, equivalent-linear, and nonlinear site response models at six KiK-net validation sites. Soil Dyn. Earthq. Eng. 2015, 69, 207–219. [Google Scholar] [CrossRef]


| Importance Class | Buildings | Recommended Importance Factor, γI |
|---|---|---|
| I | Building of minor importance for public safety, e.g., agricultural building, etc. | 0.8 |
| II | Ordinary building, not belonging in the other categories | 1.0 |
| III | Building whose seismic resistance is of importance in view of the consequences associated with a collapse, e.g., schools, assembly halls, cultural institutions, etc. | 1.2 |
| IV | Building whose integrity during earthquakes is of vital importance of civil protection, e.g., hospitals, fire stations, power plants, etc. | 1.4 |
| Importance Class | Buildings | Recommended Importance Factor, γI |
|---|---|---|
| Special | The building has special importance, not allowing any damage by the earthquake. | Designed with maximum possible acceleration |
| I | The building has vital importance for the protection of the community, its function must not be interrupted during the earthquake. | 1.25 |
| II | The building has an importance in preventing earthquake consequences, if collapsed causing great loss of life and property. | 1.0 |
| III | The building does not belong to importance classes: special, I, II, and IV. | |
| IV | The building has minor importance for the safety of human life. | 0.75 |
| Ground Type | S | TB (s) | TC (s) | TD (s) |
|---|---|---|---|---|
| A | 1.0 | 0.15 | 0.4 | 2.0 |
| B | 1.2 | 0.15 | 0.5 | 2.0 |
| C | 1.15 | 0.2 | 0.8 | 2.0 |
| D | 1.35 | 0.2 | 0.8 | 2.0 |
| E | 1.4 | 0.15 | 0.5 | 2.0 |
| Soil Profile | Soil Class (According to EC-8 and TCVN 9386: 2012) | Location | Notation |
|---|---|---|---|
| P1 | C | Cau Giay District (District 1) | 1-C |
| P2 | C | Cau Giay District | 1-C |
| P3 | D | Hoang Mai District (District 2) | 2-D |
| P4 | C | Hai Ba Trung District (District 3) | 3-C |
| P5 | D | Hai Ba Trung District | 3-D |
| P6 | D | Hai Ba Trung District | 3-D |
| No | Earthquake Name | Year | Station | Mag. (MW) | Mechanism | Rrup (Km) | VS30 (m/s) |
|---|---|---|---|---|---|---|---|
| 1 | San Fernando | 1971 | Pasadena—Old Seismo Lab | 6.61 | Reverse | 21.5 | 969.07 |
| 2 | Whittier Narrows-01 | 1987 | Pasadena—CIT Kresge Lab | 5.99 | Reverse | 18.12 | 969.07 |
| 3 | Loma Prieta | 1989 | Piedmont Jr High School Grounds | 6.93 | Reverse Oblique | 73 | 895.36 |
| 4 | Loma Prieta | 1989 | Point Bonita | 6.93 | Reverse Oblique | 83.45 | 1315.92 |
| 5 | Loma Prieta | 1989 | SF—Pacific Heights | 6.93 | Reverse Oblique | 75.96 | 1249.86 |
| 6 | Loma Prieta | 1989 | So. San Francisco_Sierra Pt. | 6.93 | Reverse Oblique | 63.15 | 1020.62 |
| 7 | Northridge-01 | 1994 | LA—Wonderland Ave | 6.99 | Reverse | 20.29 | 1222.52 |
| 8 | Northridge-01 | 1994 | Vasquez Rocks Park | 6.99 | Reverse | 23.64 | 996.43 |
| 9 | Chi-Chi_Taiwan-05 | 1999 | TTN042 | 6.20 | Reverse | 85.17 | 845.34 |
| 10 | Umbria-03_Italy | 1984 | Gubbio | 5.60 | Normal | 15.72 | 922 |
| 11 | Kobe_Japan | 1995 | Kobe University | 6.90 | Strike slip | 0.92 | 1043 |
| 12 | Chi-Chi_Taiwan-05 | 1999 | HWA002 | 6.20 | Reverse | 45.03 | 789.18 |
© 2020 by the authors. Licensee MDPI, Basel, Switzerland. This article is an open access article distributed under the terms and conditions of the Creative Commons Attribution (CC BY) license (http://creativecommons.org/licenses/by/4.0/).
Share and Cite
Nguyen, V.-Q.; Aaqib, M.; Nguyen, D.-D.; Luat, N.-V.; Park, D. A Site-Specific Response Analysis: A Case Study in Hanoi, Vietnam. Appl. Sci. 2020, 10, 3972. https://doi.org/10.3390/app10113972
Nguyen V-Q, Aaqib M, Nguyen D-D, Luat N-V, Park D. A Site-Specific Response Analysis: A Case Study in Hanoi, Vietnam. Applied Sciences. 2020; 10(11):3972. https://doi.org/10.3390/app10113972
Chicago/Turabian StyleNguyen, Van-Quang, Muhammad Aaqib, Duy-Duan Nguyen, Nguyen-Vu Luat, and Duhee Park. 2020. "A Site-Specific Response Analysis: A Case Study in Hanoi, Vietnam" Applied Sciences 10, no. 11: 3972. https://doi.org/10.3390/app10113972