Isometric Strength in Volleyball Players of Different Age: A Multidimensional Model

 , and
, and
Abstract
:1. Introduction
2. Materials and Methods
2.1. Testing Procedure
2.1.1. Isometric Handgrip Strength (HG)
2.1.2. Isometric Lumbar Extensors Strength (LB)
2.1.3. Isometric Ankle Extensors Strength (AE)
2.2. Statistical Analysis
3. Results
4. Discussion
5. Conclusions
Author Contributions
Funding
Conflicts of Interest
References
- Lidor, R.; Côté, J.; Hackfort, D. ISSP position stand: To test or not to test? The use of physical skill tests in talent detection and in early phases of sport development. Int. J. Sport Exerc. Psychol. 2009, 7, 131–146. [Google Scholar] [CrossRef] [Green Version]
- Isaev, A.; Khomenko, R.; Nenasheva, A.; Shevtsov, A.; Batueva, A. Biomechanical, physiological and age-related features of personification and individualization during quickness and speed-strength enchancement in young weightlifters. Hum. Sport. Med. 2019, 19, 28–35. [Google Scholar] [CrossRef]
- Balyi, I.; Way, R.; Higgs, C. Long-Term Athlete Development; Bloomsbury Academic: London, UK, 2013. [Google Scholar]
- Bompa, T.O.; Carrera, M. Conditioning Young Athletes; Human Kinetics, Inc.: Champaign, IL, USA, 2015. [Google Scholar]
- Zhao, K.; Hohmann, A.; Chang, Y.; Zhang, B.; Pion, J.; Gao, B. Physiological, Anthropometric, and Motor Characteristics of Elite Chinese Youth Athletes From Six Different Sports. Front. Physiol. 2019, 10, 405. [Google Scholar] [CrossRef] [PubMed]
- Gabbett, T.J.; Georgieff, B.; Domrow, N. The use of physiological, anthropometric, and skill data to predict selection in a talent-identified junior volleyball squad. J. Sports Sci. 2007, 25, 1337–1344. [Google Scholar] [CrossRef] [PubMed]
- Majstorović, N.; Nešić, G.; Grbić, V.; Savić, Z.; Dopsaj, M. Assessment of specific agility in volleyball: Reliability and validity of modified X running test. In Proceedings of the 4th International Conference on Innovations in Sports, Tourism and Instructional Science (ICISTIS 2019), Chelyabinsk, Russia, 5–6 December 2019; pp. 180–184. [Google Scholar]
- Nesic, G.; Majstorović, N.; Sikimić, M.; Marković, S.; Ilić, D.; Grbić, V.; Osmankač, N.; Savić, Z. Anthropometric characteristics and motor abilities in 13-15 years old female volleyball players. F.U. Phys. Ed. Sport 2014, 12, 327–339. [Google Scholar]
- Śliwowski, R.; Grygorowicz, M.; Hojszyk, R. Jadczak, Łukasz The isokinetic strength profile of elite soccer players according to playing position. PLoS ONE 2017, 12, e0182177. [Google Scholar] [CrossRef] [Green Version]
- Spanias, C.; Nikolaidis, P.T.; Rosemann, T.; Knechtle, B. Anthropometric and Physiological Profile of Mixed Martial Art Athletes: A Brief Review. Sports 2019, 7, 146. [Google Scholar] [CrossRef] [Green Version]
- Krolo, A.; Gilic, B.; Foretic, N.; Pojskic, H.; Hammami, R.; Spasić, M.; Uljevic, O.; Versic, S.; Sekulic, D. Agility Testing in Youth Football (Soccer)Players; Evaluating Reliability, Validity, and Correlates of Newly Developed Testing Protocols. Int. J. Environ. Res. Public Health 2020, 17, 294. [Google Scholar] [CrossRef] [Green Version]
- Lyu, B.-J.; Lee, C.-L.; Chang, W.-D.; Chang, N.-J. Effects of Vibration Rolling with and without Dynamic Muscle Contraction on Ankle Range of Motion, Proprioception, Muscle Strength and Agility in Young Adults: A Crossover Study. Int. J. Environ. Res. Public Health 2020, 17, 354. [Google Scholar] [CrossRef] [Green Version]
- Martelli, G.; Ciccarone, G.; Grazzini, G.; Signorini, M.; Urgelli, S. Isometric evaluation of rotator cuff muscles in volleyball athletes. J. sports Med. Phys. Fit. 2013, 53, 283–288. [Google Scholar]
- Bunn, J.A.; Ryan, G.A.; Button, G.R.; Zhang, S. Evaluation of Strength and Conditioning Measures With Game Success in Division I Collegiate Volleyball. J. Strength Cond. Res. 2020, 34, 183–191. [Google Scholar] [CrossRef] [PubMed]
- Kilic, I.; Binboga, M. Investigation of structural and biomotoric features of young volleyball players and determining the position by discriminant analysis. Ovid. Univ. Ann. Phys. Ed. Sport Sci, Mov. Health 2012, 12, 142–153. [Google Scholar]
- Cronin, J.; Lawton, T.; Harris, N.; Kilding, A.; McMaster, D.T. A Brief Review of Handgrip Strength and Sport Performance. J. Strength Cond. Res. 2017, 31, 3187–3217. [Google Scholar] [CrossRef] [PubMed] [Green Version]
- Melrose, D.R.; Spaniol, F.J.; Bohling, M.E.; Bonnette, R.A. Physiological and performance characteristics of adolescent club volleyball players. J. Strength Cond. Res. 2007, 21, 481. [Google Scholar]
- Ćopić, N.; Dopsaj, M.; Ivanovic, J.; Nešić, G.; Jaric, S. Body Composition and Muscle Strength Predictors of Jumping Performance. J. Strength Cond. Res. 2014, 28, 2709–2716. [Google Scholar] [CrossRef] [PubMed]
- Biette, N.; Tourny-Chollet, C.; Beuret-Blanquart, F. A randomised controlled trial of different leg extension exercises to increase quadriceps muscle strength in female students. Isokinet. Exerc. Sci. 2004, 12, 209–213. [Google Scholar] [CrossRef]
- Schneider, P.; Benetti, G.; Meyer, F. Muscular strength of 9-18-year old volleyball athletes through computational dynamometry. Rev. Bras. Med. Esporte 2004, 10, 92. [Google Scholar]
- Branislav, R.; Milivoj, D.; Abella, C.P.; Deval, V.C.; Siniša, K. Effects of combined and classic training on different isometric rate of force development parameters of leg extensors in female volleyball players: Discriminative analysis approach. J. Res. Med Sci. 2013, 18, 840–847. [Google Scholar]
- Baker, D.; Wilson, G.; Carlyon, B. Generality versus specificity: A comparison of dynamic and isometric measures of strength and speed-strength. Graefe’s Arch. Clin. Exp. Ophthalmol. 1994, 68, 350–355. [Google Scholar] [CrossRef]
- Blakley, B.R.; Quiñones, M.; Crawford, M.S.; Jago, I.A. The Validity of Isometric Strength Tests. Pers. Psychol. 1994, 47, 247–274. [Google Scholar] [CrossRef]
- Toonstra, J.; Mattacola, C.G. Test-Retest Reliability and Validity of Isometric Knee-Flexion and -Extension Measurement Using 3 Methods of Assessing Muscle Strength. J. Sport Rehabil. 2013, 22, 22. [Google Scholar] [CrossRef] [PubMed] [Green Version]
- Rousanoglou, E.N.; Barzouka, K.G.; Boudolos, K. Seasonal Changes of Jumping Performance and Knee Muscle Strength in Under-19 Women Volleyball Players. J. Strength Cond. Res. 2013, 27, 1108–1117. [Google Scholar] [CrossRef] [PubMed]
- Hadžić, V.; Sattler, T.; Veselko, M.; Markovic, G.; Dervisevic, E. Strength Asymmetry of the Shoulders in Elite Volleyball Players. J. Athl. Train. 2014, 49, 338–344. [Google Scholar] [CrossRef] [Green Version]
- Christie, B. Doctors revise Declaration of Helsinki. BMJ 2000, 321, 913. [Google Scholar] [CrossRef] [Green Version]
- Mirkov, D.M.; Knezevic, O.M.; Maffiuletti, N.A.; Kadija, M.; Nedeljković, A.; Jaric, S. Contralateral limb deficit after ACL-reconstruction: An analysis of early and late phase of rate of force development. J. Sports Sci. 2016, 35, 1–6. [Google Scholar] [CrossRef] [PubMed]
- Dopsaj, M.; Mijalkovski, Z.; Vasilovski, N.; Nemanja, Ć.; Brzakovic, M.; Markovic, M. Morphological parameters and handgrip muscle force contractile characteristics in the first selection level in water polo: Differences between u15 water polo players and the control group. Human. Sport. Med. 2018, 18, 5–15. [Google Scholar] [CrossRef]
- Dopsaj, M.; Valdevit, Z.; Vučković, G.; Ivanović, J.; Bon, M. A model of the characteristics of hand grip muscle force based on elite female handball players of various ages. Kinesiol. Slov. 2019, 25, 14–26. [Google Scholar]
- Zarić, I.; Dopsaj, M.; Marković, M. Match performance in young female basketball players: Relationship with laboratory and field tests. Int. J. Perform. Anal. Sport 2018, 18, 90–103. [Google Scholar] [CrossRef]
- Dopsaj, M.; Milošević, M.; Blagojević, M. An analysis of the reliability and factoral validity of selected muscle force mechanical characteristics during isometric multi-joint test. In Proceedings of the XVIII International Symposium of Biomechanics in Sport, Hong Kong, China, 25–30 June 2000; Volume 1, pp. 146–149. [Google Scholar]
- Desrosiers, J.; Prince, F.; Rochette, A.; Raîche, M. Reliability of Lower Extremity Strength Measurements Using the Belt-Resisted Method. J. Aging Phys. Act. 1998, 6, 317–326. [Google Scholar] [CrossRef]
- Rajić, B.; Dopsaj, M.; Abella, P.C. The influence of the combined method on the development of explosive strength in female volleyball players and on the isometric muscle strength of different muscle groups. Facta Univ. -Ser. Phys. Educ. Sport 2004, 2, 1–12. [Google Scholar]
- Kukic, F.; Dopsaj, M.; Dawes, J.; Orr, R.M.; Čvorović, A. Use of Human Body Morphology as an Indication of Physical Fitness: Implications for Police Officers. Int. J. Morphol. 2018, 36, 1407–1412. [Google Scholar] [CrossRef]
- Tsoukos, A.; Drikos, S.; Brown, L.E.; Sotiropoulos, K.; Veligekas, P.; Bogdanis, G.C. Upper and Lower Body Power Are Strong Predictors for Selection of Male Junior National Volleyball Team Players. J. Strength Cond. Res. 2019, 33, 2760–2767. [Google Scholar] [CrossRef] [PubMed]
- Sleivert, G.; Backus, R.; Wenger, H. Neuromuscular Differences Between Volleyball Players, Middle Distance Runners and Untrained Controls. Int. J. Sports Med. 1995, 16, 390–398. [Google Scholar] [CrossRef] [PubMed]
- Takeuchi, K.; Takemura, M.; Nakamura, M.; Tsukuda, F.; Miyakawa, S. Effects of Active and Passive Warm-ups on Range of Motion, Strength, and Muscle Passive Properties in Ankle Plantarflexor Muscles. J. Strength Cond. Res. 2018. [Google Scholar] [CrossRef]
- Kwon, Y.U. Influence of maximum-graded exercise test on maximal plantarflexion and dorsiflexion torque production in the seated and supine positions. Isokinet. Exerc. Sci. 2020, 28, 153–159. [Google Scholar] [CrossRef]
- Kamen, G. The acquisition of maximal isometric plantar flexor strength: A force-time curve analysis. J. Mot. Behav. 1983, 15, 63–73. [Google Scholar] [CrossRef]
- Kyröläinen, H.; Avela, J.; McBride, J.M.; Koskinen, S.; Andersen, J.L.; Sipilä, S.; Takala, T.E.S.; Komi, P.V. Effects of power training on muscle structure and neuromuscular performance. Scand. J. Med. Sci. Sports 2005, 15, 58–64. [Google Scholar] [CrossRef]
- Muñoz, C.S.; Muros, J.J.; Cañas, J.; Courel-Ibáñez, J.; Sánchez-Alcaraz, B.J.; Zabala, M. Anthropometric and Physical Fitness Profiles of World-Class Male Padel Players. Int. J. Environ. Res. Public Health 2020, 17, 508. [Google Scholar] [CrossRef] [PubMed] [Green Version]
- Spence, D.W.; Disch, J.G.; Fred, H.L.; Coleman, A.E. Descriptive profiles of highly skilled women volleyball players. Med. Sci. Sports Exerc. 1980, 12, 299–302. [Google Scholar] [CrossRef]
- Sheppard, J.M.; Nolan, E.; Newton, R.U. Changes in Strength and Power Qualities Over Two Years in Volleyball Players Transitioning From Junior to Senior National Team. J. Strength Cond. Res. 2012, 26, 152–157. [Google Scholar] [CrossRef] [Green Version]
- Marques, M.C.; Tillaar, R.V.D.; Gabbett, T.J.; Reis, V.M.; Gonzalez-Badillo, J.J. Physical Fitness Qualities of Professional Volleyball Players: Determination of Positional Differences. J. Strength Cond. Res. 2009, 23, 1106–1111. [Google Scholar] [CrossRef]
- Nikolaidis, T.P.; Afonso, J.; Buśko, K.; Ingebrigtsen, J.; Chtourou, H.; Martin, J.J. Positional differences of physical traits and physiological characteristics in female volleyball players–the role of age. Kinesiol. Int. J. Fundam. Appl. Kinesiol. 2015, 47, 75–81. [Google Scholar]
- Rauch, J.; LoTurco, I.; Cheesman, N.; Thiel, J.; Alvarez, M.; Miller, N.; Carpenter, N.; Barakat, C.; Velasquez, G.; Stanjones, A.; et al. Similar Strength and Power Adaptations between Two Different Velocity-Based Training Regimens in Collegiate Female Volleyball Players. Sports 2018, 6, 163. [Google Scholar] [CrossRef] [Green Version]
- Kavanaugh, A.A.; Mizuguchi, S.; Sands, W.A.; Ramsey, M.W.; Stone, M.H. Long-Term Changes in Jump Performance and Maximum Strength in a Cohort of National Collegiate Athletic Association Division I Women’s Volleyball Athletes. J. Strength Cond. Res. 2018, 32, 66–75. [Google Scholar] [CrossRef]
- Arazi, H.; Khanmohammadi, A.; Asadi, A.; Haff, G.G. The effect of resistance training set configuration on strength, power, and hormonal adaptation in female volleyball players. Appl. Physiol. Nutr. Metab. 2018, 43, 154–164. [Google Scholar] [CrossRef] [PubMed]
- Foss, K.D.B.; Myer, G.D.; Hewett, T.E. Epidemiology of basketball, soccer, and volleyball injuries in middle-school female athletes. Physician Sportsmed. 2014, 42, 146–153. [Google Scholar] [CrossRef] [PubMed]
- Dervišević, E.; Hadžić, V. Quadriceps and hamstrings strength in team sports: Basketball, football and volleyball. Isokinet. Exerc. Sci. 2012, 20, 293–300. [Google Scholar] [CrossRef]
- Morrow, J.R.; Jackson, A.S.; Hosler, W.W.; Kachurik, J.K. The Importance of Strength, Speed, and Body Size for Team Success in Women’s Intercollegiate Volleyball. Res. Quarterly. Am. Alliance Health Phys. Educ. Recreat. Dance 1979, 50, 429–437. [Google Scholar] [CrossRef]
- Lijewski, M.; Burdukiewicz, A.; Pietraszewska, J.; Stachoń, A.; Andrzejewska, J.; Chromik, K. Anthropometric and strength profiles of professional handball players in relation to their playing position—Multivariate analysis. Acta Bioeng. Biomech. 2019, 21, 21. [Google Scholar] [CrossRef]
- Charoenpanich, N.; Boonsinsukh, R.; Sirisup, S.; Saengsirisuwan, V. Principal component analysis identifies major muscles recruited during elite vertical jump. Age 2013, 39, 257. [Google Scholar] [CrossRef]
- Kollias, I.; Hatzitaki, V.; Papaiakovou, G.; Giatsis, G. Using Principal Components Analysis to Identify Individual Differences in Vertical Jump Performance. Res. Q. Exerc. Sport 2001, 72, 63–67. [Google Scholar] [CrossRef] [PubMed]
- Yang, Y. Decomposition and recognition of playing volleyball action based on SVM algorithm. J. Interdiscip. Math. 2018, 21, 1181–1186. [Google Scholar] [CrossRef]
- Czaplicki, A.; Sliwa, M.; Szyszka, P.; Sadowski, J. Biomechanical Assessment of Strength and Jumping Ability in Male Volleyball Players During the Annual Training Macrocycle. Pol. J. Sport Tour. 2017, 24, 221–227. [Google Scholar] [CrossRef] [Green Version]
- Nesic, G.; Sikimic, M.; Ilić, V.; Stojanovic, T. Play structure of top female volleyball players: Explorative factorial approach. Br. J. Sports Med. 2011, 45, 541. [Google Scholar] [CrossRef]


| Variable | U15 | U17 | U19 | U21 | ||||
|---|---|---|---|---|---|---|---|---|
| (Mean ± SD) | (Mean ± SD) | (Mean ± SD) | (Mean ± SD) | |||||
| Male | Female | Male | Female | Male | Female | Male | Female | |
| Age | 14.2 ± 0.6 | 14.2 ± 0.6 | 16.2 ± 0.4 | 15.9 ± 0.5 | 17.7 ± 0.5 | 17.9 ± 0.6 | 19.8 ± 0.8 | 19.9 ± 0.6 |
| BH | 176.6 ± 7.4 | 173.6 ± 1.1 | 183.8 ± 7.9 | 175.8 ± 7 | 186.2 ± 6.8 | 177.2 ± 7.5 | 193.4 ± 5.7 | 180.5 ± 6.1 |
| BW | 65.2 ± 7.5 | 62.7 ± 9.6 | 72.2 ± 9.6 | 65.7 ± 8.1 | 78.7 ± 10.1 | 68.2 ± 7.9 | 90.4 ± 6.9 | 70.9 ± 8.8 |
| n | 22 | 129 | 43 | 118 | 25 | 63 | 22 | 61 |
| Variable | U15 (Mean ± SD) | U17 (Mean ± SD) | U19 (Mean ± SD) | U21 (Mean ± SD) |
|---|---|---|---|---|
| HGR Fmax (n) | 321.1 ± 78.1 | 432.4 ± 78.5 | 437.3 ± 83.6 | 572.2 ± 82.7 |
| HGR RFDmax (n/s) | 2299.4 ± 538.9 | 3018.0 ± 559.1 | 3196.4 ± 622.3 | 3976.9 ± 423.8 |
| HGL Fmax (n) | 303.7 ± 78.4 | 402.6 ± 86.7 | 417.4 ± 78.2 | 521.0 ± 82.4 |
| HGL RFDmax (n/s) | 2161.3 ± 605.8 | 2798.7 ± 600.5 | 2979.3 ± 562.5 | 3605.2 ± 571.6 |
| LB Fmax (n) | 814.7 ± 234.9 | 1157.2 ± 199.4 | 1249.1 ± 167.4 | 1568.5 ± 222.9 |
| LB RFDmax (n/s) | 5328.5 ± 1958.5 | 8251.7 ± 2407.6 | 9736.2 ± 1920.7 | 12538.3 ± 2784.7 |
| AE Fmax (n) | 2736.3 ± 788.1 | 3506.8 ± 602.2 | 3540.2 ± 634.8 | 4616.5 ± 354.1 |
| AE RFDmax (n/s) | 12650.5 ± 3679.7 | 16458.7 ± 2857.6 | 17409.7 ± 2785.3 | 21384.7 ± 3810.3 |
| Variable | U15 (Mean ± SD) | U17 (Mean ± SD) | U19 (Mean ± SD) | U21 (Mean ± SD) |
|---|---|---|---|---|
| HGR Fmax (n) | 272.9 ± 50.9 | 290.1 ± 47.6 | 302.0 ± 51.4 | 347.4 ± 55.2 |
| HGR RFDmax (n/s) | 1819.1 ± 438.6 | 1946.77 ± 365.3 | 2072.1 ± 385.4 | 2344.8 ± 431.9 |
| HGL Fmax (n) | 260.4 ± 48.7 | 273.49 ± 46.4 | 288.2 ± 51.1 | 331.3 ± 53.5 |
| HGL RFDmax (n/s) | 1700.5 ± 427.9 | 1827.34 ± 389.6 | 1914.2 ± 409.4 | 2241.6 ± 436.6 |
| LB Fmax (n) | 766.8 ± 133.1 | 845.18 ± 143.3 | 865.4 ± 144.5 | 978.9 ± 167.2 |
| LB RFDmax (n/s) | 4713.2 ± 1699.6 | 5836.19 ± 1781.2 | 6054.8 ± 1917.2 | 6769.5 ± 1873.6 |
| AE Fmax (n) | 2558.1 ± 582.8 | 2825.24 ± 582.1 | 2981.4 ± 547.0 | 3337.9 ± 647.6 |
| AE RFDmax (n/s) | 12196.7 ± 3169.6 | 13776.27 ± 2810.4 | 14514.9 ± 2658.2 | 15824.6 ± 3214.1 |
| Variable | Male | Female |
|---|---|---|
| HGR RFDmax | 0.940 | 0.869 |
| HGR Fmax | 0.939 | 0.877 |
| HGL Fmax | 0.925 | 0.897 |
| HGL RFDmax | 0.916 | 0.884 |
| LB Fmax | 0.913 | 0.818 |
| AE Fmax | 0.879 | 0.736 |
| LB RFD max | 0.798 | 0.688 |
| AE RFDmax | 0.784 | 0.767 |
| Cumulative % | 78.984 | 67.284 |
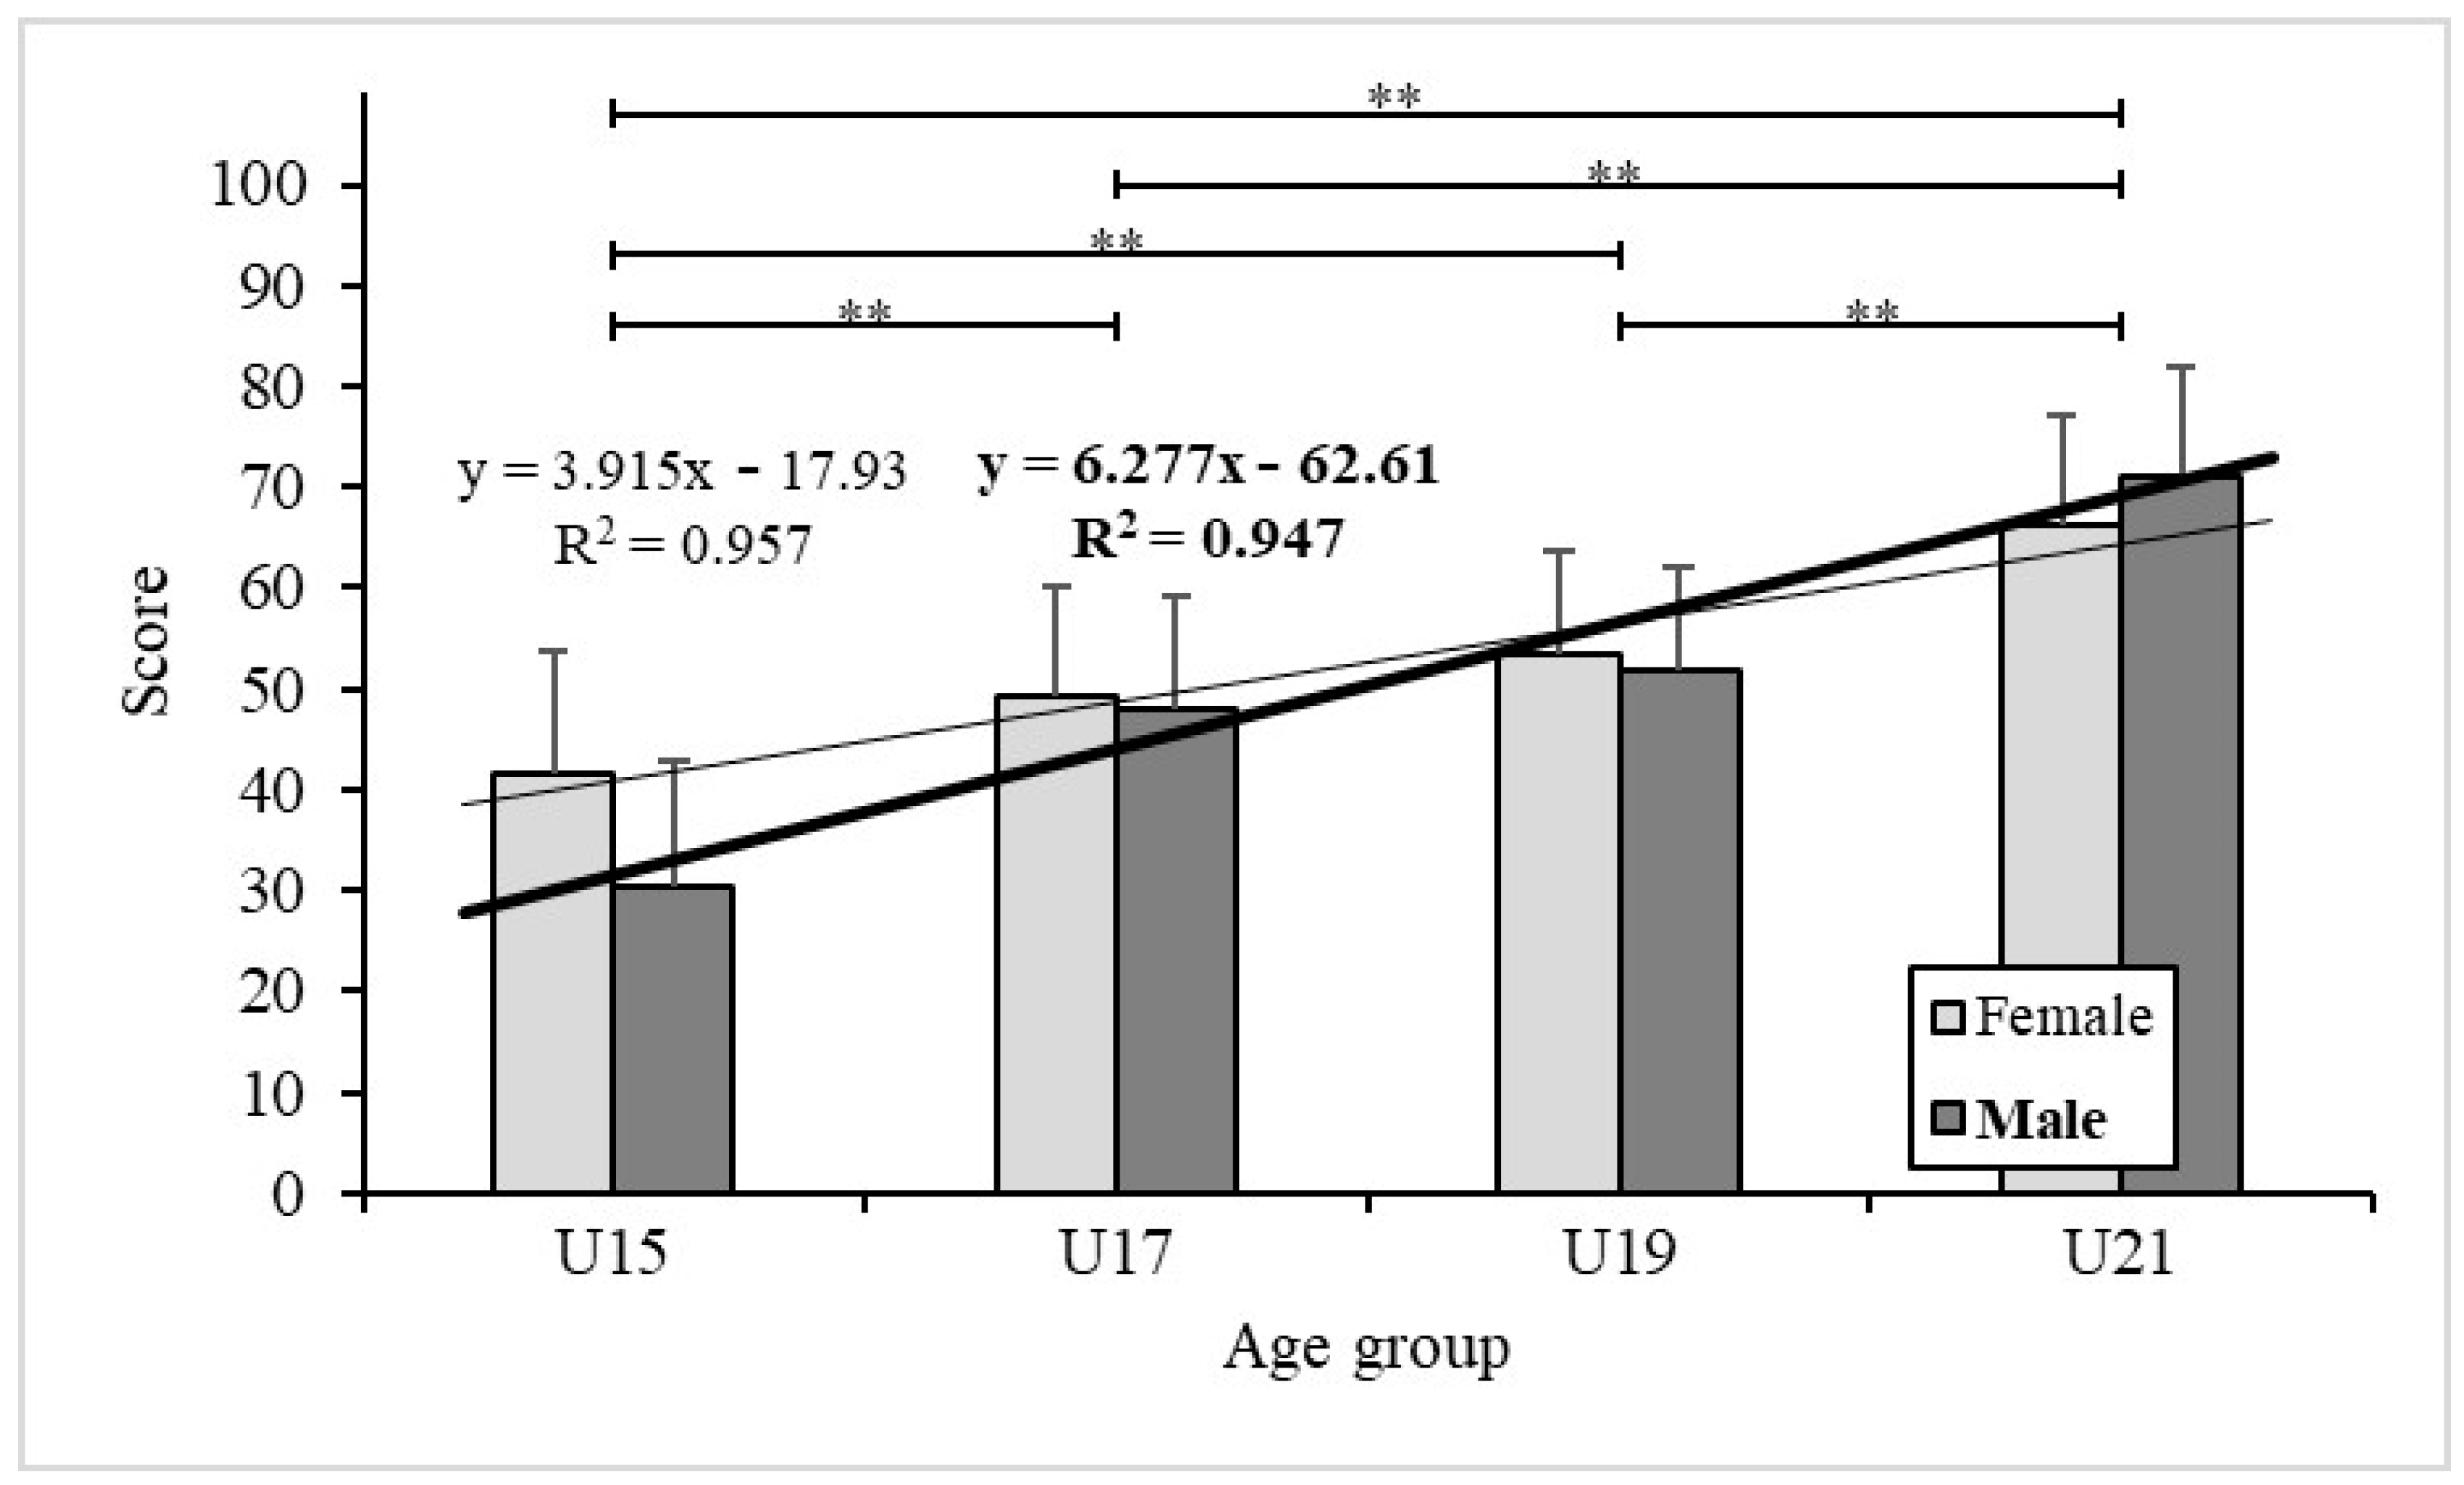
| Sample | Male | Female |
|---|---|---|
| (Mean ± SD) | (Mean ± SD) | |
| U15 | 30.46 ± 12.30 | 41.50 ± 15.09 |
| U17 | 48.10 ± 10.99 | 49.11 ± 13.57 |
| U19 | 51.94 ± 10.17 | 53.37 ± 14.06 |
| U21 | 71.03 ± 11.03 | 66.18 ± 15.11 |
| ANOVA | F = 53.17 (p < 0.001) | F = 41.61 (p < 0.001) |
© 2020 by the authors. Licensee MDPI, Basel, Switzerland. This article is an open access article distributed under the terms and conditions of the Creative Commons Attribution (CC BY) license (http://creativecommons.org/licenses/by/4.0/).
Share and Cite
Majstorović, N.; Dopsaj, M.; Grbić, V.; Savić, Z.; Vićentijević, A.; Aničić, Z.; Zadražnik, M.; Toskić, L.; Nešić, G. Isometric Strength in Volleyball Players of Different Age: A Multidimensional Model. Appl. Sci. 2020, 10, 4107. https://doi.org/10.3390/app10124107
Majstorović N, Dopsaj M, Grbić V, Savić Z, Vićentijević A, Aničić Z, Zadražnik M, Toskić L, Nešić G. Isometric Strength in Volleyball Players of Different Age: A Multidimensional Model. Applied Sciences. 2020; 10(12):4107. https://doi.org/10.3390/app10124107
Chicago/Turabian StyleMajstorović, Nikola, Milivoj Dopsaj, Vladimir Grbić, Zoran Savić, Aleksandar Vićentijević, Zdravko Aničić, Marko Zadražnik, Lazar Toskić, and Goran Nešić. 2020. "Isometric Strength in Volleyball Players of Different Age: A Multidimensional Model" Applied Sciences 10, no. 12: 4107. https://doi.org/10.3390/app10124107
APA StyleMajstorović, N., Dopsaj, M., Grbić, V., Savić, Z., Vićentijević, A., Aničić, Z., Zadražnik, M., Toskić, L., & Nešić, G. (2020). Isometric Strength in Volleyball Players of Different Age: A Multidimensional Model. Applied Sciences, 10(12), 4107. https://doi.org/10.3390/app10124107