Article

Soil Nitrogen Fractions, Nitrogen Use Efficiency and Yield of Zea mays L. Grown on a Tropical Acid Soil Treated with Composts and Clinoptilolite Zeolite

by
Latifah Omar
1,*,
Osumanu Haruna Ahmed
1,2,3,
Mohamadu Boyie Jalloh
4 and
Abdul Majid Nik Muhamad
5
1
Department of Crop Science, Faculty of Agriculture and Food Sciences, Universiti Putra Malaysia, Bintulu Sarawak Campus, Bintulu 97008, Sarawak, Malaysia
2
Institute of Ecosystem Science Borneo, Faculty of Agriculture and Food Sciences, Universiti Putra Malaysia, Bintulu Campus, Bintulu 97008, Sarawak, Malaysia
3
Institute of Tropical Agriculture Universiti Putra Malaysia (ITAFoS), Serdang 43400, Selangor, Malaysia
4
Faculty of Sustainable Agriculture, Universiti Malaysia Sabah, Sandakan Branch, Locked Bag No. 3, Sandakan 90509, Sabah, Malaysia
5
Institute of Tropical Forestry and Forest Product (INTROP), Universiti Putra Malaysia, Serdang 43400, Selangor, Malaysia
*
Author to whom correspondence should be addressed.
Appl. Sci. 2020, 10(12), 4139; https://doi.org/10.3390/app10124139
Submission received: 13 April 2020 / Revised: 12 May 2020 / Accepted: 12 May 2020 / Published: 16 June 2020

Abstract

:
High nitrogen use efficiency (NUE) is important for improving crop yield. There are many nitrogen (N) fractions in soil and their uptake by crops varies. Most of the N that is taken up by plants is not native to the soil but usually from fertilizer added to the soil. However, the unbalanced use of fertilizers is currently an important issue that needs to be addressed. The objectives of this work were to determine the effects of using the recommended chemical fertilizers together with inorganic and organic amendments on (i) soil organic and inorganic N fractions, (ii) N uptake and use efficiency, and (iii) maize (Zea mays L.) dry matter production and ear yield. A randomized complete block design field trial, using maize as a test crop, was done with seven fertilizer treatments, each replicated thrice for two crop cycles. The treatments included different combinations of urea N, clinoptilolite zeolite (CZ), rice straw compost, and paddy husk compost. The variables of the study were soil N fractions, ear yield, and N use efficiency. Generally, the combined use of the recommended chemical fertilizers with CZ and organic amendments resulted in significantly higher soil N fractions, N use efficiency, and ear yield of maize for both crops. The two treatments with a 50% reduction in recommended chemical fertilizers, CZ, and rice straw compost or paddy husk compost (treatments four and six) are recommended instead of the 100% recommended chemical fertilizer treatment (treatment one). The organic materials used for these two treatments are abundantly available and will reduce the economic and environmental costs of applying large quantities of chemical fertilizers alone.

1. Introduction

Fertilizer nitrogen (N) value, regardless of the N source, can be calculated from the readily mineralizable fractions of N (organic N fractions). The hydrolyzable fractions of organic N, such as hydrolyzable NH4–N, amino sugars, and amino acids, are the most active N pools. They are the major sources of organic N fractions that will potentially decompose into available N forms for plant uptake [1,2]. Nitrogen availability is affected by the decomposition of soil organic N fractions which ultimately mineralize into available N (NH4+ and NO3). Information on soil organic N fractions provides the means to determine soil organic N decomposition [3]. The practices of N fertilizer application, conservation tillage, and the use of cover crops usually increase soil N stocks [4]. However, excessive and unreasonable amounts of inorganic N fertilizers are being used in agriculture to achieve high crop yield. These practices do not only waste scarce or limited resources, but they also pollute or degrade the environment. The excessive use of inorganic N fertilizers, especially in commercial agriculture [5], has adversely affected the quality of the environment. On the other hand, there is underutilization of fertilizers in Africa and parts of Latin America [6] which leads to poor crop yield and low food security. Thus, optimal applications of inorganic or organic N as fertilizers need to be practiced to improve soil N availability and plant N use efficiency.
The use of readily available N fertilizer in agriculture may result in high levels of available N and this might exceed crop demand early in the season. Consequently, it could cause N losses and deficiencies. Improving the nitrogen use efficiency (NUE), which is the fraction of the applied fertilizer nitrogen taken up by a plant for its physiological and growth purposes [7], is one of the strategies for reducing N loss in agriculture. With the continued escalating costs of inorganic fertilizers, NUE in field crops should be enhanced to reduce production costs for greater profits to resource-poor farmers. Therefore, it is essential that appropriate N fertilizer management practices are adopted to optimize the use of applied N in cropping systems [8]. In managing the application of inorganic and organic sources of N fertilizers such as urea, ammonium nitrate, ammonium sulfate, and composts, one of the challenges is to synchronize the supply of N with crop demand. This requires an understanding of the mechanisms of N loss and release from the inorganic fertilizers and composts in relation to plant growth patterns.
The retention of N applied in fields also needs to be addressed in view of the losses of N partly because of poor soil nutrient holding capacity. Zeolites can be used to retain, for example, ammonium (NH4+) from N fertilizers because of their high affinity for this ion. This intervention can minimize N losses [9]. The application of fertilizers, zeolites, and composts was found to enhance NH4+ retention due to the high negative charges of zeolites and the humus component of composts [10]. This study is a follow up to a previous greenhouse trial [10], to determine whether the results obtained for urea-N use efficiency, composts, and clinoptilolite zeolite (CZ) could be replicated in a field trial. Clinoptilolite zeolite is a natural zeolite found in soils and sediments and it acts as a molecular sieve that selectively absorbs ammonium ions and other cations such as calcium, potassium, magnesium, and sodium on its negatively charged surface. Clinoptilolite zeolite is commonly used in agriculture as a soil amendment to improve nutrient retention. Applying chemical fertilizers with compost and zeolite resulted in the improvement of macronutrient uptake in maize plants, NUE, and maize ear yield [11]. The primary focus of this research was on the aspects of mineralization of organic N fractions into available forms of N upon application of different amounts of inorganic fertilizers and organic amendments (rice straw or paddy husk composts) combined with CZ in maize crop field trials. Two consecutive maize crops were planted for the field trials. Paddy husk compost was included in this study as one of the organic treatments to determine if its effects on soil N fractions (organic and inorganic N) and NUE are comparable to that of rice straw compost if combined with inorganic fertilizers e. Thus, the specific objectives of this work were to determine the effects of using the recommended chemical fertilizers together with inorganic and organic amendments on: (i) soil organic and inorganic N fractions; (ii) N uptake and use efficiency; and (iii) maize (Zea mays L.) dry matter production and ear yield.

2. Materials and Methods

2.1. Clinoptilolite Zeolite, Rice Straw, and Paddy Husk Composts Characterization

Detailed information on how the CZ, rice straw compost, and paddy husk compost were characterized have been reported in published articles [11,12,13]. The CZ used in this study was obtained from Luxurious Empire Sdn Bhd, a fertilizer supplier in Kulai Jaya, Johor, Malaysia. The CZ was analyzed for total N by the Kjeldahl method [14]; exchangeable NH4+ and NO3 by the Keeney and Nelson method [15]; pH in a water extract (ratio of 1:2, w/v) using a pH meter; cation exchange capacity (CEC) using the CsCl method [16], which accounts for an underestimation of the CEC of CZ because of NH4+ entrapment in the channels of this mineral; and exchangeable K, Ca and Mg using atomic absorption spectrophotometry (Analyst 800, Perkin Elmer, Norwalk, CT, USA), for their concentrations in the CEC extract. The CEC of the CZ was 100 cmol(+) kg−1 (Table 1) which was enough to adsorb NH4+ [16,17,18,19]. The contents of the base cations in the CZ were relatively high (Table 1).
The chemical characteristics of the rice straw and paddy husk composts are shown in Table 2 as reported by Latifah et al. [11,12,13]. The composts were high in macronutrients, humic acid (HA), and ash contents but low in micronutrients and microbial counts which indicate the composts’ stability, maturity, and non-toxicity [11,12,13]. The values for the other properties (shown in Table 2) are characteristic of mature composts [13].

2.2. Study Area Characterization

This study was conducted in 2014 in an uncultivated area at Universiti Putra Malaysia Bintulu Sarawak Campus, Malaysia, located at latitude 3° 30′ N and longitude 113° 09′ E. The experimental site is in a hot humid tropical area. During the period of the study (April to August), the area experienced an average of 257.6 mm of monthly total rainfall with a range of 244.8–290.3 mm per month. The average rainy days was 13.8 d/month with a range of 12–15 rainy d/month. The daytime temperature, sunshine hours, and day length patterns were almost constant throughout April to August with mean values of 31 °C, 6.5 h, and 12 h, respectively. The properties of the soil used in this study are shown in Table 3. The soil properties were determined using standard laboratory methods, as previously described, for the compost analyses. The soil CEC was determined using the leaching method followed by steam distillation [20]. The soil is classified as sandy clay loam texture based on the United States Department of Agriculture (USDA) soil classification system and it belongs to the Nyalau Series, which is typically a deep, well drained, and infertile soil [21].

2.3. Experimental Design and Treatments

Two consecutive crops of maize (Thai Super Sweet F1 Hybrid variety) were planted, each lasting 70 d. The field trials started in April 2014 and ended in August 2014. The total experimental area was 15 m × 12 m (180 m2). A randomized complete block design was used with seven treatments and three replications resulting in a total of 21 experimental units or plots. The experimental units or plots were one meter apart to prevent cross-contamination of treatments and other research activities. Each experimental unit was 7.5 m2 in size (3 m × 2.5 m). A total of 12 maize plants were grown in each plot with 60 cm equidistance between the plants and between the rows for each of the two consecutive crop cycles.
The treatments evaluated in the field study for the two planting cycles were as follows:
T0: 
No fertilizer application (Control);
T1: 
100% recommended chemical fertilizers (0.13 t ha−1 urea + 0.10 t ha−1 triple superphosphate (TSP) + 0.07 t ha−1 muriate of potash (MOP));
T2: 
100% recommended chemical fertilization amended with CZ (0.13 t ha−1 urea + 0.10 t ha−1 TSP + 0.07 t ha−1 MOP + 5 t ha−1 CZ);
T3: 
25% reduction of recommended chemical fertilization and amendment with rice straw compost and CZ (0.09 t ha−1 kg urea + 0.07 t ha−1 TSP + 0.05 t ha−1 MOP + 10 t ha−1 compost + 5 t ha−1 CZ);
T4: 
50% reduction of recommended chemical fertilization and amendment with rice straw compost and CZ (0.04 t ha−1 urea + 0.03 t ha−1 TSP + 0.02 t ha−1 MOP + 15 t ha−1 compost + 5 t ha−1 CZ);
T5: 
25% reduction of recommended chemical fertilization and amendment with paddy husk compost and CZ (0.09 t ha−1 kg urea + 0.07 t ha−1 TSP + 0.05 t ha−1 MOP + 10 t ha−1 compost + 5 t ha−1 CZ);
T6: 
50% reduction of recommended chemical fertilization and amendment with paddy husk compost and CZ (0.04 t ha−1 urea + 0.03 t ha−1 TSP + 0.02 t ha−1 MOP + 15 t ha−1 compost + 5 t ha−1 CZ).
The recommended chemical fertilizer together with rice straw compost and paddy husk compost, without CZ, were not tested in this field experiment because these treatments (recommended chemical fertilizers, rice straw compost, and paddy husk compost without CZ) were tested in a greenhouse pot trial. There were no significant effects on soil N, P, K availability as well as the N, P, K uptake, and use efficiencies [10].
The CZ and different rates of rice straw compost and paddy husk compost components of the treatments were applied before sowing the maize seeds only for the first crop. The chemical fertilizer components of the treatments, that is, urea, TSP, and MOP, were applied for both crop cycles. All treatments were applied around the plants in a shallow furrow after which the furrows were covered with soil. The standard chemical fertilizer’s application rate (T1) was applied in two splits, which were at 10 and 28 d after planting (DAP) for the two crop cycles. The recommended chemical fertilizer rates for maize for primary macronutrients are 60 kg N, 60 kg P2O5, and 40 kg K2O [22]. This is equivalent to 0.13, 0.10, and 0.07 t ha−1 of urea, triple superphosphate (TSP), and muriate of potash MOP), respectively. The CZ, rice straw compost, and paddy husk compost used in T2, T3, T4, T5, and T6 were mixed in planting holes a day before seeding, based on rate per maize plant basis. The amounts of urea, TSP, and MOP applied for T3 and T5 were reduced by a quarter (25%) and by half (50%) for T4 and T6, based on the amount of rice straw compost and paddy husk compost used to complement the requirements of the crop. Although the focus of this study was on soil N availability and use efficiency, co-application of P and K fertilizers in this field trial was equally essential. This is because the use of N only would not be able to fully sustain the maize crop as P and K are also important for the growth and development of maize. However, the calculation for yield and NUE, as affected by the amendments, was only based on the N fertilizers applied.

2.4. Soil Sampling and Analysis

At the end of each crop cycle, random soil samples were collected from each plot with an Edelman soil auger (combination type) to a depth of 20 cm and placed in labeled plastic bags. Afterwards, the composite soil samples for each plot were brought to the laboratory for air drying and sieving using standard procedures [20]. Thereafter, the samples were used for different laboratory analysis for the determination of the soil variables of interest. Soil organic N fractions were determined using the method of Mulvaney and Khan [23]. The hot acid hydrolysis method was used to extract hydrolysates from the soil samples to determine the N fractions [24]. The hydrolysates were then diffused and titrated against 0.01 M H2SO4 to estimate the total hydrolyzable N, hydrolyzable NH4–N, (NH4 + amino sugar)–N, amino sugar–N, and amino acid–N. Total non-hydrolyzable N was calculated as the sum of total hydrolyzable N, (NH4+ + amino sugar)–N, and amino acid–N subtracted from total N [24]. Soil exchangeable NH4+ and available nitrate (NO3) were extracted using the method described in [15]. A LECO CHNS Analyzer (Truspec® Micro CHNS, LECO, St. Joseph, MI, USA) was used to determine the total soil nitrogen.

2.5. Plant Yield and Nitrogen Use Efficiency

For each of the plots for the two crop cycles, the economic yield of the maize, which are the fruits, otherwise known as ears, were weighed after harvest at 70 d after seeding. The shoots (stem, leaves, and ears) in each plot were removed by cutting the stem at 0.1 m from the soil surface for plant biomass measurements. Therefrom, the stem, leaves, and ears were separated and dried in a convection oven until constant dry weight was achieved. After grinding the dried samples, the plant total N concentration was determined using the LECO CHNS Analyzer (Truspec® Micro CHNS, LECO, St. Joseph, MI, USA). Nitrogen taken up by the stem, leaves, and ears were determined by multiplying their contents with the dry weight of the plant parts. Urea–N use efficiency of the plants was determined using two indices reported in [8]. These two indices are agronomic efficiency of applied N and crop recovery efficiency of applied N. Equations (i) and (ii) below were used to calculate the agronomic and nitrogen recovery efficiencies of the applied nitrogen, respectively. Five ears were randomly selected for each plot to count the number of grains per ear. The control treatment (T0) was used in calculating N use efficiency to factor out the contribution of N by soil only [7].
(i)
AEN = Agronomic efficiency of applied N = (YN−Y0)/FN (kg yield increase/kg N applied)
(ii)
REN Crop recovery efficiency of applied N = (UN−U0)/FN (kg increase in N uptake/kg N applied)
where: YN—Crop yield with applied N; Y0—Crop yield of control treatment without N; FN—Amount of fertilizer N applied; UN—Plant N uptake for a plot with applied N; U0—Plant N uptake for a plot without N application.

2.6. Statistical Analysis

Data were subjected to a one-way analysis of variance (ANOVA) to establish any significant effects between the treatments and Tukey’s test was used to compare treatment means at p ≤ 0.05. The analysis was done using Statistical Analysis System (SAS) software version 9.2 (SAS Institute Inc., Cary, NC, USA)

3. Results

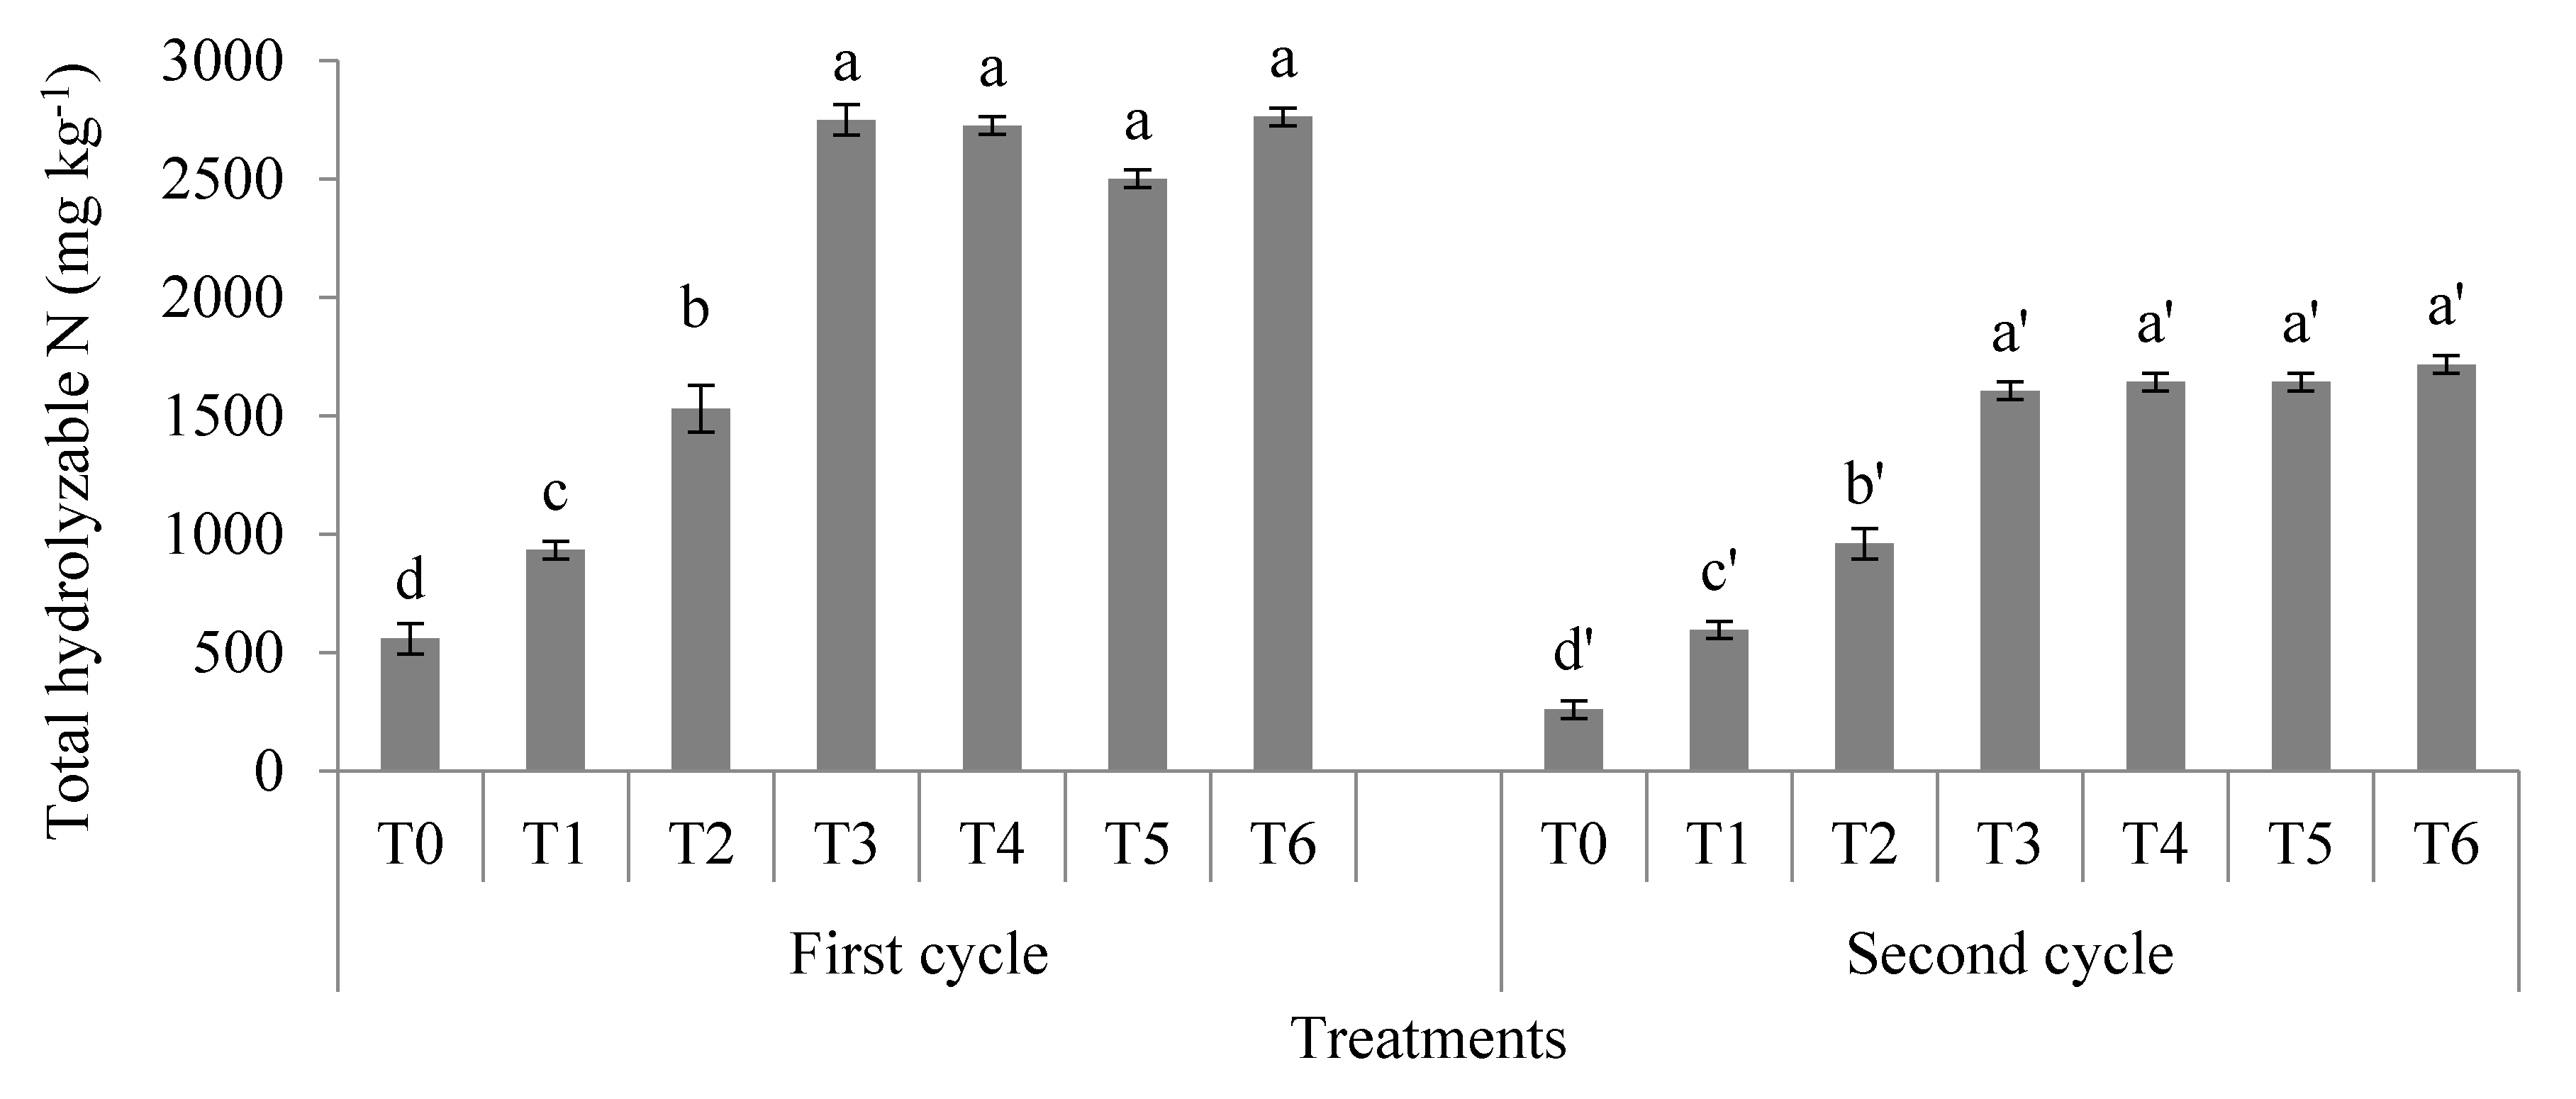
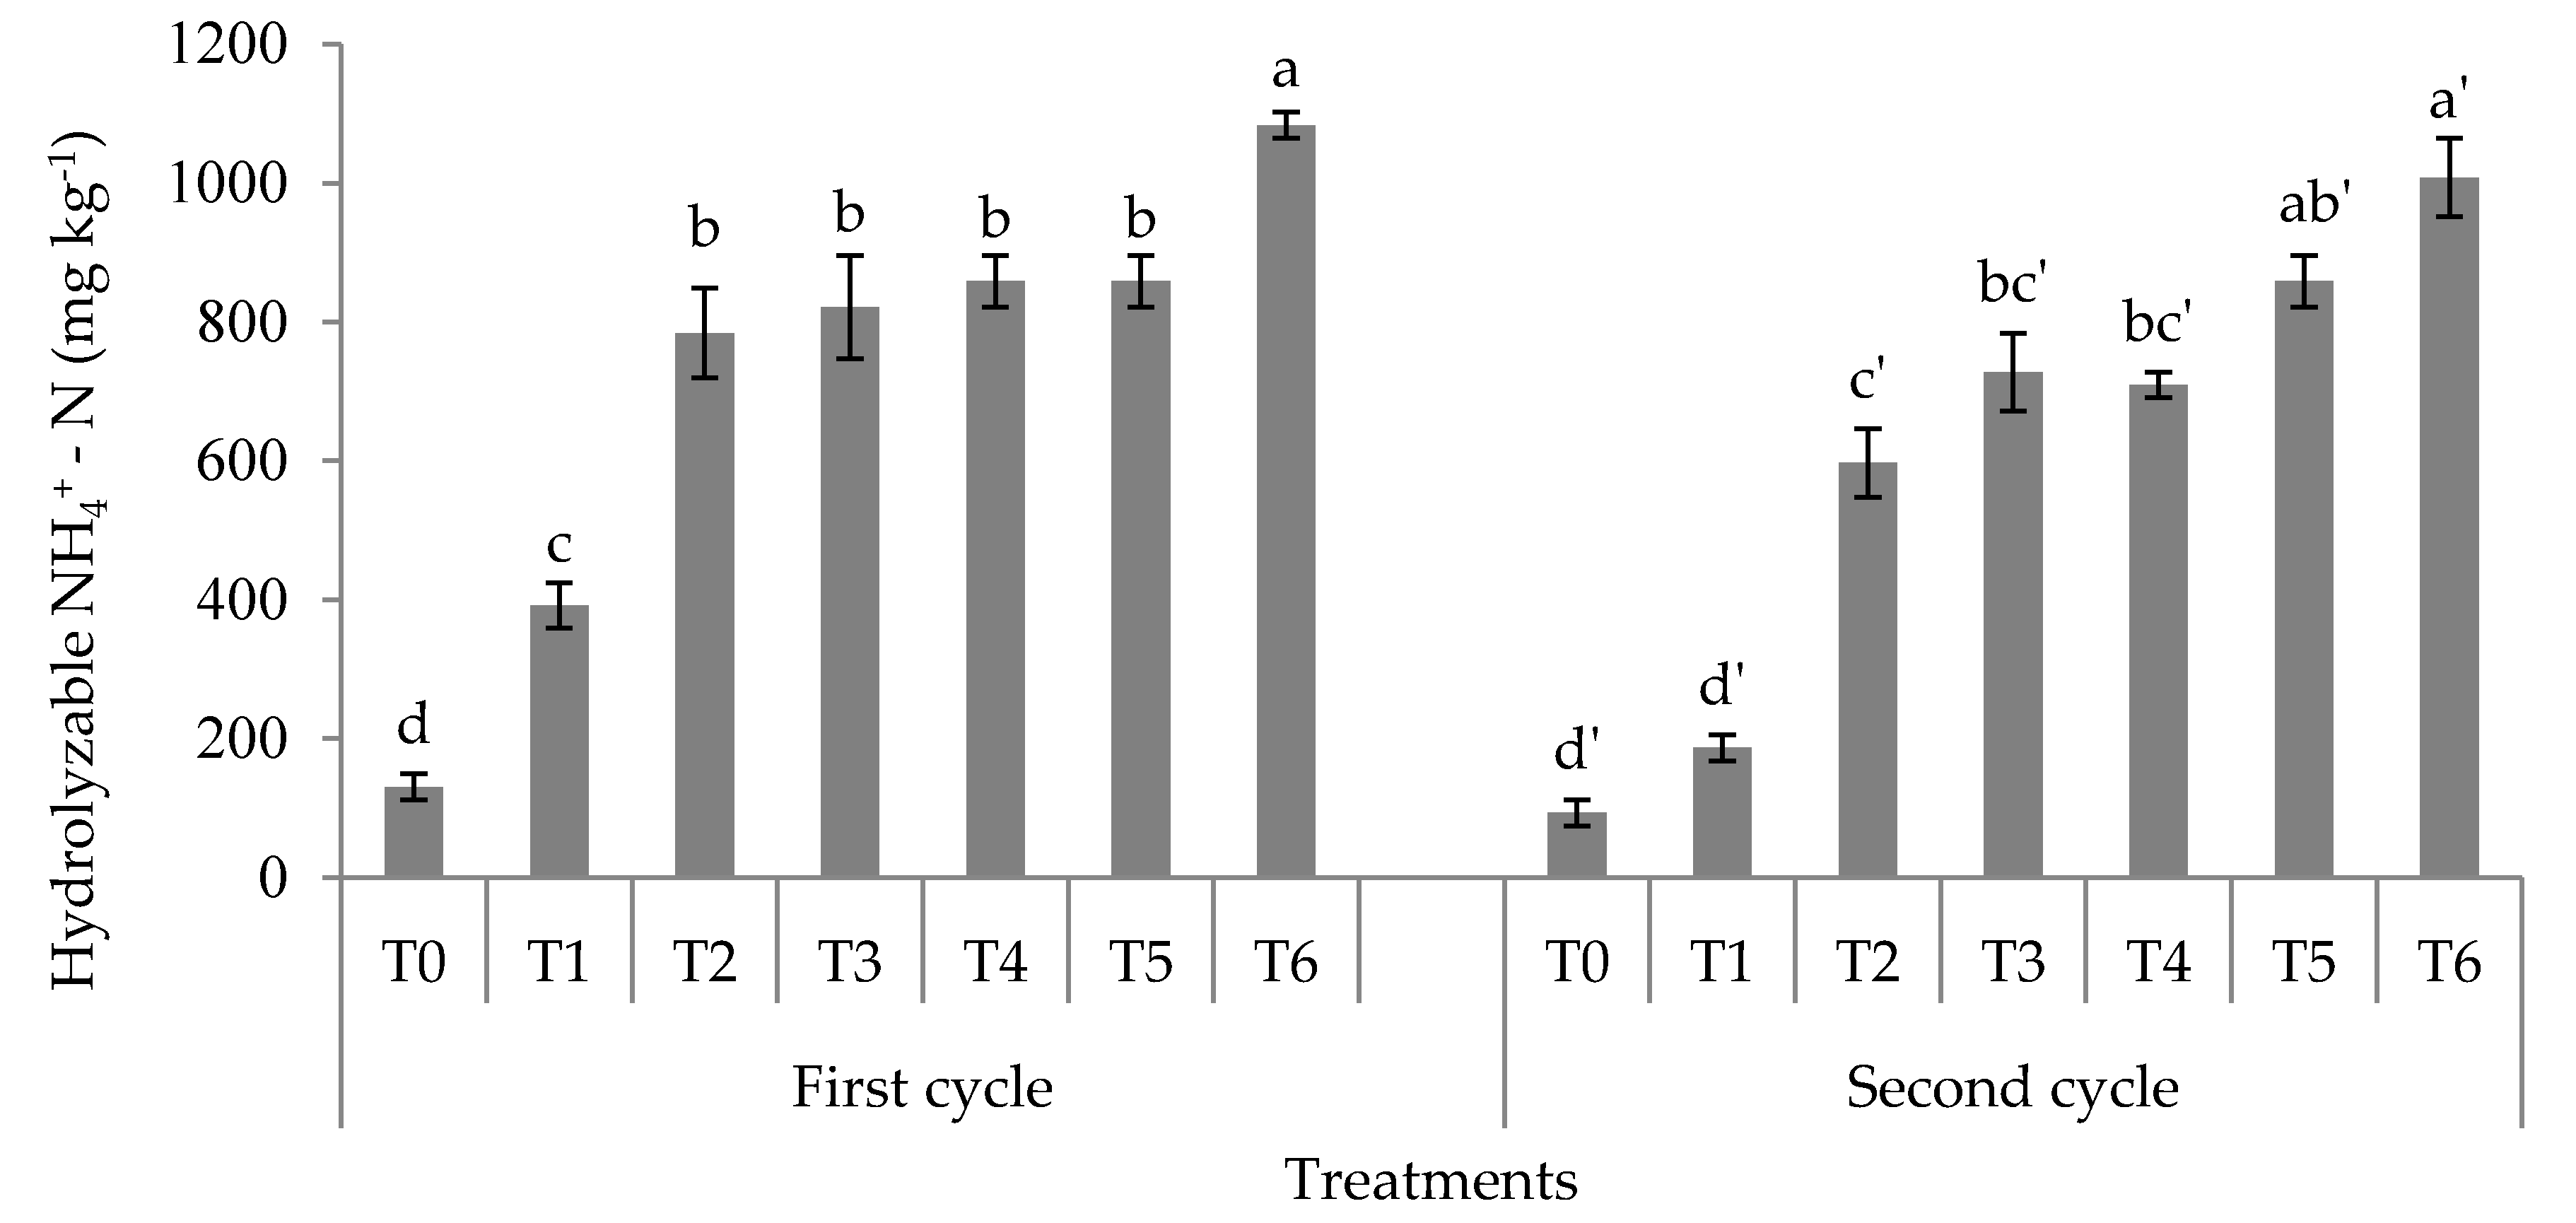
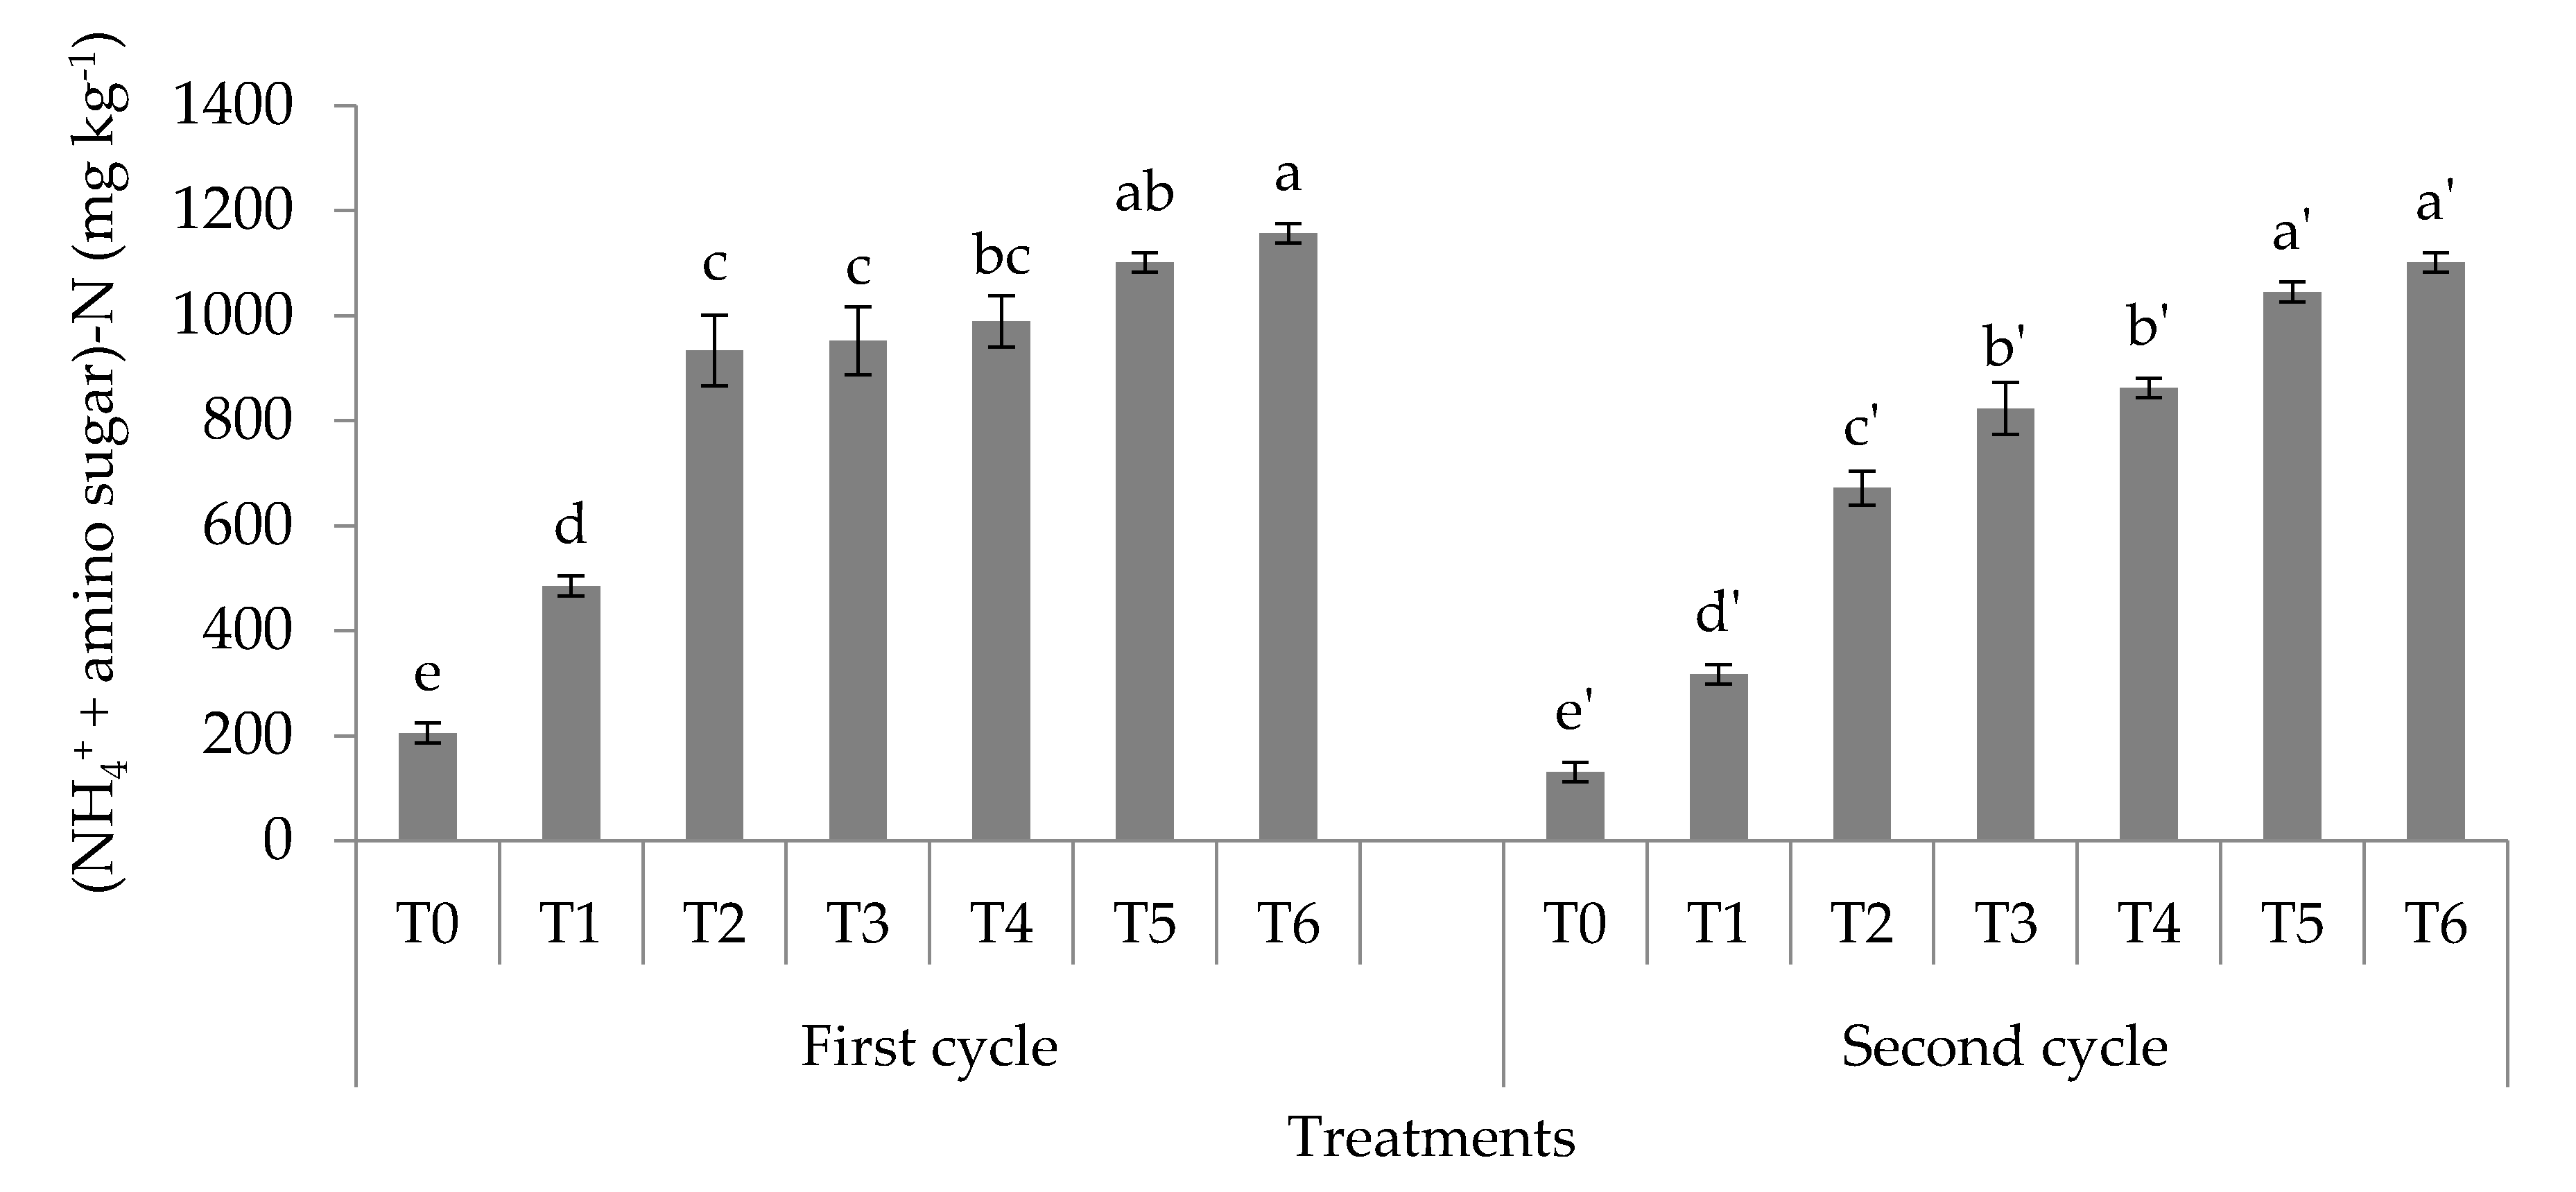
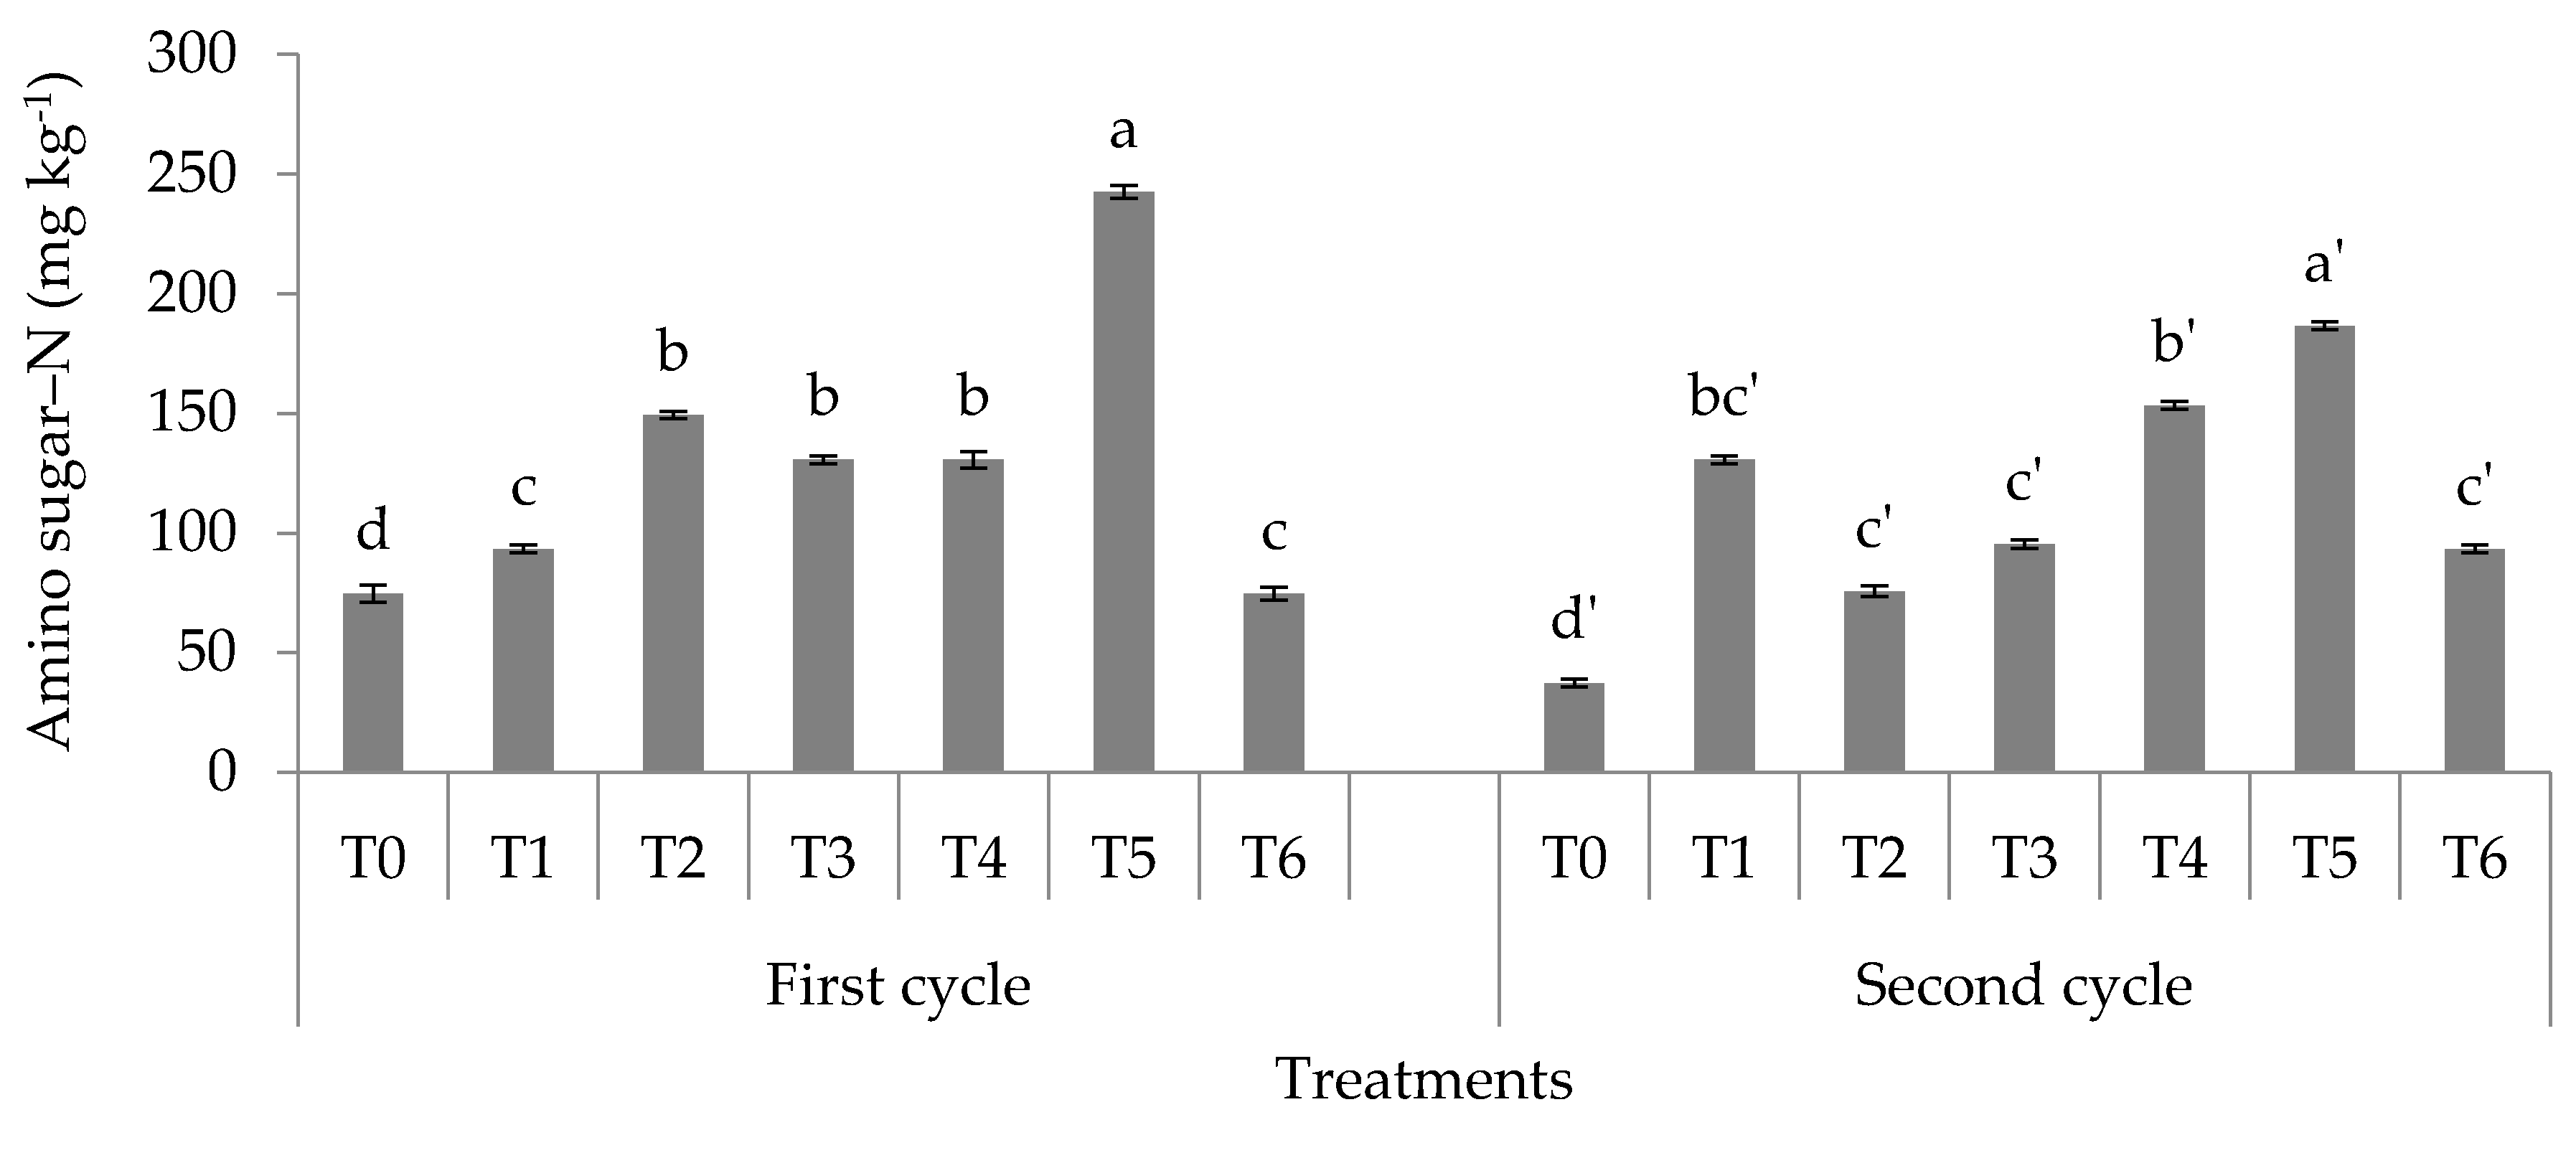
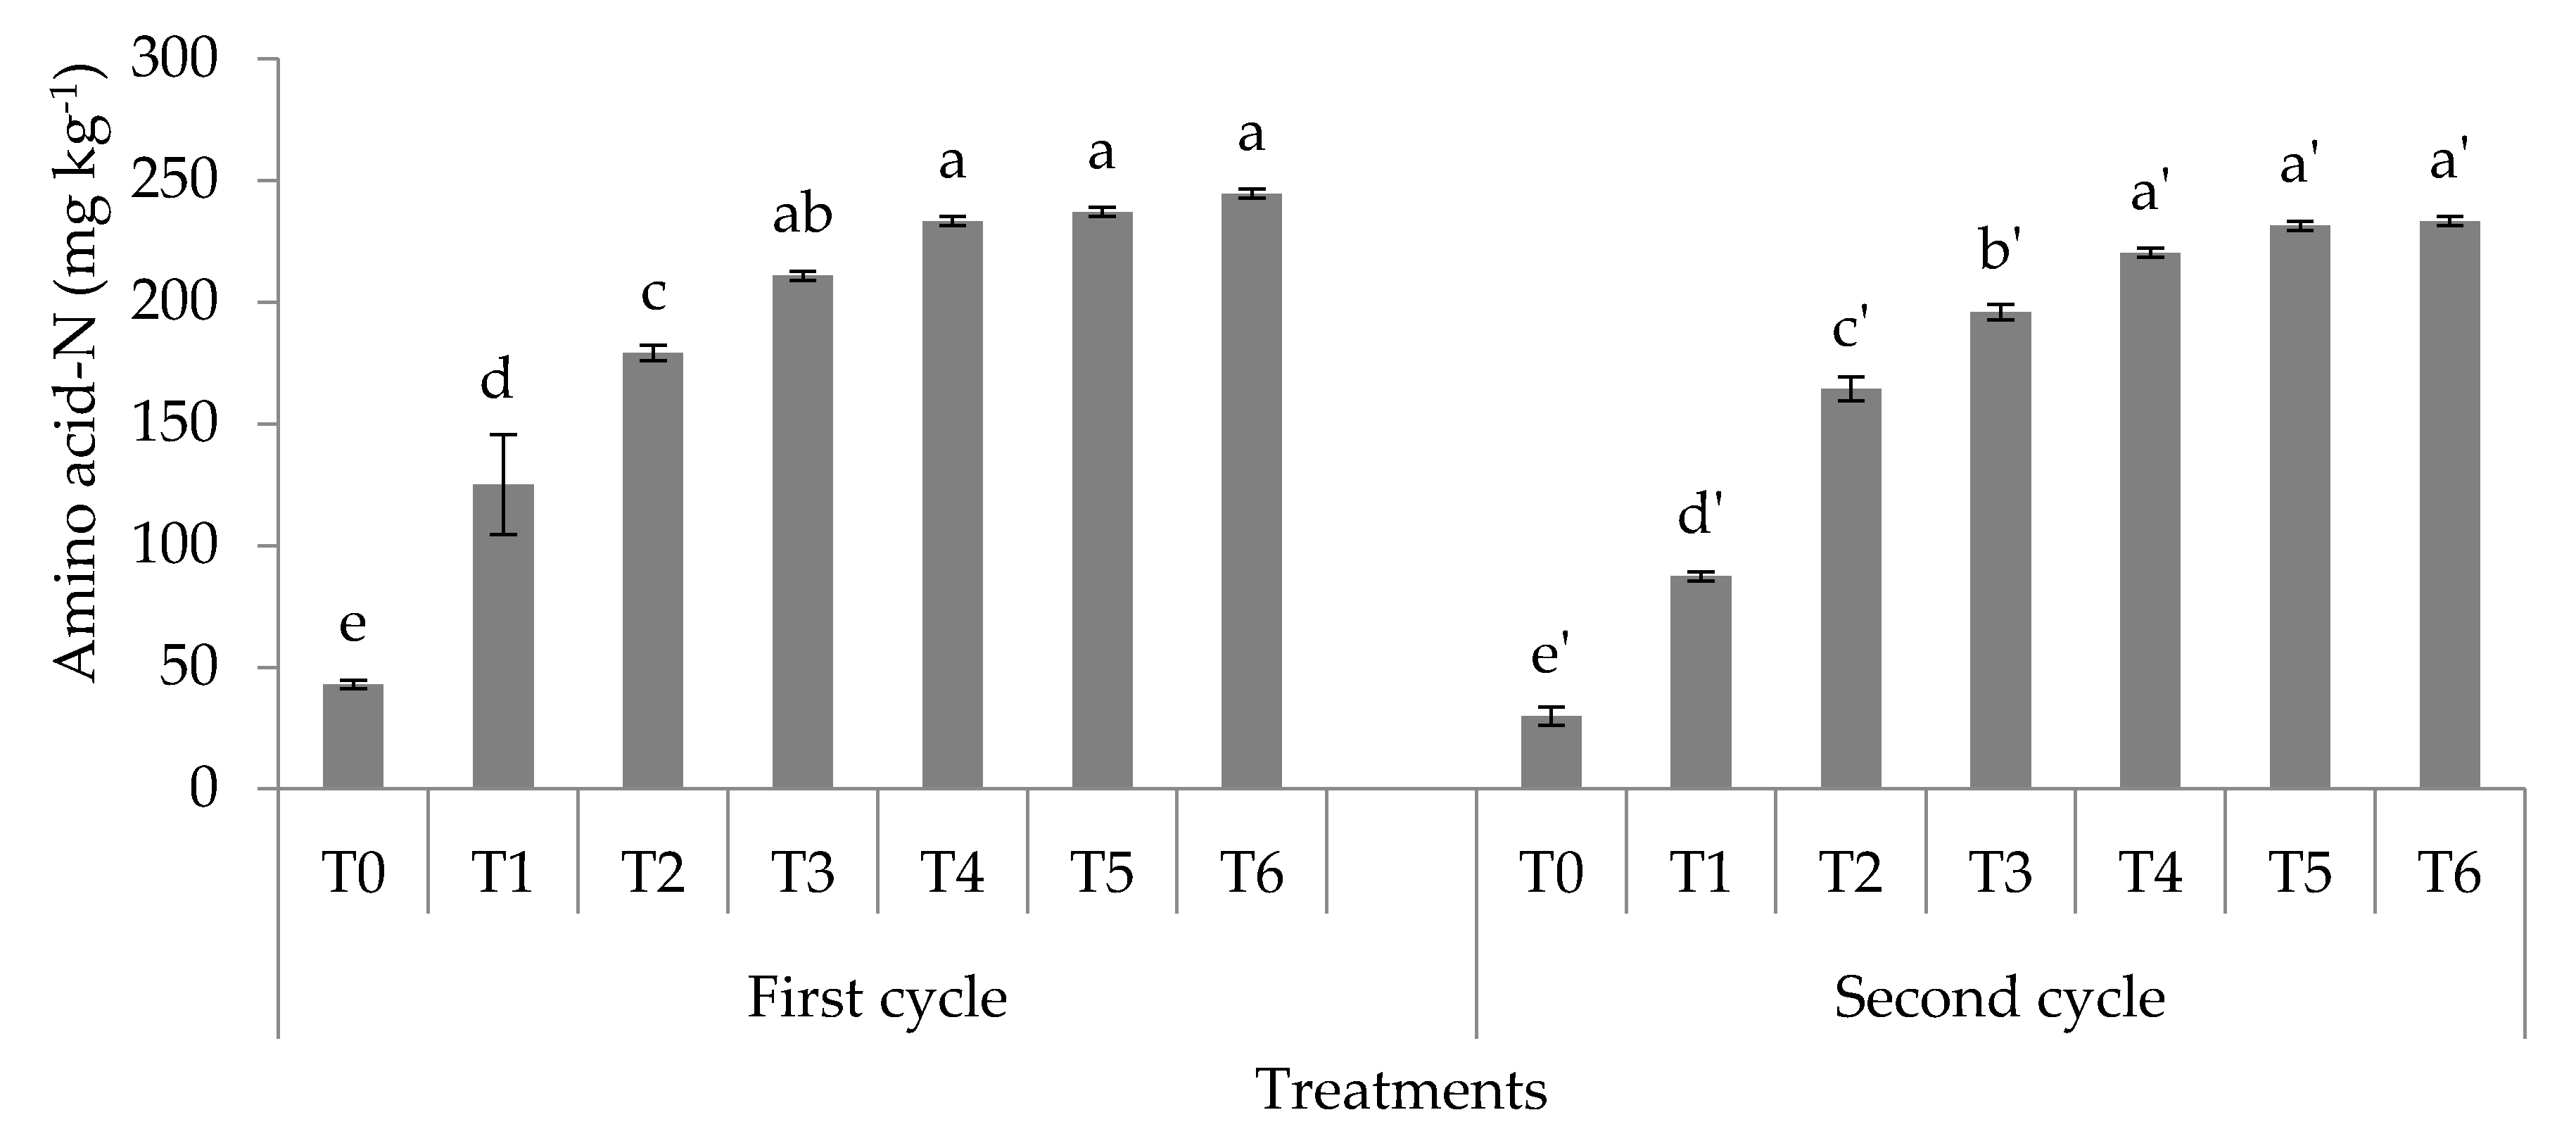
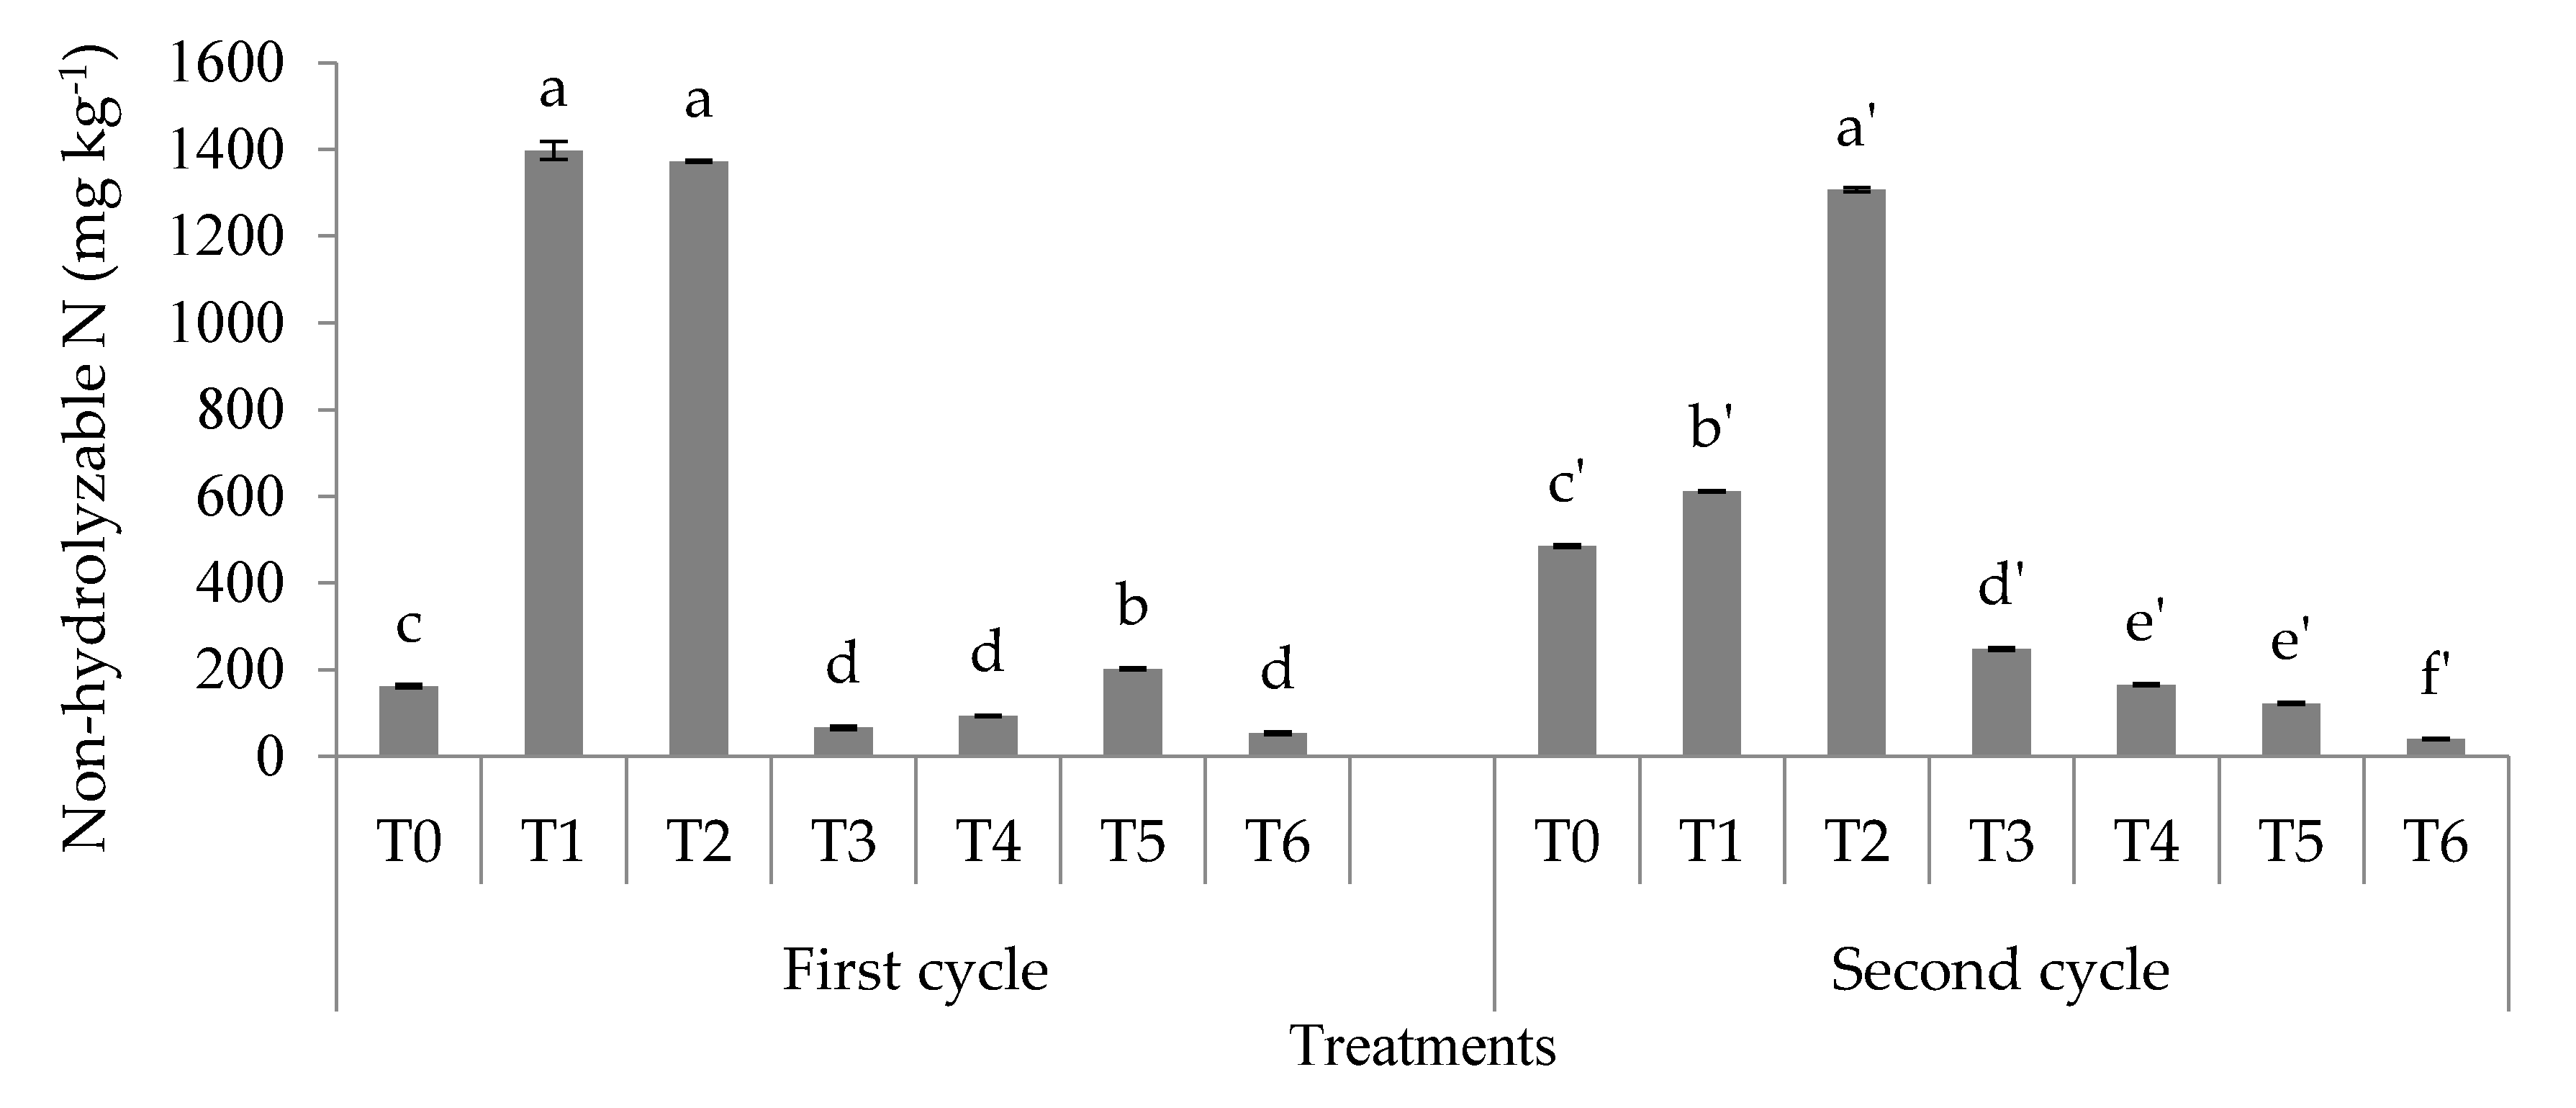
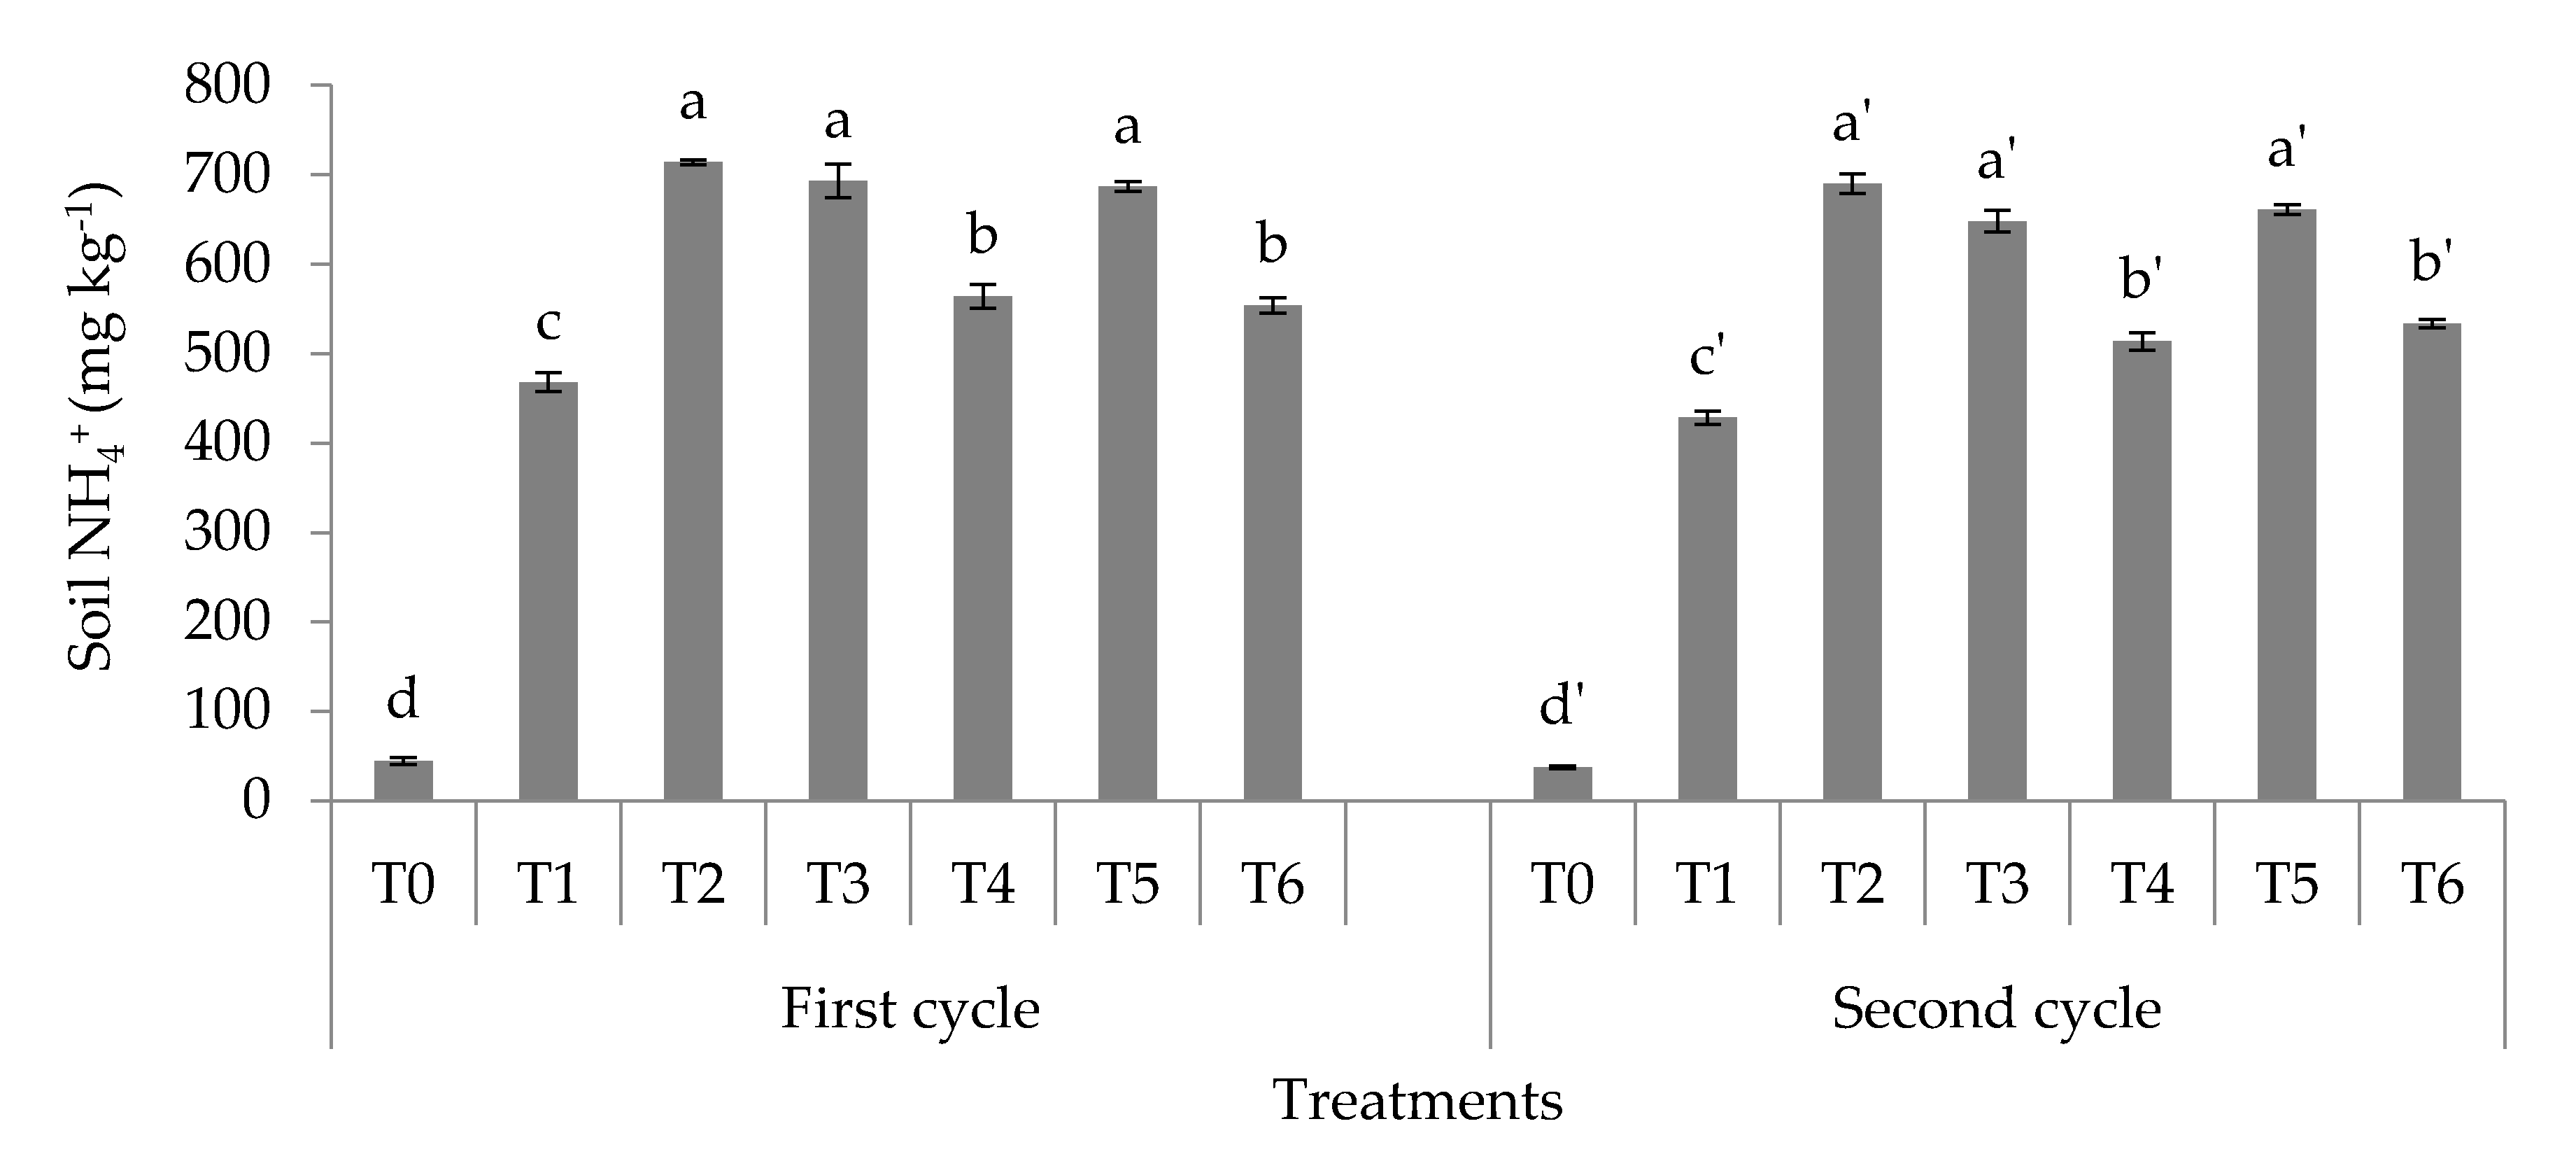
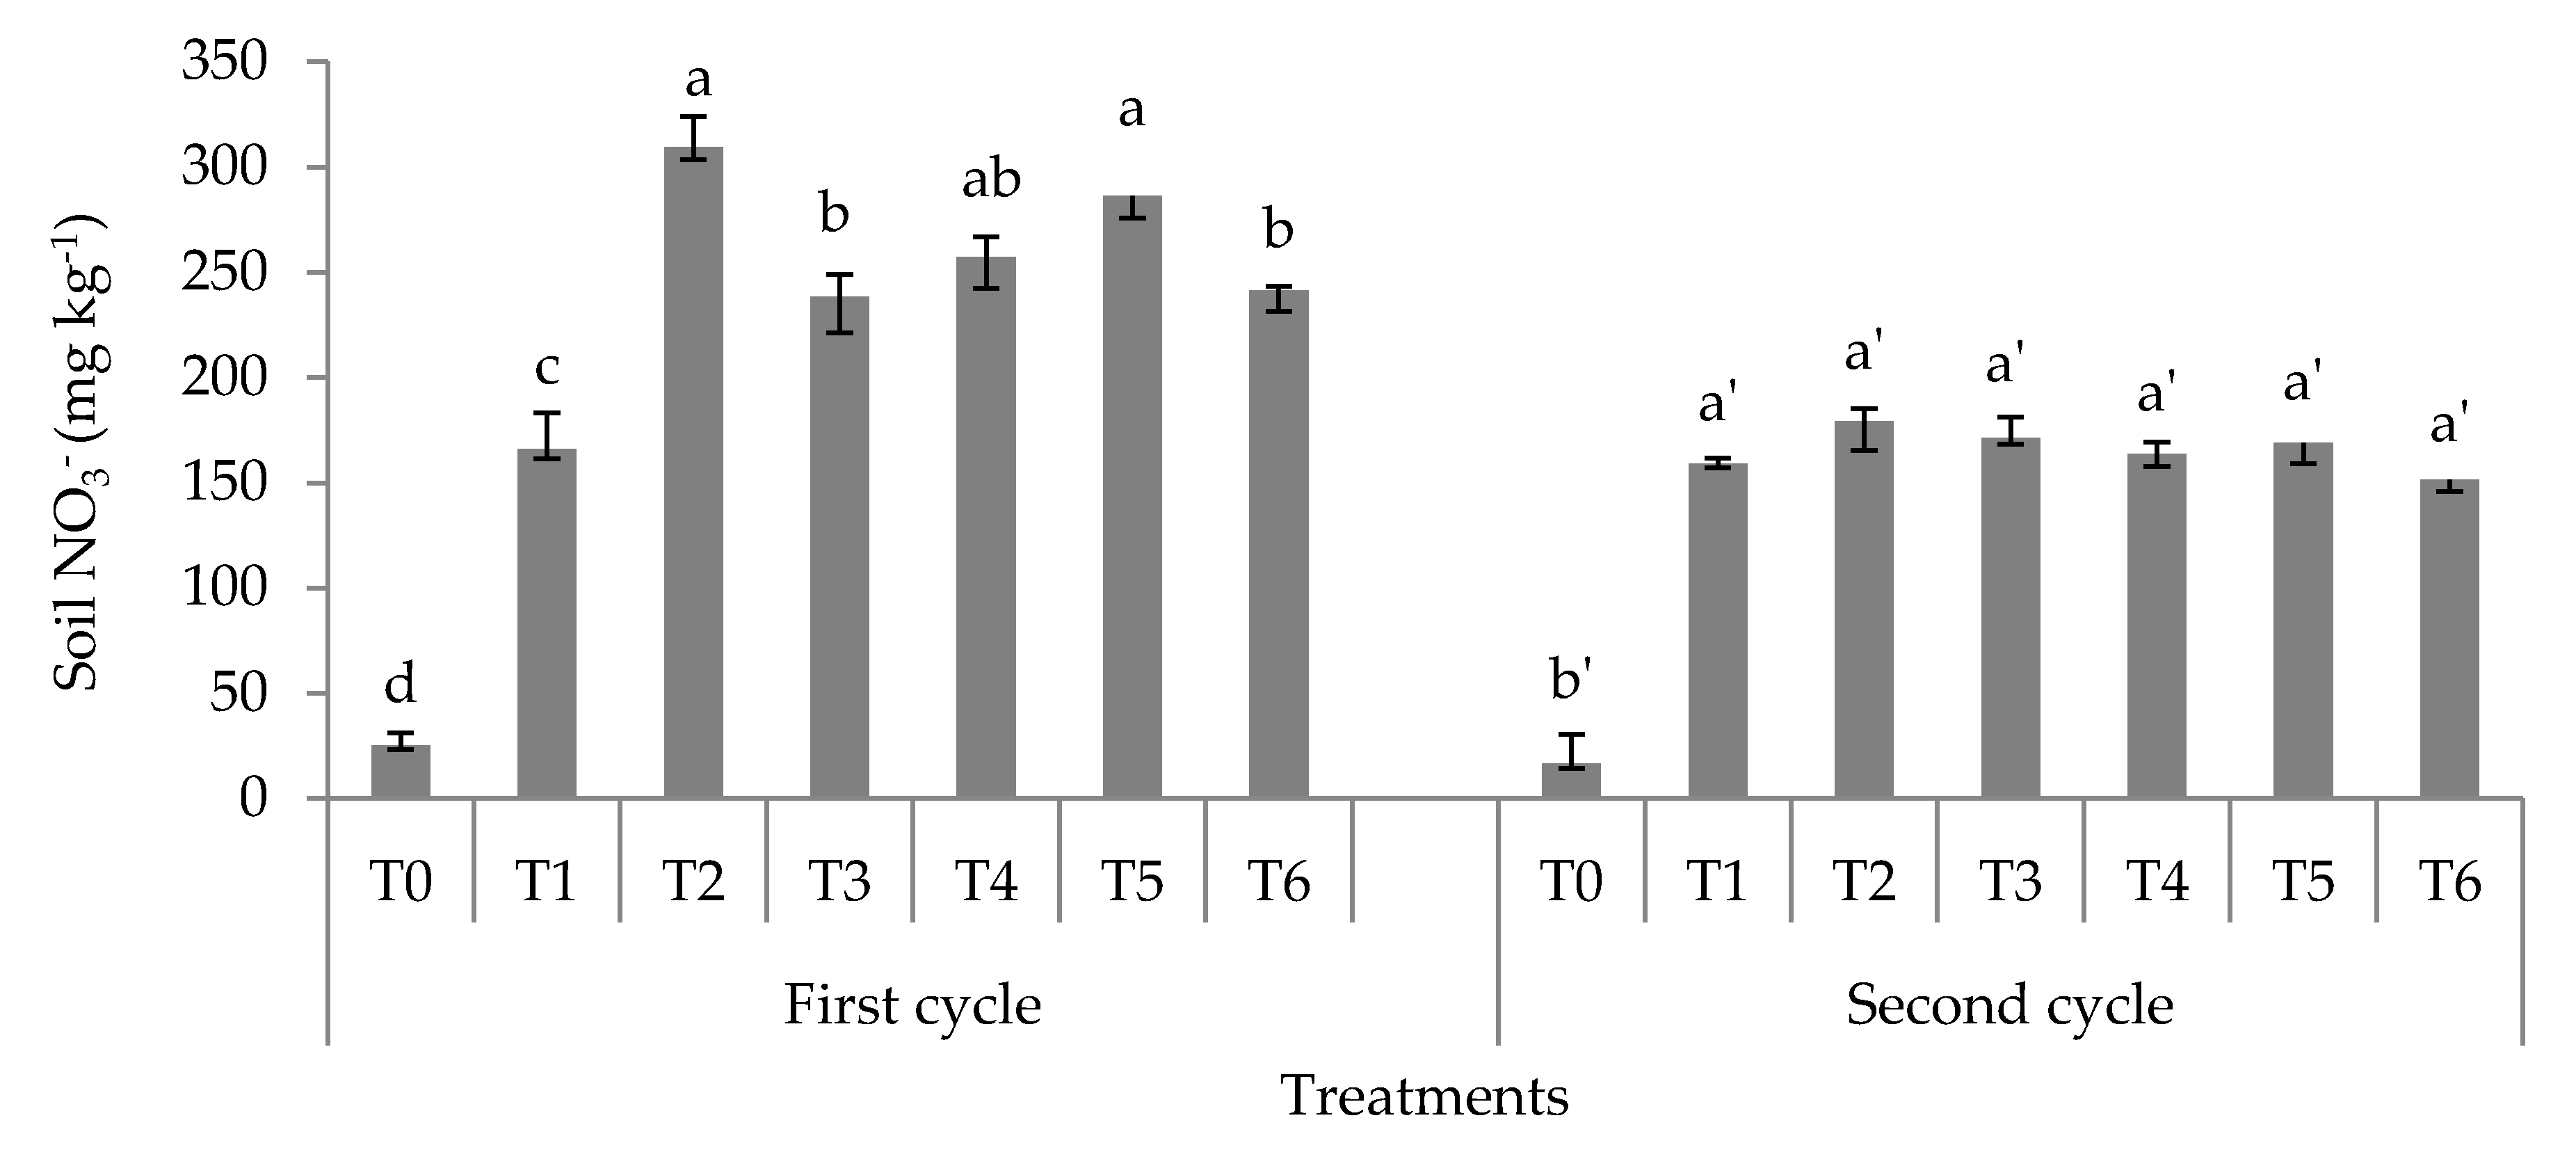
3.1. Soil Total, Organic, and Inorganic Nitrogen Fractions

For both crop cycles and all the five treatments consisting of different combinations of chemical fertilizers, CZ, rice straw compost or paddy husk compost (T2–T6), the total N in soil was significantly higher compared with the no fertilizer (T0) and standard chemical fertilizer (T1) treatments (Figure 1). For both crop cycles, T6 resulted in significantly higher soil total N compared with the rest of the treatments. Generally, the results obtained for the second crop were seemingly lower than that for the first crop.
Similar observations resulted for the different combination treatments consisting of chemical fertilizers, CZ, rice straw compost or paddy husk compost (T2, T3, T4, T5, and T6) with higher contents of total hydrolyzable N, hydrolyzable NH4–N, and (NH4+ + amino sugar)–N in soil as compared with soil alone (T0) and standard chemical fertilization (T1) for the two crop cycles. Irrespective of treatments, the results in Figure 2, Figure 3 and Figure 4 also show that the mean values for the variables in Figure 2, Figure 3 and Figure 4 were seemingly higher for crop cycle one compared to crop cycle two.
For the first maize crop, the content of soil amino sugar–N was significantly higher for treatments T2, T3, T4, and T5 in comparison with the soil alone (T0) and the recommended chemical fertilizer treatment (T1) as shown in Figure 5. The highest soil amino sugar–N content was seen for T5, with values significantly higher than that for all other treatments for both crops. However, with the exception of T1 and T4, all the other treatment results showed a reduced amount of soil amino sugar–N in the second crop in comparison to the first crop.
Irrespective of the maize crop e (first or second), higher content of soil amino acid–N resulted for the different treatment combinations consisting of chemical fertilizers, CZ, rice straw compost or paddy husk compost (T2, T3, T4, T5, and T6) at harvest in comparison to the soil alone (T0) and recommended chemical fertilizer application treatment (T1, Figure 6). However, the soil amino acid–N was seemingly lower for the second crop in comparison to the first crop for all the treatments.
For the first maize crop cycle, non-hydrolyzable N contents were significantly higher for T1 and T2 which are the recommended chemical fertilization alone and recommended chemical fertilizers amended with CZ treatments (Figure 7). Although the highest content of non-hydrolyzable N was observed for the recommended chemical fertilizer treatment (T1) and the recommended fertilizer with CZ treatment (T2) in the first crop cycle, the total N, total hydrolyzable N, hydrolyzable NH4+, (NH4+ + amino sugar)–N, amino sugar–N, and amino acid–N for T2 were significantly higher for the recommended chemical fertilizer with CZ treatment (T2) compared with the recommended chemical fertilizer treatment (T1, Figure 1, Figure 2, Figure 3, Figure 4, Figure 5 and Figure 6).
The higher exchangeable NH4+ shown by T2, T3, T4, T5, and T6 for both crop cycles, partly explains the reduced available NO3 in the soil treated with CZ for the second crop cycle (Figure 8 and Figure 9). With the exception of T3, the rest of the treatments resulted in seemingly higher soil ammonium content for the first crop cycle as compared with the second crop cycle. For soil nitrate content, the results for the second crop cycle were consistently seemingly lower than that for the first crop, regardless of the treatment.

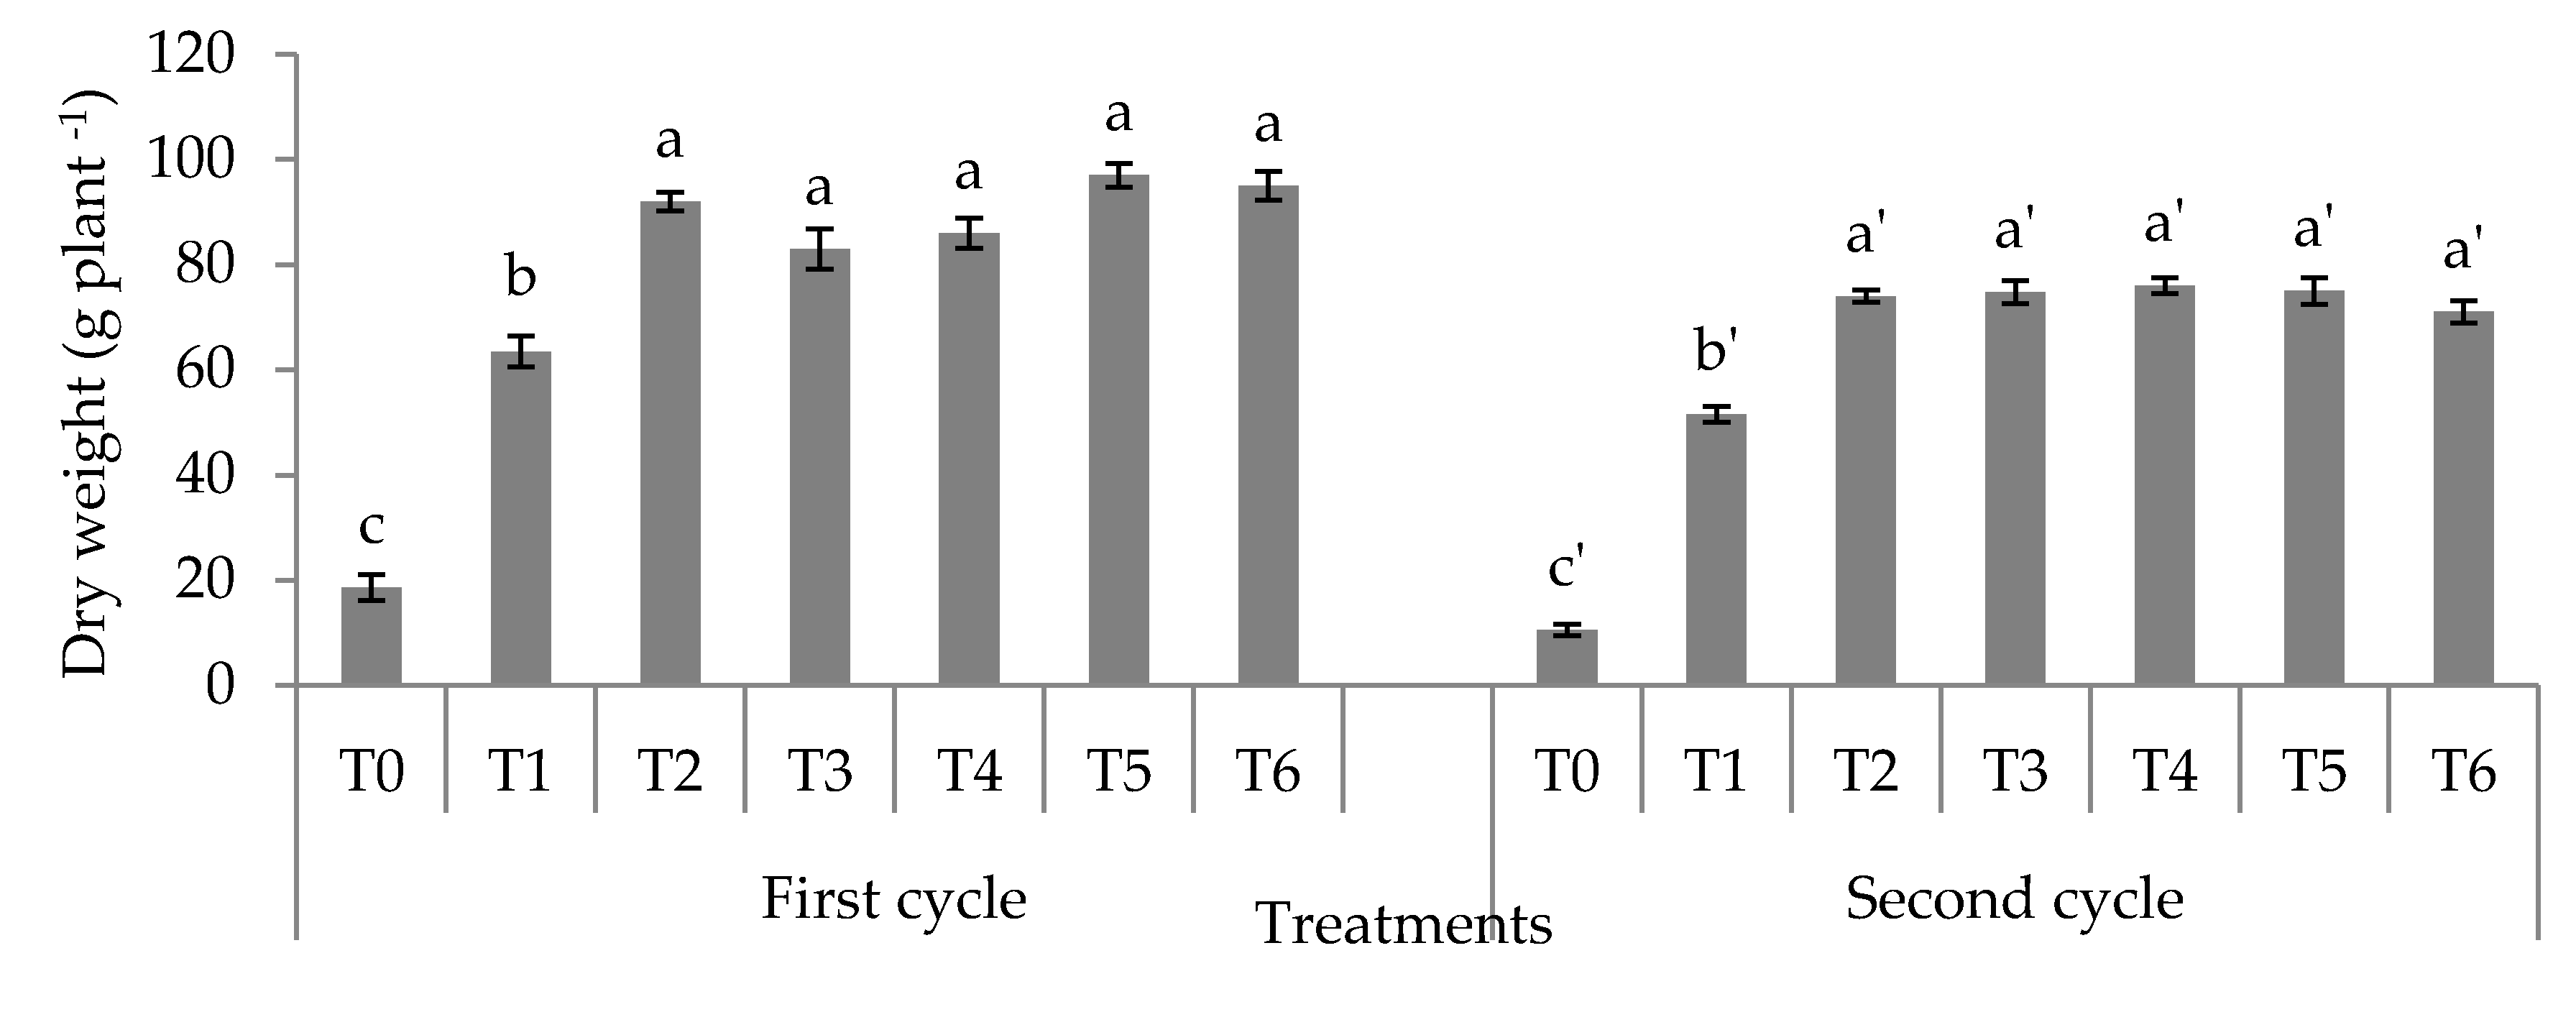
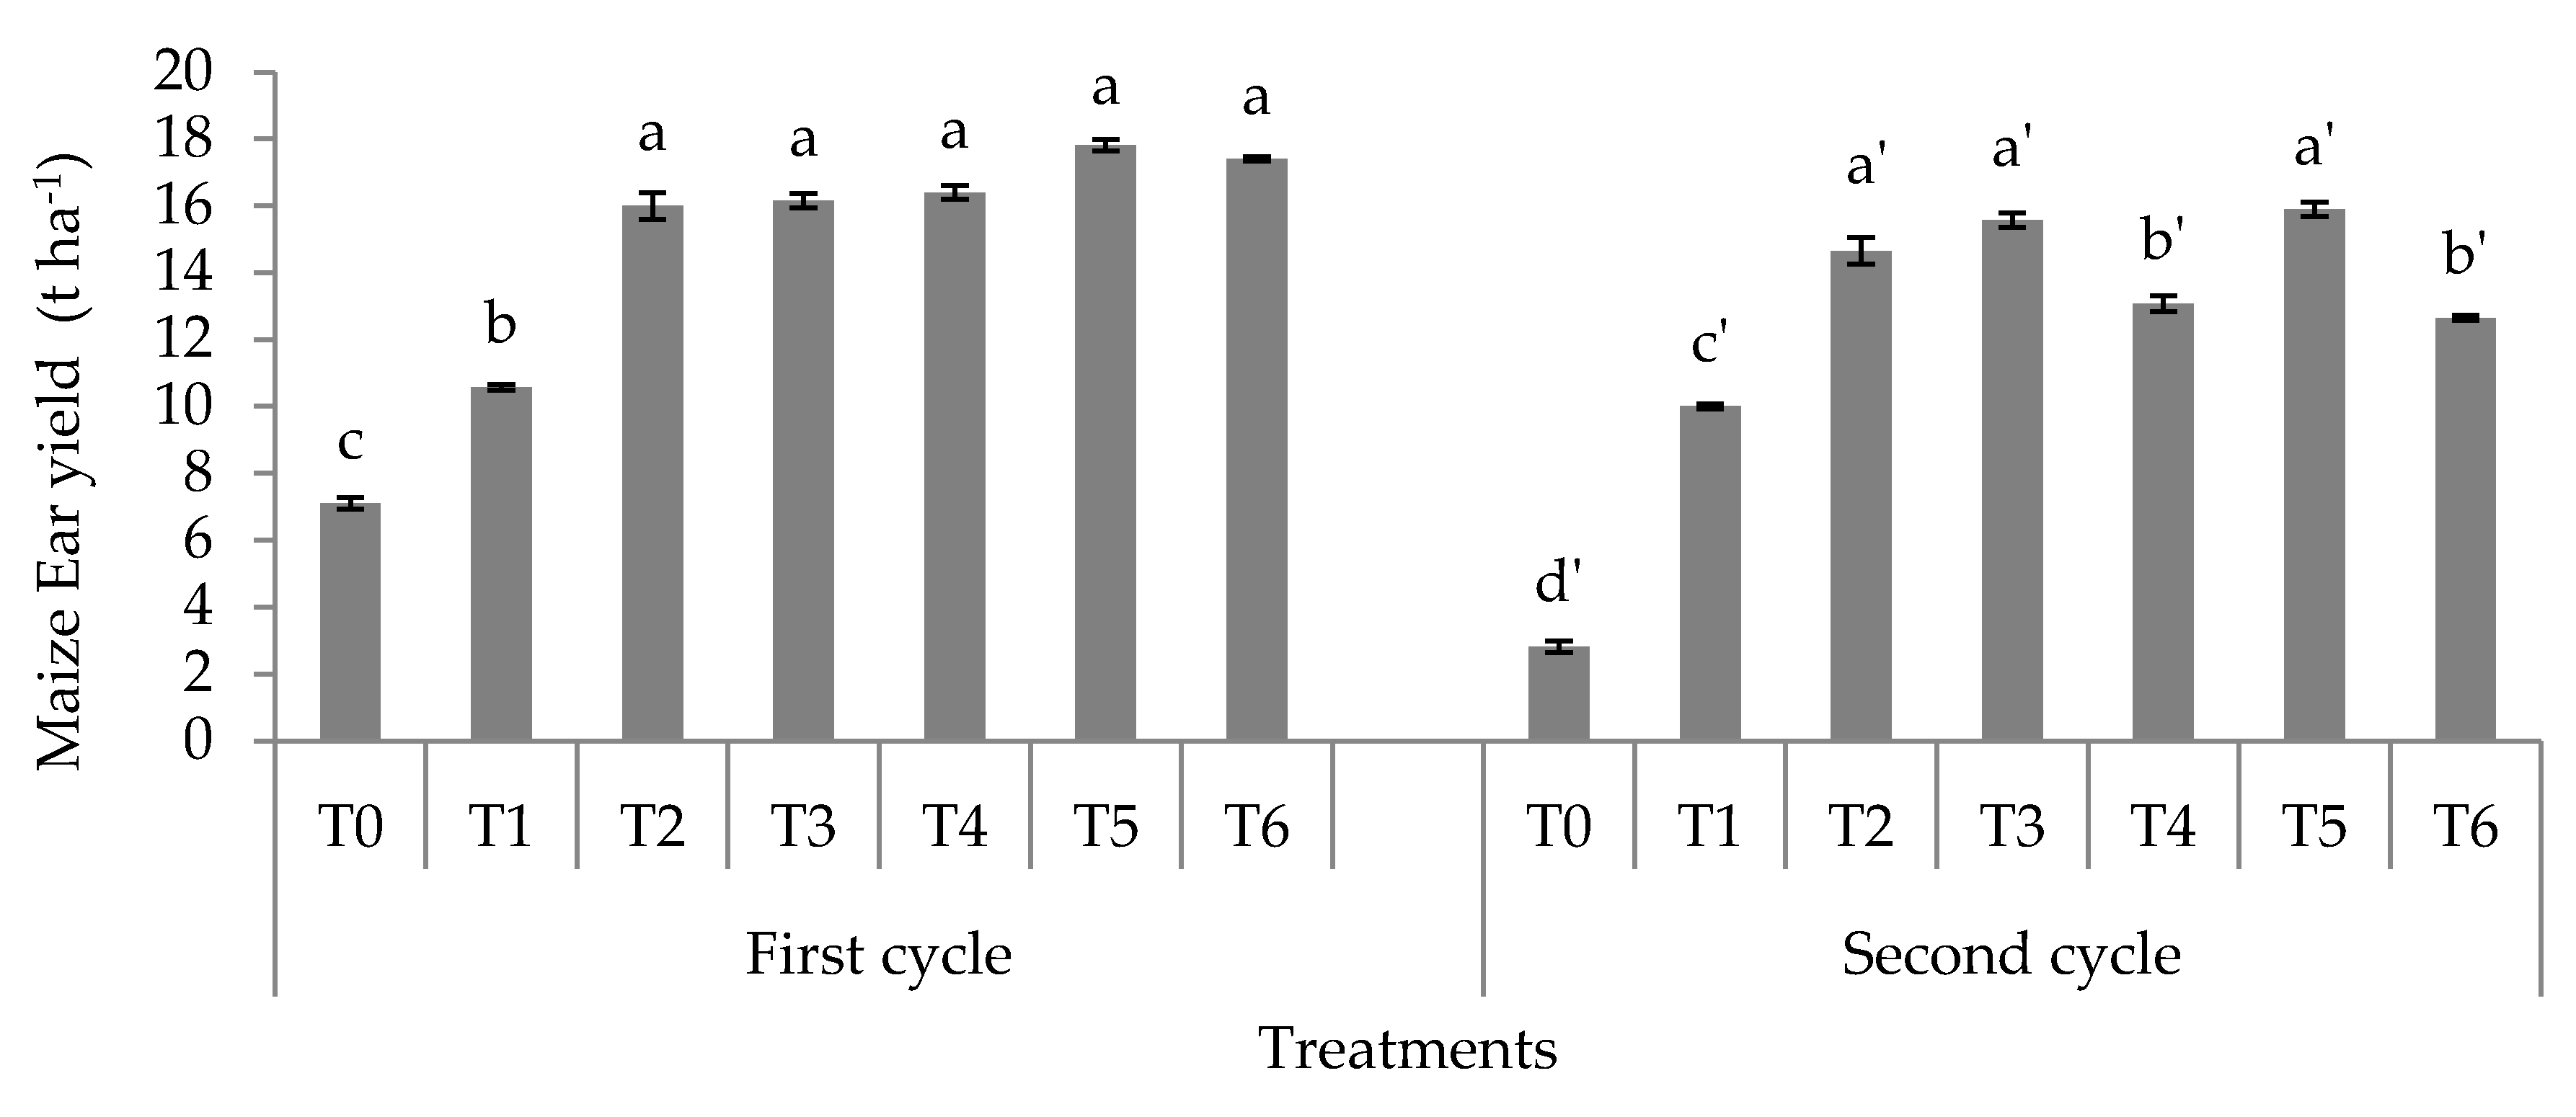
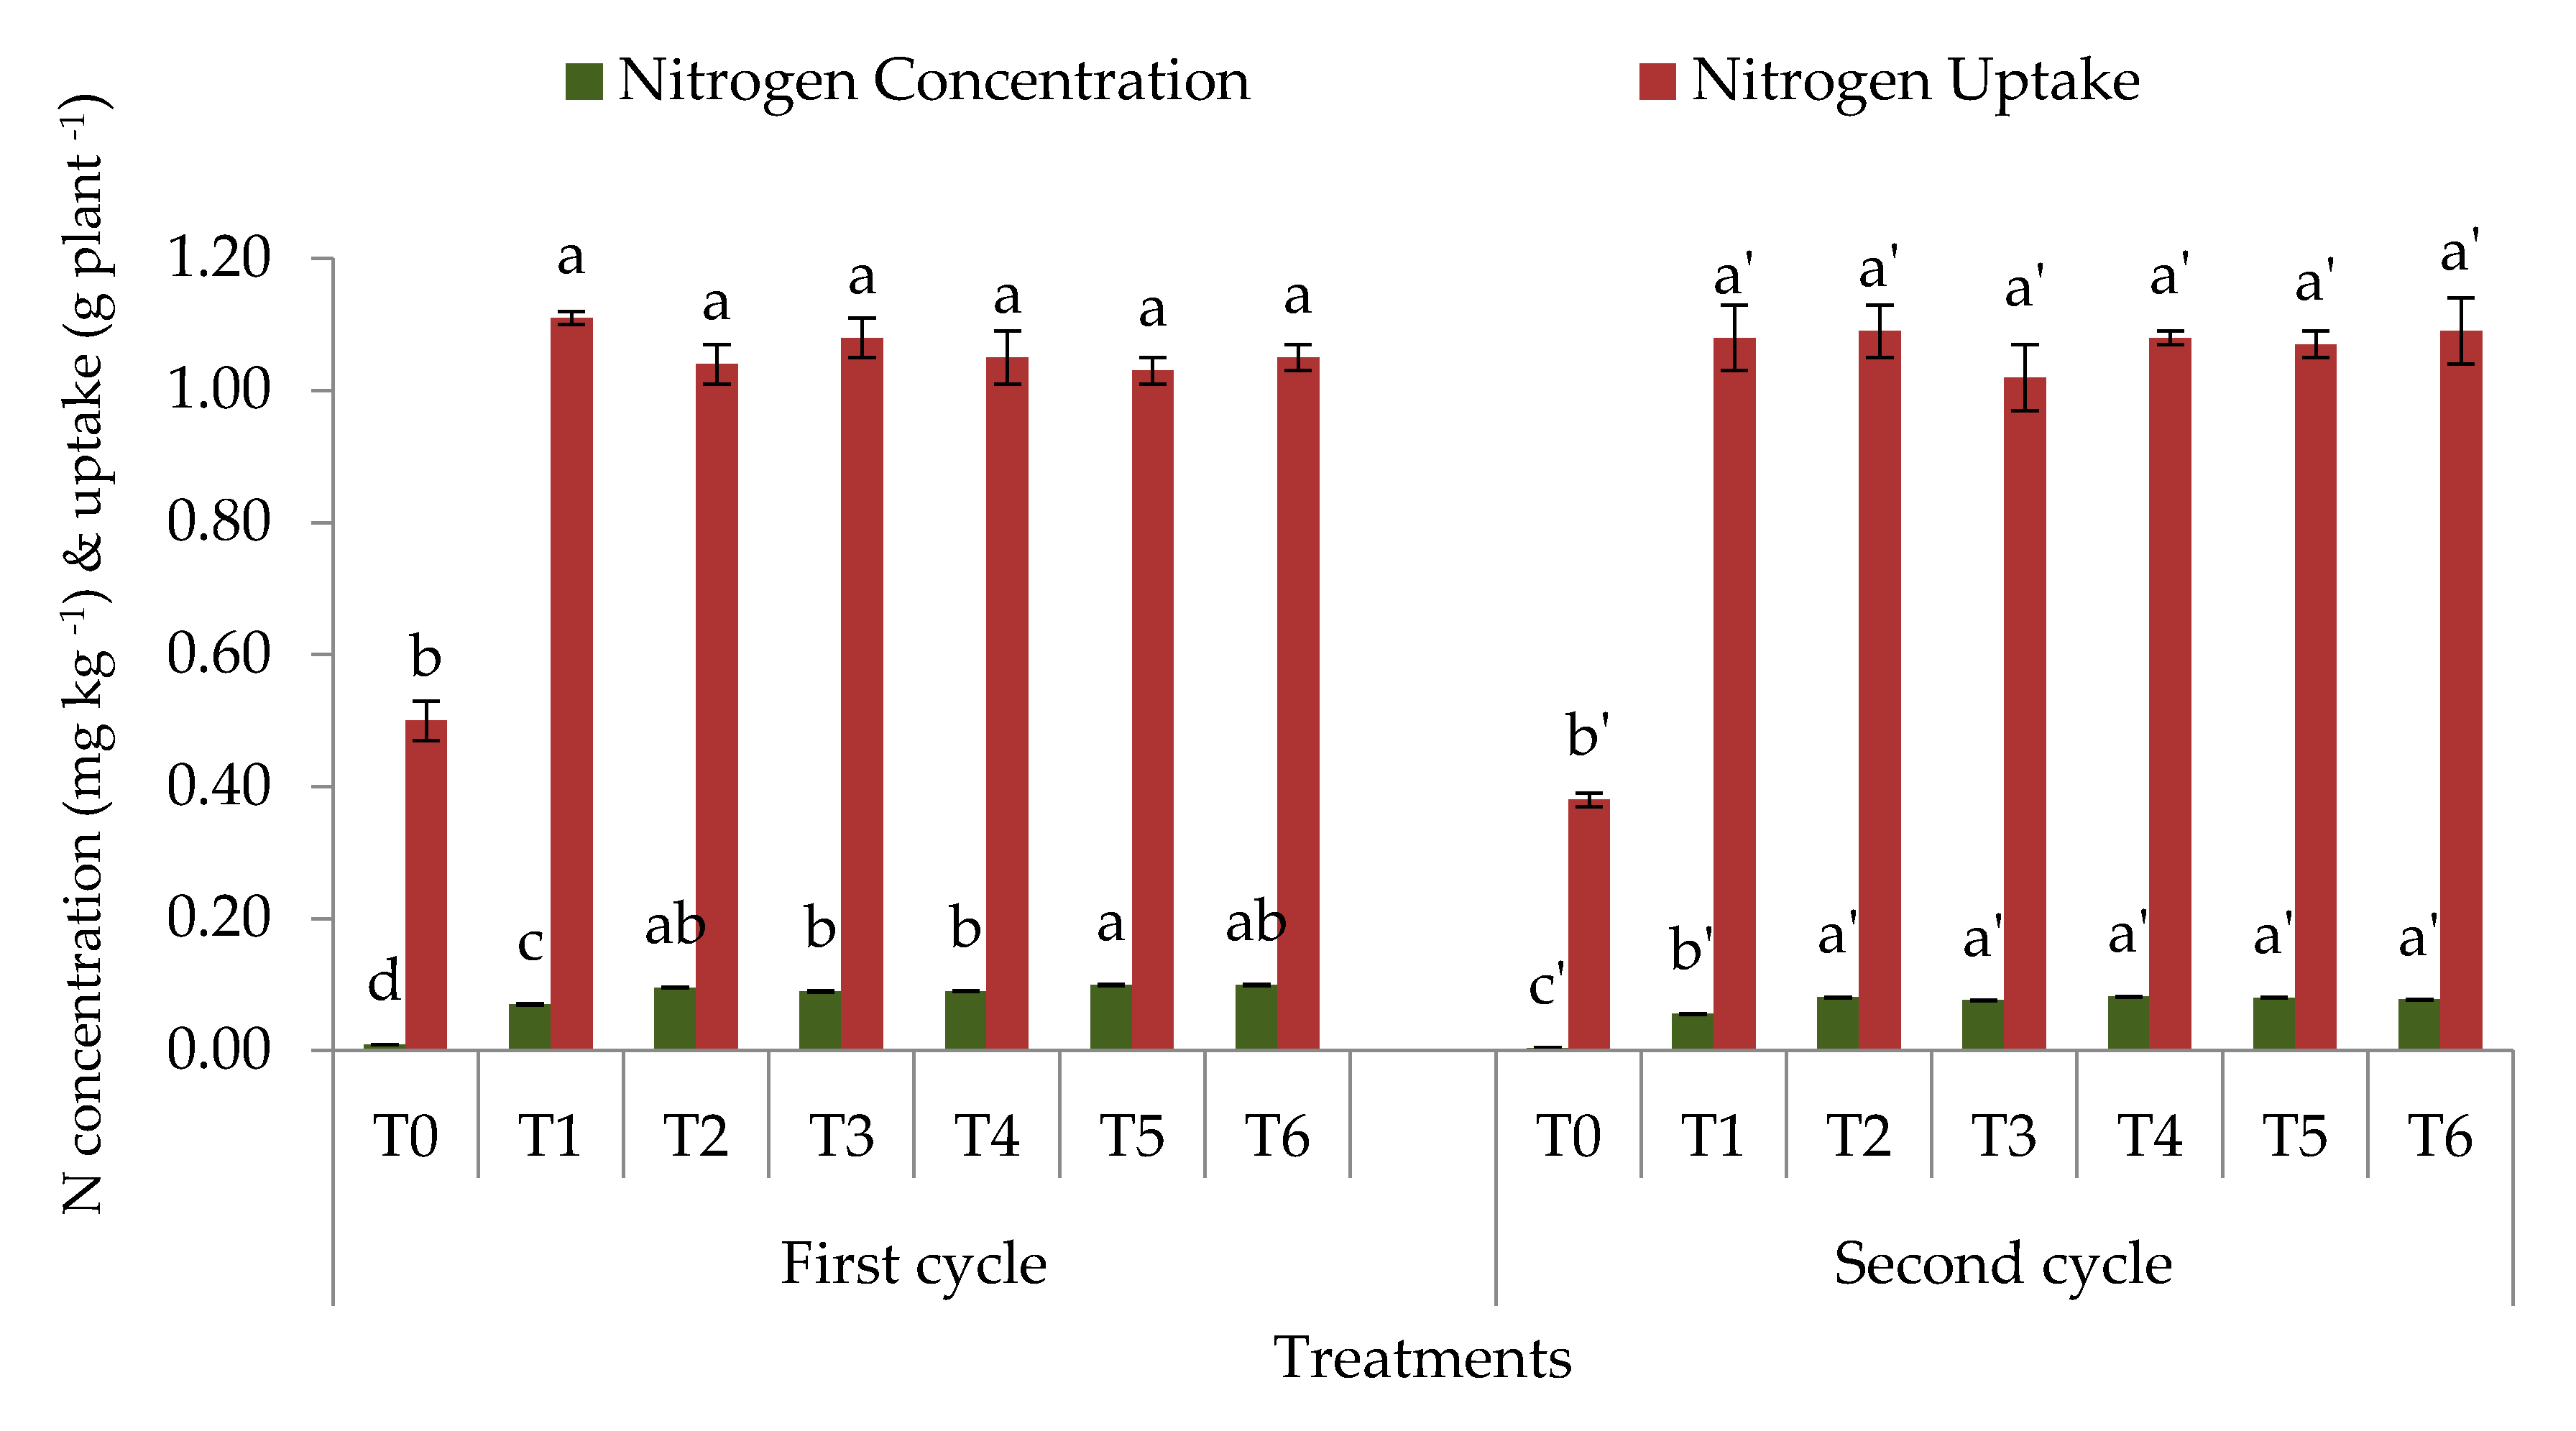
3.2. Dry Weight, Ear Weight, and Nitrogen Use Efficiency

The results show that the dry shoots and ears weighed significantly more for the five treatments containing CZ and composts (T2, T3, T4, T5, and T6) compared with that for T0 and T1, for both crop cycles (Figure 10 and Figure 11). In the first maize crop cycle, there were no significant differences in plant dry weight and ear yield among the treatment combinations (T2–T6). For all the treatments, the results show that dry weight of the maize plants and ear yield for the second cycle were seemingly lower in comparison with the first crop cycle. For the second crop cycle, T4 and T6 resulted in significantly lower ear yield compared with T2, T3, and T5, but the recommended conventional chemical fertilizer treatment (T2) showed comparatively significantly lower yields.
Nitrogen uptake was not significantly different between the recommended chemical fertilizer treatment (T1) and the treatments consisting of different combinations of recommended chemical fertilizers, CZ, rice straw compost, or paddy husk compost (T2, T3, T4, T5, and T6), as shown in Figure 12. The amount of nitrogen in the shoot biomass at harvest was significantly higher in the treatments consisting the various combinations of chemical fertilizers, CZ, rice straw compost and paddy husk compost (T2, T3, T4, T5, and T6) in comparison with the recommended chemical fertilizers application alone treatment (T1, Figure 12).
For the two crop cycles, the NUE indices (crop recovery of applied N and agronomic efficiency of applied N) were significantly lower for T1 compared with T2, T3, T4, T5, and T6, which suggests the positive effect of CZ, rice straw compost and paddy husk compost (Table 4). There were seemingly lower values for all treatments in the second crop cycle compared to the first crop cycle.

4. Discussion

4.1. Soil Total Nitrogen, Hydrolyzable Organic Nitrogen Fractions, and Mineral Nitrogen

The higher retention of soil total N was possible because of the high CEC of the CZ (100 cmolc kg−1), rice straw (86 cmolc kg−1), and paddy husk (176 cmolc kg−1) composts [10]. The higher soil total N in T2, T3, T4, T5, and T6 suggests that the use of CZ is effective in reducing N loss in soils, consistent with the findings of Ahmed et al. [24] and Junrungreang et al. [25]. Nitrogen ions retention by CZ is due to its open-ringed structure consisting of small-sized molecules that physically protect NH4+ ions against microbial nitrification [26]. The use of rice straw and paddy husk composts affected the retention of soil total N partly because their organic matter contents were 47% and 48.6%, respectively [11]. He et al. [27] reported that the organic matter content of composts resulted in slower mineralization to NH3 or NH4+ and NO3. Hence, with time, organic N accumulation in soil is influenced by the increase in total soil organic matter following the application of composts [28].
Using inorganic fertilizers, CZ, rice straw, and paddy husk composts together contributed to soil N availability and this directly affected the maize crop productivity. For the organic N fractions in soil, the higher hydrolyzable organic N fractions could be partly due to the adequate supply of substrates from the CZ, rice straw, and paddy husk composts for microbial growth and other activities. The limited supply of substrates such as the low content of total N associated with T0 (soil only) and T1 (recommended chemical fertilization) resulted in lower total hydrolyzable N, hydrolyzable NH4–N and (NH4+ + amino sugar)–N (Figure 2, Figure 3 and Figure 4). The relatively low C/N ratios of rice straw (15) and paddy husk (17) composts (Table 2), which are considered ideal for increasing N availability in soil, might have also partly caused the higher contents of soil total hydrolyzable N, hydrolyzable NH4–N and (NH4+ + amino sugar)–N in the plots treated with these composts. According to Tejada et al. [29], the C/N ratio of composts is a good indicator of N supply because composts having a C:N values ranging from 10 to 15 results in mineralization. In contrast, the addition of composts with C:N > 20 can induce soil microbial activities to decompose labile C, thus, causing immobilization of added inorganic N. The organic matter of rice straw and paddy husk composts are also sources of microorganisms to decompose soil organic matter.
The lower content of soil amino sugar–N in T2, T3, and T6 for the second crop cycle was partly a result of the amino sugar–N in these soils being the primary source of soil N that can easily be mineralized, resulting in a decrease in amino sugar–N (Figure 5). The higher content of soil amino sugar–N in T5 for the second crop suggests that the accumulated amino sugar–N can be mineralized for subsequent crops (residual or carry-over effect). Mulvaney et al. [30] reported that the accumulation of amino sugar–N in soils after the organic amendment application is related to N carry-over from previous cropping cycles. Parson [31] explains that the accumulation of soil amino sugar–N is due to the residue being decomposed by microbes whereby amino sugars are prominently present in cell wall materials generated by bacteria, fungi or actinomycetes. The higher contents of soil amino sugar–N is also related to microbial growth which is also responsible for the increased presence of glucosamine, muramic acid, and other amino sugars [32]. Amino sugars are more labile than other fractions of hydrolyzable N which influences the quantity of N that can be mineralized to supply the bulk of crop available N [30].
The elevated amounts of total hydrolyzable N, hydrolyzable NH4+, and (NH4+ + amino sugar)–N contents in T2–T6 (Figure 2, Figure 3 and Figure 4) are important as amino acids affect mineralization levels by bacteria which are able to reduce amino acids into soil exchangeable NH4+ [33]. Higher amino acid–N were observed in the plots with rice straw compost or paddy husk compost suggesting that amino acid–N in the soil depends on the supply of organic matter [34]. The lower non-hydrolyzable N in the plots with inorganic fertilizers, CZ, and rice straw compost or paddy husk compost (Figure 7) was due to the higher hydrolyzable and amino based nitrogen (Figure 2, Figure 3, Figure 4, Figure 5 and Figure 6). Leinweber and Schulten [35] reported that the proportion of non-hydrolyzable N was relatively higher in unfertilized soils, whereas the application of organic fertilizers led to increased hydrolyzability of the organic N compounds and lower non-hydrolyzable N. The organic matter in the rice straw and paddy husk composts might have contributed substantially to the soil hydrolyzable N because this is supported by the higher contents of amino sugar–N and amino acid–N following application of T3, T4, T5, and T6, regardless of the cropping cycle. The remaining fractions of the N-containing molecules in the plots treated with T1 and T2 (first crop) are not quantified by hydrolysis procedures and are therefore considered to be part of an aggregate unidentified fraction of acid hydrolysates [36]. The unaccounted fraction of acid hydrolysates contributed to bias in the estimation of the decomposable hydrolyzable N fraction. This is because the soil organic N fractions can be replenished through depletion of the unknown organic N fraction or unhydrolyzable N [37].
Microbes will decompose organic N from the substrate provided by the organic matter of the rice straw and paddy husk composts for their growth and activities. Therefore, the quantity of substrate available from organic amendments has an impact on soil N availability because it causes higher exchangeable ammonium and available nitrate [24]. The absorption and retention capacity of CZ for ammonium released from urea, rice straw compost, and paddy husk compost enables adequate maintenance of N supply in the soil. A slow release of N might also be the reason for the higher soil exchangeable ammonium for T2–T6 compared with T0 and T1 (without CZ) for both crop cycles and available NO3 for the first crop (Figure 8 and Figure 9). The lower available nitrate in the plots with the different treatment combinations consisting chemical fertilizers, CZ, rice straw compost or paddy husk compost (treatments T2, T3, T4, T5, and T6) for the second crop is related to the retention of ammonium ions by CZ, rice straw compost and paddy husk compost such that nitrifying bacteria could not readily and rapidly oxidize the ammonium ions. The lower soil available nitrate in the plots with T2–T6 (second crop cycle) indicates that the ammonium ions were held (internally) to the exchange sites within the CZ to prevent the nutrients from being easily leached as water infiltrates the soil [38]. This observation lends credence to the wide use of CZ in agriculture as an amendment for enhancing the retention of nitrogen in soils [39]. However, to sustain N levels in the soil over two cropping cycles, the results indicate that it could be beneficial to add compost for each crop.

4.2. Dry Weight, Fresh Cob Weight, and Nitrogen Use Efficiency

The framework of the CZ which comprises tiny pores enables ammonium to be held in the cation exchange sites of this mineral [40]. It thus works in a similar manner to slow-release fertilizers where ammonium ions are released slowly to be taken up by the maize. This is further supported by the findings of He et al. [27] who also reported that the combined application of urea and CZ led to an increase in crop dry weight. This was attributed to CZ serving as a control release fertilizer. The rice straw and paddy husk composts also contributed to the increase in the dry weight of the maize shoots. As reported by [41], the mineralization and timely availability of N from compost application during the cropping season can contribute to an increase in dry matter production of cereals. The results of Perrin et al. [42] showed that co-application of CZ and N fertilizer minimized N leaching but increased N utilization of crops grown on sandy soil.
The findings in a previous study support the ability of clinoptilolite zeolite to adsorb ammonium [12]. The CEC and higher adsorption by CZ caused significant sorption of ammonium released from the urea, rice straw compost, and paddy husk compost. This was due to CZ’s properties namely, aluminosilicate framework, high cation exchange capacity, ion adsorption, and preferential selectivity for ammonium [43]. In addition, the high organic matter in the plots with rice straw compost or paddy husk compost resulted in higher plant N content and uptake for T3–T6 compared with the recommended chemical fertilizer application (T1). This was possibly because organic N in the organic matter of the rice straw and paddy husk composts were converted to inorganic forms (ammonium and nitrate), through mineralization, for maize uptake. Montemurro’s [44] findings showed that the co-application of composts and inorganic fertilizers led to an 8% increase in wheat yield than was achieved with the use of inorganic fertilizers alone. Habteselassie et al. [45] also reported that steady and slow mineralization of N in compost amended soils resulted in sustained N supply to crops. The lower plant N content and uptake for T1 are related to poor retention of ammonium and nitrate and this was the reverse for T2–T6 (Figure 1). The combined use of compost and inorganic fertilizers resulted in a build-up of N in the soil with improved NUE [46]. Uher and Balogh [47] demonstrated that CZ could be used to temporarily fix ammonium but it can also be used to gradually release NH4+ similar to the way in which slow-release fertilizers release N. The retention of N in soil and the associated enhancement of N uptake in the plants (Figure 1, Figure 8, and Figure 9) explain why the ear weight was significantly higher (Figure 11) for the different treatment combinations consisting of chemical fertilizers, CZ, rice straw compost or paddy husk compost as compared with the recommended chemical fertilizer application alone. The results of Palm et al. [48] showed significantly higher NUE for the combined application of inorganic and organic fertilizers than with the application of inorganic fertilizers alone.

5. Conclusions

The combined application of chemical fertilizers, CZ, and rice straw compost or paddy husk compost can improve soil N fractions, including soil total N, total hydrolyzable organic N, exchangeable ammonium, and available nitrate, than is achieved with the application of recommended chemical fertilizers alone. The treatments with a 50% reduction in recommended chemical fertilizers, CZ, and rice straw compost or paddy husk compost (T4 and T6) are recommended instead of the 100% recommended chemical fertilizer treatment. The organic materials used for these two treatments are abundantly available and if adopted, the practice will reduce the economic and environmental costs of applying large quantities of chemical fertilizers alone. The lower results obtained for the second maize crop cycle compared with the first maize crop cycle lend support to the fact that the organic amendments should be applied for every crop cycle or for multiple cycles until significant carry-over effects are established. Longer-term studies may be necessary to ascertain or confirm the residual effects that may occur, which could lead to some reductions in fertilizer applications over the long term.

Author Contributions

L.O., O.H.A., M.B.J. and A.M.N.M. conceived and designed the experiments, contributed reagents, materials and analysis tools, as well as were involved in preparation of the manuscript and making the decision to publish. L.O., O.H.A. and M.B.J. were also involved in data collection and analysis. All authors have read and agreed to the published version of the manuscript.

Funding

This research was funded by Ministry of Higher Education Malaysia and Universiti Putra Malaysia through Fundamental Research Grant Scheme (FRGS 5524983) and Translational Research Grant (TRG 5526500).

Acknowledgments

The authors are grateful to colleagues and staff of Universiti Putra Malaysia, Bintulu, Sarawak Campus and Universiti Malaysia Sabah, Sandakan Branch, Sabah for the technical cooperation.

Conflicts of Interest

The authors declare no conflict of interest.

References

  1. Khan, S.A.; Mulvaney, R.L.; Hoeft, R.G. A simple soil test for detecting sites that are nonresponsive to nitrogen fertilization. Soil Sci. Soc. Am. J. 2001, 65, 1751–1760. [Google Scholar] [CrossRef]
  2. Sharma, R.P.; Verma, T.S. Dynamics of nitrogen fractions with long-term addition of Lantana camara biomass in rice-wheat cropping sequence. J. Ind. Soc. Soil Sci. 2001, 49, 407–412. [Google Scholar]
  3. Wander, M.M. Soil organic matter fractions and their relevance to soil function. In Soil Organic Matter in Sustainable Agriculture; Magdoff, F.R., Weil, R.R., Eds.; CRC Press: Boca Raton, FL, USA, 2004; pp. 67–102. [Google Scholar]
  4. Sainju, U.M.; Senwo, Z.N.; Nyakatama, E.Z.; Tazisong, L.A.; Reddy, R.C. Tillage, cropping system, and nitrogen fertilizer sources effects on soil and carbon sequestration. J. Environ. Qual. 2008, 37, 880–888. [Google Scholar] [CrossRef] [PubMed]
  5. Herrera, J.M.; Rubio, G.; Häner, L.L.; Jorge, A.; Carlos, D.A.; Lucho-Constantino, A.; Islas-Valdez, S.; Pellet, D. Emerging and established technologies to increase nitrogen use efficiency of cereals. Agronomy 2016, 6, 25. [Google Scholar] [CrossRef] [Green Version]
  6. Alvarez, R.; Grigera, S. Analysis of soil fertility and management effects on yields of wheat and corn in the rolling Pampa of Argentina. J. Agron. Crop Sci. 2005, 191, 321–329. [Google Scholar] [CrossRef]
  7. Nielsen, R.L. N Loss Mechanisms and Nitrogen Use Efficiency. 2006 Purdue Nitrogen Management Workshops. Available online: http://www.agry.purdue.edu/ext/pubs/2006NLossMechanisms.pdf (accessed on 21 March 2020).
  8. Dobermann, A. Nitrogen use efficiency: State of the art. In Proceedings of the IFA International Workshop on Enhanced-Efficiency Fertilizers, Frankfurt, Germany, 28–30 June 2005; International Fertilizer Industry Association: Paris, France, 2005; pp. 1–18. [Google Scholar]
  9. Cassman, K.G.; Dobermann, A.; Walters, D.T. Agroecosystems, nitrogen-use efficiency, and nitrogen management. Ambio 2002, 31, 132–140. [Google Scholar] [CrossRef]
  10. Latifah, O.; Ahmed, O.H.; Majid, N.M.A. Short term enhancement of nutrient availability in Zea mays L. cultivation on an acid soil using compost and clinoptilolite zeolite. Compost Sci. Util. 2017, 25, 22–35. [Google Scholar] [CrossRef]
  11. Latifah, O.; Ahmed, O.H.; Majid, N.M.A. Improving ammonium and nitrate release from urea using clinoptilolite zeolite and compost. Sci. World J. 2015. [Google Scholar] [CrossRef]
  12. Latifah, O.; Ahmed, O.H.; Majid, N.M.A. Effect of organic amendment derived from co-composting of chicken slurry and rice straw on reducing nitrogen loss from urea. Commun. Soil Sci. Plant Anal. 2016, 47, 639–656. [Google Scholar]
  13. Latifah, O.; Ahmed, O.H.; Majid, N.M.A. Amending chemical fertilizers with rice straw compost and clinoptilolite zeolite and their effects on nitrogen use efficiency and fresh cob yield of Zea mays L. Commun. Soil Sci. Plant Anal. 2018, 49, 1795–1813. [Google Scholar]
  14. Bremner, J.M. Total nitrogen. In Methods of Soil Analysis, Part 2; Black, C.A., Evans, D.D., Ensminger, L.E., White, J.L., Clark, F.F., Dinauer, R.C., Eds.; American Society of Agronomy: Madison, WI, USA, 1965; pp. 1149–1178. [Google Scholar]
  15. Keeney, D.R.; Nelson, D.W. Nitrogen-inorganic forms. In Methods of Soil Analysis, Part 2, 2nd ed.; Page, A.G., Keeney, D.R., Baker, D.E., Miller, R.H., Rhoades, J.D., Eds.; American Society of Agronomy: Madison, WI, USA, 1982; pp. 643–698. [Google Scholar]
  16. Ming, D.W.; Dixon, J.B. Clinoptilolite in South Texas soils. Soil Sci. Soc. Am. J. 1986, 50, 1618–1622. [Google Scholar] [CrossRef]
  17. Wingenfelder, U.; Nowack, B.; Furrer, G.; Schulin, R. Adsorption of Pb and Cd by amine-modified zeolite. Water Res. 2005, 39, 3287–3297. [Google Scholar] [CrossRef]
  18. Jorgensen, T.C.; Weatherley, L.R. Continuous ion-exchange removal of ammonium ion onto clinoptilolite in the presence of contaminants. Asia-Pac. J. Chem. Eng. 2008, 3, 57–62. [Google Scholar] [CrossRef]
  19. Torma, S.; Vilcek, J.; Adamisin, P.; Hronec, E. Influence of natural zeolite on nitrogen dynamics in soil. Turk. J. Agric. For. 2014, 38, 739–744. [Google Scholar] [CrossRef]
  20. Tan, K.H. Soil Sampling, Preparation, and Analysis, 2nd ed.; CRC Press: Boca Raton, FL, USA, 2005; p. 672. [Google Scholar]
  21. Paramananthan, S. Soils of Malaysia: Their Characteristics and Identification; Academy of Sciences Malaysia & Param Agricultural Soil Surveys: Kuala Lumpur, Malaysia, 2000; Volume 1, pp. 121–125. [Google Scholar]
  22. Malaysia Agriculture Research and Development Institute (MARDI). Jagung Manis Baru (New Sweet Corn): Masmadu; Malaysia Agriculture Research and Development Institute: Serdanag, Malaysia, 2010; pp. 3–5.
  23. Mulvaney, R.L.; Khan, S.A. Diffusion methods to determine different forms of nitrogen in soil hydrolysates. Soil Sci. Soc. Am. J. 2001, 65, 1284–1292. [Google Scholar] [CrossRef]
  24. Ahmed, O.H.; Husni, A.; Ahmad, H.M.N.; Jalloh, M.B.; Rahim, A.A.; Majid, N.M.A. Enhancing the urea-N use efficiency in maize (Zea mays) cultivation on acid soils using urea amended with zeolite and TSP. Am. J. Appl. Sci. 2009, 6, 829–833. [Google Scholar] [CrossRef] [Green Version]
  25. Junrungreang, S.; Limtong, P.; Wattanaprapat, K.; Patsarayeangyong, T. Effect of zeolite and chemical fertilizer on the change of physical and chemical properties on Lat Ya soil series for sugar cane. In Proceedings of the 17th WCSS Symposium, Bangkok, Thailand, 14–21 August 2002; Paper No. 1987-1–1987-7. WCSS: Vienna, Austria, 2002. Available online: https://pdfs.semanticscholar.org/aed7/110630d1c16897a4dd82f9556dd38be636bd.pdf (accessed on 19 March 2020).
  26. Ferguson, G.A.; Pepper, I.L. Ammonium retention in soils amended with clinoptilolite. Soil Sci. Soc. Am. J. 1987, 51, 231–234. [Google Scholar] [CrossRef]
  27. He, Z.L.; Alva, A.K.; Calvert, D.V.; Banks, D.J. Ammonia volatilization from different nitrogen fertilizers and effects of temperature and soil pH. Soil Sci. 1999, 164, 750–758. [Google Scholar] [CrossRef]
  28. Ros, M.; Klammer, S.; Knapp, B.; Aichberger, K.; Insam, H. Long term effects of compost amendment of soil on functional and structural diversity and microbial activity. Soil Use Manag. 2006, 22, 209–218. [Google Scholar] [CrossRef]
  29. Tejada, M.; Garcia-Martinez, A.M.; Parrado, J. Effects of a vermicompost composted with beet vinasse on soil properties, soil losses and soil restoration. Catena 2009, 77, 238–247. [Google Scholar] [CrossRef]
  30. Mulvaney, R.L.; Khan, S.A.; Hoeft, R.G.; Brown, H.M. A soil organic nitrogen fraction that reduces the need for nitrogen fertilization. Soil Sci. Soc. Am. J. 2001, 65, 1164–1172. [Google Scholar] [CrossRef]
  31. Parsons, J.W. Chemistry and distribution of amino sugars. In Soil Biochemistry; Paul, E.A., Ladd, J.N., Eds.; Marcel Dekker: New York, NY, USA, 1981; pp. 197–227. [Google Scholar]
  32. Guggenberger, G.; Frey, S.D.; Six, J.; Paustian, K.; Elliot, E.T. Bacterial and fungal cell wall residues in conventional and no-tillage agroecosystems. Soil Sci. Soc. Am. J. 1999, 63, 1188–1198. [Google Scholar] [CrossRef]
  33. Whitehead, T.R.; Cotta, M.A. Isolation and identification of hyper-ammonia producing bacteria from swine manure storage pits. Curr. Microbiol. 2004, 48, 20–26. [Google Scholar] [CrossRef]
  34. Sadej, W.; Przekwas, K. Fluctuations of nitrogen levels in soil profile under conditions of a long term fertilization experiment. Plant Soil Environ. 2008, 54, 197–203. [Google Scholar] [CrossRef] [Green Version]
  35. Leinweber, P.; Schulten, H.R. Non-hydrolyzable forms of soil organic nitrogen: Extractability and composition. J. Plant Nutr. Soil Sci. 2000, 163, 434–439. [Google Scholar] [CrossRef]
  36. Stevenson, F.J. Release of nitrogen from plant and animal residues and consequent plant uptake efficiency. In Humus Chemistry, 2nd ed.; Stockdale, E.A., Rees, R.M., Eds.; Wiley: New York, NY, USA, 1994; pp. 229–245. [Google Scholar]
  37. Praveen-Kumar, K.; Tripathi, P.; Aggarwal, R.K. Influence of crops, crop residues and manure on amino acid and amino sugar fractions of organic nitrogen in soil. Biol. Fertil. Soils 2002, 35, 210–213. [Google Scholar]
  38. Ramesh, K.; Biswas, A.K.; Somasundaram, J.; Subba Rao, A. Nanoporous zeolites in farming: Current status and issues ahead. Curr. Sci. 2010, 99, 760–765. [Google Scholar]
  39. Polat, E.; Karaca, M.; Demir, A.; Naci-Onus, A. Use of natural zeolite (clinoptilolite) in agriculture. J. Fruit Ornam. Plant Res. 2004, 12, 183–189. [Google Scholar]
  40. Petrovic, A.M. The potential of natural zeolite as a soil amendment. Golf Course Manag. 1990, 58, 92–94. [Google Scholar]
  41. Amanuallah, M.Z.; Khalil, A.K. Timing and rate of phosphorus application influence maize phenology, yield and profitability in Northwest Pakistan. Int. J. Plant Prod. 2010, 4, 283–294. [Google Scholar] [CrossRef]
  42. Perrin, T.S.; Boettinger, J.L.; Drost, D.T.; Norton, J.M. Decreasing nitrogen leaching from sandy soil with ammonium-loaded clinoptilolite. J. Environ. Qual. 1998, 27, 656–663. [Google Scholar] [CrossRef]
  43. Kithome, M.; Paul, J.W.; Lavkulich, L.M.; Bomke, A.A. Kinetics of ammonium adsorption and desorption by the natural zeolite clinoptilolite. Soil Sci. Soc. Am. J. 1998, 62, 622–629. [Google Scholar] [CrossRef]
  44. Montemurro, F. Different nitrogen fertilization sources, soil tillage, and crop rotations in winter wheat: Effect on yield, quality, and nitrogen utilization. J. Plant Nutr. 2009, 32, 1–18. [Google Scholar] [CrossRef]
  45. Habteselassie, M.Y.; Miller, B.E.; Thacker, S.G.; Stark, J.M.; Norton, J.M. Soil nitrogen and nutrient dynamics after repeated application of treated dairy-waste. Soil Sci. Soc. Am. J. 2006, 70, 1328–1337. [Google Scholar] [CrossRef]
  46. Singh, S.; Singh, R.; Prasad, J.; Kumar, B. Effect of green manuring, FYM and bio- fertilizer in relation to fertilizer nitrogen on yield and major nutrient uptake by upland rice. J. Ind. Soc. Soil Sci. 2002, 50, 313–314. [Google Scholar]
  47. Uher, A.; Balogh, Z. Use of zeolites for re-cultivation of sandy soils in horticulture. Acta Hortic. 2004, 7, 46–52. [Google Scholar]
  48. Palm, C.A.; Myers, R.J.K.; Nandwa, S.M. Combined use of organic and inorganic nutrient sources for soil fertility maintenance and replenishment. In Replenishing Soil Fertility in Africa; Buresh, R., Sanchez, P.A., Calhoun, F., Eds.; Soil Science Society of America: Madison, WI, USA, 1997; pp. 193–217. [Google Scholar]
Figure 1. Effects of treatments on soil total nitrogen. Means with the same letter above the bars within a crop cycle are not significantly different at p ≤ 0.05. Bars represent the mean values ± standard error.
Applsci 10 04139 g001
Figure 2. Effects of treatments on soil total hydrolyzable nitrogen. Means with the same letter above the bars within a crop cycle are not significantly different at p ≤ 0.05. Bars represent the mean values ± standard error.
Applsci 10 04139 g002
Figure 3. Effects of treatments on soil total hydrolyzable ammonium. Means with the same letter above the bars within a crop cycle are not significantly different at p ≤ 0.05. Bars represent the mean values ± standard error.
Applsci 10 04139 g003
Figure 4. Effects of treatments on soil (ammonium + amino sugar)-nitrogen. Means with the same letter above the bars within a crop cycle are not significantly different at p ≤ 0.05. Bars represent the mean values ± standard error.
Applsci 10 04139 g004
Figure 5. Effects of treatments on soil amino sugar. Means with the same letter above the bars within a crop cycle are not significantly different at p ≤ 0.05. Bars represent the mean values ± standard error.
Applsci 10 04139 g005
Figure 6. Effects of treatments on soil amino acid-nitrogen. Means with the same letter above the bars within a crop cycle are not significantly different at p ≤ 0.05. Bars represent the mean values ± standard error.
Applsci 10 04139 g006
Figure 7. Effects of treatments on soil non-hydrolyzable nitrogen. Means with the same letter above the bars within a crop cycle are not significantly different at p ≤ 0.05. Bars represent the mean values ± standard error.
Applsci 10 04139 g007
Figure 8. Effects of treatments on soil exchangeable ammonium. Means with the same letter above the bars within a crop cycle are not significantly different at p ≤ 0.05. Bars represent the mean values ± standard error.
Applsci 10 04139 g008
Figure 9. Effects of treatments on soil available nitrate. Means with the same letter above the bars within a crop cycle are not significantly different at p ≤ 0.05. Bars represent the mean values ± standard error.
Applsci 10 04139 g009
Figure 10. Effects of treatments on dry weight of maize aboveground biomass. Means with the same letter above the bars within a crop cycle are not significantly different at p ≤ 0.05. Bars represent the mean values ± standard error.
Applsci 10 04139 g010
Figure 11. Effects of different fertilization practices on maize ear yield. Means with the same letter above the bars within a crop cycle are not significantly different at p ≤ 0.05. Bars represent the mean values ± standard error.
Applsci 10 04139 g011
Figure 12. Effects of treatments on nitrogen concentration and uptake of maize shoot biomass. Means with the same letter above the bars within a crop cycle are not significantly different at p ≤ 0.05. Bars represent the mean values ± standard error.
Applsci 10 04139 g012
Table 1. Some chemical information on clinoptilolite zeolite.
ParametersValues ObtainedProduct Information
pHwater6.80 (±0.03) ††8.0–9.0
Cation exchange capacity (cmol(+) kg−1)100.33 (±0.35)160.0
Total nitrogen (%)1.8 (±0.04)1.36
Calcium (mg kg−1)18400 (±19.09)25600.0
Magnesium (mg kg−1)11200 (±4.48)15000.0
Potassium (mg kg−1)14850 (±10.17)22600.0
Ammonium (mg kg−1)12.60 (±0.43)Not determined
Nitrate (mg kg−1)11.58 (±0.18)Not determined
Obtained from Luxurious Empire Sdn Bhd, Kulai Jaya, Malaysia. †† Standard error.
Table 2. Some physico-chemical characteristics of the rice straw and paddy husk composts.
ParametersRice Straw CompostPaddy Husk Compost
Cation exchange capacity (cmol(+) kg1)86 (±0.07)176 (±3.17)
pHwater7.6 (±0.07) ††7.9 (±0.03)
Phenolic (OH, cmol(+) kg−1)300 (±6.42)350 (±7.90)
Carboxylic acid (cmol(+) kg−1)450 (±10.39)400 (±11.35)
Total acidity (cmol(+) kg−1)750 (±8.08)750 (±6.90)
E4/E6 ratio 7.73 (±0.07)7.78 (±0.02)
Humic Acid (%)15.2 (±0.32)5.7 (±0.03)
Electrical Conductivity (ds m1)1.1 (±0.02)1.2 (±0.02)
Carbon (%)27.3 (±0.42)28.2 (±0.52)
Organic Matter (%)47.1 (±0.73)48.6 (±0.55)
Nitrogen (%)1.8 (±0.06)1.6 (±0.03)
C/N Ratio1517
Ammonium (mg kg1)294 (±2.84)362 (±2.92)
Nitrate (mg kg1)161 (±5.23)172 (±1.85)
Phosphorus (mg kg1)458.2 (±5.50)1097 (±0.88)
Calcium (mg kg1)14,080 (±6.91)15,080 (±0.88)
Magnesium (mg kg1)15,350 (±3.92)15,189 (±1.45)
Potassium (mg kg1)27,720 (±2.72)27,150 (±0.88)
Sodium (mg kg1)13,326 (±1.03)14,001 (±0.14)
Copper (mg kg1)12.4 (±0.21)2.4 (±0.11)
Iron (mg kg1)13.1 (±0.42)3.6 (±0.14)
Manganese (mg kg1)2.1 (± 0.05)1.1 (±0.12)
Zinc (mg kg1)11.8 (±0.15)11.2 (±0.17)
Ash (%)6.4 (±0.33)7.9 (±0.29)
Moisture Content (%)43 (±0.10)44 (±0.71)
E4/E6 (optical density) is the absorbance at two arbitrary selected wavelengths (extinction at 465 and 665 nm); †† Standard error.
Table 3. Some chemical characteristics of the soil used in this study.
ParametersMean Value (±Standard Error)Standard Data Range ††
CEC (cmol(+) kg−1)9.32 (±0.03)5.89
pHwater4.25 (±0.05)4.7–5
Exchangeable calcium (cmol(+) kg−1)0.82 (±0.008)0.05
Exchangeable magnesium (cmol(+) kg−1)0.53 (±0.05)<0.01
Exchangeable potassium (cmol(+) kg−1)0.36 (±0.02)<0.09
Total nitrogen (%)0.15 (±0.01)0.06
Organic matter (%)5.51 (±0.06)Not determined
Total organic carbon (%)3.20 (±0.09)1.30
Total phosphorus (mg kg−1)0.005 (±0.001)Not determined
Available phosphorus (mg kg−1)2.16 (±0.05)Not determined
Exchangeable ammonium (mg kg−1)12.35 (±0.05)Not determined
Available nitrate (mg kg−1)2.12 (±0.01)Not determined
†† Cited from Paramanathan [21].
Table 4. Two nitrogen use efficiency indices of applied N at harvest for both maize crops.
Crop Recovery of Applied N (kg kg−1) Agronomic Efficiency of Applied N (kg grain kg−1)
(Mean ± Standard Error) kg ha−1
First Crop
T134 c (±4.40)12 c (±0.88)
T258 a (±1.52)29 a (±1.52)
T354 a (±0.88)27 a (±0.88)
T445 b (±1.73)19 b (±0.57)
T558 a (±0.57)27 a (±0.52)
T648 a (±0.88)23 b (±0.57)
Second Crop
T132 b (±0.88)9 c (±0.88)
T252 a (±0.88)21 ab (±2.40)
T348 a (±1.45)24 a (±0.88)
T433 b (±0.88)16 b (±1.45)
T545 a (±1.45)24 a (±0.57)
T639 b (±0.88)20 b (±1.15)
Means with the same superscript letter in a column within a crop cycle are not significantly different at p ≤ 0.05.

