Abstract
In order to improve the photocatalytic effect of Nb2O5, manganese from 1% to 10% was added by the polymeric precursor’s method. The samples obtained were subjected to different calcination temperatures from 400 to 700 °C. Characterization of the synthesized materials was performed by XRD, IR, Raman and Diffuse Reflectance Spectroscopy (DRS) spectroscopy, FE-SEM, Brunauer–Emmett–Teller (BET) method, Photoluminescence (PL) and Dynamic Light Scattering (DLS). Photocatalytic performance for degradation of Rhodamine B was also evaluated. The Rietveld refined X-Ray Diffraction (XRD) pattern of Nb2O5:Mn 1.0 wt.% (700 °C) sample was similar to that of the un-doped oxide, therefore indicating that Nb was replaced by Mn and, consequently, there are not significant variations in the oxide structure. The Nb2O5:Mn 10.0 wt.% (700 °C) sample has the lowest band gap energy. The specific surface area (SBET) PL value increased as manganese concentration increased. The Nb2O5:Mn 5.0 wt.% (700 °C) sample has an Eg of 3.15 eV and morphological and surface characteristics that made it an appropriate photocatalyst in the Rhodamine B degradation. The novelty of this work relies on the use of a small quantity of Mn ions as dopants leading to Nb2O5:Mn nanostructured particles without using any surfactant or other additives.
1. Introduction
Pure or doped metal oxide semiconductors are commonly used as photocatalysts in reactions to remove contaminants from water [1]. In these reactions, electron–hole pairs need energy to overcome the band gap between the valence and the conduction band; these pairs are created in bulk by irradiation and circulate on the semiconductor surface. The photodegradation of contaminants occurs when there is a charge transfer between electron–hole pairs and adsorbed species onto the semiconductor surface [1]. Furthermore, the surface area and the surface defects play an important role in the photocatalytic activities of metal oxides. Doping with transition metals increases surface defects. In addition, it affects the optical and electronic properties and most likely could shift the optical absorption towards the visible region [2].
Niobium pentoxide (Nb2O5) is an n-type semiconductor with unique properties to develop highly efficient solar-cells, electrochromic devices, and sensors [3,4,5]. This oxide draws attention due to its presence as a constituent of different compounds such as barium and lithium niobate, all used in optical waveguides and modulators [6,7]. Furthermore, Nb2O5 can be used in the photodegradation of contaminants as it exhibits a low band gap value (~3.4 eV), and is easily recycled and environmentally friendly. Niobium pentoxide is one of the highly active species in liquid phase oxidation, reduction and polymerization, therefore medium catalyst separation is easily achieved from its reaction [8]. In addition, Nb2O5 can absorb UV light with a wavelength equal or less than 385 nm-although it is desirable for it to absorb not only UV but also visible light for higher photocatalytic efficiency. In order to do so, the Nb2O5 band gap must be narrowed or split into several sub-gaps by implanting transition metal ions.
Rare-earth doped Nb2O5 materials have been obtained with an orthorhombic structure and average crystallite size of around 25 nm [9]. Additionally, the photocatalytic and antibacterial activity of manganese doped ZnO nanoparticles has been evaluated [10] showing the effectiveness of this dopant agent. The inclusion of manganese is meant to modify properties such as surface area and band gap energy. It is therefore expected that Mn in Nb2O5 crystalline matrix influences aspects like photo-reactivity, charge carrier recombination rates and interfacial electron-transfer rates [2].
In the modified Nb2O5, the location of the modifying ion in the lattice is not obvious when this replaces the Nb ion, due to size and/or charge mismatches. Notwithstanding, it is a matter of debate whether the Mn2+ can substitute the Nb5+ cation in a crystalline lattice. One possible contribution to the solution of this problem is verifying if it is feasible to dope Mn ions in the Nb2O5 lattice. For this reason, we found it interesting to study the Nb2O5 synthesis and the properties doped with Mn. Moreover, although niobium pentoxide has demonstrated to be a valuable material and is used as a catalyst, very little information is available on the preparation and spectroscopic research of nanocrystalline Mn-doped Nb2O5.
In this paper, we report the properties of Mn-doped Nb2O5 synthesized by the polymeric precursor method. Mn concentration values in the range of 1.0–10.0 wt.% were selected as to understand the effect of metal dopant on Nb2O5 properties and annealing temperatures ranging between 400 °C and 700 °C were chosen to analyze the effect of heat treatment on the structural characteristics and physical properties of Mn-doped Nb2O5. Subsequently, structural, vibrational, morphological, surface, and optical characteristics as well as photocatalytic performance were also studied. The materials had not been explored in this application, as far as we know. Doping allowed obtaining smaller particles and gap energy values lower than pure niobium pentoxide. We believe that these properties may be desirable in other applications, such as bactericidal activity and cytotoxic response [11]. This work will serve as a reference for future work carried out by other researchers. We attribute the low photocatalytic response to the loss of crystalline properties with the increase in Mn content.
2. Materials and Methods
2.1. Synthesis of the Samples
Nanocrystalline powders of Mn-doped Nb2O5 were prepared by the precursor polymeric method (Pechini method). Niobium chloride (NbCl5, 99%, (Sigma-Aldrich, Munich, Germany)) and manganese nitrate (Mn(NO3)2.4H2O (Merck, Darmstadt, Germany)) were used as the starting materials; citric acid (C6H8O7, 99.5%, (PanReac, PanReac AppliChem, Barcelona, Spain)) and ethylene glycol (C2H6O2, 99.8%, PanReac) were used as the chelating agent and polymerizing agent, respectively; distilled water was used as a solvent. Completely solubilized manganese nitrate was added into the niobium chloride solution for four different manganese weight contents: 1.0, 2.5, 5.0 and 10.0 wt.%. The solutions were stirred and kept at 90 °C in a stove until the volume of water was reduced and resins were produced. Afterward, these resins were placed in an oven at 300 °C for 2 h. Finally, the powders obtained after deagglomeration were placed into an oven to administer four different thermal treatments for 2 h in air: 400, 500, 600 and 700 °C, respectively.
2.2. Characterization
The crystal structure and phase purity of the powdered samples were analyzed by X-Ray Diffraction (XRD) using a PANalytical Empyrean Alpha-1 X-Ray Diffractometer (XRD) (Almelo, The Netherlands) and the measurements made at the University of Antioquia Colombia (Malvern, UK, Cu Kα2 radiation, = 1.54442 Å), operating at 40 mA with a step of 0.05° in 50 s, the 2 angle range was 5–80°. Rietveld analysis was performed with the refinement program General Structure Analysis System (GSAS). Infrared (IR) spectra have been recorded with a IRPrestige-21 Spectrophotometer (Shimadzu, Kyoto, Japan, and the measures carried out in Cúcuta, UFPS Colombia). The spectral resolution was set at 8 cm−1. The powder samples were studied in KBr pellets. Raman spectroscopy was carried out with 633 nm line of a He–Ne ion laser at room temperature with a (The Jobin Yvon T64000 Raman system with a triple spectrometer, Horiba, Kyoto, Japan and the measures in UFC Fortaleza, Brazil) equipped. Morphologies of the samples were studied by Field Emission–Scanning Electronic Microcopy (FE-SEM). Images were obtained with a ZEISS Instruments and Systems (ZEISS, Oberkochen, Germany) working at 5.0 kV and 200.0 nA; the samples were coated with a 10 nm thick Pt layer. The surface area, diameter and pore volume were obtained from the Brunauer–Emmett–Teller (BET) method using a Micromeritics ASAP 2020 (Micromeritics, Norcross, GA, USA) apparatus. The reflectance measurements were obtained from Diffuse Reflection Spectra () with a UV-2600i: UV-vis spectrophotometer from Shimadzu (Kyoto, Japan). Photoluminescence (PL) measurements for possible effects of Mn inclusion were conducted using FluoroMax-4P apparatus (Horiba, NJ, USA) with = 250 nm. Dynamic Light Scattering (DLS) technique was used to analyze the coloidal stability of the samples. The measurements were carried out at room temperature using Malvern Zetasizer Nano (Malvern, UK).
2.3. Photocatalytic Performance
Photocatalytic activity was tested under UV light in a photo-reactor with six UV lamps (Philips TUV lamps (Eindhoven, The Netherlands), 15 W, at a maximum intensity at 254 nm). For this analysis, 10 mg of every sample were put into 20 mL of Rhodamine B solution (10 ppm) and then the resultant solution was placed in the photo-reactor at 20 °C. The Rhodamine B degradation was monitored by measuring the absorbance in a UV-vis spectrophotometer (Shimadzu UV-1601PC) at given time intervals. A Rhodamine-B solution without a catalyst was used as the photolysis test.
3. Results and Discussion
3.1. Structural Analysis
From the initial XRD analysis (not presented herein), it is possible to conclude that at 400 and 500 °C, solids do not exhibit any crystalline phase, except the Nb2O5:Mn 10.0 wt.% (500 °C) sample, in which the phase was not identified. At 600 °C, solids obtained at 1.0 and 2.5 wt.% crystallize in a hexagonal structure. The XRD patterns peak analysis verifies that the samples obtained by the Pechini method annealed at 700 °C have an orthorhombic crystalline structure, which is particularly interesting due to its potential application in photocatalytic processes. For this reason, 700 °C temperature will be the temperature of interest for other analyses.
In the present study, we have adopted the Rietveld refinement technique to study the crystalline phase formation as well as the lattice parameters (Table 1). Figure 1 illustrates the Rietveld refined XRD pattern of pure Nb2O5 sample, annealed at 700 °C. All reflections are addressed to the orthorhombic structure. Figure 2 shows the Rietveld refined XRD patterns of Mn-doped Nb2O5 at 1.0 wt.% (Figure 2a) and at 10.0 wt.% (Figure 2b) samples. Data analysis confirms the presence of two phases. The main phase corresponding to Nb2O5 The Inorganic Crystal Structure Database (ICSD) number 1840 with 55 Pbam space group and orthorhombic structure and the secondary phase corresponding to MnNb2O6 ISCD 31944 with 60 Pbcn space group and orthorhombic structure.

Table 1.
Structural parameters obtained from the Rietveld refinement of the XRD patterns.
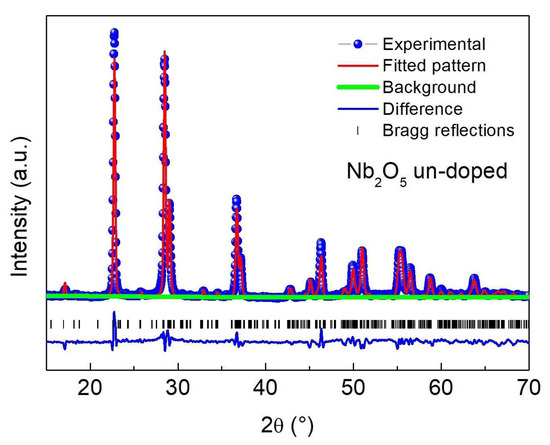
Figure 1.
Rietveld refinement of x-ray difraction pattern of Nb2O5 annealed at 700 °C.
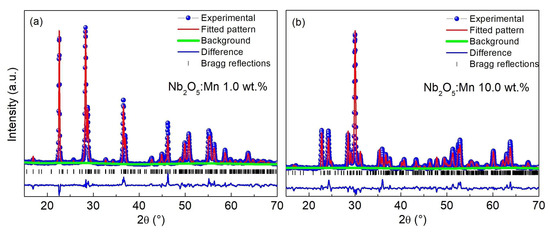
Figure 2.
Rietveld refined XRD patterns of Nb2O5:Mn sample (a) 1.0 wt.%, (b) 10.0 wt.%, annealed at 700 °C.
There is no clear relation between structural parameters and the unit cell volume values. Based on the ionic sizes and assuming that the valence state of Mn is 2+, an increase in lattice parameters is expected as the Mn concentration is increased (the ionic radius of Mn2+ [0.80 Å] is larger than the ionic radius of Nb5+ [0.70 Å]). Instead of this, the structural parameter a increases as the Mn ion is added, but as long as Mn content increases, the parameter a decreases. On the other hand, the parameter b is lower for 1.0 wt.% Mn content, but if Mn content increases, the parameter b also increases, except at 5.0 wt.% Mn content. The parameter c had similar behavior. Hence, there are no substantial changes in the unit cell volume due to distortions of the crystal lattice caused by the Mn inclusion. Perhaps, the Mn ions could have entered the Nb2O5 matrix and substituted some interstitial sites for 1.0 wt.% manganese content.
3.2. Morphological and Surface Analysis
Figure 3 shows FE-SEM images of niobium oxide samples with different concentrations of manganese addition. Nb2O5 samples obtained at 700 °C are presented. It is possible to evidence slight changes in the morphology of the samples with the addition of manganese. For Mn concentrations of 1.0, 2.5 and 5.0 wt.%, it was possible to identify the presence of particles with a size of about 90 nm and a grain densification tendency; specifically at 5.0 wt.% Mn content, it was possible to distinguish particles with minor size. On the other hand, the 10.0 wt.% Mn content promoted the production of smaller nanoparticle agglomerates. Mn atoms may have disturbed the growth process, hence, the incorporation of Mn influences the morphology of Nb2O5.
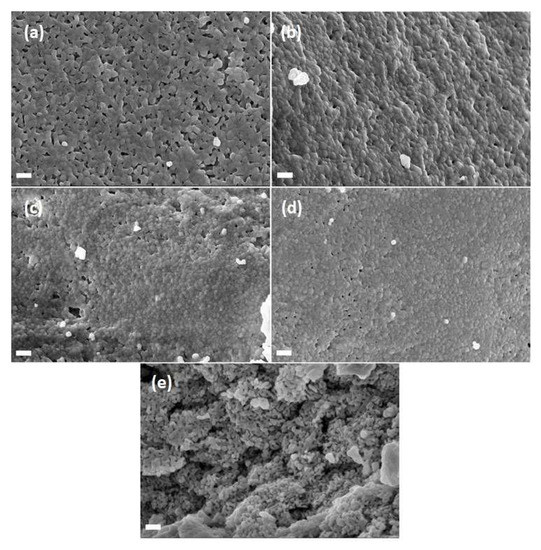
Figure 3.
FE-SEM images of (a) Nb2O5, Mn-doped Nb2O5 (b) 1.0, (c) 2.5, (d) 5.0 and (e) 10.0 wt.% samples, submitted at 700 °C. Guide bar: 200 nm; Mag = 80.00 KX.
Figure 4 shows %, subjected to 700 °C. These isotherms have a type-III form, which indicates that there is a low adsorbate–adsorbent interaction, and it is associated with solids that contain large pores. In cases (a) and (b) of Figure 4, a hysteresis at partial pressures higher than 0.2 due to the presence of mesoporosity can be distinguished. Samples obtained at 5.0 wt.% and (b) 10.0 wt.% showed similar behavior.
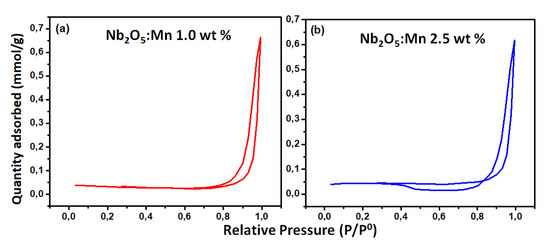
Figure 4.
Adsorption isotherms of Mn-doped Nb2O5 (a) 1.0 and (b) 2.5 wt.% samples, annealing at 700 °C.
Table 2 presents the results of the physisorption analysis on the samples subject to 700 °C for various concentrations of Mn, these results are in agreement with the literature [12]. The specific surface area, , was determined by taking data at relative pressures between 0.1 and 1.0. The oxides modified with Mn at 1.0 and 2.5 wt.% are macroporous, whereas the ones modified with Mn at 5.0 and 10.0 wt.% are mesoporous. data showed that an increase in Mn concentration is reflected by an increase in the specific surface area. These results suggest that the presence of manganese on the surface of niobium pentoxide does not achieve an effective incorporation. The increasing trend in indicates that there is not a partial blockage of some pores in the niobium metal oxide. of the Nb2O5:Mn 10.0 wt.% sample would cause it to be the most effective in the photocatalytic process, but structurally and vibrationally this does not have the desired characteristics. The Nb2O5:Mn 2.5 wt.% sample is low; however, its pore size is suitable by the system action over large molecules of pollutants. The results and information obtained from the FE-SEM images show that small measurements are linked to larger particle sizes, as is the case of the Nb2O5 sample. The average pore diameter also decreased from 52 to 42 and 26 nm due to the presence of the manganese, except for the sample obtained at 2.5 wt.%.
Table 2.
Results of physisorption analysis on samples subjected to 700 °C The specific surface area () for Nb2O5 corresponds to 1.19 (m2 g−1).
3.3. Optical Characterization
The vibrational modes of Mn-doped Nb2O5 samples subjected to a temperature of 700 °C were studied by IR spectroscopy within the wavenumber range of 3000–500 cm−1. In the spectrum presented in Figure 5, neither band was associated to the presence of organic components nor were found pronounced shoulders related to the amorphous phase of niobium pentoxide. The shoulder around 766 cm−1 for the sample at 1.0 wt.% Mn content is characteristic of the orthorhombic structure of niobium pentoxide. The absorption bands observed at 699 cm−1 for 5.0 w% may correspond to the coupling mode of vibration of Mn-O stretching in octahedral sites of MnNb2O6. For the sample at 10.0 wt.%, the band observed at 1658 cm−1 is attributed to vibrations of the surface adsorbed O-H molecules [13]. In general, IR spectroscopy confirmed the MnNb2O6 phase presence in 5.0 and 10.0 wt.% manganese content.
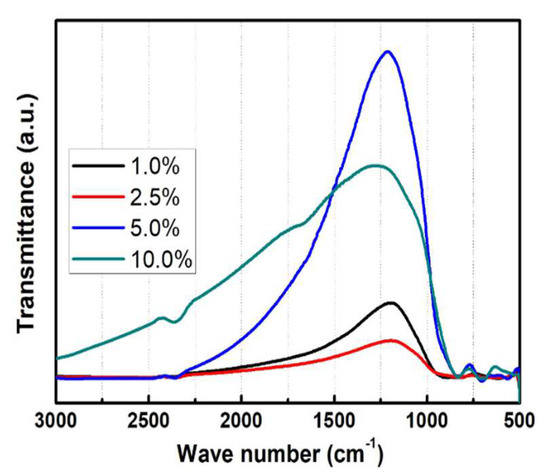
Figure 5.
Evolution with dopant concentration of the infrared spectra of Mn-doped Nb2O5 submitted at 700 °C.
In Figure 6, the Raman spectra recorded in the 120–1300 cm−1 range of Mn-doped Nb2O5 submitted at 700 °C are displayed. The spectra in Figure 6a–d presents well-defined peaks where the position of these Raman peaks is narrow, which indicates crystallinity in the materials at this calcination temperature. The Nb2O5 modification changes the relative intensities of almost all lines in the Raman spectrum, but the corresponding Raman shift remains unchanged, which suggests constancy in the bond lengths between the ions in the structure [14]. Comparing the most intense mode of all the spectra in Figure 6 (around 688 cm−1), it is evident that the relative peak-intensity decreases as the Mn concentration increases, which can be associated with disordered Nb2O5 crystalline lattice. The most intense lines in the spectra of the Mn-doped Nb2O5 samples may be assigned to the full-symmetry vibrations.
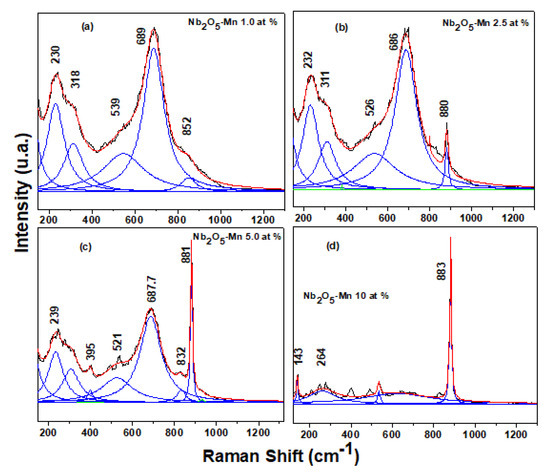
Figure 6.
Raman spectra of Mn-doped Nb2O5 samples obtained at 700 °C.
Figure 6 shows three distinct groups of intense lines ranging between 230–400 cm−1, between 520–690 cm−1 and 850–885 cm−1, which suggests weak interactions between these groups. The lines in the 150–400 cm−1 range correspond to the cations vibrations in octahedra and tetrahedra for the samples at 1.0, 2.5 and 5.0 wt.%. For these three concentrations, the broad band around 688 cm−1 can be attributed to the stretching modes of the NbO6 polyhedra typical of the orthorhombic Nb2O5 crystalline structure. The broadening of this band suggests the presence of distorted niobia polyhedra [9]. Bands in 318 and 311 cm−1 are allocated to the symmetric and antisymmetric stretching mode of the Nb-O-Nb linkage, in Figure 6a,b, respectively. For 1.0 wt.% dopant concentration, the spectrum shows a large band centered at 689 cm−1, which also may be assigned to the symmetric stretching mode of Nb-O polyhedra [15,16] characteristic of the orthorhombic phase. Other modes present in the Mn-doped Nb2O5 1.0 wt.% sample are at 230 and 318 cm−1, corresponding also to the T-Nb2O5 phase (orthorhombic structure) [17]. In Figure 6b–d the Raman band around 881 cm−1 can be related to the Mn ions vibration corresponding to the MnNb2O6 phase, since its peak intensity increases with the increase of Mn concentration. The peak located at 264 cm−1 in Figure 6d can be associated to T2g mode of vibration [13]. Peaks with relatively lower intensity shown in Figure 6b,c may respond to phonon scattering caused by small grains and point defects [13]. The Raman study reveals that an increase of Mn content causes a decrease in the crystallinity of material, which is evidenced in the change of peaks sharpness. This fact is supported by the results of Rietveld refinement.
Figure 7 shows the evolution of reflectance by varying Mn concentration. A decrease in the reflectance is observed with an increase of Mn concentration. This can be explained in terms of lattice distortion due to the incorporation of the larger Mn ions inside the Nb2O5 lattice. A considerable reduction in reflectance starts at about 600 nm, which suggests the formation of band tail due to incorporation of impurity states. A shoulder at about 400 nm for the Nb2O5 is not distinguished for the doped samples.
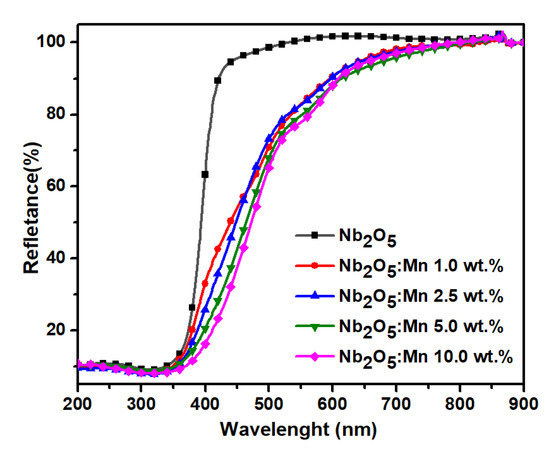
Figure 7.
Diffuse reflectance spectra as a function of wavelength of samples submitted at 700 °C, by varying Mn concentration.
Through DRS it is possible to obtain the optical energy gap () values. Kubelka and Munk [18] proposed the theory that makes it possible to use DRS spectra. The Kubelka–Munk transformation relates the reflectance with the absorption coefficient, . Thus, the band gap Eg and absorption coefficient of a direct band gap semiconductor are related in the parabolic band structure. The materials optical band gap, e.g., was extracted out of Equation (1).
Here, is the incident photon energy, is the absorption coefficient, B is a proportionality constant, and is the optical band gap [19]. The n value depends on the nature of the transition. Direct transition allowed n = 1/2. The optical band gap was obtained by plotting vs. (Figure 8). The intersection between the linear fit and the photon energy axis results in [18]. The band gap energy values for the samples annealed at 700 °C, are lower than the values obtained in [20,21]. For un-doped Nb2O5 the band gap value lies in the range of 3.32 to 3.40 eV. Whereas, for Nb2O5:Mn decreases as Mn concentration increases. The Eg values obtained are suitable for photocatalytic purposes and they can be attributed to the spin forbidden transition on Mn2+ in a tetrahedral environment [2].
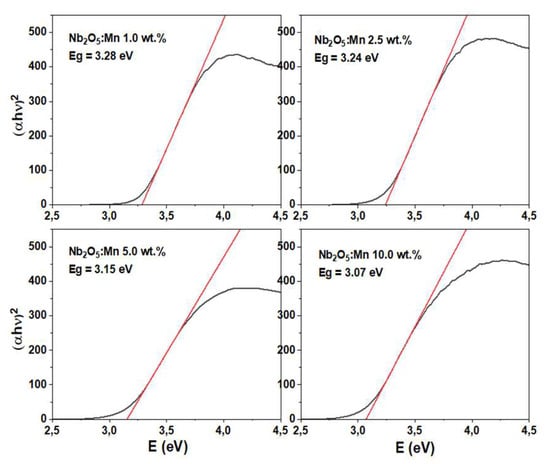
Figure 8.
Kubelka–Munk transformed reflectance spectra of annealed samples at 700 °C.
Figure 9 shows the PL spectra of the Mn-doped Nb2O5 nanostructured particles. As evidenced, all particles exhibit similar excitonic PL signals, demonstrating that Mn does not give rise to new PL phenomena. In this spectrum, the peaks position belong to emission bands at 3.63, 3.23, 2.01 and 1.73 eV. The highest intensity is located in the 384 nm peak position and it can be related to dissipation of energy during the recombination process of photo-induced charge carriers. The peak at 341 nm of UV emission may be attributed to the free exciton recombination in the niobium pentoxide. Peaks at 616 and 717 nm may be related to excitonic PL processes that lead to higher probabilities of exciton occurrence, oxygen vacancy presence and defects content. The thermal treatment and the synthesis method could explain this process. There is not an increase in the intensity of UV emission at 341 nm and neither in the intensity at 384 nm, which may indicate that there is not a change in the crystalline orientation of the samples; this observation is consistent with the XRD results. Peak intensity at 616 nm may change due to electronic capture of Mn. The electrons captured by Mn cannot be bound by surface oxygen vacancies and defects to produce excitons, which decreases excitonic PL intensity [22].
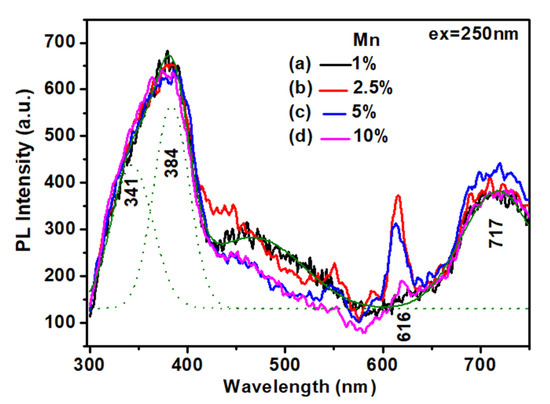
Figure 9.
Photoluminescence (PL) spectra of Mn-doped Nb2O5 powders at different Mn concentration annealed 700 °C.
The values of hydrodynamic dimension and Z potential presented in Table 3 were obtained through DLS. The results of the hydrodynamic dimension reflect a monomodal distribution, which indicate that the particle size is regular in suspension. According to the results shown in Table 3, sample Nb2O5:Mn (2.5 wt.%) submitted at 700 °C presents more interaction with the solvent used in this test. This behavior would affect its photocatalytic performance, since the recovery of the sample from aqueous medium is difficult. In terms of electrostatic stability, the particles of the samples obtained at 700 °C are stable in aqueous medium due to their Z potential being minor than −30 mV.
Table 3.
Hydrodynamic stability parameters of samples subjected to 700 °C for all samples with the addition of Mn.
3.4. Photocatalytic Performance
The initial concentration (C0) and final concentration (C) of colorant values were obtained from the absorbance spectra of intensity versus wavelength. Afterwards, the Nb2O5 and Mn-doped Nb2O5 photocatalytic performance was evaluated through kinetics degradation; colorant concentration, as a function of exposure time under UV-visible radiation, was analyzed. The analyzed reaction has a first order kinetics [23], as shown in Equation (2).
k represents the exchange rate constant, obtained by integration (2)
Thus, the ln graph versus t has a lineal tendency with slope at k. The values were calculated and their tendency is represented in Figure 10. The lineal fitting was performed and the k values are presented in Table 4.
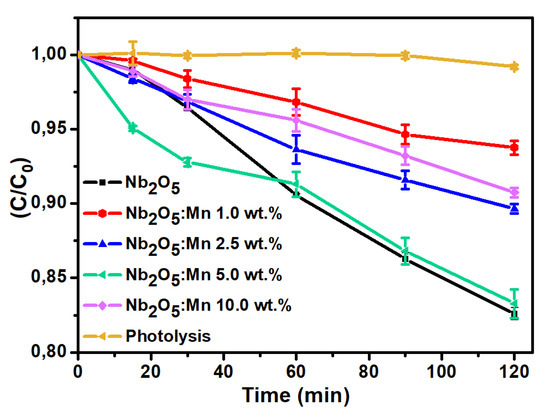
Figure 10.
Kinetic graphs of Rhodamine B photodegradation, for the pure sample and with the different percentages of the addition of Mn at 700 °C.
Table 4.
Exchange rate constant obtained from the Rhodamina B Photodegradation tests.
The linear fitting had correlation parameters greater than 0.95, which confirms the first order kinetics behavior. The Nb2O5:Mn (5.0 wt.%) sample is the most photoactive of the doped samples; it showed significant photoactivity in Rhodamine B degradation. However, its response in the Rhodamine B photodegradation is comparable to the response of Nb2O5 un-doped. The Nb2O5:Mn (5.0 wt.%) sample has the Nb2O5 orthorhombic phase, which makes it a good photocatalyst. This latter occurs even though the sample shows the presence of secondary phase MnNb2O6. The MnNb2O6 compound had previously evidenced good photocatalytic performance in combination with other systems [24], so that it can act as co-agent in the photocatalytic process. The Nb2O5:Mn (5.0 wt.%) micrography (Figure 5) distinguishes particles of size minor as compared to the un-doped, 1.0% and 2.5% doped samples. Therefore, the Mn-doped Nb2O5 photocatalytic performance strongly depends on reaching small particle size. In addition to the surface level, the sample modified at 5.0% presents specific surface area and pore size values suitable for the process of Rhodamine B photodegradation. Finally, the band gap energy value of this sample is lesser than the same Nb2O5 value. This indicates that the reduction of this parameter together with the morphological and surface properties of the Nb2O5:Mn (5.0 wt.%) sample was a good photocatalyst to complete the Rhodamine B degradation.
On the other hand, the Nb2O5:Mn (1.0 wt.%) sample evidenced better photocatalytic response due to its structural properties; however, its surface characteristics were not enough to exhibit good degradation of pollutant analyzed. The Nb2O5:Mn (10 wt.%) sample exhibited similar behavior. It showed good morphological, surface and optical properties, with the minor energy band gap value, but since its crystallinity was poor, its photocatalytic response was not good. The Nb2O5:Mn (10 wt.%) sample has a lower crystallinity degree and a greater number of defects. These defects can act as recombination centers of electron-hole pairs [23], which decrease its photoactivity. The increase in the specific surface area generates an increase in the number of active sites on the material surface, which increases the kinetic rate of the process [23]. Thus, the material can be standardized by surface area to reveal the photoactivity associated with the material properties. A suitable approach consists on dividing the k value of the process by of each sample (Table 4).
The unit cell volume value obtained for 10.0% by weight is similar to the unit cell volume of Nb2O5, which may indicate that a part of Mn was segregated in a secondary phase. The content of 10.0% by weight of Mn promotes the production of smaller nanoparticle agglomerates, this is in accordance with the pore size estimated by the BET method. The increase in Mn content established a defined morphology with a tendency to decrease in particle size and gap value, however, there is an increase in the specific surface area. We believe that the low photocatalytic performance is due to the loss of crystallinity with increasing Mn concentration. On the other hand, the IR results exhibited the presence of superficially adsorbed O–H molecules, which may have affected the photocatalytic response.
According to other research in the literature, Activities of the Nitrogen-doped TiO2 and TiO2-Nb2O5 catalysts prepared by sol–gel technique have been evaluated on the photodegradation of benzene, toluene and xylenes solution under UV and visible light [25]. In that work, the N-doped TiO2-Nb2O5 catalyst calcined at 500 °C showed promising catalytic activity in degrading the BTX in an aqueous solution under visible light. However, the N-TiO2 catalysts showed the best result. Similar behavior was obtained in our work, where the Nb2O5 had good photocatalytic performance. On the other hand, Zn-doped Nb2O5 photocatalysts, obtained through the oxidant peroxide method, exhibited a diffraction pattern of Nb2O5 orthorhombic-type phase [26]. These materials exhibited better crystallinity, high specific surface area and low band gap values, so zinc improved the photocatalytic activity of Nb2O5 in Rhodamine B and caffeic acid degradation. Hence, we attributed the low photocatalytic response of our materials at decreased crystallinity.
4. Conclusions
Mn-doped Nb2O5 nanostructured particles were successfully synthesized by the polymeric precursor method. Mn incorporation had a strong effect on the structural, vibrational, morphological, surface, and optical properties of Nb2O5. The XRD studies of the samples modified with the highest Mn content and subjected to heat treatments at 700 °C revealed the formation of a secondary phase corresponding to MnNb2O6. Results from the XRD analysis indicated that Mn2+ ions may replace Nb5+ ions without distortions of the crystalline structure, with Mn content to 1.0 wt.%. The vibrational study showed that an increase of Mn content causes a decrease in the material crystallinity due to the presence of less sharp peaks. In general, the nanostructured particles at 700 °C showed the best crystallized quality, which suggests that this temperature not only raised its crystalline quality but also improved its optical properties. FE-SEM analysis contributed to determining a well-defined morphology with the presence of nanometric structure grains. The determined values for the samples annealing at 700 °C, at different Mn concentrations, were minor compared to the values of Nb2O5, and are suitable for photocatalytic purposes.
In turn, the Nb2O5:Mn (5.0 wt.%) sample showed good photocatalytic performance. This sample showed appropriate morphological, surface and optical properties for the Rhodamine B photodegradation. The Mn segregation in MnNb2O6 secondary phase may be responsible for the properties improvement and the reduction of band gap energy of the Nb2O5:Mn (5.0 wt.%) sample. The Nb2O5:Mn (1.0 wt.%) sample could be a good photocatalyst due its orthorhombic structure; however, for this manganese concentration, the element did not act as an appropriate morphological and surface modifier. Doping allowed obtaining smaller particles and gap energy values lower than pure niobium pentoxide. We believe that these properties may be desirable in other applications, such as bactericidal activity. We attribute the low photocatalytic response to the loss of crystalline properties with the increase in Mn content. At 5% and 10% of Mn content, the crystalline phase of Nb2O5 was progressively amorphized.
Author Contributions
Conceptualization, A.M.R.-P. and C.F.-G.; methodology, M.R.J., and A.M.R.-P.; investigation, A.M.R.-P.; data curation, A.M.R.-P., C.F.-G., and I.S.-G.; first draft preparation, A.M.R.-P.; writing—review and editing, M.R.J., and A.M.R.-P.; supervision, M.R.J.; All authors have read and agreed to the published version of the manuscript.
Funding
This research received no external funding.
Acknowledgments
We would like to thank Universidad Francisco de Paula Santander UFPS, Cúcuta Colombia, Universidad Nacional de Colombia, Universidad Pedagógica y Tecnológica de Colombia UPTC, CINVESTAV México D.F., and COLCIENCIAS (757-2016) for providing us with the financial support to conduct this study.
Conflicts of Interest
The authors declare that they have no conflict of interest.
Abbreviations
The following abbreviations are used in this manuscript:
| XRD: X-ray diffraction; |
| FE-SEM: Field Emission–Scanning Electronic Microcopy; |
| BET: Brunauer–Emmett–Teller; |
| DRS: Diffuse Reflectance Spectroscopy; |
| DLS: Dynamic Light Scattering. |
References
- Alexandre, P.; Lucas, B.; Carolina, P.; Aline, M.; Leonardo, C. Nb2O5 as Efficient and Recyclable Photocatalyst for Indigo Carmine Degradation. Appl. Catal. B 2008, 82, 219–224. [Google Scholar]
- Wonyong, C.; Andreas, T.; Michael, H.R. The role of metal ion dopants in quantum-sized TiO2: Correlation between photoreactivity and charge carrier recombination dynamics. J. Phys. Chem. 1994, 98, 13669–13679. [Google Scholar]
- Siddiki, M.K.; Venkatesan, S.; Qiao, Q. Nb2O5 as a new electron transport layer for double junction polymer solar cells. Phys. Chem. Chem. Phys. 2012, 14, 4682–4686. [Google Scholar] [CrossRef] [PubMed]
- Yoshimura, K.; Miki, T.; Iwama, S.; Tanemura, S. Characterization of niobium oxide electrochromic thin films prepared by reactive d.c. magnetron sputtering. Thin Solid Films 1996, 281, 235–238. [Google Scholar] [CrossRef]
- Fang, X.; Hu, L.; Huo, K.; Gao, B.; Zhao, L.; Liao, M.; Chu, P.K.; Bando, Y.; Golberg, D. New ultraviolet photodetector based on individual Nb2O5 nanobelts. Adv. Funct. Mater. 2011, 21, 3907–3915. [Google Scholar] [CrossRef]
- Jung, S.C.; Imaishi, N.; Park, H.C. Reaction engineering modeling of low-pressure metalorganic chemical vapor deposition of Nb2O5 thin film. Jpn. J. Appl. Phys. 1995, 34, L775. [Google Scholar] [CrossRef]
- Roberts, G.L.; Cava, R.J.; Peck, W.F.; Krajewski, J.J. Dielectric properties of barium titanium niobates. J. Mater. Sci. 1997, 12, 526–530. [Google Scholar] [CrossRef]
- Ramanjaneya Reddya, G.; Chennakesavulu, K. Synthesis and characterization of Nb2O5 supported Pd(II)@SBA15: Catalytic activity towards oxidation of benzhydrol and Rhodamine-B. J. Mol. Struct. 2014, 1075, 406–412. [Google Scholar] [CrossRef]
- Falcomer, D.; Speghini, A.; Ibba, G.; Enzo, S.; Cannas, C.; Musinu, A.; Bettinelli, M. Morphology and luminescence of nanocrystalline Nb2O5 doped with Eu3+. J. Nanomater. 2007, 2007, 1–5. [Google Scholar] [CrossRef]
- Rekha, K.; Nirmala, M.; Nair, M.G.; Anukaliani, A. Structural, optical, photocatalytic and antibacterial activity of zinc oxide and manganese doped zinc oxide nanoparticles. Phys. B Condens. Matter. 2010, 405, 3180–3185. [Google Scholar] [CrossRef]
- Joya, M.R.; Ortega, J.B.; Malafatti, J.O.D.; Paris, E.C. Evaluation of Photocatalytic Activity in Water Pollutants and Cytotoxic Response of α-Fe2O3 Nanoparticles. ACS Omega 2019, 4, 17477–17486. [Google Scholar] [CrossRef] [PubMed]
- Raba, A.M.; Falcony, C.; Joya, M.R. Evaluación de la actividad fotocatalítica de nanoestructuras de T-Nb2O5 obtenidas por el método sol-gel. Respuestas 2016, 21, 80–91. [Google Scholar] [CrossRef]
- Rania, B.J.; Ravina, M.; Ravia, G.; Ravichandranb, S.; Ganeshc, V.; Yuvakkumar, R. Synthesis and characterization of hausmannite (Mn3O4) nanostructures. Surf. Interface 2018, 11, 28–36. [Google Scholar] [CrossRef]
- Masloboeva, S.M.; Sidorov, N.V.; Palatnikov, M.N.; Arutyunyan, L.G.; Chufyrev, P.G. Niobium(V) oxide doped with Mg2+ and Gd3+ cations: Synthesis and structural studies. Russ. J. Inorg. Chem. 2011, 56, 1194–1198. [Google Scholar] [CrossRef]
- Jehng, J.M.; Wachs, I.E. Structural chemistry and Raman spectra of niobium oxides. Chem. Mater. 1991, 3, 100–107. [Google Scholar] [CrossRef]
- Braynera, R.; Bozon-Verduraz, F. Niobium pentoxide prepared by soft chemical routes: Morphology, structure, defects and quantum size effect. Phys. Chem. Chem. Phys. 2003, 5, 1457–1466. [Google Scholar] [CrossRef]
- Ristic, M.; Popovic, S.; Music, S. Sol-gel synthesis and characterization of Nb2O5 powders. Mater. Lett. 2004, 58, 2658–2663. [Google Scholar] [CrossRef]
- Escobedo, A.; Sánchez, E.; Pal, U. Use of diffuse reflectance spectroscopy for optical characterization of un-supported nanostructures. Rev. Mex. Fis. 2007, 53, 18–22. [Google Scholar]
- Tauc, J. Absorption edge and internal electric fields in amorphous semiconductors. Mater. Res. Bull. 1970, 5, 721–729. [Google Scholar] [CrossRef]
- Raba, A.M.; Bautista-Ruíz, J.; Joya, M.R. Synthesis and structural properties of niobium pentoxide powders: A comparative study of the growth process. Mater. Res. 2016, 19, 1381. [Google Scholar] [CrossRef]
- Raba, A.; Barba-Ortega, J.; Joya, M.R. Effects of metal doping agent on the properties of Nb2−xMxO5 (M = Mn, Fe, and Ni) system. Int. J. Appl. Ceram. Technol. 2018, 15, 1577–1583. [Google Scholar] [CrossRef]
- Liqiang, J.; Yichun, Q.; Baiqi, W.; Shudan, L.; Baojiang, J.; Libin, Y.; Wei, F.; Honggang, F.; Jiazhong, S. Review of photoluminescence performance of nano-sized semiconductor materials and its relationships with photocatalytic activity. Solar Energy Mater. Sol. Cells 2006, 90, 1773–1787. [Google Scholar] [CrossRef]
- Lopes, O.F.; Paris, E.C.; Ribeiro, C. Synthesis of Nb2O5 nanoparticles through the oxidant peroxide method applied to organic pollutant photodegradation: A mechanistic study. Appl. Catal. B Eenviron. 2014, 144, 800–808. [Google Scholar] [CrossRef]
- Yan, M.; Hua, Y.; Zhu, F.; Gu, W.; Jiang, J.; Shen, H.; Shi, W. Fabrication of nitrogen doped graphene quantum dots-BiOI/MnNb2O6 p-n junction photocatalysts with enhanced visible light efficiency in photocatalytic degradation of antibiotics. Appl. Catal. B Eenviron. 2017, 202, 518–527. [Google Scholar] [CrossRef]
- Ferrari-Lima, A.M.; Marques, R.G.; Gimenes, M.L.; Fernandes-Machado, N.R.C. Synthesis, characterization and Photocatalytic activity of N-doped TiO2-Nb2O5 mixed oxides. Catal. Today 2015, 254, 119–128. [Google Scholar] [CrossRef]
- Oliveira, J.A.; Reis, M.O.; Pires, M.S.; Ruotolo, L.A.M.; Ramalho, T.C.; Oliveira, C.R.; Lacerda, L.C.T.; Nogueira, F.G.E. Zn-doped Nb2O5 photocatalysts driven by visible-light: An experimental and theoretical study. Mater. Chem. Phys. 2019, 228, 160–167. [Google Scholar] [CrossRef]


© 2020 by the authors. Licensee MDPI, Basel, Switzerland. This article is an open access article distributed under the terms and conditions of the Creative Commons Attribution (CC BY) license (http://creativecommons.org/licenses/by/4.0/).