Abstract
Anaerobic digestion (AD) is an economical and effective method to treat sludge. AD with several pretreatments is the prior process to treat surplus sludge for a wastewater treatment plant. During a sludge-treatment process, various methanogens play their specific role in each sludge-processing stage where different methanogens predominate. Therefore, an expert in the shift of methanogen community could facilitate the workers in a plant to understand the efficiency of the sludge-treatment process. In this paper, a membership-fusing model is established to characterize the shift of methanogen community in a three-stage sludge-treatment process. The introduction of fuzzy sets clarifies the vagueness of the methanogen community structure between two processing stages. Dempster–Shafer (DS) evidence theory effectively alleviates the data error generated among paralleling samples. The accuracy of the model was verified, and the result shows the model could clearly distinguish the methanogen community structure of the three stages and make accurate judgment on the processing stage affiliation. The reliability of the model in dealing with different numbers of conflict data was proved and the experiment indicates the model could make a reliable judgment on the processing stage affiliation by reasonably fusing the interference data.
1. Introduction
A large amount of surplus sludge, as by-product, is generated from the primary and secondary sedimentation tanks in a wastewater treatment plant every day [1]. The sludge is mainly composed of organic materials, water, nitrogen, and phosphorous nutrients, heavy metals, and pathogens [2]. Resources would be wasted, and harmful substances would be discharged into the environment if the sludge were not treated properly. Anaerobic digestion (AD) is proved to be an environmental-friendly and cost-effective treatment compared with other methods in realizing sludge reduction, stabilization, and harmlessness. The biogas produced in AD process could be used as a type of biofuel to generate energy, replacing above 86% of the energy derived from traditional fossil fuels [3]. Nutrients, such as nitrogen, phosphorous, and potassium, could also be recovered and used in AD process [4].
Basically, AD is a serious of interrelated complex biochemical reactions participated by various microorganisms, interacting with each other, to degrade organic compounds [5]. AD is usually divided into four procedures: hydrolysis, acidification, acetogenesis, and methanogenesis [6]. Complex organic materials are first hydrolyzed to soluble organic molecules, which then are fermented into short-chain fatty acids by hydrolytic and acidogenic bacteria in hydrolysis and acidification. Afterwards, the fatty acids are oxidized to H2 and acetate by acetogenic bacteria during acetogenesis. In the final methanogenesis, two metabolic paths exist. One is H2 used by hydrogenotrophic methanogens as the electron donor to reduce CO2 to methane [7]. The other is acetate decomposed by acetotrophic methanogens to methane [8]. As most of the organic compounds of the sludge are distributed in microbial cells in solid form, cell walls and membranes form firm barriers prohibiting the release of the organic compounds, and the hydrolysis rates of the hydrolytic enzymes outside microbial cells towards complex organic materials are relatively low, hydrolysis is considered to be the control step in AD process [9]. Physical, chemical, and biological pretreatments have been adopted to accelerate the speed of hydrolysis and alleviate the burden on AD process [10]. Enzymes are usually applied in the biological method as biocatalysts to degrade organic compounds [11], but they are less effective in treating surplus sludge as they easily degrade themselves before hydrolysis starts. Alkalization and acidification are commonly adopted chemical pretreatments to solubilize microbial cell walls and release intracellular organic matter [12]; however, the quality of the produced biogas pretreated by these methods needs to be further guaranteed. Physical pretreatments, such as ultrasonic and microwave, demand much more energy than other methods although the biogas yields can be greatly improved. Taking comprehensive consideration, thermal hydrolysis has been considered to be the prior selection for the surplus sludge pretreatment, because it is a high potential pretreatment in enhancing both the degradability of organic compounds and the yields of biogas with no extra energy input [13,14].
For a wastewater treatment plant, a commonly adopted sludge-treatment process consists of pretreatments, AD and posttreatments aiming to compress the sludge volume for final disposal [1]. Various types of microorganisms are involved in different biochemical reactions in both pretreatments and AD process, and the microbial metabolic viability could affect the efficiency and stability of the sludge-treatment process [15,16]. Methanogens have more strict growing requirements and longer doubling times than other microorganisms participating in the sludge-treatment process, which is widely concerned as the control microbial community in AD process [17].
Most previous studies regarding AD have been focused on the influence of environmental factors, such as temperature, pH, volatile fatty acids, ammonia, and the feedstock composition, on the shift of methanogen community. A change from mesophilic (30–40 °C) to thermophilic (50–60 °C) condition has exerted a significant impact on the methanogen community structure [18,19]. Improper pH might impair the microbial viability by restraining the activity of hydrolytic enzymes and producing ionic toxicity to microorganisms [20], and methanogens always require a strict range of pH for growth [21]. Jiang et al. [22] demonstrated the selective inhibition of ammonia on methanogens, and found the more susceptible characteristics of acetotrophic methanogens than hydrogenotrophic methanogens. Researchers have found the different effects of various feedstock, either positive or negative, on the growth of microorganisms in AD process [23,24], and that the adding of trace elements to feedstock could facilitate the metabolism and growth of methanogens [25]. As for the research on thermal hydrolysis pretreatment, much attention has been payed to the effect of temperature and heating time on the efficiency of hydrolysis and biogas yields. The optimal temperature and heating time vary greatly from 160 to 180℃ and 30 to 60 mins, respectively [26,27,28,29,30]. Westerholm et al. [31] further confirmed thermal hydrolysis changed the composition and species abundance of the microbial community compared with the un-pretreated one.
However, study on the shift of methanogen community in a sludge-treatment process has not been investigated yet. For a wastewater treatment plant, a clear characterization of the shift of methanogen community could reflect the efficiency and environmental condition of different processing stage, which could provide workers an advisable instruction to regulate the sludge-treatment process. In each sludge-processing stage, the structure of methanogen community is unique and in a relative stable range of change because of the heterogeneous and relatively steady environmental condition each stage provides. Therefore, the boundary of the methanogen community structure between two processing stages could not be such clear. Furthermore, the data error caused by sample contamination and faults occurring in data measurement and analysis processes has not been fully taken into consideration when analyzing the microbial information in previous research. Although paralleling samples were collected to weaken the data error, the method to process the paralleling data is just taking the average value. If the paralleling data deviated extremely, the average value could not represent the authentic one. Fuzzy sets are good at describing the vagueness of a certain phenomenon and uncertainty caused by data error [32,33,34], and Dempster-Shafer (DS) evidence theory is adept at fusing imprecise and conflict data from multi-sources [35,36]. Both theories are combined to resolve the problem of the uncertain boundary of the methanogen community structure between two sludge-processing stages and data error generated among paralleling data.
This paper aims to propose a membership-fusing model combing fuzzy sets and DS evidence theory to properly characterize the shift of methanogen community in different processing stages of a three-stage sludge-treatment process and reasonably determine which stage the tested paralleling sludge samples most likely come from by measuring the shift of methanogen community. The organization of this paper is as follows: In Section 2, the three-stage sludge-treatment process is abstracted and the main functional methanogens able to characterize the shift of methanogen community are selected. Then the membership-fusing model is established based on fuzzy sets and DS evidence theory. In Section 3, a sampling scheme and methods of data measurement and analysis are put forward, and undetermined parameters of the model are set up statistically with the measurement data from past several years. In Section 4, the membership-fusing model is verified by a group of new data, and different numbers of interference data have been investigated to confirm the reliability of the model in addressing conflict and imprecise data brought by paralleling samples. Final conclusions are made in Section 5.
2. Membership-Fusing Model of Sludge-Treatment Process
The membership-fusing model is proposed below to characterize the variation of methanogen community in the three-stage sludge-treatment process, which is applied to determining the specific processing stage of a group of examined paralleling sludge samples. The procedure to establish the model consists of two parts, as is shown in Figure 1. The first part is to abstract a sludge-treatment technical route into the three-stage process illustrated in Section 2.1, and the corresponding sampling points representing each stage are set to collect sludge samples. Then, the methanogens characterizing the variation of methanogen community are selected, and high-throughput sequencing technology is used to measure the gene sequences of each sludge sample to quantify the selected methanogens. The second part is to establish fuzzy sets SI, SII, SIII, and Sun to describe the affiliation of the processing stage of the sludge sample. The probability of the stage affiliation is assessed by the corresponding basic membership functions A(SI), A(SII), A(SIII) and A(Sun), which are then normalized as B(SI), B(SII), B(SIII) and B(Sun). The normalized memberships are subsequently fused to obtain the integrated memberships C(SI), C(SII), C(SIII) and C(Sun). The maximum among the four integrated memberships indicates which processing stage the tested paralleling sludge samples most likely belong to.
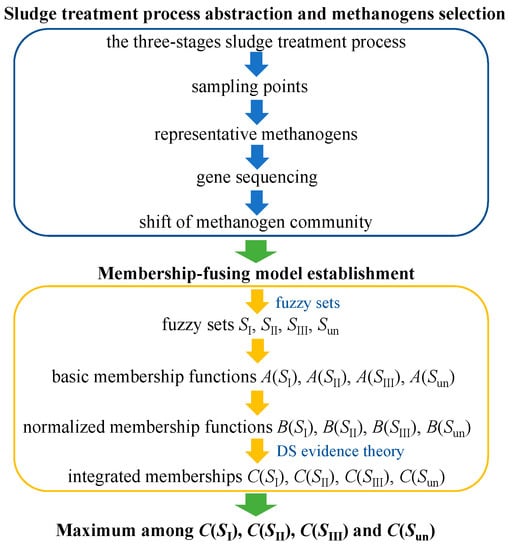
Figure 1.
Procedure to build the membership-fusing model.
2.1. Sludge-Treatment Process and Representative Methanogen
The prior technical route to treat surplus sludge for a wastewater treatment plant in China is thickening, thermal hydrolysis, AD, dewatering and final disposal [1], as is shown in Figure 2. To be specifically, thickening, either gravity, or floatation, or mechanical thickening, aims to reduce water content of the sludge to be about 95%, which benefits the subsequent steps. Thermal hydrolysis purposes to improve the efficiency of AD process by enhancing the degradability of organic compounds and methane yields [13,14]. AD is the critical processing stage to degrade sludge. Dewatering, belt dewatering, centrifugal dewatering, and plate-frame dewatering included, is designed to compress the sludge volume, which alleviates the burden on the final disposal. To understand the efficiency of the sludge-treatment process, AD processing stage is widely considered to be the essential point [5,6]. As is shown in Figure 2, the three stages—two stages before AD which could affect the effect of AD, and AD stage, defined as Stage I, II, and III—must be the concerned processing stages in the sludge-treatment process. Sampling points are set at the exit of each processing stage among the three stages to collect sludge samples for further analysis on methanogen community, as is shown in Figure 2. Sludge samples from sampling point I, after thickening and before thermal hydrolysis, could characterize the feature of sludge in stage I. Sampling point II and III, after thermal hydrolysis and before AD, and after AD and before dewatering, could represent stage II and III, respectively. Paralleling sludge samples with a certain number, usually ranging from 3 to 10, are gathered from each processing stage.
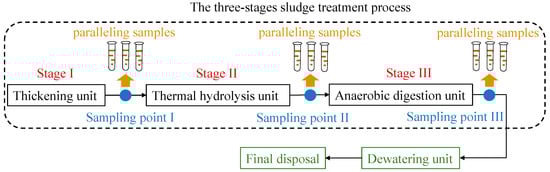
Figure 2.
Sludge-treatment process and distribution of sampling points.
The quantity ratio of Methanosaeta to Methanobacterium could represent the shift of methanogen community, defined as the independent variable x, calculated by Equation (1):
where R1 and R2 stand for the reads of genes of the genera of Methanosaeta and Methanobacterium, respectively. High-throughput sequencing technology is applied to measure the quantities of the two genera of methanogens. Each sludge sample generates a great deal of reads of genes pertaining to various methanogens by the gene sequencing. Summing the reads of genes belonging to genus Methanosaeta and genus Methanobacterium up, respectively, and then do the ratio of the two sums to generate a certain value of x. The representative role of Methanosaeta [8] and Methanobacterium [37] is clarified as follow: first, previous studies have found that acetotrophic methanogen Methanosaeta and hydrogenotrophic methanogen Methanobacterium are the two main functional methanogens in AD process [37,38]. Secondly, their relative shift in quantity varies greatly in each sludge-processing stage, owing to the different growing requirements of these two genera of methanogens and the specific environment each stage provides [7,8,37]. Lastly, the relative variation of these two genera of methanogens is in a dynamic stable range of change in each stage due to the relatively steady surrounding of each processing stage. Consequently, a specific x value could reflect a specific state of the methanogen community, characterize a sludge-processing stage among the three stages, and reveal the efficiency and environmental condition of the representative processing stage. The value of x is distributed in a certain range for the three-stage sludge-treatment process and x also has a relative stable value range for each processing stage. Specifically, for stage I, the physical treatment provides the same environmental stress for the two genera of methanogens and the x value is usually below 10. The increase of the temperature in stage II is more favorable for hydrogenotrophic methanogen Methanobacterium to grow and the x value is lower than that of stage I [18]. Acetotrophic methanogenesis is the major path to produce methane compared with hydrogenotrophic methanogenesis in AD process, and x is supposed to be much greater than 10 for stage III [39].
2.2. Membership-Fusing Model
Based on the three-stage sludge-treatment process and the quantity ratio x, the membership-fusing model is established by combing fuzzy sets and DS evidence theory. First, four fuzzy sets SI, SII, SIII, and Sun are put forward to elucidate the affiliation of the processing stage of a sludge sample being Stage I, Stage II, Stage III, and stage uncertain. SI, SII, and SIII contain x values belonging to Stage I, II, and III, respectively. Sun clarifies the indetermination of the processing stage of a sludge sample, considering of both the vague boundary of the methanogen community structure between two processing stages, and the absence of x values around 10. The data error generated among paralleling samples caused by sample contamination and incidental and instrumental errors occurring in data measurement and analysis processes would lead to the appearance of x values outside the fuzzy sets representing the three stages. The degree of the probability of a sludge sample from Stage I, II, III, and uncertain is described by the corresponding basic membership function of each fuzzy set, A(SI), A(SII), A(SIII), and A(Sun), respectively, established in Equation (2), referring to the traditional normally distributed membership function:
where parameters τ1, c1 and τ2, c2 reflect the trends of A(SII) and A(SIII), respectively. Parameters τ1 and τ2 indicate the changing gradients of the uncertainties of the two basic membership functions, while c1 and c2 clarify the limits of the x value where the two basic membership functions become uncertainly. Values of c1 and c2 are equal to the values of x when A(SII) and A(SIII) equal 0.5. Parameters u1 and u2 are the average values of SI and Sun and describe the most probable x values belonging to Stage I and stage uncertain. Parameters σ1 and σ2 are the standard deviation of SI and Sun and reveal the degree of the deviation of x values away from the average x value. Parameters mentioned above should satisfy condition (3) and are determined by statistics method elucidated in Section 3.3:
where xjaver, xjsd, xjmax, and xjmin are the average value, standard deviation, maximum and minimum of x of Sj (j = I, II, III). 2σ principle [40] means the probability of the value of the normally distributed function is 0.95443 when the independent variable distributes in (u-2σ, u+2σ). In other words, x outside (u−2σ, u+2σ) is most unlikely to exist, which is applied to determine the values of u2 and σ2. Considering of the vagueness of the critical state of methanogen community structure between two sludge-processing stages, the average value of x is chosen to be the boundary value. Then the basic membership functions are normalized in Equation (4):
Sample contamination might occur, possibly brought from improper operations of sampling persons, or from samples transfer process, or from the inconsistency of the environmental condition of each sampling time. Instrumental and incidental data errors brought by measurement instruments and human operations are inevitable in data measurement and analysis processes [41]. All these circumstances could result in several imprecise and conflict x values generated from a group of paralleling sludge samples, so that the paralleling normalized memberships of a certain fuzzy set might deviated extremely. DS evidence theory is introduced to address such problem of data error brought by multi-sources. The four types of normalized memberships obtained from a group of paralleling sludge samples are fused together to generate the integrated membership C(S) of each fuzzy set in Equation (5):
where M stands for the number of the paralleling sludge samples. S1, S2, …, SM represent any one of the four fuzzy sets, either SI, or SII, or SIII, or Sun, and are obtained from the M paralleling sludge samples, respectively. B(Sm) (m = 1, 2, …, M) are the corresponding normalized memberships. K stands for the total conflict results generated from the M paralleling samples. S obeys the intersection operation in condition (6):
For M paralleling x values of a certain fuzzy set, if several data not belonging to this fuzzy set appeared, the integrated membership C(Sun) would be higher. The other three integrated memberships would be more reliable by considering the existence of the null set when two conflict data from two stages occur, and eliminating the influence of Sun when intersecting with other three fuzzy sets. The unreliability regarding the judgment on the specific processing stage would be weakened more reasonably compared with just averaging the paralleling data [42].
The maximum among C(SI), C(SII), C(SIII), and C(Sun) elucidates the most probable state of the examined paralleling sludge samples, either to be Stage I, or II, or III, or uncertain, based on the maximum principle of fuzzy sets.
3. Experiment and Parameter Setup
3.1. Sampling Scheme
The membership-fusing model was applied to the three-stage sludge-treatment process in Beijing Gaobeidian Wastewater Treatment Plant, a municipal wastewater treatment plant in Beijing, China. The sludge-treatment technical route was abstracted into the three-stage process in consistent with that illustrated in Figure 2, as is shown in Figure 3. As centrifugal thickening and pre-dewatering are the two physical operations with the same pressure on the environmental condition, which makes little difference on the methanogen community structure, these two processing stages are both included in Stage I. Sampling points were set at the exit of each processing stage. Six paralleling samples were collected for one sampling point at each sampling time. Sludge samples were collected once a day in the morning in every September with 30 days from the past six years, 2014 to 2019. Eighteen samples obtained each day were kept away from light and stored at −20 °C within three days for the gene sequencing.
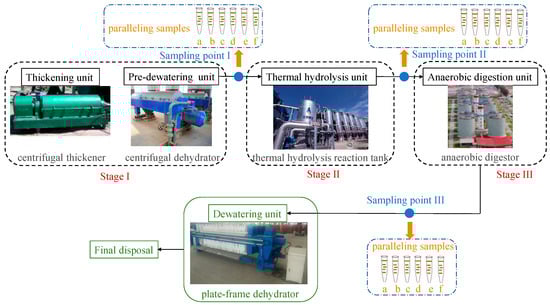
Figure 3.
Sludge-treatment process and distribution of sampling points of Beijing Gaobeidian Wastewater Treatment Plant.
3.2. High-throughput Sequencing Technology
3.2.1. DNA Extraction
DNA was extracted with Fast DNA™ Spin Kit for Soil (MP Biomedicals). DNA quality and concentration were measured by a NanoDrop Spectrophotometer (Nano-100, Aosheng Instrument Co Ltd.) to ensure the absorbance ratios of 260/280 nm was approximately 1.8 and that of 260/230 nm was above 1.7.
3.2.2. Polymerase Chain Reaction (PCR) Amplification, Sequencing, Quantification
Methyl coenzyme M reductase (mcrA) gene was chosen to be the target gene to study methanogens [43,44,45,46]. Amplicon sequencing was performed on a MiSeq platform to collect raw sequencing data (Illumina, San Diego, CA, USA). Primers for amplifying had the following gene sequences: MLf, GGTGGTGTMGGATTCACACARTAYGCWACAGC, and MLr, TTCATTGCRTAGTTWGGRTAGTT [43]. The procedure of polymerase chain reaction (PCR) was as follows: Each sample was run in triplicates for PCR amplification using a Bori LineGene9600plus real-time PCR instrument (Hangzhou Langji Scientific Instrument Co., Ltd., China) with Taq DNA Enzyme, template DNA, primers, 10×PCR buffer and dNTP mixture. The PCR cycling program was as follows: an initial denaturation at 95 °C for 3 mins and 35 cycles consisting of denaturizing at 95 °C for 30 secs, annealing at 56 °C for 30 secs and extension at 72 °C for 40 secs. Subsequently, the PCR products were confirmed by agarose gel electrophoresis, purified with the Gel Extraction Kit, and quantified through an ultra-trace visible ultra-violet (UV) spectrophotometer (ND5000, BioTeke Corporation). The PCR products generated contained barcodes and primers.
3.2.3. Sequence Analysis
Raw sequences were conducted quality control by the Galaxy-based pipeline in Denglab (http://mem.rcees.ac.cn:8080) with default parameters to get rid of barcodes and primers, and guarantee the length of the mcrA gene sequences was above 400bp [45]. Then operational taxonomic units (OTUs) were clustered at the 97% similarity level by Unoise to generate ZOTU to produce the OTU table. A library of the mcrA gene was constructed by first downloading all mcrA gene sequences from Functional Gene Repository (http://fungene.cme.msu.edu). Then the sequences of each gene were verified in the National Center for Biotechnology Information (NCBI) non-redundant database. Finally, 80% and 85%, corresponding to the 16S rDNA sequence identity of 95% and 97%, were set as the cut-off of genus and species, respectively, when assigning taxonomic to produce the species classifier table of methanogens [44,45].
3.3. Model Parameter
Statistical methods were used to determine the unknown parameters of the membership functions. For one stage, 900 paralleling x values were obtained from the corresponding paralleling sludge samples in every September from 2014 to 2018. All 2700 x values from the three stages were made statistical analysis. Values of xIaver, xIsd, xIImin, xIImax, xIIImin, xIIIaver, and xIIImax are 4.8, 2.3, 0.0, 2.0, 15.8, 17.2 and 20.0, respectively. The value of x is speculated to range from 0.0 to 20.0 based on the minimum and maximum. According to condition (3)., parameters u1 and σ1 are expected to be 4.8 and 2.3. Parameters u2 and σ2 are required to satisfy the conditions of u2-2σ2 and u2+2σ2 equaling 4.8 and 17.2, respectively, thus, u2 and σ2 were calculated to be 11.0 and 3.1. Parameters c1 and c2 are 2.0 and 15.8, and τ1 and τ2 should be above 3.45 and 1.64 based on condition (3). To further analysis the effect of τ1 and τ2 on the gradients of basic membership functions A(SII) and A(SIII), τ1 was set to be 2.5, 3.5, 5.0, 10.0 and 18.0, and τ2 was set to be 1.0, 1.7, 3.5, 6.0 and 10.0, respectively. Curves of the four basic membership functions in Equation (2) are drawn in Figure 4.
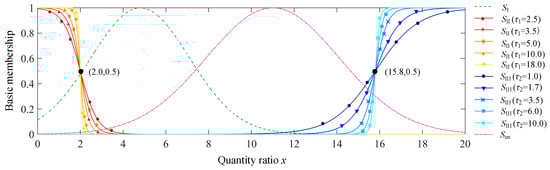
Figure 4.
Basic membership functions with the change of parameters τ1 and τ2.
As is shown in Figure 4, the relatively low x produces the higher membership of SII compared with memberships of SI, SIII, and Sun, while the relatively large x generates the bigger A(SIII) compared with other three memberships. With the increase of x, A(SII) falls rapidly to 0, while A(SIII) climbs lately to 1. As x increases, A(SI) goes up to 1 fast and then goes down, while A(Sun) rises slowly to 1 and then descends. A(SII), or A(SI), or A(Sun), or A(SIII) predominates within a certain range of x. Furthermore, the larger the values of τ1 and τ2, the bigger the gradients of A(SII) and A(SIII), and the smaller the uncertainties of fuzzy sets SII and SIII. When τ1 and τ2 exceed 10.0 and 6.0, respectively, the two fuzzy sets almost convert to the non-fuzzy sets with the threshold of x values being 2.0 and 15.8. In this model, 3.5 and 1.7 are set to be the values of τ1 and τ2. Figure 5 describes the trends of the normalized membership functions in Equation (4) with the parameters determined above. As can be seen, SII is predominant when x is below 2.01, SI and Sun play decisive role when 2.01 < x < 7.45 and 7.45 < x < 15.45, respectively, and it is most probable of x values belonging to SIII when x is above 15.45.
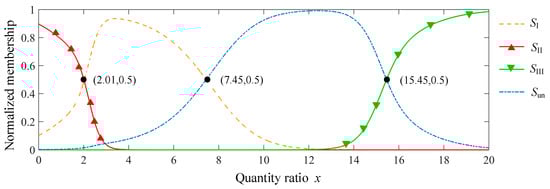
Figure 5.
Normalized membership functions with the determined parameters.
4. Results and Discussion
4.1. Variation of Membership of Different Stage
To prove the accuracy of the membership-fusing model, characterized by Equations (2), (4) and (5) with the determined parameters, a group of 18 sludge samples collected in the first day in September, 2019 was chosen to measure the mcrA gene sequences to verify whether the sequencing data satisfy the membership functions. Figure 6a exhibits the distribution of the relative abundance of different genera methanogens from all samples of the three stages, from which the value of quantity ratio of Methanosaeta to Methanobacterium could be obtained according to Equation (1). The six paralleling x values of stage I were calculated to be 7.15, 7.09, 7.01, 7.26, 7.08 and 6.98, between 2.01 and 7.45, within the range of x where the membership function of SI predominates. This result demonstrates the processing stage affiliation of the tested paralleling samples being Stage I, which in turn reveals the applicability of B(SI) and A(SI). The six paralleling x values obtained from samples of Stage II are 1.63, 1.58, 1.62, 1.57, 1.71 and 1.69, ranging from 0 to 2.01, indicating these samples are most likely from Stage II and the feasibility of B(SII) and A(SII). The six paralleling x values of Stage III are 15.69, 15.61, 15.73, 15.72, 15.70 and 15.65, all above 15.45, reflecting these samples most probably belong to Stage III and the fitness of B(SIII) and A(SIII). All x values generated from the 18 sludge samples distribute outside the range, from 7.45 to 15.45, showing the rationality of B(Sun) and A(Sun). These three results indicate the accuracy of the membership functions was verified in the aspect of the rational distribution of x values and the unique methanogen structure of each processing stage could also be properly distinguished by the model.
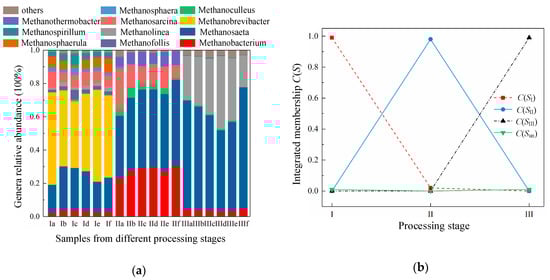
Figure 6.
Variation of x values and integrated memberships of different sludge-processing stages: (a) Relative abundance of different genera of methanogens (letters a to f represent the six paralleling sludge samples from one stage, roman numerals I, II, and III represent Stage I, Stage II and Stage III of the three-stage sludge-treatment process); (b) Integrated memberships of different processing stages. (Stage I stands for the state of sludge samples after treated by centrifugal thickening and pre-dewatering, Stage II stands for the state of sludge samples after treated by thermal hydrolysis, Stage III stands for the state of sludge samples after experiencing anaerobic digestion, and stage uncertain stands for the uncertainty of the processing stage affiliation of a sludge sample.)
For each processing stage, the four integrated memberships generated from the six paralleling samples are shown in Figure 6b, from which the judgment on the stage affiliation of a group of paralleling sludge samples could be made. The determined stage could then be checked to test if it corresponds to the stage where this group of paralleling samples were collected. For Stage I, the integrated memberships of SI, SII, SIII, and Sun are 0.99, 0.00, 0.00 and 0.01, respectively, whose total value is 1.00 and C(SI) is the maximum. This consequence confirms that this group of paralleling samples most likely belong to Stage I, in consistent with the stage where the six paralleling samples were collected. The 99% possibility of this group of paralleling samples collected from Stage I reveals the vague boundary of the methanogen community structure owing to the relatively steady change of the inlet quality and running operation condition of different sampling time. The integrated memberships of SI, SII, SIII, and Sun for Stage II are 0.02, 0.98, 0.00 and 0.00, whose sum is 1.00 and C(SII) is the largest. This result indicates that the judgment on the processing stage affiliation of these six paralleling sludge samples being Stage II, corresponding with where these samples were gathered. The possibility of 98% belonging to Stage II rather than 100% uncovers the relatively small fluctuation of the wastewater quality treated by thermal hydrolysis of different sampling time. The 2% possibility being Stage I elucidates the higher similarity of the methanogen community structure between Stage I and II compared with that between Stage II and III, or Stage I and III. The same phenomenon is also illustrated in Figure 6a. The integrated memberships generated from paralleling samples of Stage III are 0.00, 0.00, 0.99 and 0.01 for SI, SII, SIII, and Sun, whose total value is 1.00 and C(SIII) is the biggest. It could be made a conclusion that the model could make a correct judgment on the processing stage affiliation of this group of paralleling samples being Stage III, and there is a little fluctuation of the wastewater quality in the anerobic digestor of different sampling time. In general, the four integrated memberships generated from any group of paralleling samples aggregate to 1, paralleling samples from one stage could generate the corresponding largest C(S) representing the same stage. Therefore, the membership functions could make an accurate judgment on the processing stage affiliation of the examined paralleling sludge samples, and the vagueness and uniqueness of the methanogen community structure of one processing stage could be characterized properly by the model. By analyzing both the x values and the integrated memberships of the paralleling samples belonging to the three stages, the rationality of the membership function format, the statistical method to determine parameters, and the methodology to process paralleling data are all proved, which in turn verifies the accuracy of the membership-fusing model.
4.2. Variation of Membership with Different Number of Interference Data
The existence of sample contamination and incidental and instrumental data errors resulted from data measurement and analysis is inevitable, therefore, the x value of Sun from which could not make a determinate judgment on the processing stage among the three stages most likely exists. This type of x value, known as the interference data, would impair the reliability of the model when deciding the specific sludge-processing stage. DS evidence theory is introduced to address such problem of data impreciseness and conflict among paralleling data. To verify the performance of the model in dealing with different numbers of interference data, a group of interference data with the number below the number of the total paralleling data was introduced to one processing stage. Eighteen x values, the same with that in Section 4.1, were chosen to be the non-interference data group. The interference data group was generated through computer random selection. For Stage I, the interference data were generated from x values obtained from paralleling sludge samples of Stage I collected from 2014 to 2018. The specific values were determined by computer randomly selecting five x values whose maximal normalized memberships were B(Sun), which could not indicate a determinate processing stage among the three stages. One interference data was brought to the six paralleling non-interference data each time, five interference data were brought in in total and the number of the total paralleling data was maintained to be six. The same operation was conducted to the other two groups x values belonging to Stage II and III, respectively. For one stage, five interference data were generated, and one data was introduced one time.
The non-interference data together with the five groups x values generated by introducing one to five interference data in turn for Stage I are shown in Figure 7a. All interference data are distributed in Sun. The corresponding integrated memberships of each fuzzy set calculated from these six groups of data are exhibited in Figure 7b. C(SI) are 0.99, 0.98, 0.97, 0.93, 0.85 and 0.65, and C(Sun) are 0.01, 0.02, 0.03, 0.07, 0.15 and 0.35 with the increasing number of interference data. C(SII) and C(SIII) are in a negligible range of change approximately around 0. As is shown in Figure 7b, as the number of interference data increases, the integrated membership of SI goes down and that of Sun goes up, and C(SI) is the largest among the six groups. This consequence indicates that with the increasing number of interference data, the probability of this group of paralleling sludge samples belonging to Stage I declines, the uncertainty of which stage these paralleling samples are from rises, which reveals that the credibility of the five data groups with interference data descends and sample contamination and faults occurring in data measurement and analysis might appear. Furthermore, interfering x values with the number below the total paralleling data could not change the maximal integrated memberships being C(SI). In other words, the interference data could not play a decisive role in determining the stage affiliation of a group of paralleling samples, but could weaken the belief degree on the judgment on the processing stage affiliation being stage I. When only one non-interference data left for Stage I, C(SI), C(SII), C(SIII) and C(Sun) are 0.65, 0.00, 0.00 and 0.35, close to 0.60, 0.00, 0.00 and 0.40, values of B(SI), B(SII), B(SIII) and B(Sun) when x value is 6.98, the last non-interfering x in this data group. This result reflects that the calculation of integrated memberships would depend more on x values of SI than x values of Sun, indicating the stage affiliation judgment would more rely on the valid information rather than the uncertain one. Condition (6) explains this situation. When intersecting with any other fuzzy set, Sun does not work, so that the influence brought by the interference information would be eliminated, and the interference data could be reasonably fused to make a reliable stage affiliation judgment. It could be concluded that the smaller the number of interference data belonging to SI, the higher the integrated membership of SI, the more credible this group of data, and the more reliable the judgment on the processing stage affiliation being stage I. When x values belonging to Sun appear, the determination of the processing stage would be more dependent on valid x values belonging to SI than invalid x values pertaining to Sun. Consequently, the model could authentically reflect the appearance of imprecise and conflict data, fusing all the information reasonably and make a reasonable judgment on the processing stage affiliation for stage I. The reliability of the model in addressing different numbers of interference data is guaranteed.
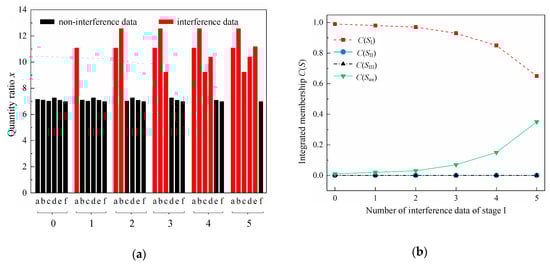
Figure 7.
Performance of the model fusing different numbers of interference data of Stage I: (a) Quantity ratios of Methanosaeta to Methanobacterium of Stage I with different numbers of interference data (For the x-coordinate, letters a to f represent the six paralleling data, numbers 0 to 5 represent the number of interference data.) (b) Integrated memberships of Stage I with different numbers of interference data. (Stage I stands for the state of sludge samples after treated by centrifugal thickening and pre-dewatering, Stage II stands for the state of sludge samples after treated by thermal hydrolysis, Stage III stands for the state of sludge samples after experiencing anaerobic digestion, and stage uncertain stands for the uncertainty of the processing stage affiliation of a sludge sample.)
The five groups of quantity ratios of Methanosaeta to Methanobacterium by introducing one to five interference data together with the non-interference quantity ratios for Stage II and III are shown in Figure 8a and Figure 9a, and the corresponding integrated memberships of the four fuzzy sets are exhibited in Figure 8b and Figure 9b. All the interfering x values belong to Sun. For Stage II, C(SII) descends, C(Sun) rises and C(SII) is the largest as the number of the interfering x increases, in consistent with the shifts of C(SI) and C(Sun) of Stage I. Owing to the initial value of C(Sun) obtained from the non-interference data group of Stage II being too small, the increase of C(Sun) does not appear such apparently, but is still in an order of magnitude of growth. The range of the fluctuation of C(SIII) is negligible, corresponding to that of Stage I. The apparent increase of C(SI) could be attributed to the relatively high initial value of C(SI), but is still below C(SII). For Stage III, C(SIII) declines, C(Sun) raises up and C(SIII) is the maximal as the number of interference data increases, which is the same with the trends of C(SI) and C(Sun) of Stage I. C(SII) and C(SI) are in a relatively small range of change around 0, the same shifts as C(SII) and C(SIII) of Stage I. For the data group with five interfering x values of Stage II or III, the integrated memberships generated are close to the normalized memberships obtained from the last non-interfering x value in this data group of Stage II or III, being 1.69 or 15.65. For Stage II and III, the results demonstrate that the more the data belonging either to SII or SIII, the more reliable the stage affiliation judgment could be made. The increasing number of interference data could only weaken the belief degree on the processing stage affiliation judgment, but could not change the stage affiliation being Stage II or III. It could be drawn the conclusion that a reliable judgment on the processing stage affiliation could be made for Stage II or III by the model when conflict and imprecise data exist. The more similar methanogen community structure between Stage I and II than that between Stage I and III, or Stage II and III could also be reflected by the model as C(SI) values change apparently. Analyzing the results of the three stages, it could come to conclusion that the bigger the number of data from one fuzzy set, in other words, supporting each other, the more credible this group of data, and the more reliable the judgment on the processing stage affiliation. When several interference x values of Sun appear, the determination tends to rely more on the x values belonging to fuzzy sets representing a valid stage among the three stages than that to Sun. In other words, the appearance of interfering x values could not change the affiliation of the processing stage of the tested paralleling sludge samples, but could increase the uncertainty of the judgment. In hence, the model could reflect the credibility of a group of measured data, and advisably deal with the interference data to determine the most probable processing stage where this data group come from and how likely are these data to belong to this stage. The reliability of the model in addressing data impreciseness and conflict are proved.
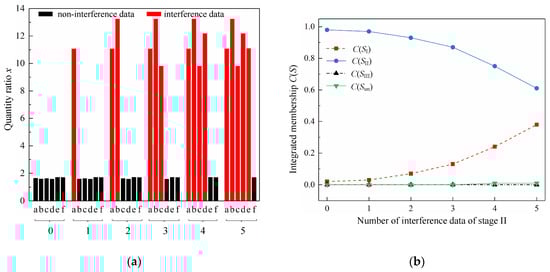
Figure 8.
Performance of the model fusing different numbers of interference data of Stage II: (a) Quantity ratios of Methanosaeta to Methanobacterium of Stage II with different numbers of interference data (For the x-coordinate, letters a to f represent the six paralleling data, numbers 0 to 5 represent the number of interference data.) (b) Integrated memberships of Stage II with different numbers of interference data. (Stage I stands for the state of sludge samples after treated by centrifugal thickening and pre-dewatering, Stage II stands for the state of sludge samples after treated by thermal hydrolysis, Stage III stands for the state of sludge samples after experiencing anaerobic digestion, and stage uncertain stands for the uncertainty of the processing stage affiliation of a sludge sample.)
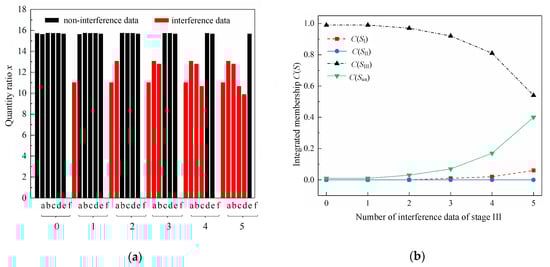
Figure 9.
Performance of the model fusing different numbers of interference data of Stage III: (a) Quantity ratios of Methanosaeta to Methanobacterium of Stage III with different numbers of interference data (For the x-coordinate, letters a to f represent the six paralleling data, numbers 0 to 5 represent the number of interference data.) (b) Integrated memberships of Stage III with different numbers of interference data. (Stage I stands for the state of sludge samples after treated by centrifugal thickening and pre-dewatering, Stage II stands for the state of sludge samples after treated by thermal hydrolysis, Stage III stands for the state of sludge samples after experiencing anaerobic digestion, and stage uncertain stands for the uncertainty of the processing stage affiliation of a sludge sample.)
5. Conclusions
The membership-fusing model is built in this paper to properly characterize the shift of methanogen community in the three-stage sludge-treatment process, and reasonably make judgment on the processing stage affiliation of a tested group of paralleling samples. First, the three-stage sludge-treatment process is abstracted, and the representative genera of methanogens are selected to quantify the methanogen community variation. Then, fuzzy sets and DS evidence theory is applied to clarify the stage affiliation of a sludge sample and address data error generated among paralleling data. Finally, the accuracy and reliability of the model are both proved.
The accuracy of the model is verified by a group of new data. The experiment shows that the membership-fusing model could properly reflect the vagueness of the methanogen community structure of one processing stage and its uniqueness among the three stages by analyzing the correctness of both values of quantity ratios of Methanosaeta to Methanobacterium and the maximal integrated memberships of each stage. The reliability of the model in dealing with imprecise and conflict data among paralleling data is proved by introducing different numbers of interference data to each stage. The experiment demonstrates that the model could make more reliable judgment on the processing stage affiliation when more data supporting each other exist. The model could also reflect the occurrence of interference data clearly, fuse the influence brought by these data reasonably and make a reliable judgment on the processing stage affiliation of a group of paralleling samples. In hence, an accurate and reliable information regarding the effect of the sludge treatment could be provided to workers in Beijing Gaobeidian Wastewater Treatment Plant by quantifying any group of the shift of methanogen community of examined paralleling sludge samples, which could facilitate them to control the sludge-treatment process and realize sludge reduction, stabilization, and harmlessness.
Author Contributions
Conceptualization, L.C.; methodology, L.C. and H.L.; software, L.C. and H.L.; validation, L.C.; formal analysis, L.C. and H.L.; investigation, L.C.; resources, H.Y.; data curation, L.C.; writing—original draft preparation, L.C.; writing—review and editing, H.Y.; visualization, L.C.; supervision, H.Y.; project administration, H.Y. All authors have read and agreed to the published version of the manuscript.
Funding
This research was funded by Beijing University Outstanding Young Scientist Program, grant number BJJWZYJH01201910004016, and National Natural Science Foundation of China, grant number 51908029.
Conflicts of Interest
The authors declare no conflict of interest.
References
- Yang, G.; Zhang, G.; Wang, H. Current state of sludge production, management, treatment, and disposal in China. Water Res. 2015, 78, 60–73. [Google Scholar] [CrossRef] [PubMed]
- Li, X.; Ma, H.; Wang, Q.; Matsumoto, S.; Maeda, T.; Ogawa, H.I. Isolation, identification of sludge-lysing strain and its utilization in thermophilic aerobic digestion for waste activated sludge. Bioresour. Technol. 2009, 100, 2475–2481. [Google Scholar] [CrossRef] [PubMed]
- Kadier, A.; Simayi, Y.; Abdeshahian, P.; Azman, N.F.; Chandrasekhar, K.; Kalil, M.S. A comprehensive review of microbial electrolysis cells (MEC) reactor designs and configurations for sustainable hydrogen gas production. Alex. Eng. J. 2016, 55, 427–443. [Google Scholar] [CrossRef]
- Batstone, D.J.; Virdis, B. The role of anaerobic digestion in the emerging energy economy. Curr. Opin. Biotechnol. 2014, 27, 142–149. [Google Scholar] [CrossRef] [PubMed]
- Shin, J.; Cho, S.-K.; Lee, J.; Hwang, K.; Chung, J.; Jang, H.-N.; Shin, S.G. Performance and Microbial Community Dynamics in Anaerobic Digestion of Waste Activated Sludge: Impact of Immigration. Energies 2019, 12, 573. [Google Scholar] [CrossRef]
- Kumar, A.; Samadder, S.R. Performance evaluation of anaerobic digestion technology for energy recovery from organic fraction of municipal solid waste: A review. Energy 2020, 197, 117253. [Google Scholar] [CrossRef]
- Tejerizo, G.T.; Kim, Y.S.; Maus, I.; Wibberg, D.; Winkler, A.; Off, S.; Pühler, A.; Scherer, P.; Schlüter, A. Genome sequence of Methanobacterium congolense strain Buetzberg, a hydrogenotrophic, methanogenic archaeon, isolated from a mesophilic industrial-scale biogas plant utilizing bio-waste. J. Biotechnol. 2017, 247, 1–5. [Google Scholar] [CrossRef]
- Conklin, A.S.; Stensel, H.D.; Ferguson, J.F. The Growth Kinetics and Competition Between Methanosarcina and Methanosaeta in Mesophilic Anaerobic Digestion. Proc. Water Environ. Fed. 2005, 100–121. [Google Scholar] [CrossRef]
- Aquino, S.F.; Stuckey, D.C. Integrated model of the production of soluble microbial products (SMP) and extracellular polymeric substances (EPS) in anaerobic chemostats during transient conditions. Biochem. Eng. J. 2008, 38, 138–146. [Google Scholar] [CrossRef]
- Wacławek, S.; Grübel, K.; Silvestri, D.; Padil, V.V.T.; Wacławek, M.; Černík, M.; Varma, R.S. Disintegration of Wastewater Activated Sludge (WAS) for Improved Biogas Production. Energies 2018, 12, 21. [Google Scholar] [CrossRef]
- Wrońska, I.; Cybulska, K. Quantity and Quality of Biogas Produced from the Poultry Sludge Optimized by Filamentous Fungi. Ecol. Chem. Eng. S 2018, 25, 395–404. [Google Scholar] [CrossRef]
- Grübel, K.; Machnicka, A.; Wacławek, S. Impact of Alkalization of Surplus Activated Sludge on Biogas Production. Ecol. Chem. Eng. S 2013, 20, 343–351. [Google Scholar] [CrossRef]
- Fernández-Polanco, D.; Tatsumi, H. Optimum energy integration of thermal hydrolysis through pinch analysis. Renew. Energy 2016, 96, 1093–1102. [Google Scholar] [CrossRef]
- Kepp, U.; Machenbach, I.; Weisz, N.; Solheim, O.E. Enhanced stabilisation of sewage sludge through thermal Hydrolysis—Three years of experience with full scale plant. Water Sci. Technol. 2000, 42, 89–96. [Google Scholar] [CrossRef]
- Fitamo, T.M.; Treu, L.; Boldrin, A.; Sartori, C.; Angelidaki, I.; Scheutz, C. Microbial population dynamics in urban organic waste anaerobic co-digestion with mixed sludge during a change in feedstock composition and different hydraulic retention times. Water Res. 2017, 118, 261–271. [Google Scholar] [CrossRef]
- Nguyen, Q.A.; Wickham, R.; Nguyen, L.N.; Phan, H.V.; Galway, B.; Bustamante, H.; Nghiem, L.; Nguyen, Q.A.; Bustamante, H. Impact of anaerobic co-digestion between sewage sludge and carbon-rich organic waste on microbial community resilience. Environ. Sci. Water Res. Technol. 2018, 4, 1956–1965. [Google Scholar] [CrossRef]
- Balch, W.E.; Fox, G.E.; Magrum, L.J.; Woese, C.R.; Wolfe, R.S. Methanogens: A re-evaluation of a unique biological group. Microbiol. Rev. 1979, 43, 260–296. [Google Scholar] [CrossRef]
- Demirel, B.; Scherer, P. The roles of acetotrophic and hydrogenotrophic methanogens during anaerobic conversion of biomass to methane: A review. Rev. Environ. Sci. Bio/Technol. 2008, 7, 173–190. [Google Scholar] [CrossRef]
- Banach-Wiśniewska, A.; Ciesielski, S.; Bacza, T.; Pieczykolan, M.; Ziembinska-Buczynska, A. Microbial community composition and methanogens’ biodiversity during a temperature shift in a methane fermentation chamber. Environ. Technol. 2018, 40, 3252–3263. [Google Scholar] [CrossRef]
- Russell, J.B.; Wilson, D.B. Why Are Ruminal Cellulolytic Bacteria Unable to Digest Cellulose at Low pH? J. Dairy Sci. 1996, 79, 1503–1509. [Google Scholar] [CrossRef]
- Romsaiyud, A.; Songkasiri, W.; Nopharatana, A.; Chaiprasert, P. Combination effect of pH and acetate on enzymatic cellulose hydrolysis. J. Environ. Sci. 2009, 21, 965–970. [Google Scholar] [CrossRef]
- Jiang, Y.; McAdam, E.; Zhang, Y.; Heaven, S.; Banks, C.; Longhurst, P. Ammonia inhibition and toxicity in anaerobic digestion: A critical review. J. Water Process. Eng. 2019, 32, 1–9. [Google Scholar] [CrossRef]
- Tang, T.T.; Li, J.; Yang, Z.; Luo, X.Y.; Chen, Y. Effect of straw on microbial community composition and degradation efficiency of polycyclic aromatic hydrocarbons in sludge digester. Int. J. Environ. Sci. Technol. 2019, 16, 7973–7986. [Google Scholar] [CrossRef]
- Koo, T.; Yulisa, A.; Hwang, S. Microbial community structure in full scale anaerobic mono-and co-digesters treating food waste and animal waste. Bioresour. Technol. 2019, 282, 439–446. [Google Scholar] [CrossRef]
- Zhang, W.; Chen, B.; Li, A.; Zhang, L.; Li, R.; Yang, T.; Xing, W. Mechanism of process imbalance of long-term anaerobic digestion of food waste and role of trace elements in maintaining anaerobic process stability. Bioresour. Technol. 2019, 275, 172–182. [Google Scholar] [CrossRef]
- Valo, A.; Carrere, H.; Delgenes, J.P. Thermal, chemical and thermo-chemical pre-treatment of waste activated sludge for anaerobic digestion. J. Chem. Technol. Biotechnol. 2004, 79, 1197–1203. [Google Scholar] [CrossRef]
- Graja, S.; Chauzy, J.; Fernandes, P.; Patria, L.; Cretenot, D. Reduction of sludge production from WWTP using thermal pretreatment and enhanced anaerobic methanisation. Water Sci. Technol. 2005, 52, 267–273. [Google Scholar] [CrossRef] [PubMed]
- Bougrier, C.; Delgenès, J.P.; Carrere, H. Combination of Thermal Treatments and Anaerobic Digestion to Reduce Sewage Sludge Quantity and Improve Biogas Yield. Process. Saf. Environ. Prot. 2006, 84, 280–284. [Google Scholar] [CrossRef]
- Fdz-Polanco, M.; Velazquez, R.; Pérez-Elvira, S.I.; Casas, C.; del Barrio, D.; Cantero, F.J.; Rodríguez, P.; Panizo, L.; Serrat, J.; Rouge, P.; et al. Continuous thermal hydrolysis and energy integration in sludge anaerobic digestion plants. Water Sci. Technol. 2008, 57, 1221–1226. [Google Scholar] [CrossRef]
- Barber, W.P.F. Thermal hydrolysis for sewage treatment: A critical review. Water Res. 2016, 104, 53–71. [Google Scholar] [CrossRef]
- Westerholm, M.; Castillo, M.; Andersson, A.C.; Nilsen, P.J.; Schnürer, A. Effects of thermal hydrolytic pre-treatment on biogas process efficiency and microbial community structure in industrial- and laboratory-scale digesters. Waste Manag. 2019, 95, 150–160. [Google Scholar] [CrossRef] [PubMed]
- Zadeh, L. Fuzzy sets. Inf. Control. 1965, 8, 338–353. [Google Scholar] [CrossRef]
- Dimas, G.; Diamantis, D.E.; Kalozoumis, P.; Iakovidis, D. Uncertainty-Aware Visual Perception System for Outdoor Navigation of the Visually Challenged. Sensors 2020, 20, 2385. [Google Scholar] [CrossRef] [PubMed]
- Luo, D.; Wang, Y.; Zhang, S.; Niu, D. Application of Fuzzy and Rough Sets to Environmental Zonation for Concrete Durability: A Case Study of Shaanxi Province, China. Sustainability 2020, 12, 3128. [Google Scholar] [CrossRef]
- Fei, L.; Deng, Y.; Hu, Y. DS-VIKOR: A new multi-criteria decision-making method for supplier selection. Int. J. Fuzzy Syst. 2018, 21, 157–175. [Google Scholar] [CrossRef]
- Deng, Z.; Wang, J. A Novel Evidence Conflict Measurement for Multi-Sensor Data Fusion Based on the Evidence Distance and Evidence Angle. Sensors 2020, 20, 381. [Google Scholar] [CrossRef]
- Li, Z.; Wachemo, A.C.; Yuan, H.; Korai, R.M.; Li, X. Improving methane content and yield from rice straw by adding extra hydrogen into a two-stage anaerobic digestion system. Int. J. Hydrogen Energy 2020, 45, 3739–3749. [Google Scholar] [CrossRef]
- Kumdhitiahutsawakul, L.; Jirachaisakdeacha, D.; Pholchan, P.; Pathom-aree, W.; Bovonsombut, S. Use of the PCR-DGGE technique to determine the microbial community in anaerobic activated sludges from biogas plants. Chiang Mai J. Sci. 2019, 46, 444–455. [Google Scholar]
- Mccarty, P.L.; Smith, D.P. Anaerobic wastewater treatment. Environ. Sci. Technol. 1986, 20, 1200–1206. [Google Scholar] [CrossRef]
- D’Agostino, R. Holographic dark energy from nonadditive entropy: Cosmological perturbations and observational constraints. Phys. Rev. D 2019, 99, 103524. [Google Scholar] [CrossRef]
- Prasad, M.; Snyderman, N.; Verbeke, J. Analytical error bars and RSD for neutron multiplicity counting. Nucl. Instrum. Meth. A 2018, 903, 25–31. [Google Scholar] [CrossRef]
- Titkanloo, H.N.; Keramati, A.; Fekri, R. Proposing a new model to aggregate ratings in multi-source feedback approach based on the evidence theory. Soft Comput. 2019, 24, 9479–9494. [Google Scholar] [CrossRef]
- Luton, P.E.; Wayne, J.M.; Sharp, R.J.; Riley, P.W. The mcrA gene as an alternative to 16S rRNA in the phylogenetic analysis of methanogen populations in landfill b bThe GenBank accession numbers for the mcrA sequences reported in this paper are AF414034–AF414051 (see Figure 2) and AF414007–AF414033 (environmental isolates in Figure 3). Microbiology 2002, 148, 3521–3530. [Google Scholar] [CrossRef] [PubMed]
- Yang, S.; Liebner, S.; Alawi, M.; Ebenhöh, O.; Wagner, D. Taxonomic database, and cut-off value for processing mcrA gene 454 pyrosequencing data by MOTHUR. J. Microbiol. Methods 2014, 103, 3–5. [Google Scholar] [CrossRef] [PubMed]
- Cai, W.; Liu, W.; Zhang, Z.; Feng, K.; Ren, G.; Pu, C.; Sun, H.; Li, J.; Deng, Y.; Wang, A. mcrA sequencing reveals the role of basophilic methanogens in a cathodic methanogenic community. Water Res. 2018, 136, 192–199. [Google Scholar] [CrossRef] [PubMed]
- Mihajlovski, A.; Alric, M.; Brugère, J.-F. A putative new order of methanogenic Archaea inhabiting the human gut, as revealed by molecular analyses of the mcrA gene. Res. Microbiol. 2008, 159, 516–521. [Google Scholar] [CrossRef] [PubMed]


© 2020 by the authors. Licensee MDPI, Basel, Switzerland. This article is an open access article distributed under the terms and conditions of the Creative Commons Attribution (CC BY) license (http://creativecommons.org/licenses/by/4.0/).