3.1. Composite Properties
The value of
of the composite was 36.8 MPa; the coefficient of variation of
was 4.5%. The value of
of the composite is lower than that of the previous study, which had an identical water-to-binder ratio [
8]. This is attributed to the fact that the chemical compositions of the slag used in this study are different from those of previous study and the fiber volume fraction (1.50%) in this study is lower than that (1.75%) of the previous study.
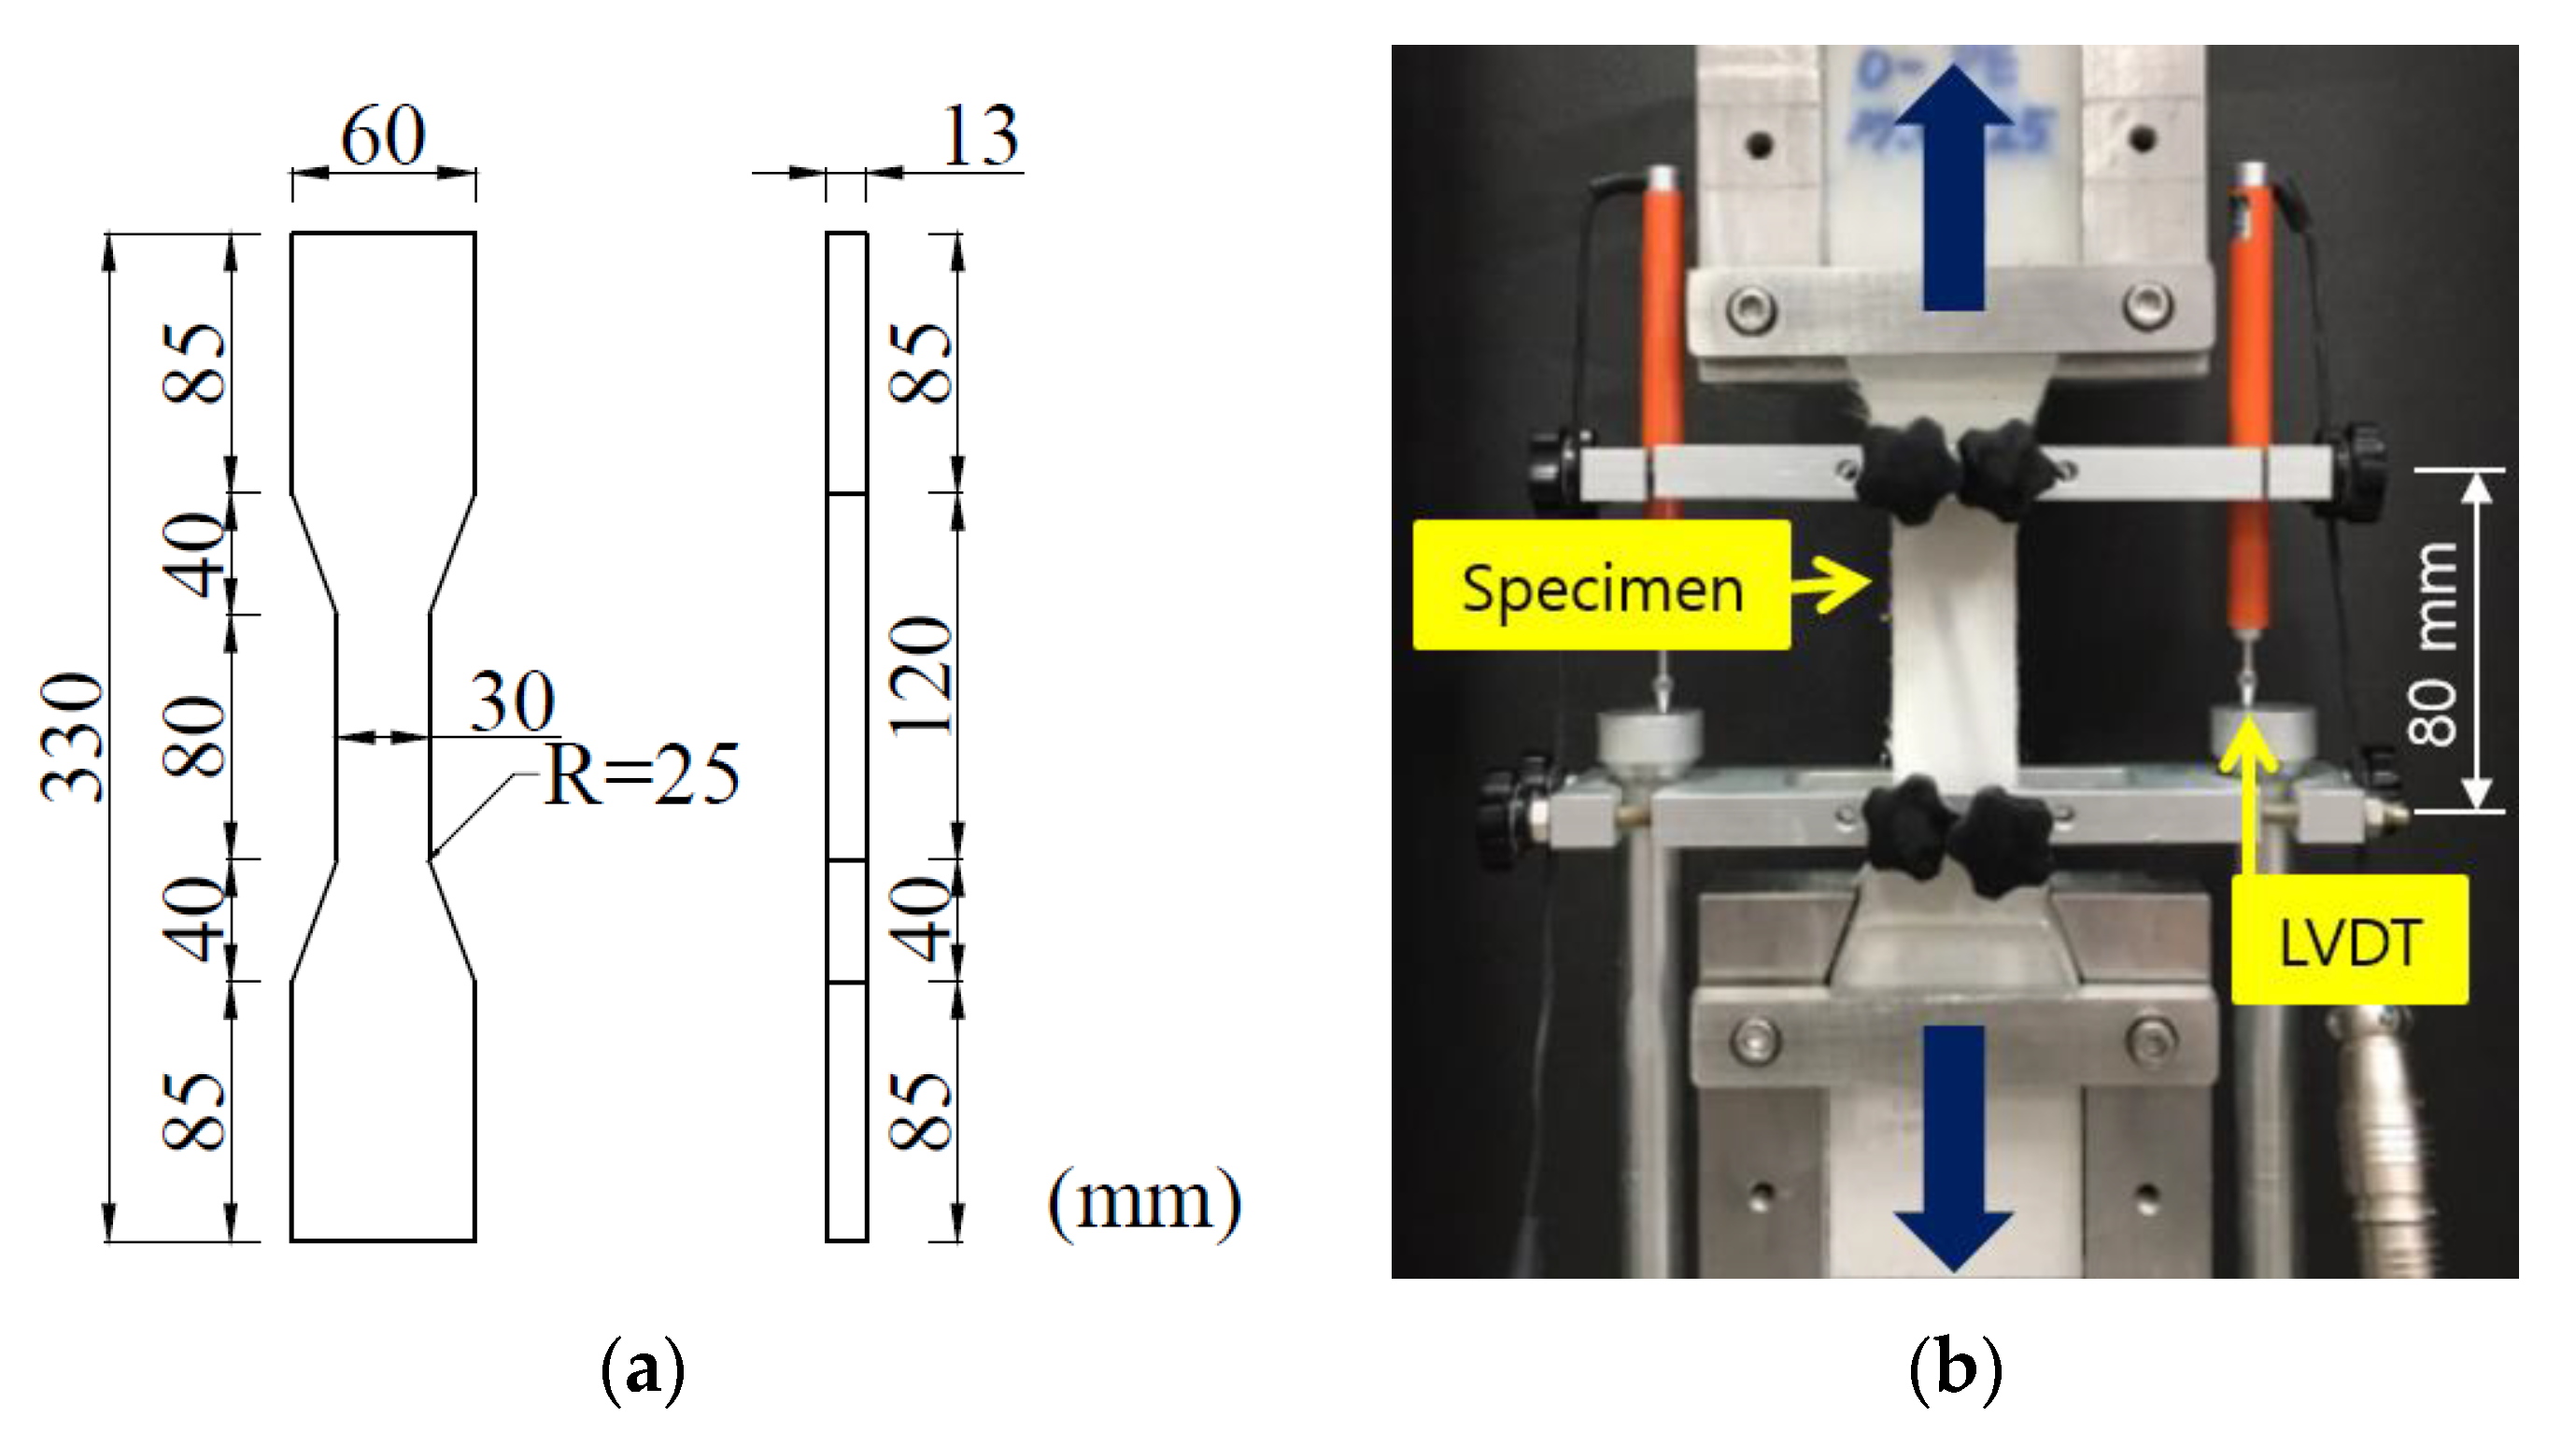
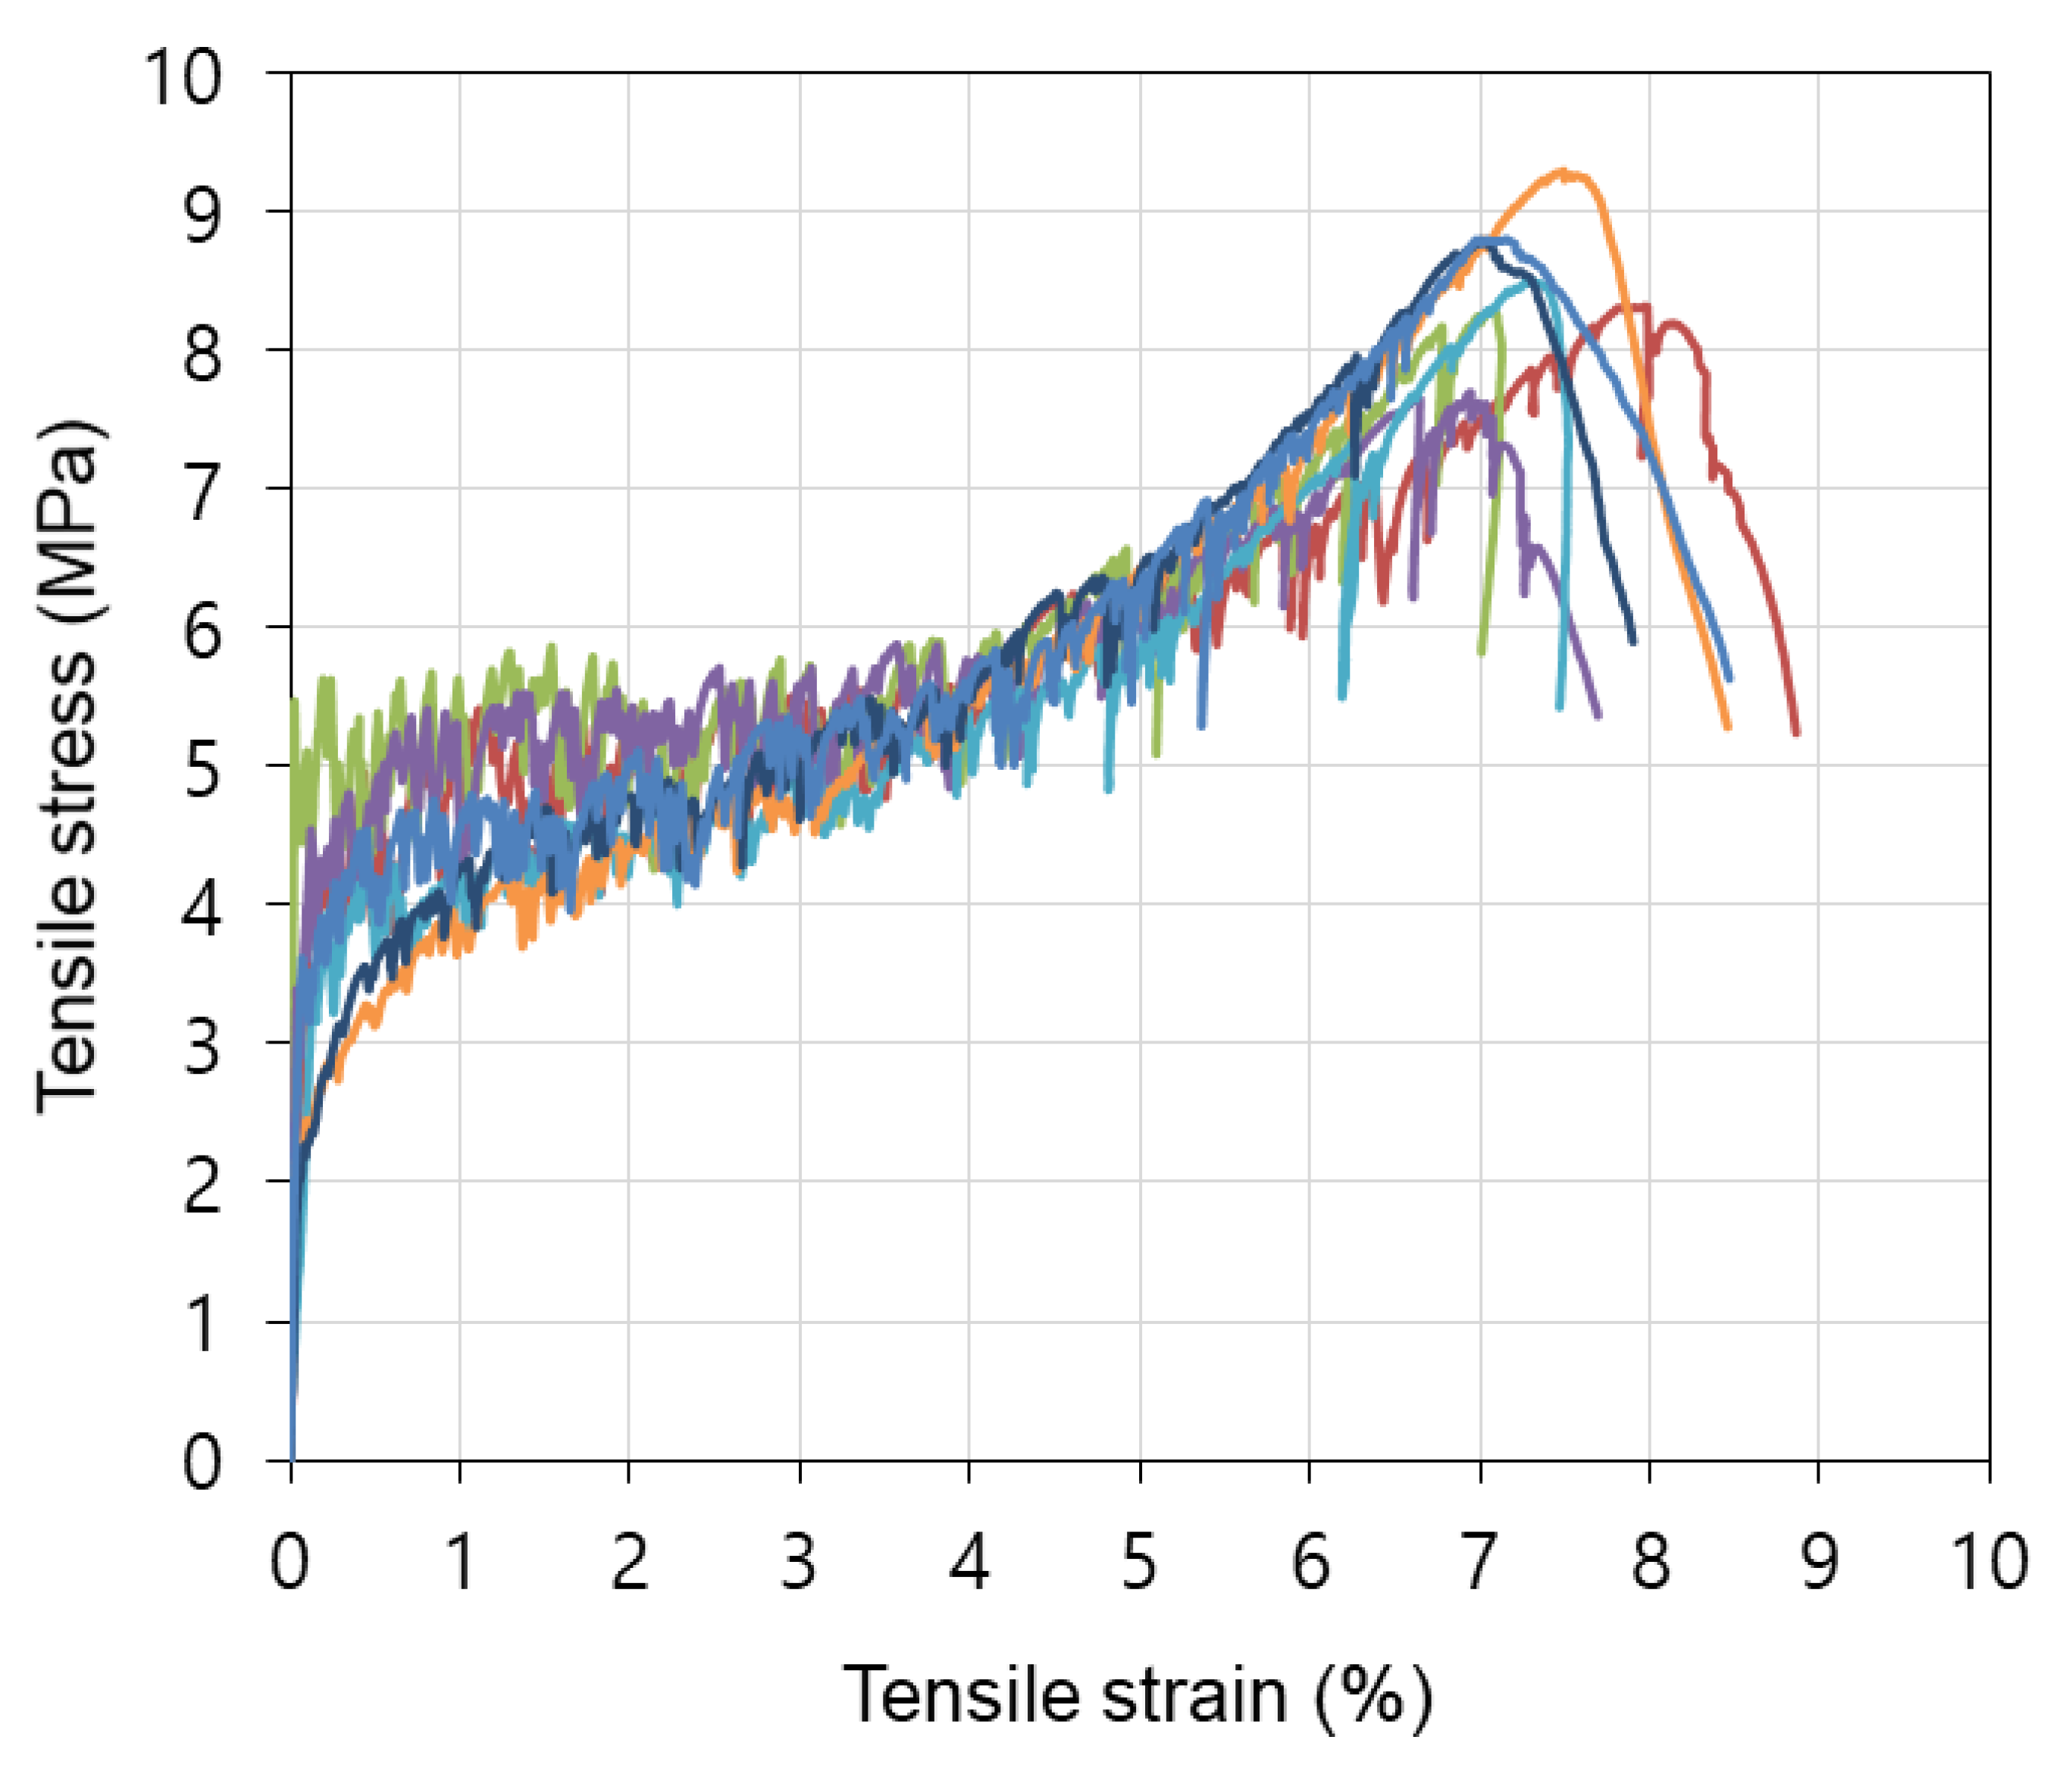
The tensile stress and tensile strain curves of the composite are shown in
Figure 4. Strain-hardening behavior, a further increase in stress and strain after first cracking, was clearly observed in all specimens. Because the stresses of the matrix and of existing cracks are released when a new crack occurs, the stress after first cracking fluctuated until it reached maximum stress. The compressive strength and representative values of tensile behavior, i.e., the first cracking strength (
), tensile strength (
), and tensile ductility of the composite, are listed in
Table 3. Note that the first cracking strength implied a proportional limit, i.e., a maximum stress of the mixture that is directly proportional to strain.
The value of
of the composite was 3.4 MPa and the ratio of
to
was 9.3%, similar to that of normal concrete [
19]. This demonstrates that the value of
of this composite was affected by the strength of the matrix and that the effect of fiber on
is not significant. It should be noted that the coefficient of variation of
was 27.5%p higher than that of
.
The value of
of the composite was 8.5 MPa, and the ratio of
to
was 23%. This ratio is 2.3 times higher than that of normal concrete, whose
is approximately 10% of
; also, normally, the value of
of normal concrete is identical to
. This indicates that the value of
of the composite depends on the fiber-bridging behavior.
refers to the ratio of
to
. When the index is greater than 1, multi-cracking occurs. The value of
of the composite was 2.5, which means that the composite satisfied the stress condition for strain-hardening and steady-state multiple cracking behavior and is approximately two times higher than the value (=1.3) in the practical design criterion proposed by Kanda and Li [
11]. From this analysis, it can be expected that the composite will show high tensile ductility based on multiple cracking.
The tensile ductility was defined as the tensile strain corresponding to the tensile strength. The tensile ductility of the composite was 7.5%, which is approximately seven hundred times higher than that of normal concrete. The high tensile ductility of the composite is due to multiple micro-cracking and controlled crack width. It should be noted that the values of the coefficient of variation of and the tensile ductility were similar to that of .
Toughness represents the comprehensive energy absorption capacity of a composite, encompassing
and the tensile ductility. Toughness was calculated using the tensile strength and the area that represents the tensile ductility. The toughness of the composite was 0.44 MPa m/m, 16% higher than that of UHPC, with a compressive strength of 166 MPa [
20].
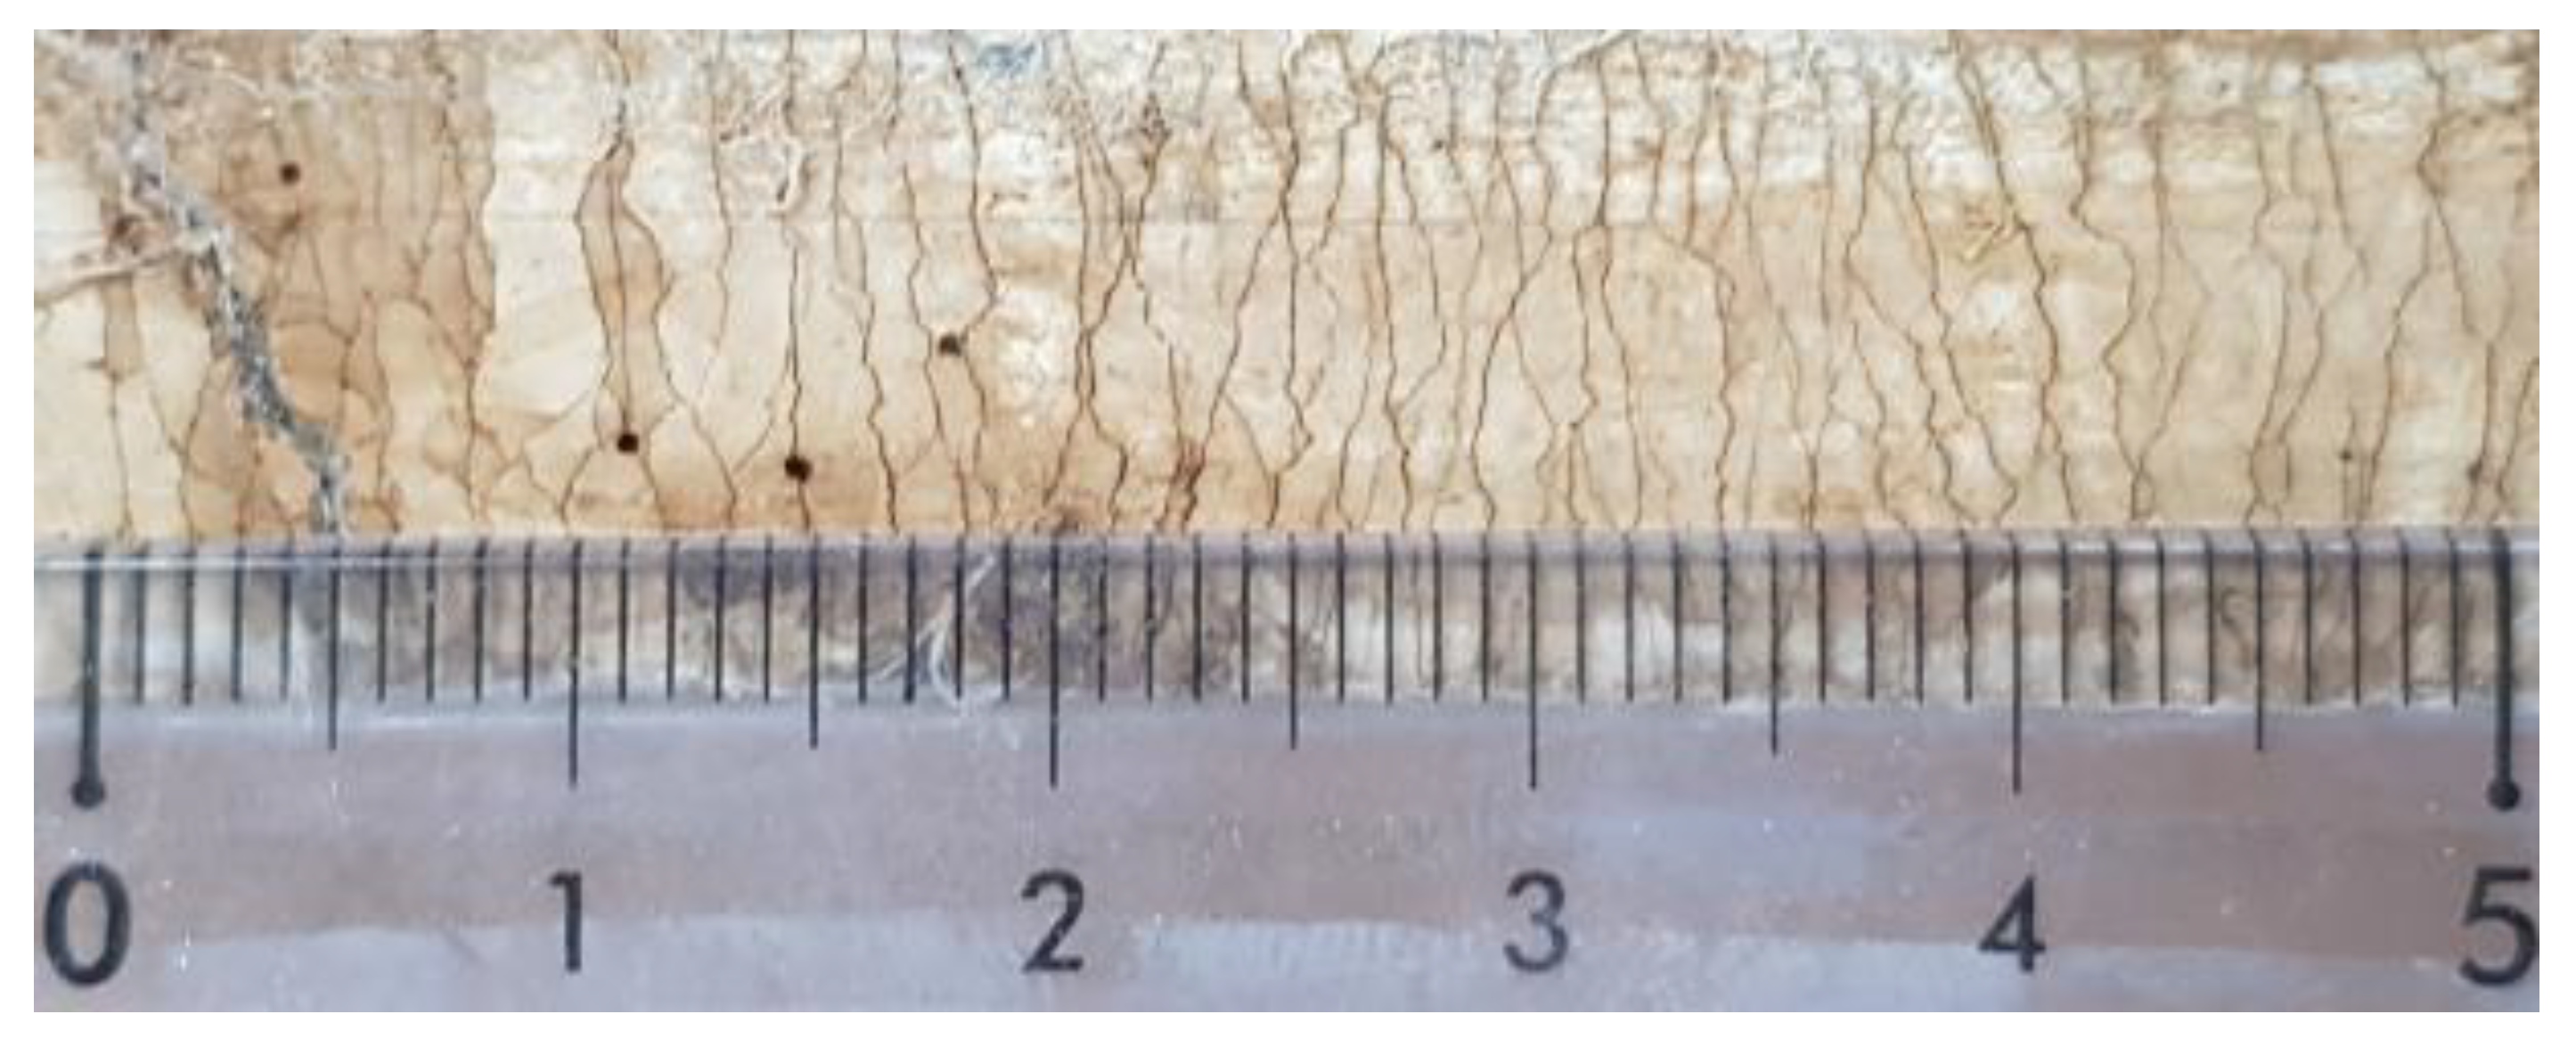
Figure 5 shows the representative cracking pattern of the composite. As expected from the tensile stress and strain curves, the composite showed saturated multiple cracks and controlled crack width. It can be assumed that tensile deformation of the composite was mainly induced by crack creating and growth, which are related to the fiber reinforcement, rather than by the deformation of the matrix itself. That deformation is negligibly small compared to the crack width. Accordingly, the tensile ductility of the composite is determined by the number and width of the cracks. The number of the cracks (
), the crack spacing (
), and the crack width (
) of the composite are observed using a magnifying glass and are listed in
Table 4. The average
within the gauge length was found to be 100, and
was 0.8 mm.
was calculated by dividing the gauge length by
. Therefore,
is inversely proportional to
.
was measured and found to be 59.8 μm. A previous study reported that a value of
of about 60 μm did not lead to a change in the water permeability of the composite [
21].
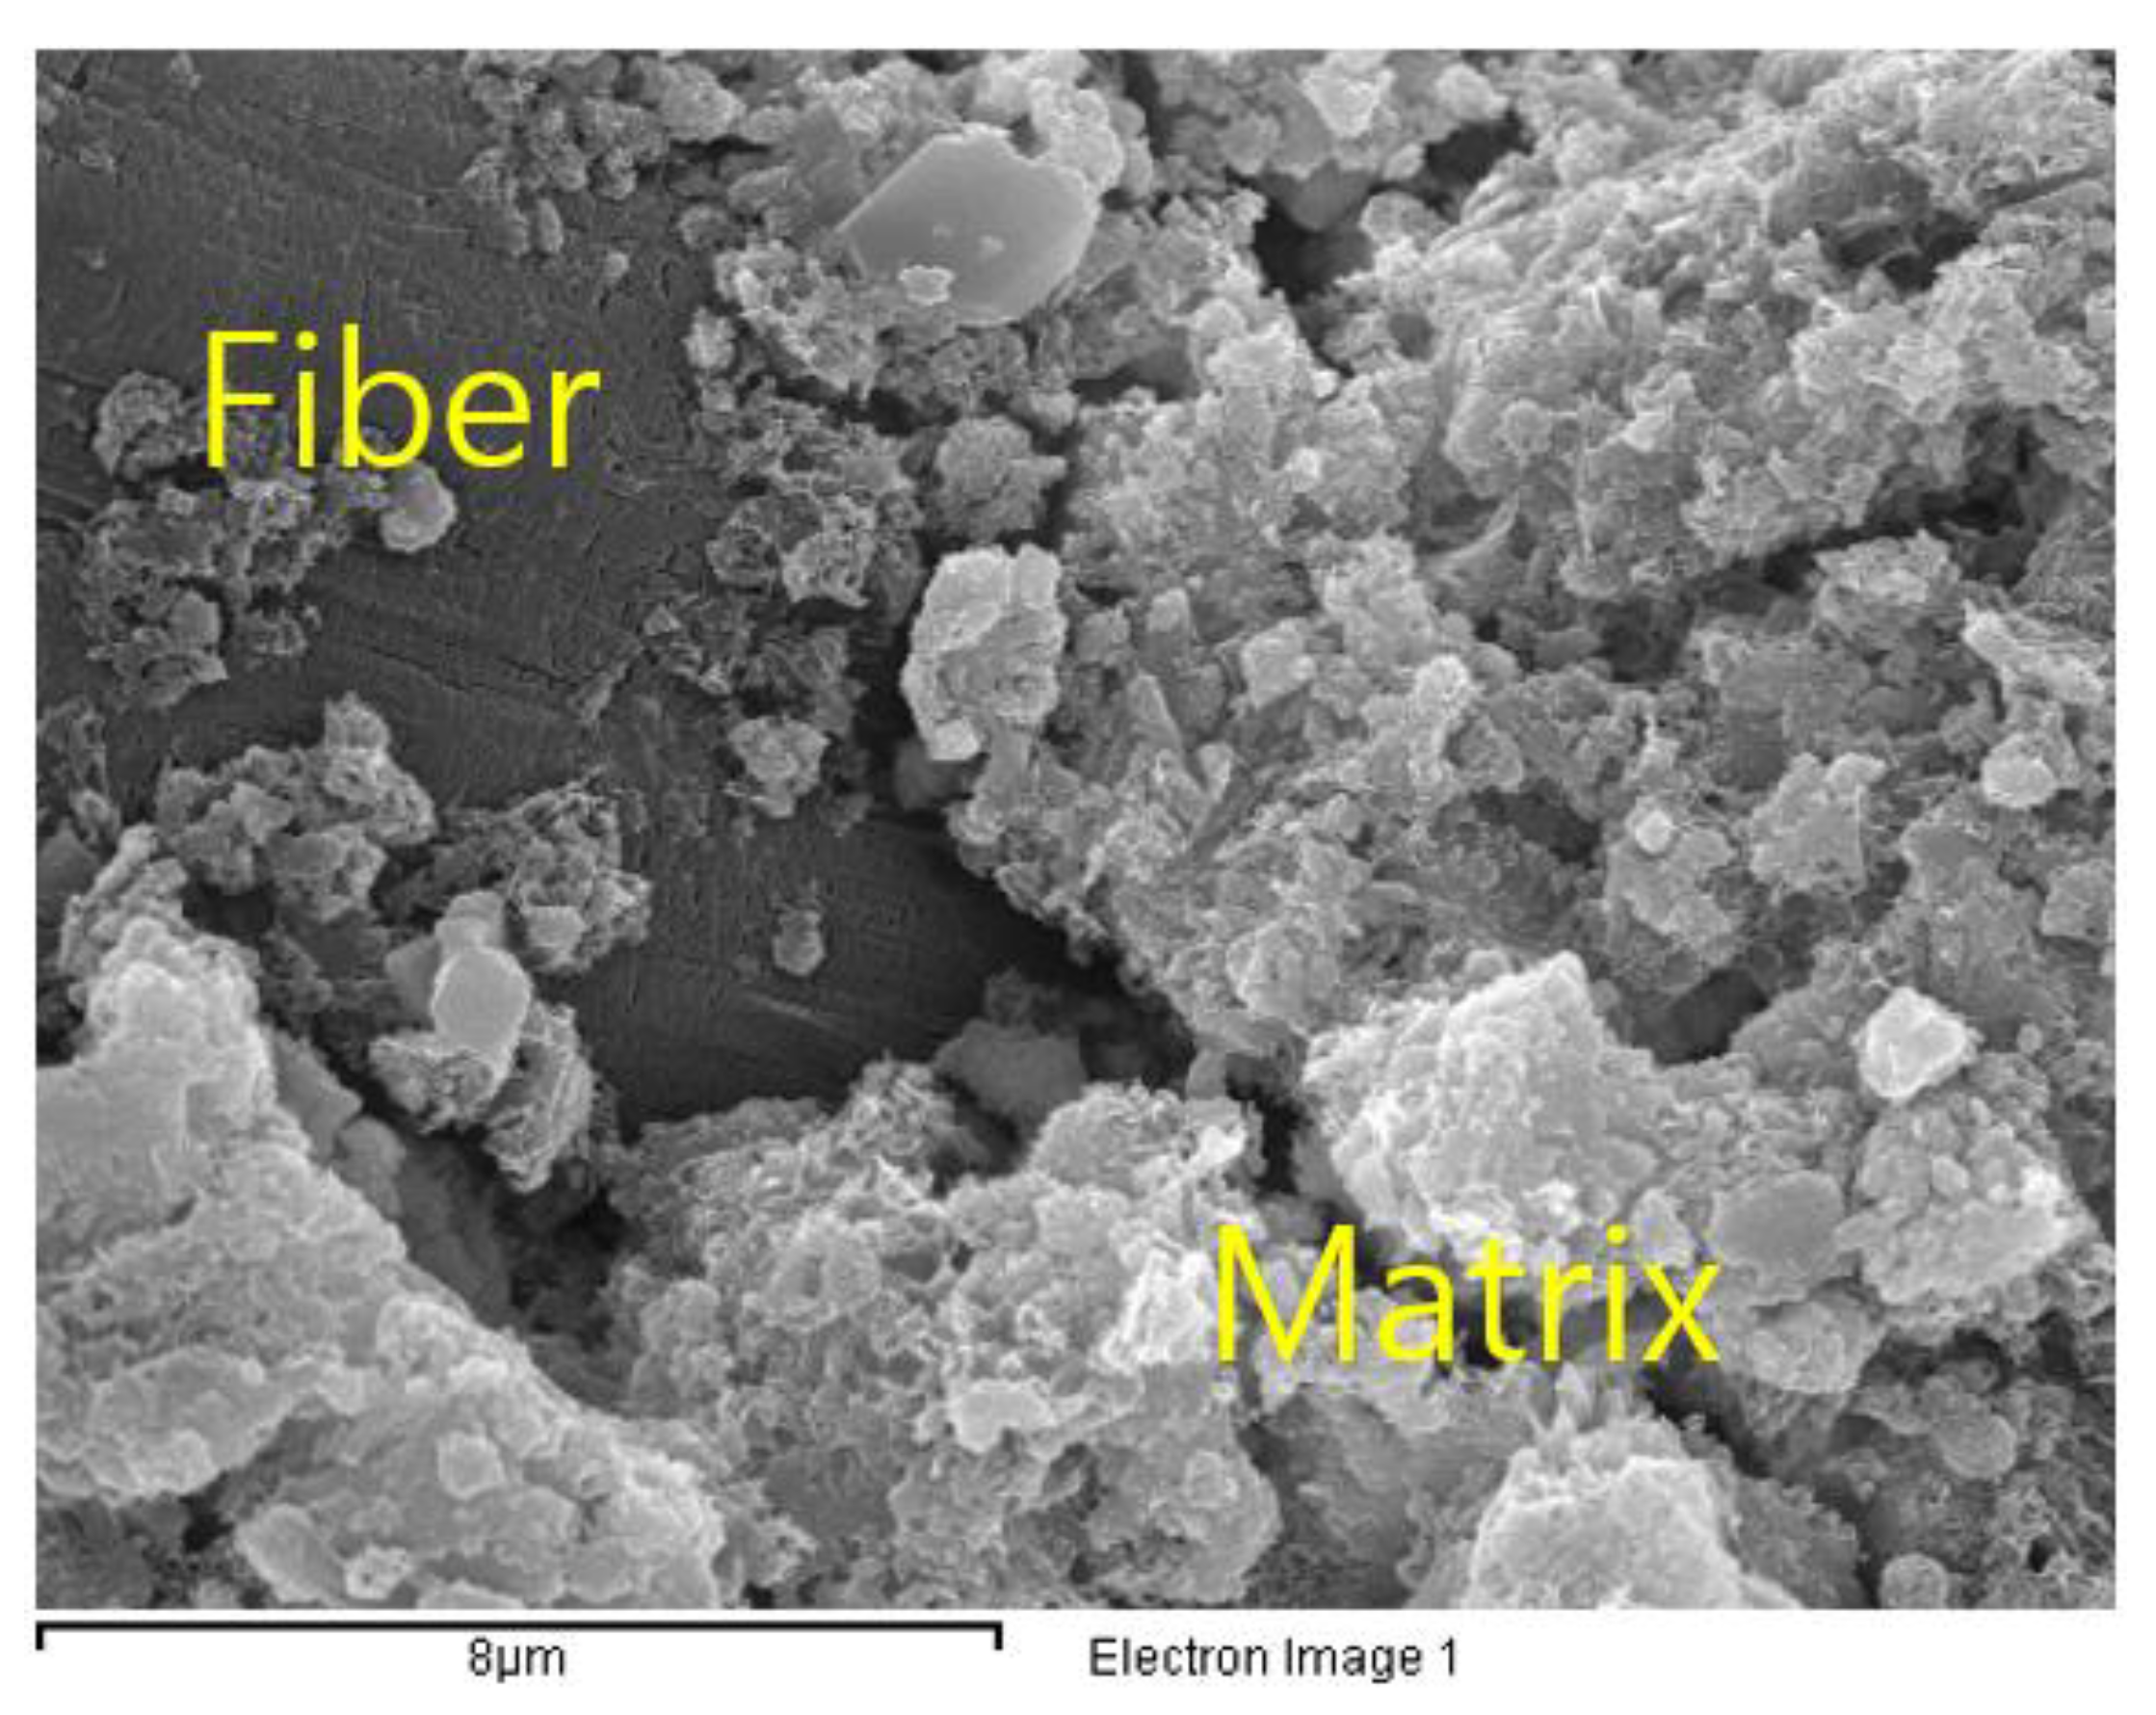
Figure 6 shows SEM images of the composite. The boundary between matrix and fiber can be clearly observed and it seems that the hydration products close to fiber are similar to pure matrix without large defects, which helps to increase the bond strength between matrix and fiber.
3.2. Micromechanical Properties
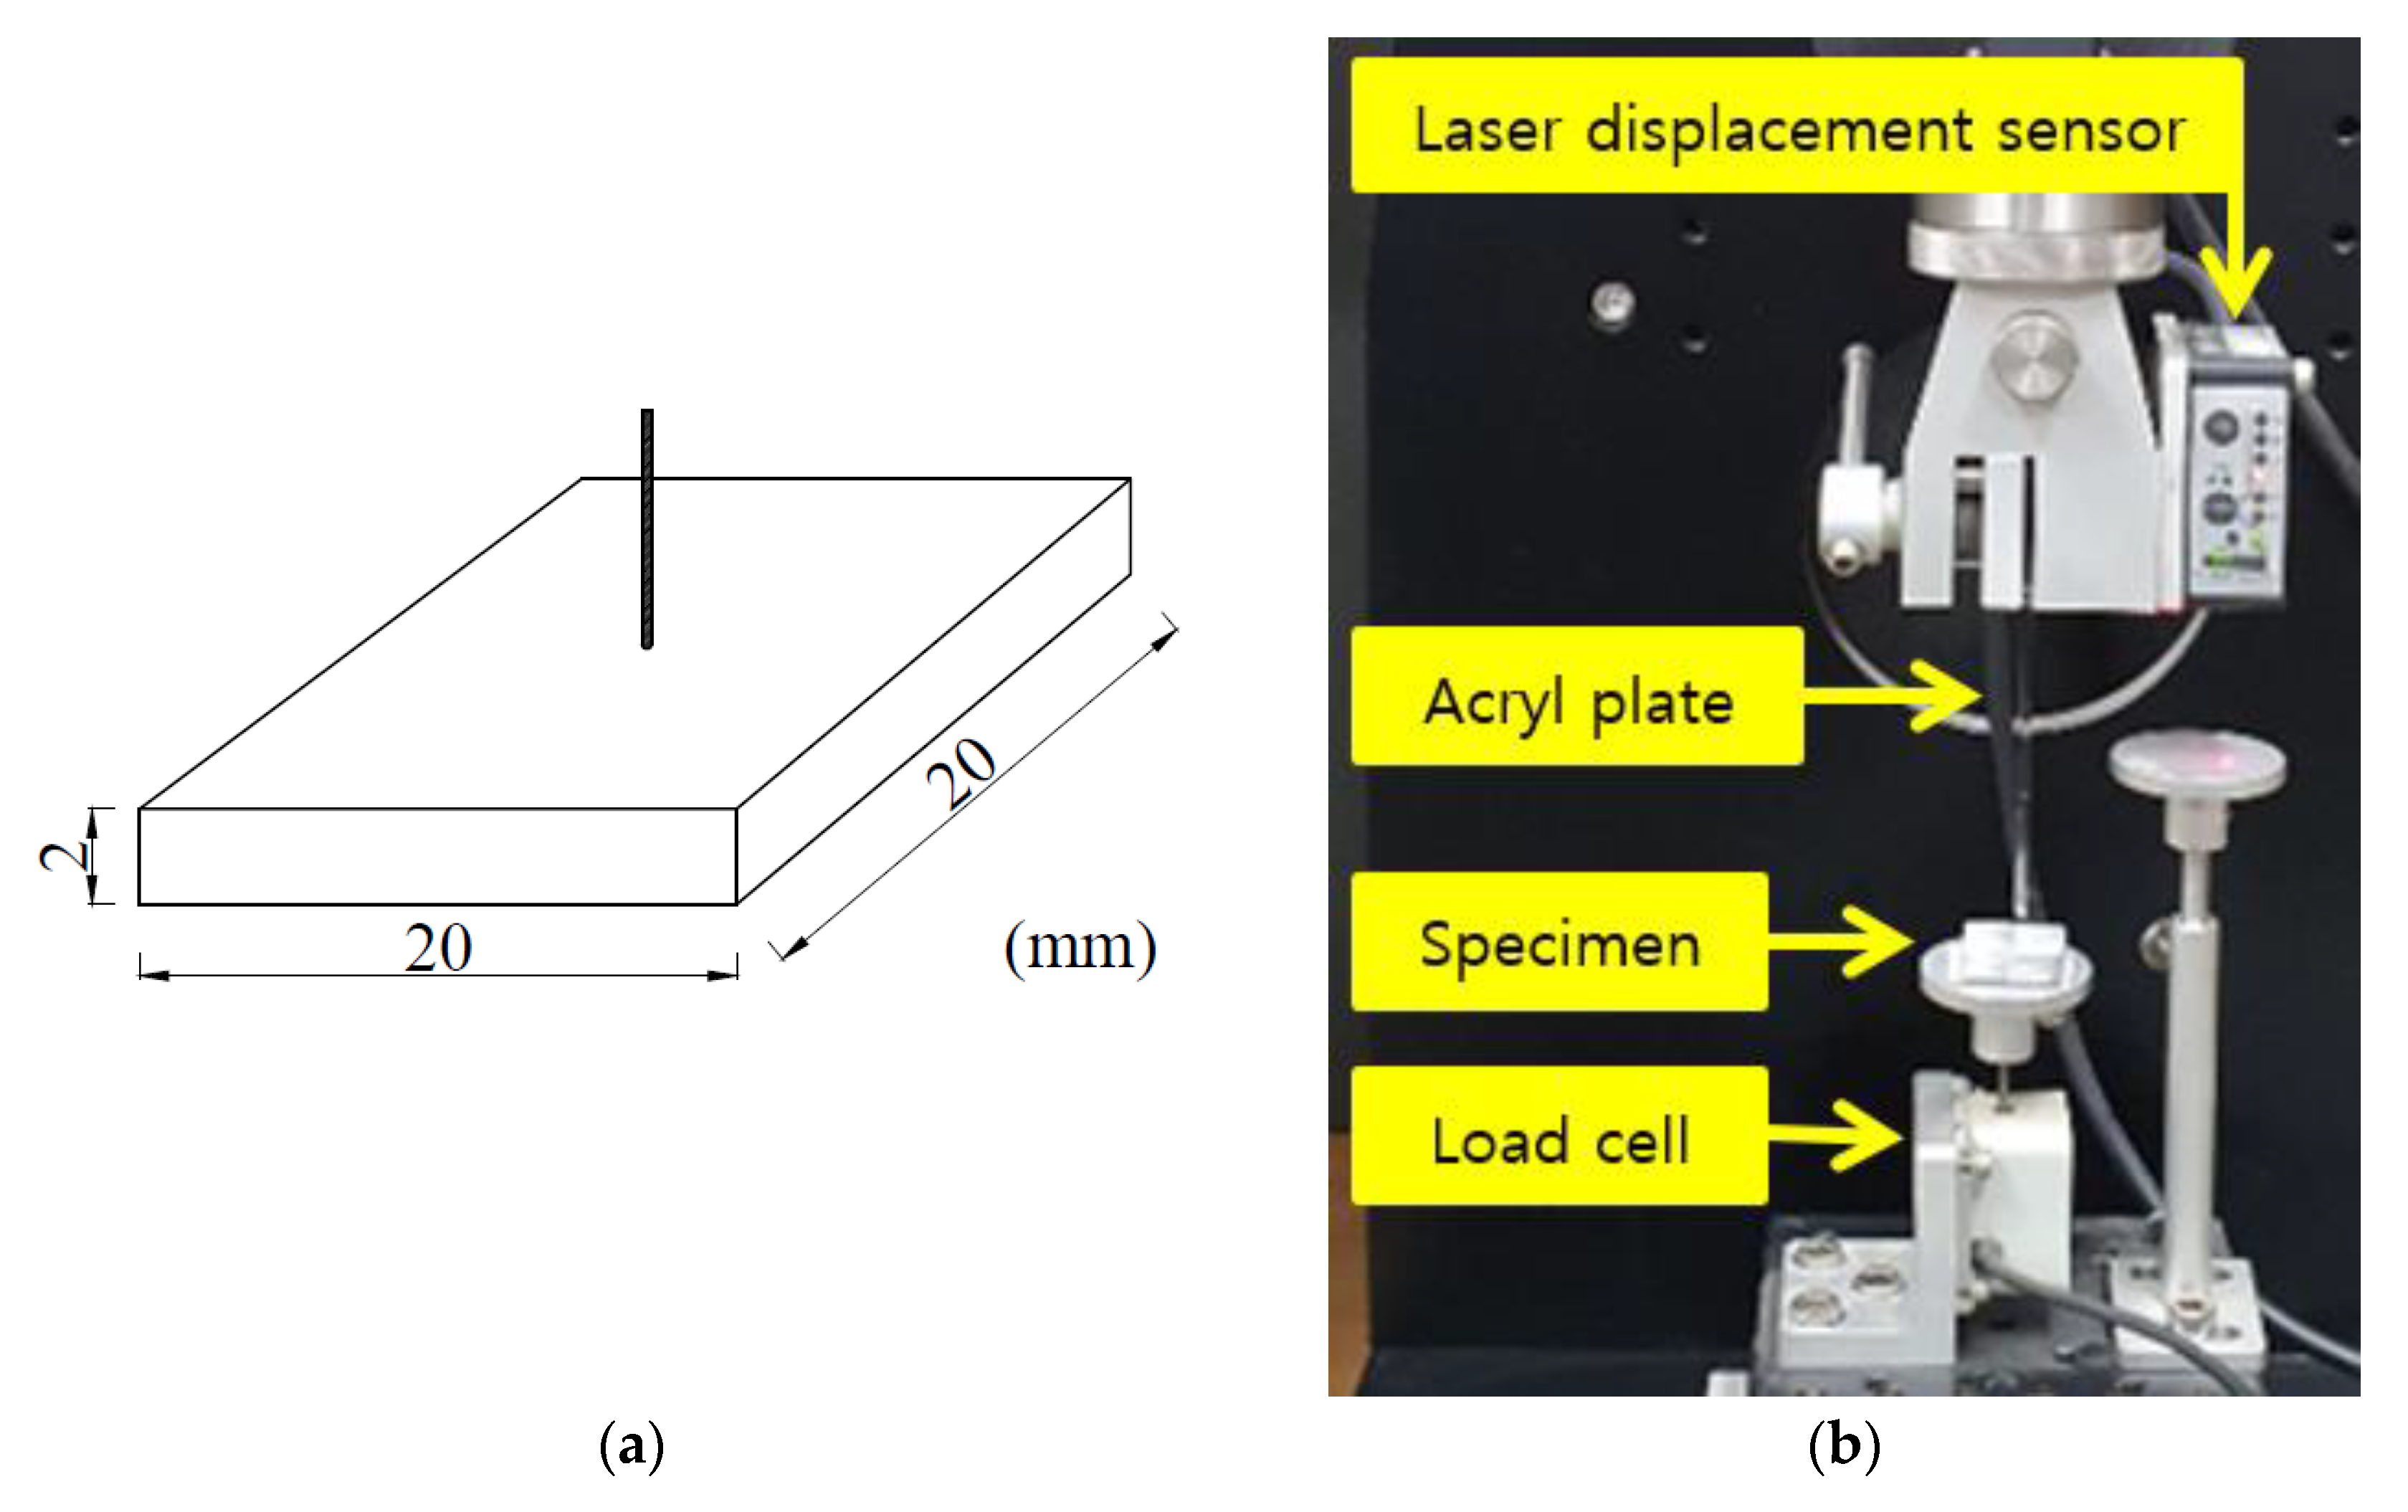
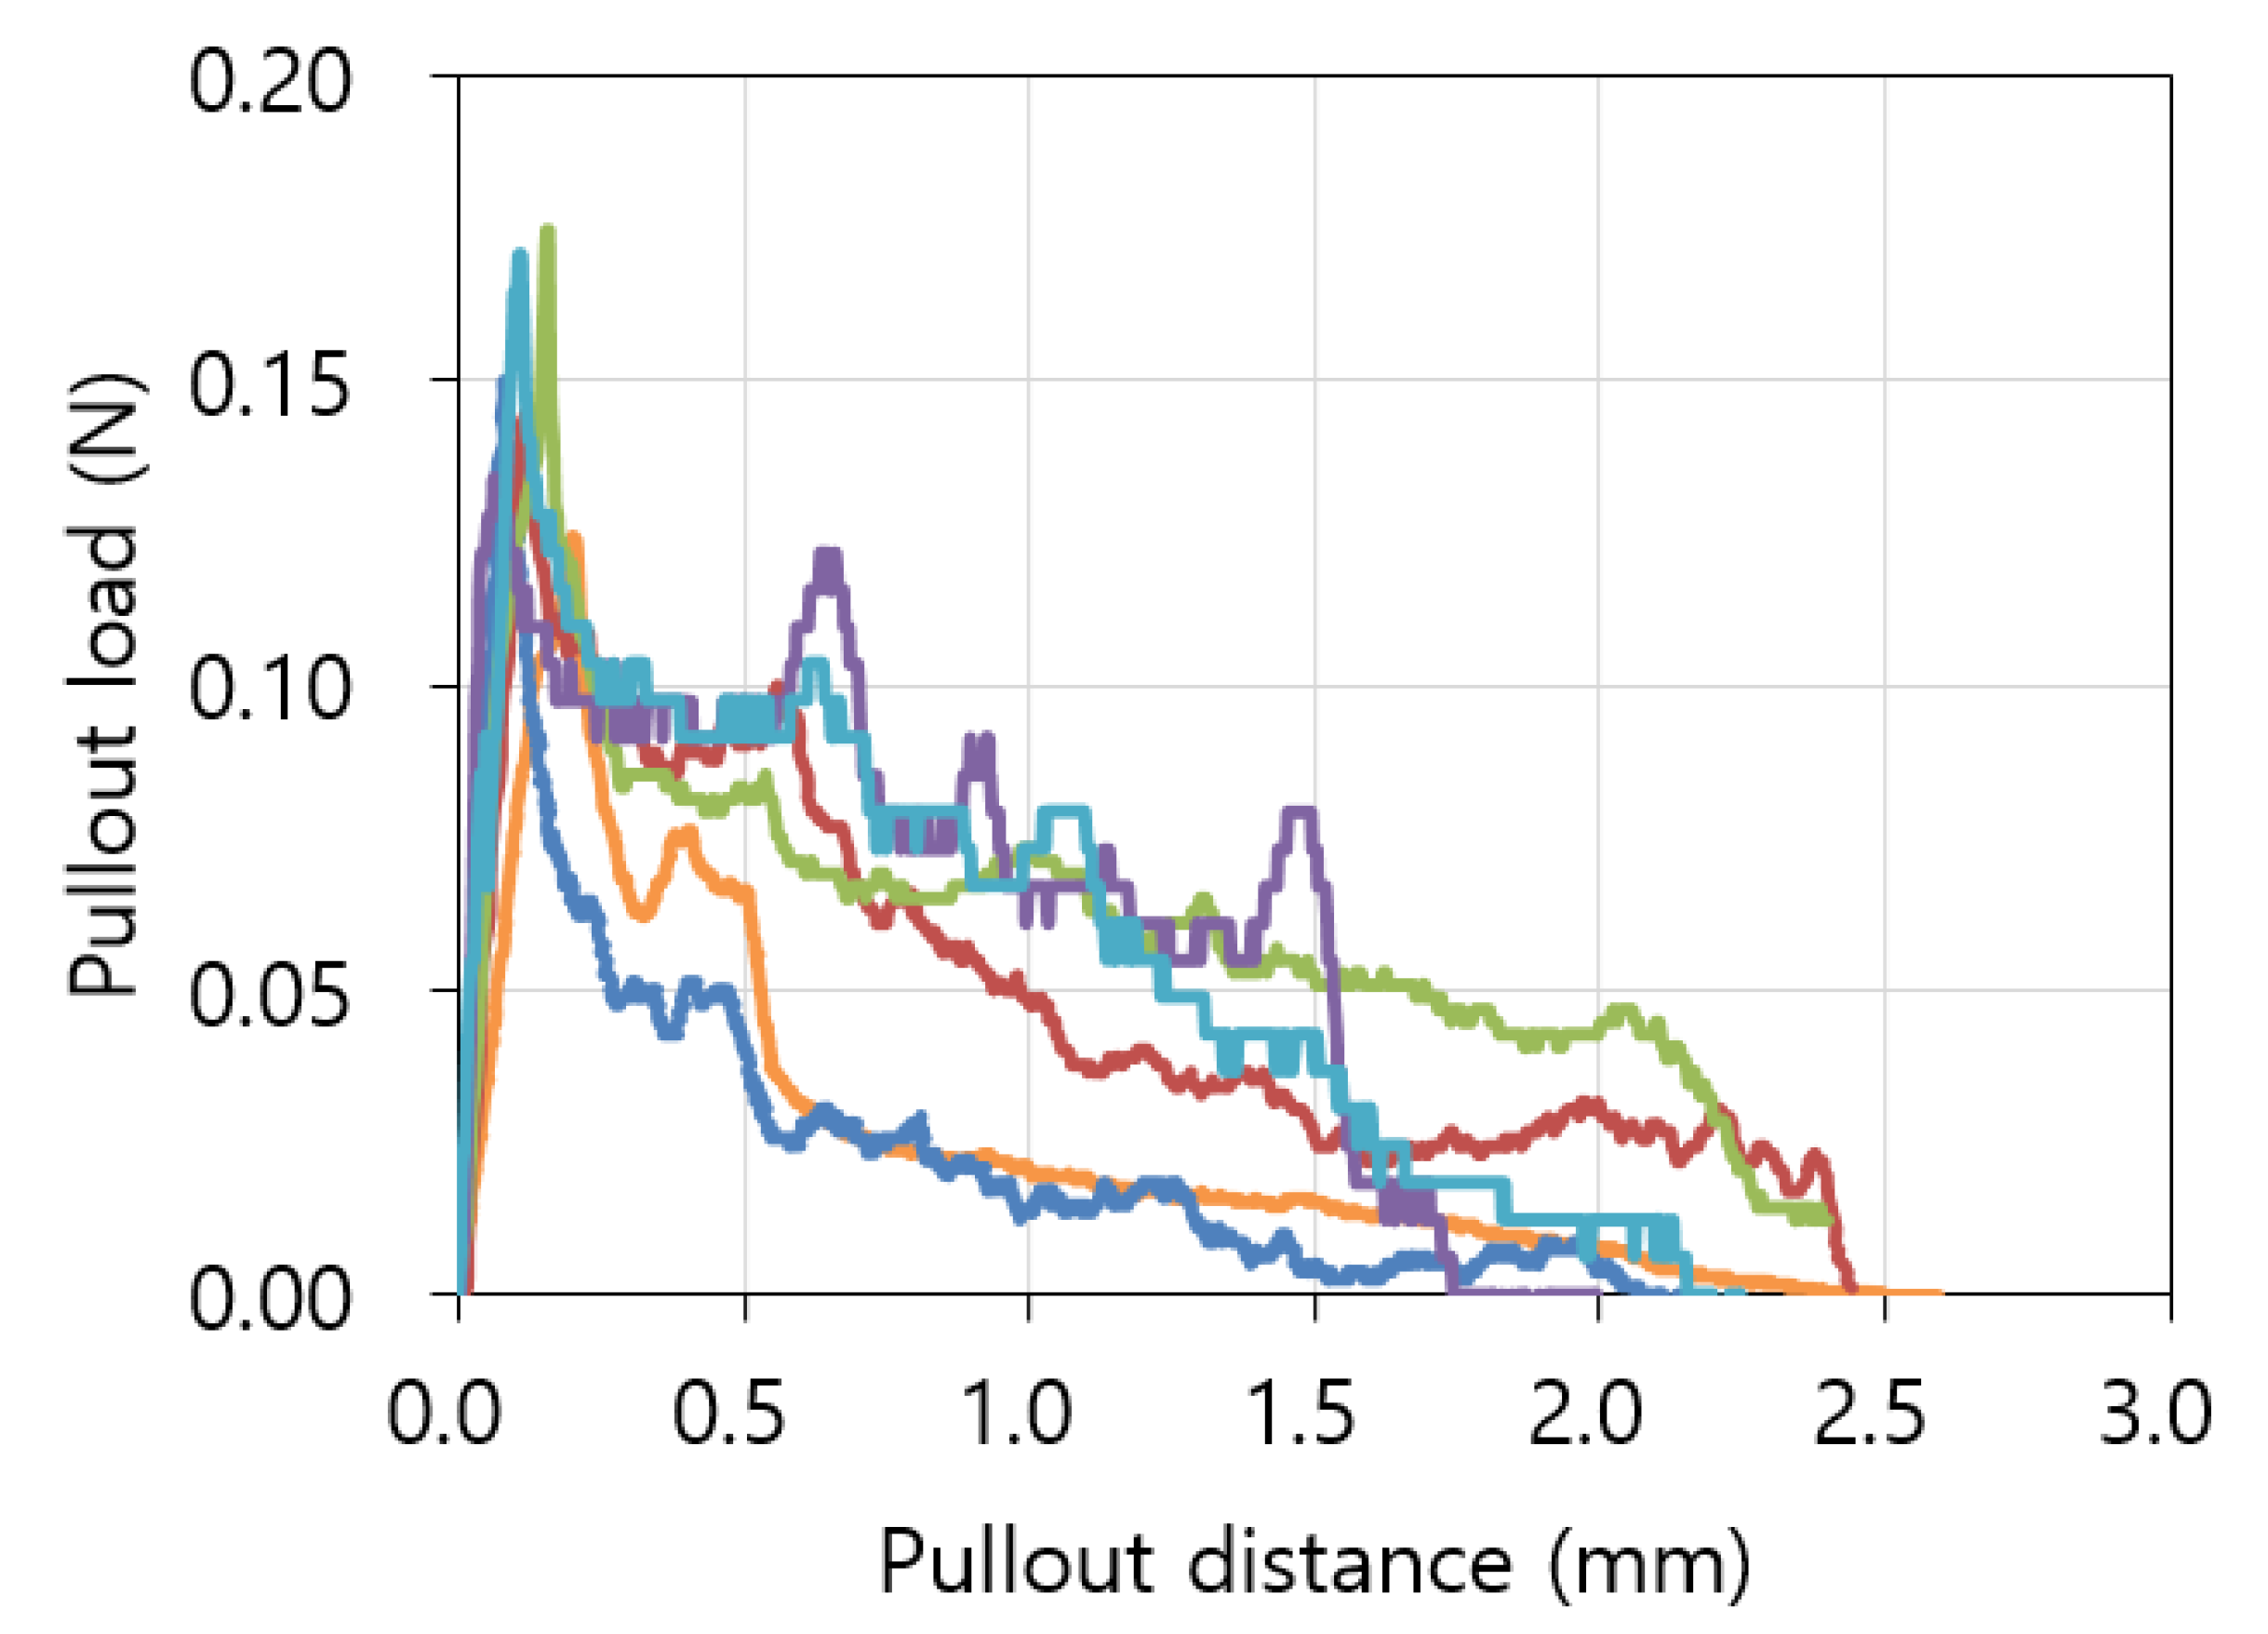
Single fiber pullout load and pullout distance curves of specimens for micromechanical analysis are shown in
Figure 7. Single fiber pull-out test results showed that there were two stages. In the initial stage, the load increased with a constant slope until the maximum load was reached; in the next stage, the load gradually decreased. As mentioned above, the proportional (linear) increase in load (in the first stage) was attributable to elongation of the fibers according to their elastic modulus. Meanwhile, the load decreased after exceeding the maximum value because the fibers started to be pulled out. Load drops were observed in all specimens directly after load peak and gradual drops were observed after that.
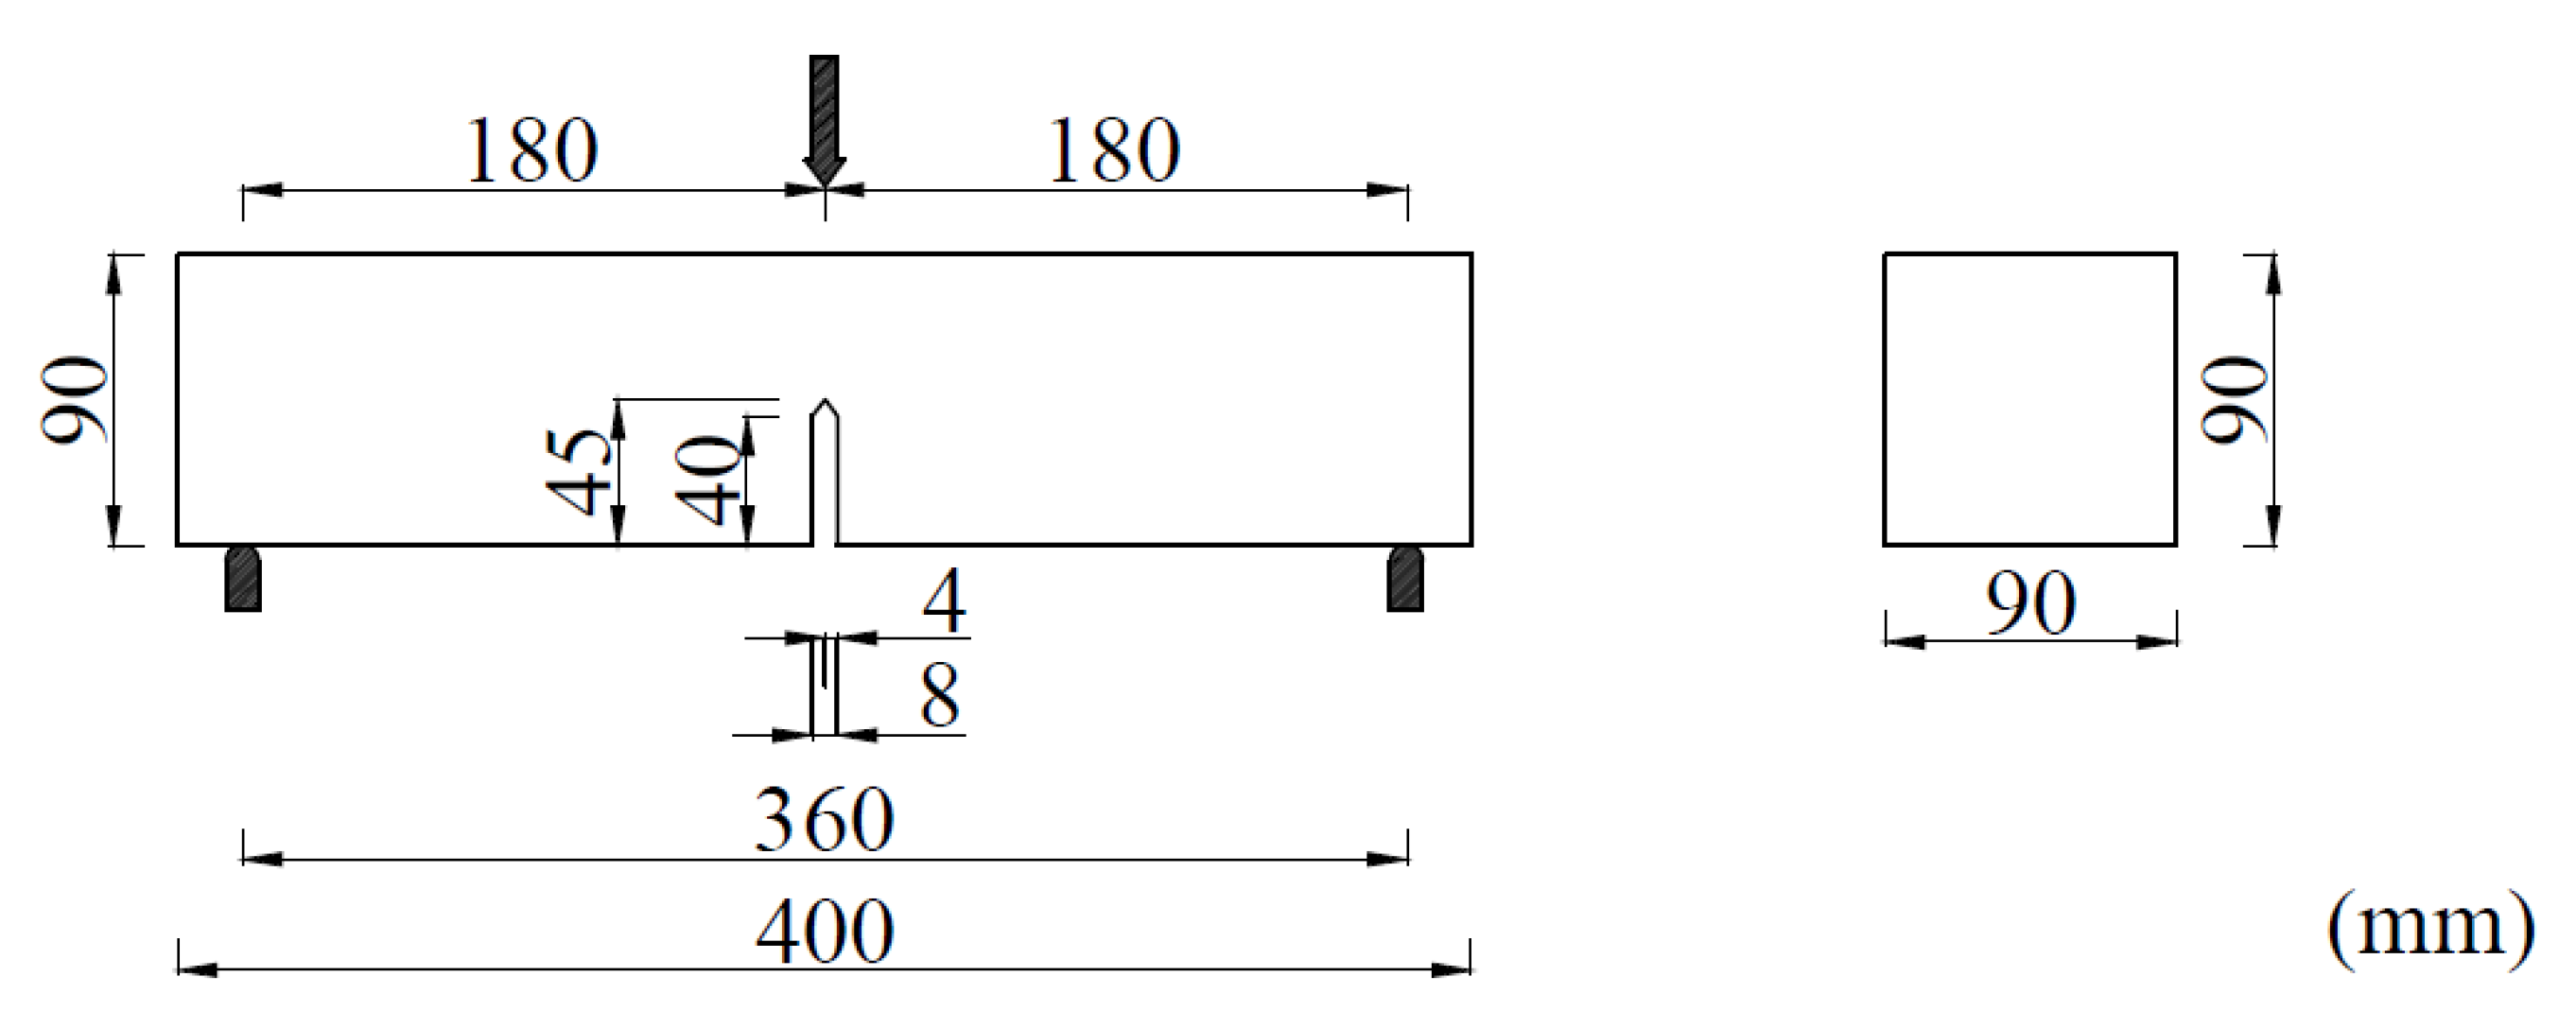
Table 5 lists the micromechanical properties obtained from the matrix fracture toughness and the fiber pullout tests, including the matrix fracture toughness (
), and the interfacial properties between the matrix and fiber, i.e., the frictional bond strength (
), chemical bond strength (
), and strain-hardening coefficient (
).
was calculated using Equation (1) [
15].
Here,
is the load,
is the distance between each node,
is the specimen thickness, and
is the specimen height.
in Equation (1) was calculated using Equation (2) below:
Here, is the notch length.
can be calculated with the peak pullout load
. When
if exceeded, fiber pull-out begins. The frictional bond strength was calculated using Equation (3) [
18]:
Here, and are the diameter and embedment length of fibers, respectively.
Using Equation (4) [
18],
was calculated from the initial slope of the pullout load and pullout distance curves at the point of
.
Here, is the variation in fiber pull-out load and is the slip between matrix and fiber.
In the present work, the chemical reaction between PE fiber and the matrix was not considered. Instead, the slip softening behavior in the fiber pullout test results was reflected by the strain-hardening coefficient, which was a constant value of zero when the pullout load decreases linearly as the pullout distance increases. The strain-hardening coefficient had a negative value because slip softening behavior was observed in the specimens.
3.3. Micromechanical Analysis
In order to analyze the mechanism of the strain-hardening and highly ductile behavior of the composite, and were evaluated based on the micromechanical properties of the materials and by fiber-bridging analysis.
A theoretical fiber-bridging curve of the composite was obtained based on fiber-bridging constitutive law, expressed in the form of Equation (5) [
22]:
Here, is the fiber volume fraction and ) is the pull-out load of each fiber with respect to its inclined angle (), embedment length (), and crack opening displacement (. is the probability density function with respect to the inclined angle of the fibers.
Additional information for the analysis, such as spalling coefficient, fiber strength reduction factor, and snubbing coefficient, were adopted from the literature; those values are 500, 0.475, and 0.3, respectively [
23,
24,
25].
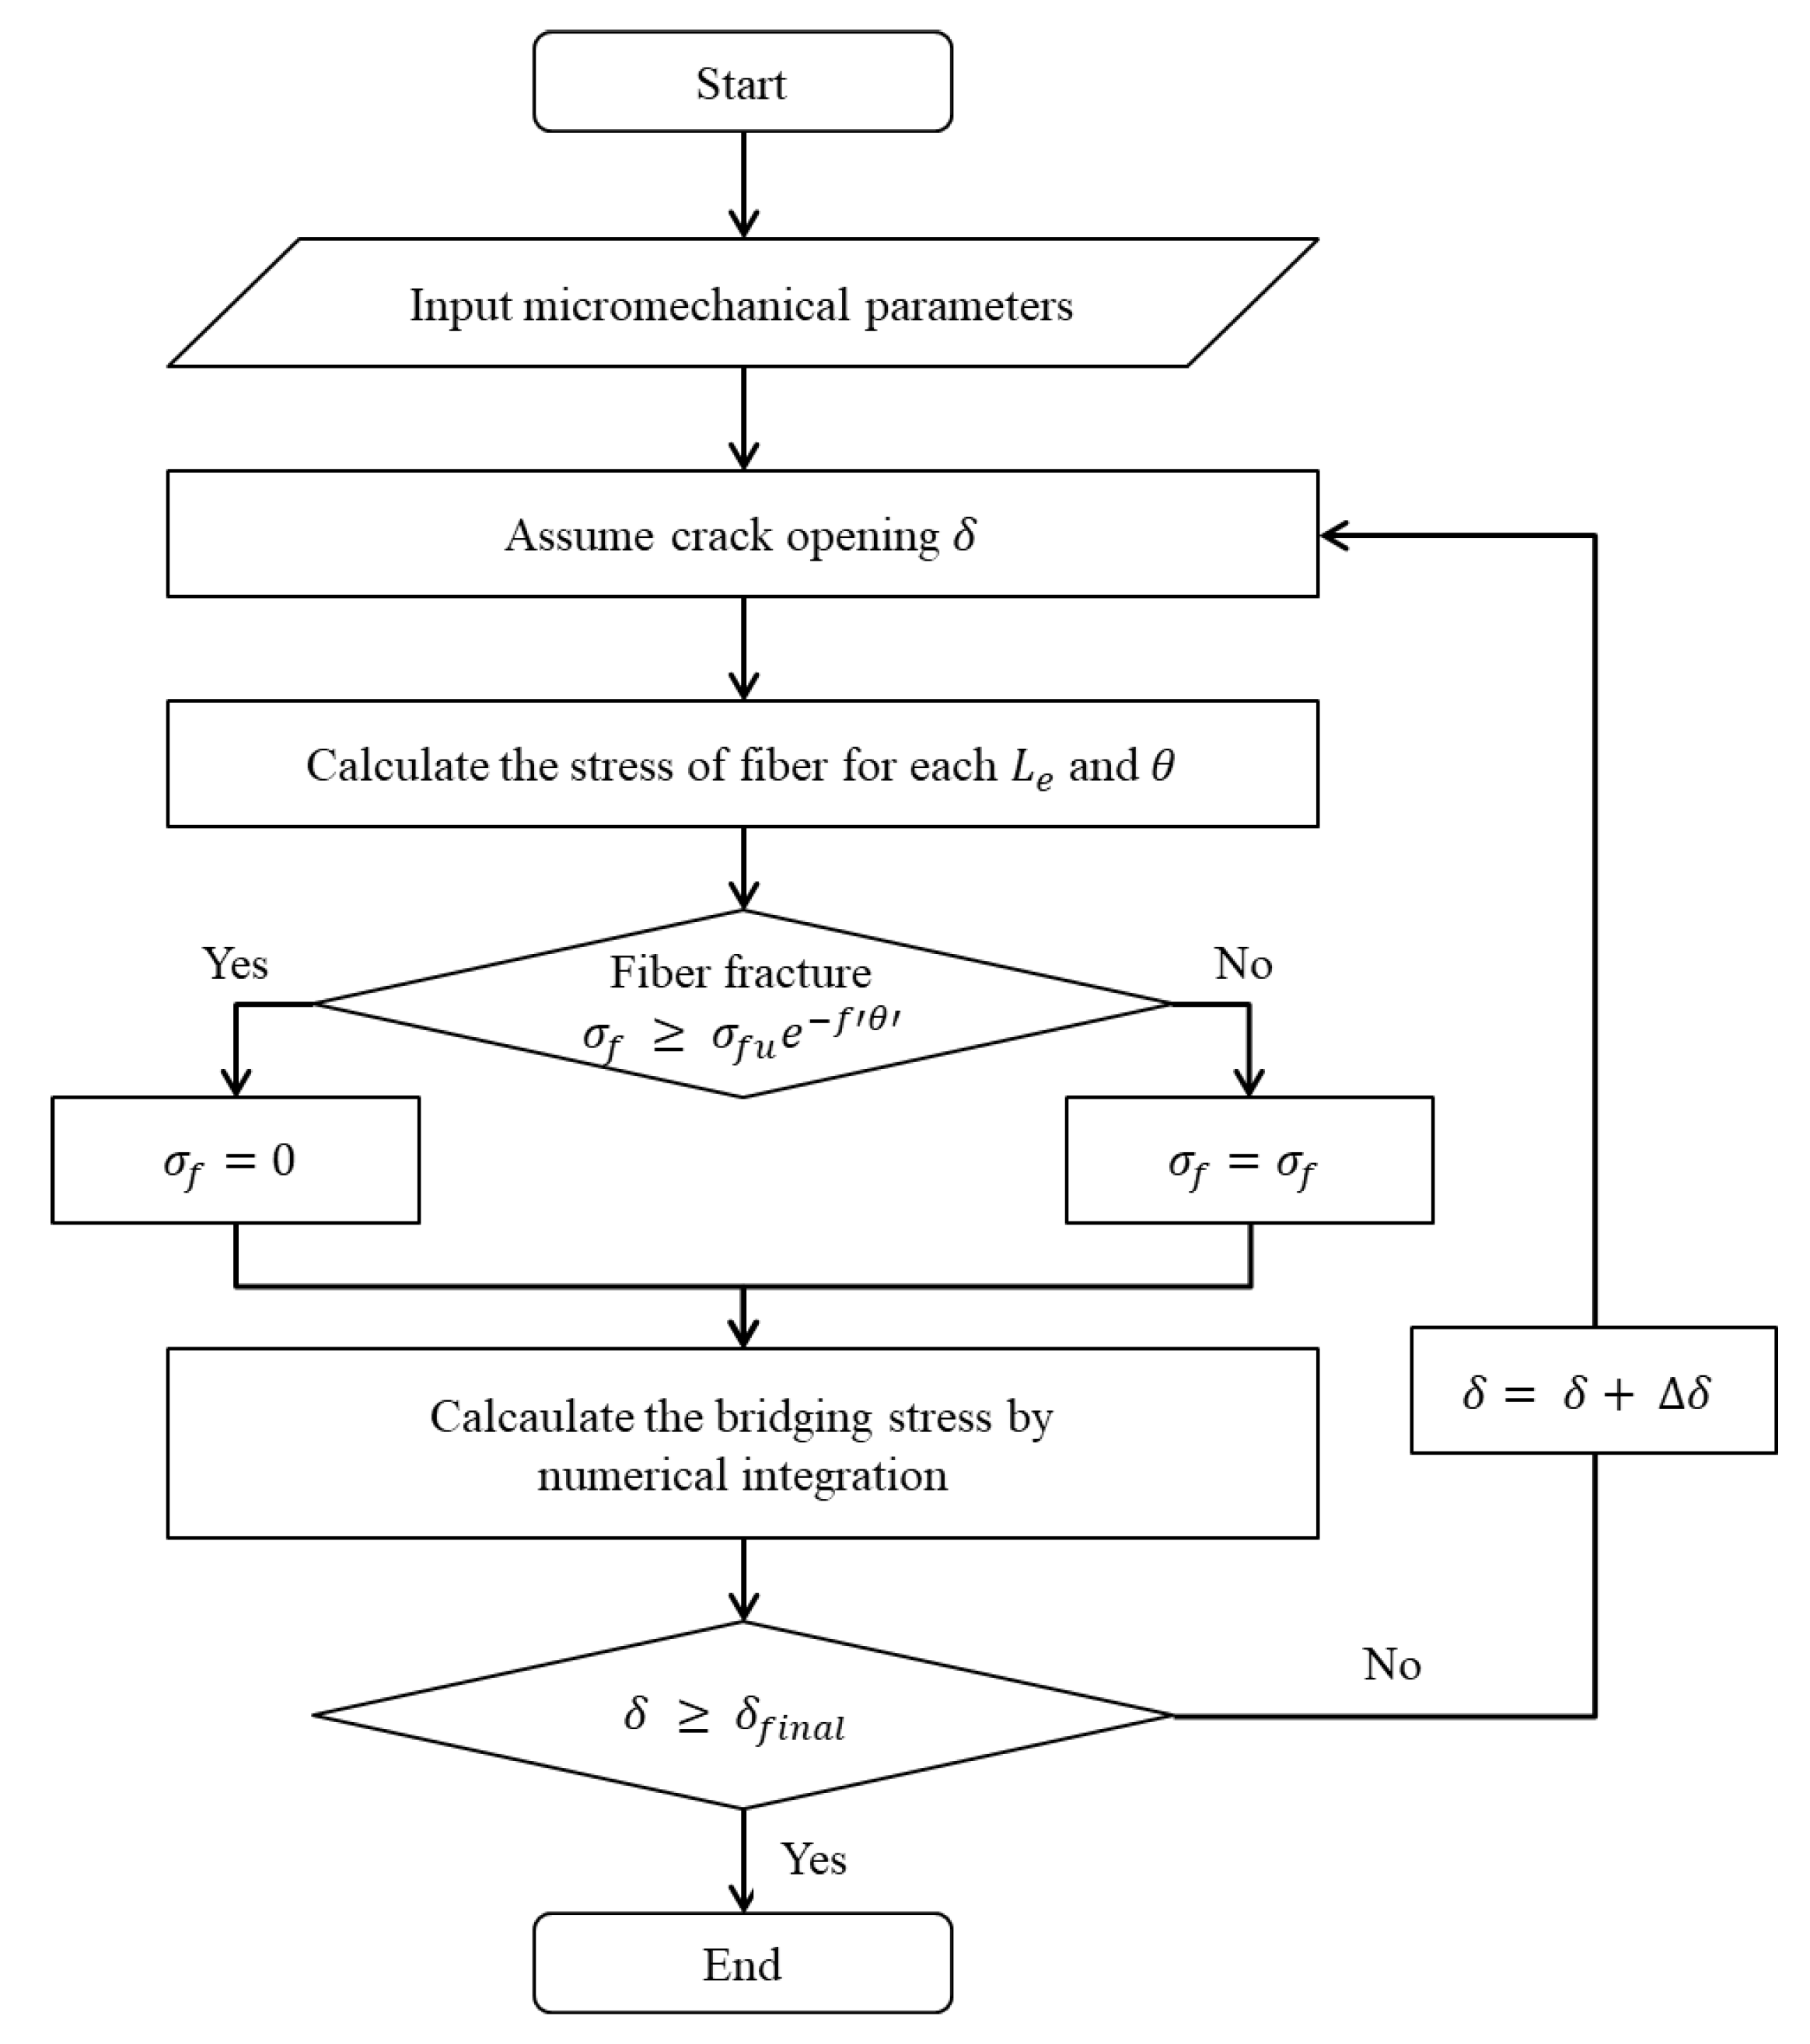
Figure 8 shows the numerical procedure to obtain the fiber-bridging curve. First, crack opening displacement is assumed. Following that, for a given crack opening displacement, the stress induced on the fiber is determined with respect to the embedment length and inclined angle of the fibers. Next, based on the calculated level of induced stress, it is determined whether the fibers have been fractured or not. For a given crack opening displacement, the pullout loads for all fibers in the crack are numerically integrated. This procedure is repeated until the assumed fiber opening displacement reaches the final crack opening displacement.
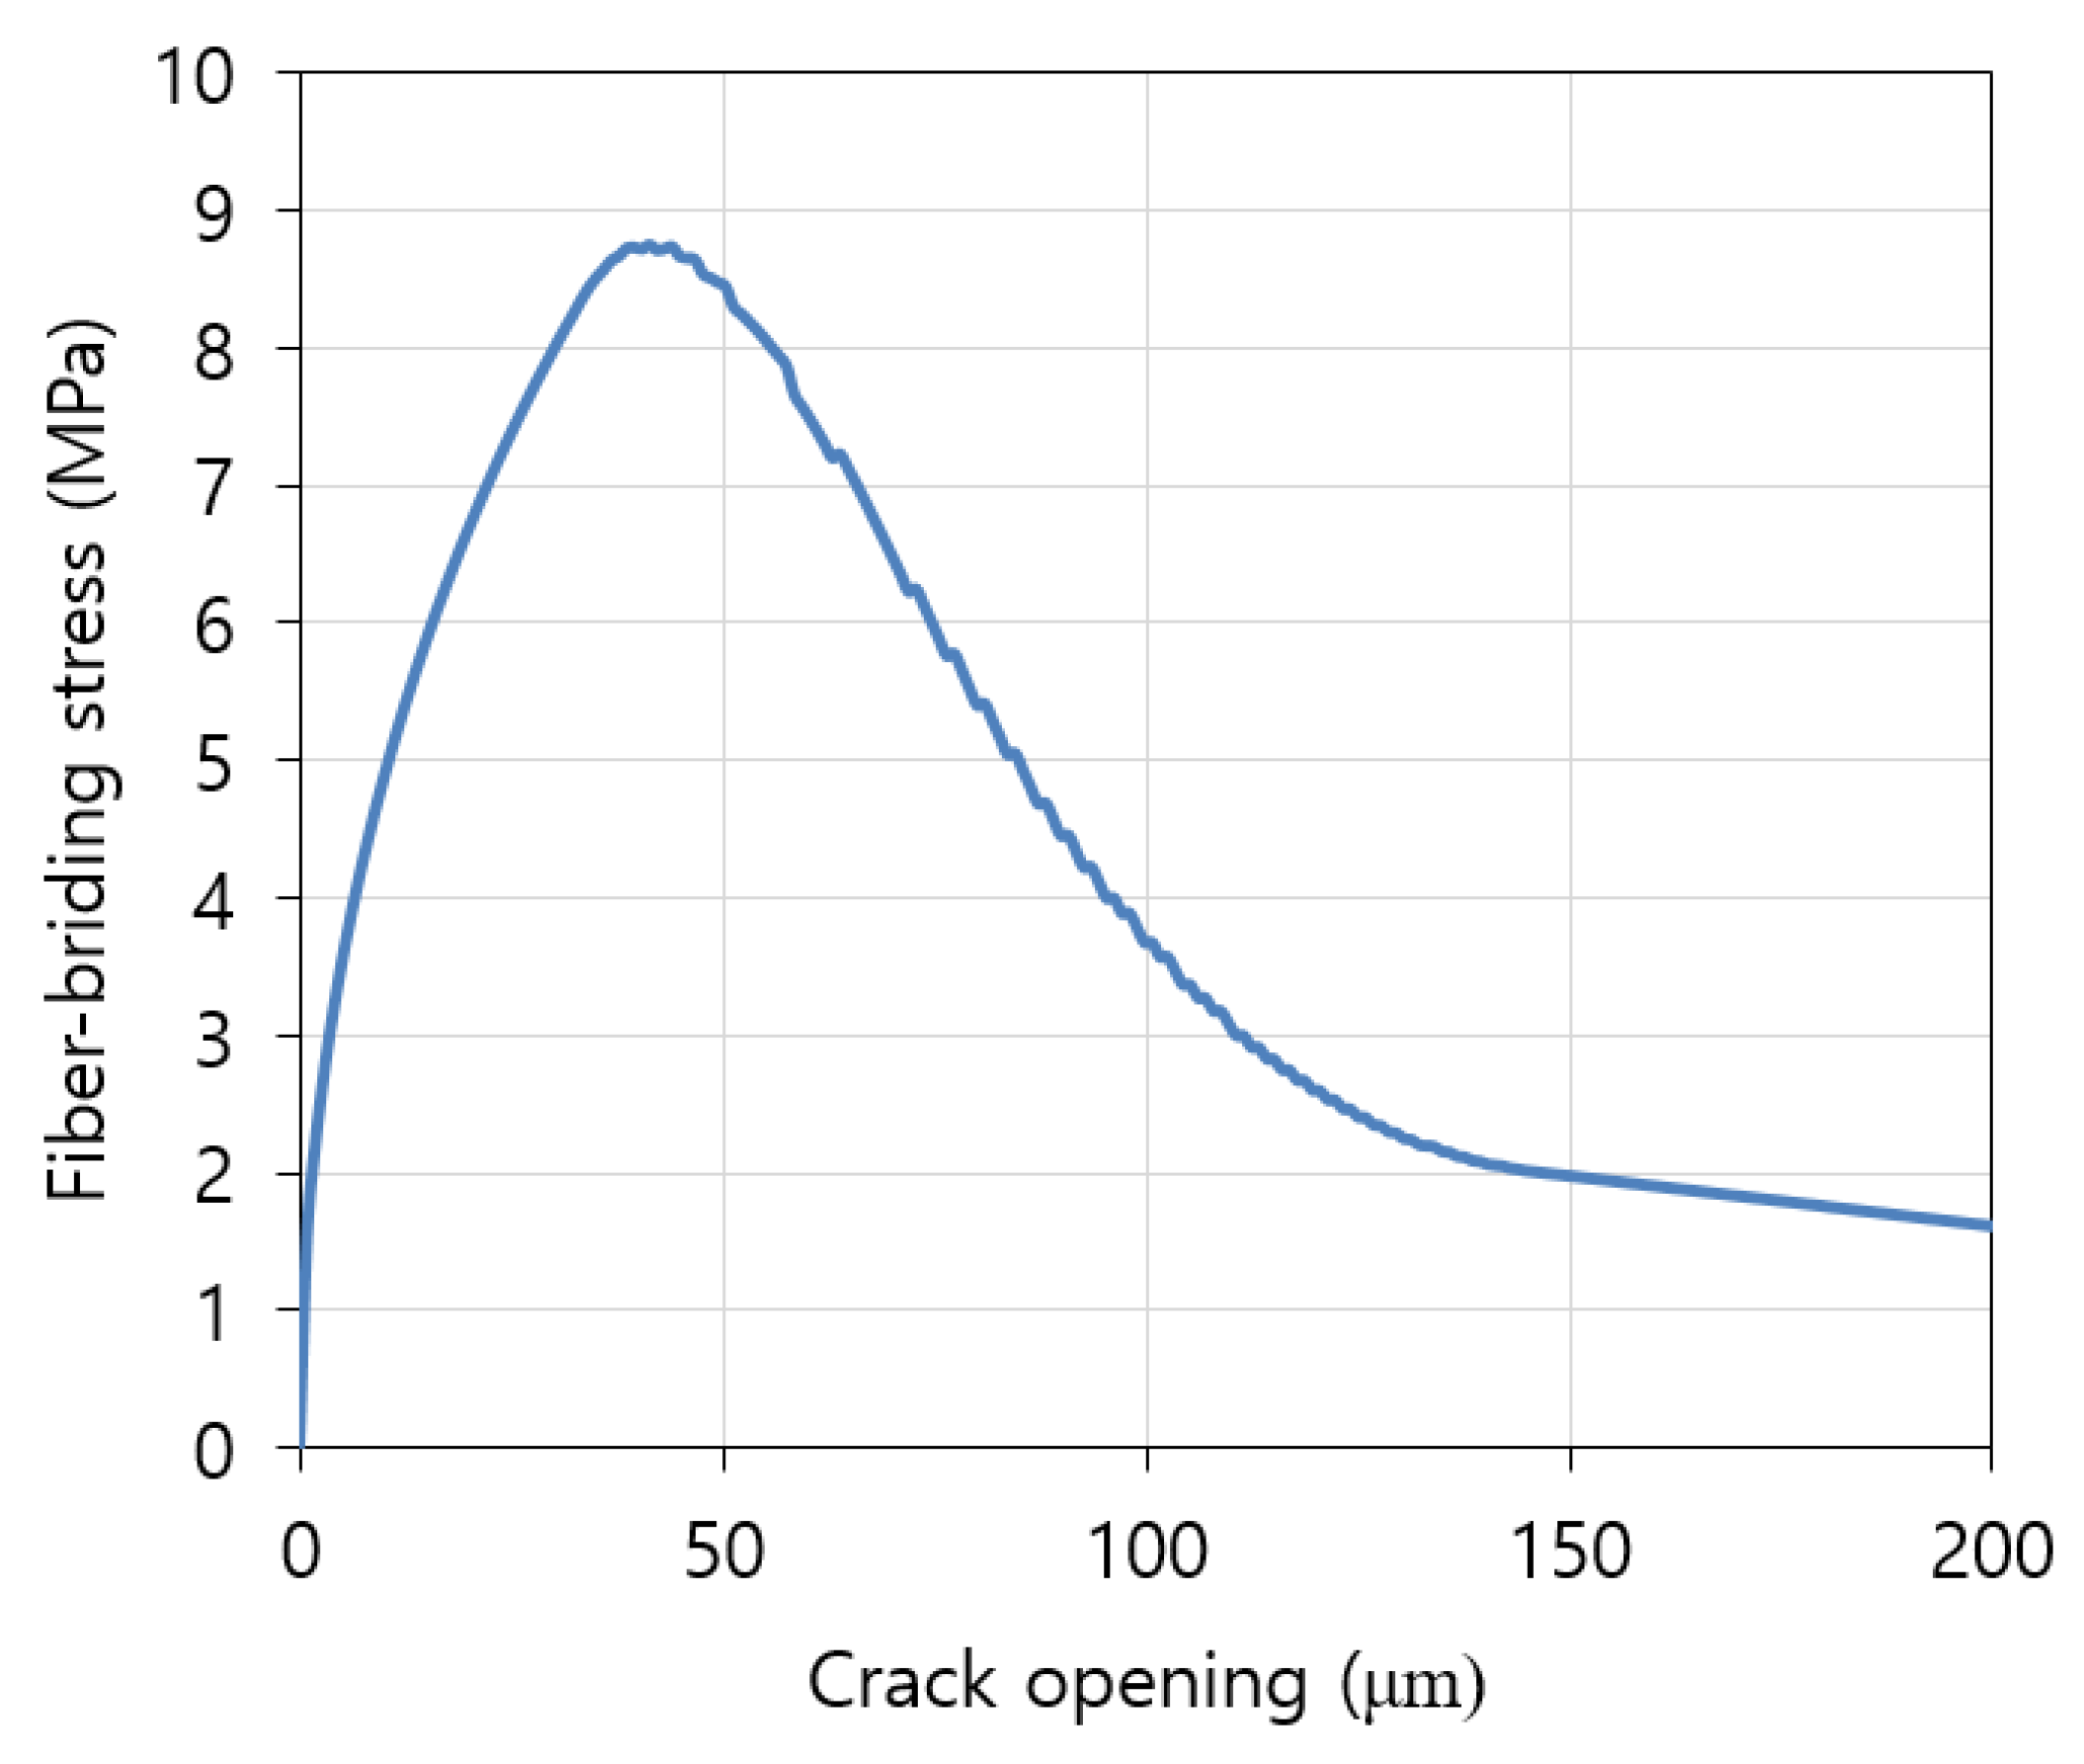
The theoretical fiber-bridging curve of the composite is shown in
Figure 9. Given that PE fiber is hydrophobic, there was no fiber-bridging stress observed in the initial part of the curve. The maximum fiber-bridging stress was 8.7 MPa and corresponding crack opening was 44.1 μm. The complementary energy (
) was 100 J/m
2.
When the composite is homogenous and isotropic, the maximum fiber-bridging stress is identical to the value of
of the composite. Otherwise, because the fiber-bridging capacity depends on matrix properties and fiber distribution, it is generally observed that the tensile strength is lower than the theoretical maximum fiber-bridging stress. The specimen fractured at the section with the lowest fiber-bridging capacity. Details of a comparison of
and
between the micromechanical analysis and the experimental results are provided in
Table 6. The maximum fiber-bridging stress was only 2.3% higher than the value of
of the composite. Although a relatively high difference was observed between analytical and experimental results for crack width, it seems that the theoretical fiber-bridging curve simulate the tensile behavior of the composite well, especially considering the variation of matrix properties and the fiber distribution. This implies that the fiber-bridging analysis performed in this study is appropriate to investigate the fundamental mechanisms of the strain-hardening and highly ductile behavior of the composite.
The matrix fracture energy (
), which is the energy for crack propagation of the matrix at the crack tip, was calculated using Equation (1) [
26].
Here, is the matrix fracture toughness, defined in the previous section. is the elastic modulus of the matrix and was found to be 10.3 GPa. It was obtained in the linear elastic region of the tensile stress and tensile strain curves.
The values of properties on the energy are listed in
Table 7. The values of
of the composite was 8.9, which means that the composite satisfied the energy condition for strain-hardening and steady-state multiple cracking behavior; this value is approximately three times higher than the value (=2.7) in practical design criterion proposed by Kanda and Li [
11]. From the micromechanical investigation and fiber-bridging analysis, it can be concluded that the composite in this study satisfied both strength and energy conditions for strain-hardening and steady-state multiple cracking behavior. Furthermore, the excellent tensile properties of the composite are explained by micromechanical principles and steady-state cracking theory.


