Article

Approaches for Detailed Investigations on Transient Flow and Spray Characteristics during High Pressure Fuel Injection

Institute for Technical Combustion (ITV), Leibniz University Hannover (LUH), 30823 Garbsen, Germany
*
Author to whom correspondence should be addressed.
Appl. Sci. 2020, 10(12), 4410; https://doi.org/10.3390/app10124410
Submission received: 31 May 2020 / Revised: 22 June 2020 / Accepted: 24 June 2020 / Published: 26 June 2020
(This article belongs to the Special Issue Progress in Spray Science and Technology)

Abstract

:

Featured Application

High pressure diesel injection systems.

Abstract

High pressure injection systems have essential roles in realizing highly controllable fuel injections in internal combustion engines. The primary atomization processes in the near field of the spray, and even inside the injector, determine the subsequent spray development with a considerable impact on the combustion and pollutant formation. Therefore, the processes should be understood as much as possible; for instance, to develop mathematical and numerical models. However, the experimental difficulties are extremely high, especially near the injector nozzle or inside the nozzle, due to the very small geometrical scales, the highly concentrated optical dense spray processes and the high speed and drastic transient nature of the spray. In this study, several unique and partly recently developed techniques are applied for detailed measurements on the flow inside the nozzle and the spray development very near the nozzle. As far as possible, the same three-hole injector for high pressure diesel injection is used to utilize and compare different measurement approaches. In a comprehensive section, the approach is taken to discuss the measurement results in comparison. It is possible to combine the observations within and outside the injector and to discuss the entire spray development processes for high pressure diesel sprays. This allows one to confirm theories and to provide detailed and, in parts, even quantitative data for the validation of numerical models.

1. Introduction

High pressure injection systems are commonly used in modern internal combustion engines. The systems have essential roles for realizing highly controllable fuel injections, for example, multiple injections in a cycle, short injection duration and accurate injection quantity. On the other hand, the difficulty for recognizing the spray development process, especially near the injector nozzle, is increased because of its drastic transient nature. Since the atomization characteristics in the region have an important influence for the further spray development, the investigation on the atomization processes are one of the focused research targets since long time. However, due to the high speed and high concentrated spray, detailed investigations are still challenging in the region. Several unique techniques have been developed (reviews are given in [1,2]) and applied for the measurement in the region, but the phenomena in the region are not fully understood yet.
A schematic diagram of a spray development process is shown in Figure 1 [3]. The left side of the figure shows the cut model of an injector tip. The fuel flows through the small channel between the needle and the injector body. Then, the fuel is injected to the chamber through the sac and the nozzle orifice. The liquids are fragmented into huge droplets, ligaments and small droplets near the nozzle exit (primary breakup). These forms of liquids are further fragmented to a large amount of small droplets (secondary breakup). These small droplets are dispersed by the entrained air.
The injection process starts when the needle moves vertically and opens a cross section area for the flow inside the injector. Because the flow cross section is drastically changed during the injection period, the temporal velocity and the main flow direction of the liquid fuel are also changed within a short time. In addition, the turbulence intensity of the nozzle flow is high, and it induces the liquid breakup at the nozzle exit rapidly. Cavitation occurs when the local pressure of the liquid decreases to its saturation pressure. The cavitation reduces the effective flow area in the nozzle and enhances the liquid breakup when the low pressure bubbles collapse within the flow. At the outside of the nozzle, the liquid is also fragmented aerodynamically by the velocity difference between the liquid core and the surrounding air. Turbulence, cavitation and aerodynamical shear are seen as essential driving forces of the spray breakup near the nozzle [4,5].
In order to gain more knowledge of the processes inside and near the nozzle, several unique techniques are applied for detailed studies here. The paper is divided into two parts; 1. investigation on the flow inside the nozzle which is related to cavitation and turbulence, and 2. investigation on the spray development near the nozzle.
The flow inside the nozzle is affected by the inner structures, such as the needle movement, the sac geometry, the orifice inlet curvature, and the nozzle hole geometry. The investigations of these effects are challenging work due to the conditions of the measurements, such as the high velocity of flow inside the nozzle (up to 800 m/s in some cases), the small size target (the diameter of 100 µm and length of 1 mm), and the optical inaccessibility of nozzles. Therefore, only limited experimental methods are applicable. In this paper, X-ray and neutron transmission measurement for inner structures, and cavitation structure measurement on transparent nozzles, are described. Numerical simulations are used to support the measurement data. For the near field behind the nozzle the spray dense core, velocity fields, and droplets velocity and size are investigated. As much as possible, the same injector is used for the different approaches. A combined discussion of the processes and an outlook for further investigation are addressed in the last section. It is highlighted that the combined approach of the description of the processes inside the nozzle and outside in the spray has to be taken, if possible combining experiments with numerical models (e.g., [5]), in order to reach predictive models of the overall engine processes (e.g., [6]).

2. Flow Inside the Nozzle

In order to investigate the flow inside the nozzle in detail, a combined experimental and numerical approach is taken, where the approach, and for a few conditions, the first results are presented in the following. The objectives are firstly to be able to visualize the processes in detail inside the nozzle, in order to understand the processes. The next step is to know the experimental conditions in such a detail that numerical models can be developed and validated based on exemplary and detailed experiments. These two steps are addressed in this paper. To support this, some preliminary numerical simulations are also shown. It is not yet the purpose here to improve the numerical models. We plan to publish the experimental data of this work, as well as that of further experimental configurations, in such a way that other researchers can improve and validate their numerical models.

2.1. Neutron and X-ray Transmission Measurement

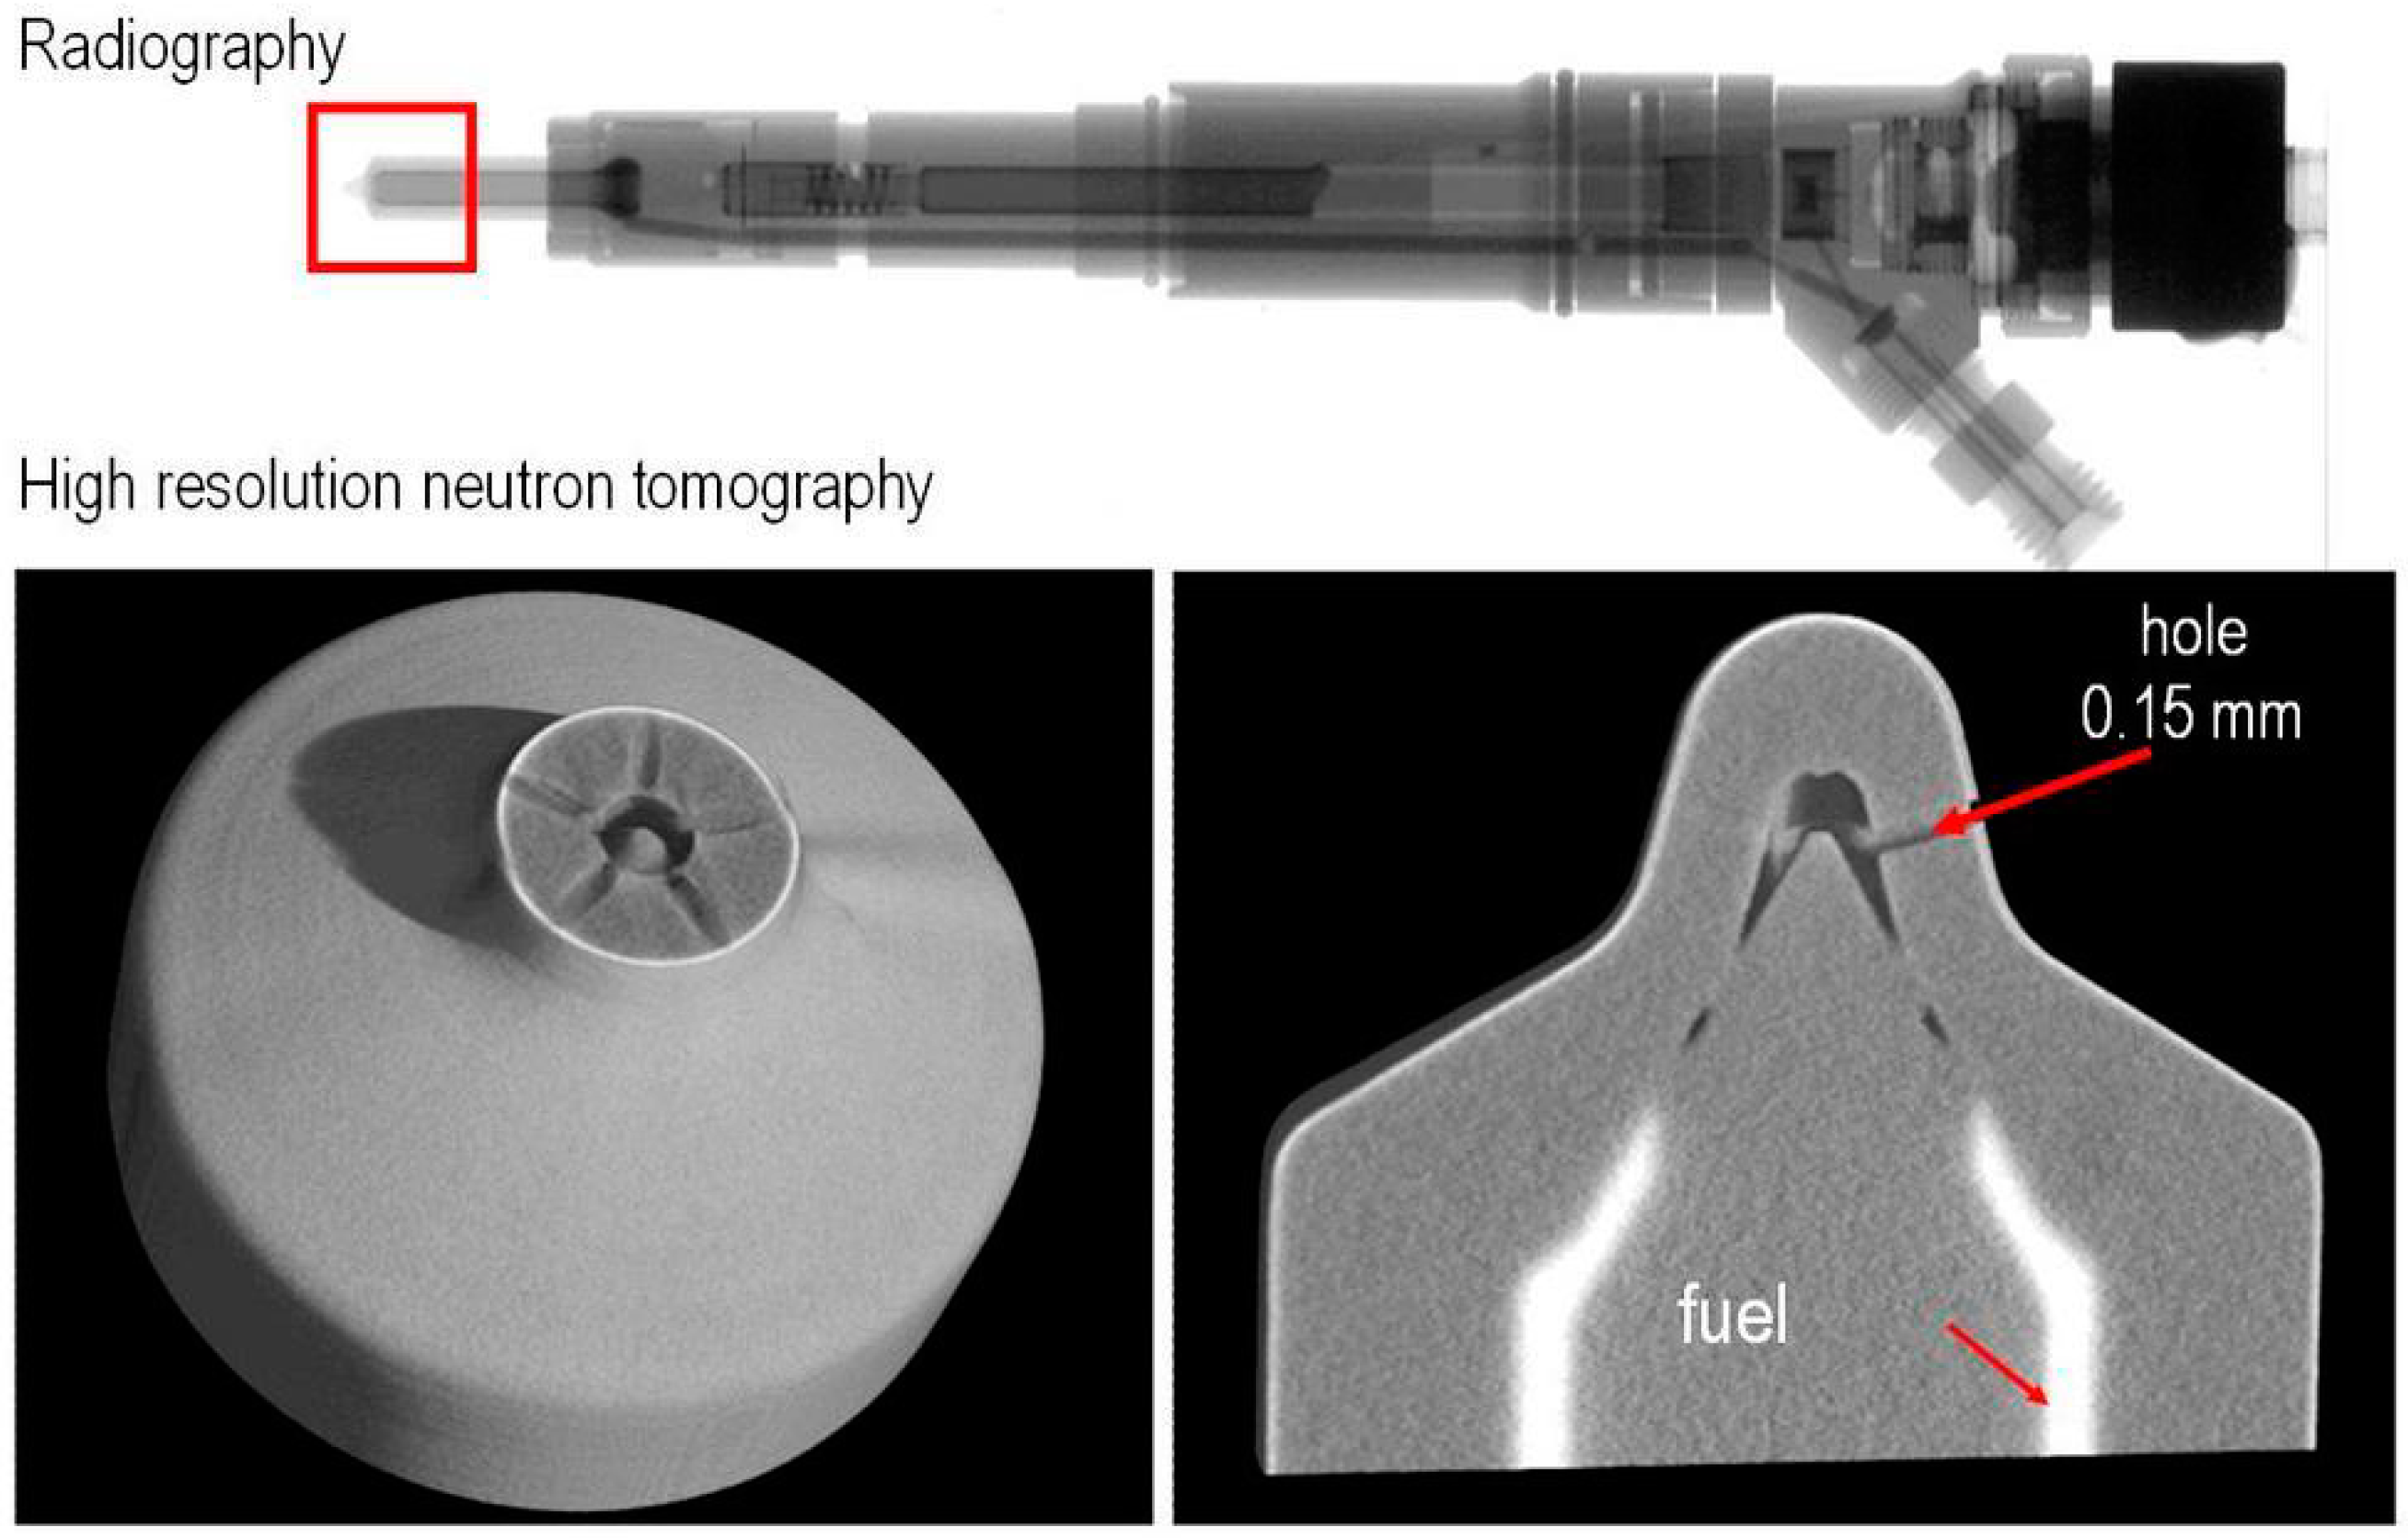
The geometry inside the nozzle affects the flow of the liquid fuel. Instability, fluctuations, and the breakage of both liquid and gas phase are occurring in the affected flow field. These phenomena affect the primary breakup near the nozzle. In this study, the flow induced by the geometry is focused because these are basics of further investigations. Potential techniques to measure the geometry are neutron or X-ray transparent imaging. A radiography and high resolution neutron tomography of a solenoid driven multi-hole diesel injector has been reported from a collaborative research project with the Paul Scherrer Institute (PSI) [7], and the results are reprinted in Figure 2. The injector has five injection holes in this case.
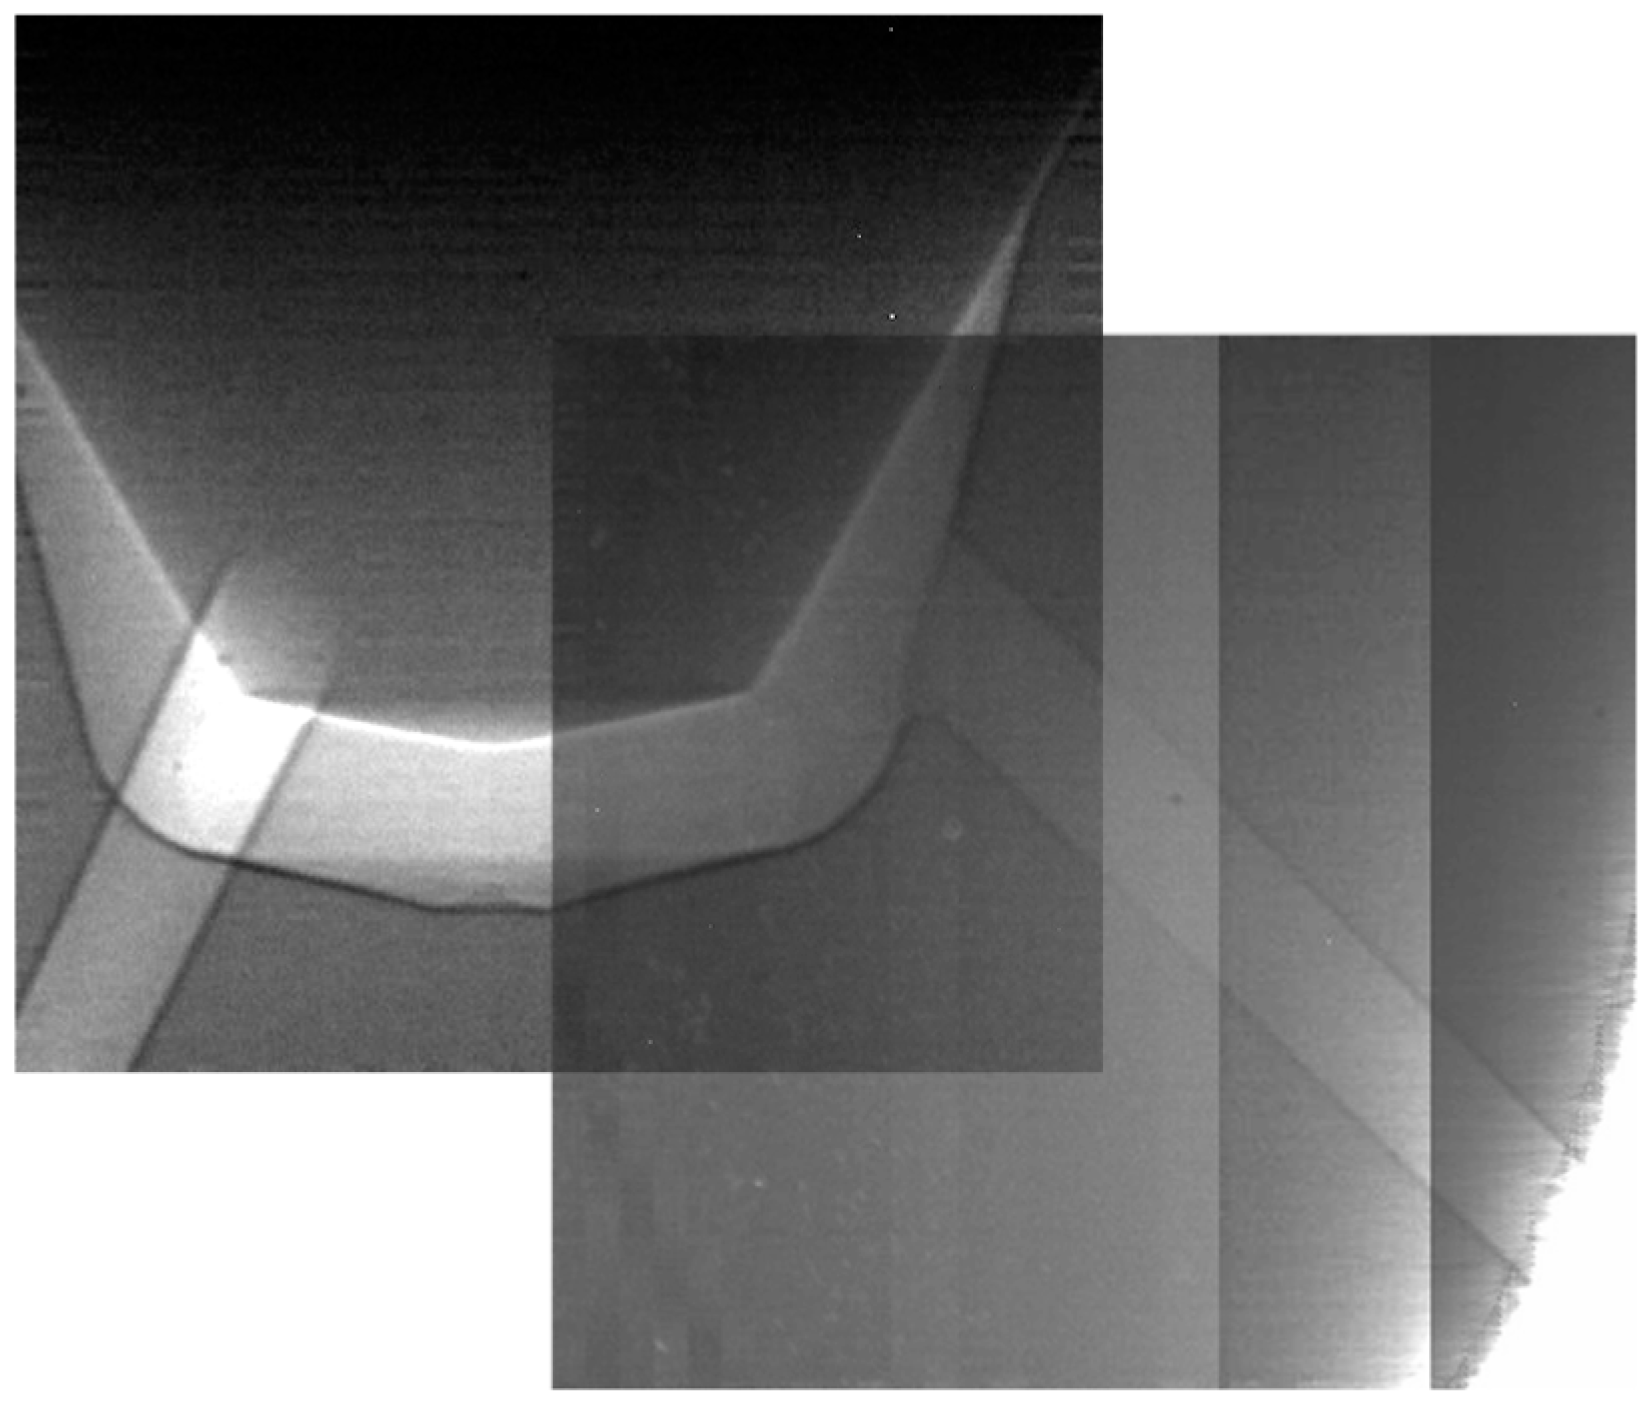
For detailed measurements for the processes inside a nozzle or near the nozzle, the application of modified injectors is needed, such that one of the injection holes can be visualized without disturbance from the others. This is done with injectors with one, two or three injection holes. In Figure 3, the geometry inside a three-hole nozzle is shown, being measured by X-ray synchrotron radiation at Argonne National Laboratory (ANL) [8,9,10]. These were taken within a collaborative research project with ANL and the Institute of Technical Thermodynamics (LTT) at Friedrich-Alexander-Universität Erlangen-Nürnberg. Two of the three nozzle holes are overlapped in the projected direction; the third one provides good access to detailed measurements. High spatial resolution images are required to obtain the detailed geometry data. Therefore, the measurements are divided into several tiles. For example, the image on the figure is reconstructed from four images. The detailed geometry data of the nozzle, especially the radius at the inlet of the nozzle orifice, are obtained from the measurements.
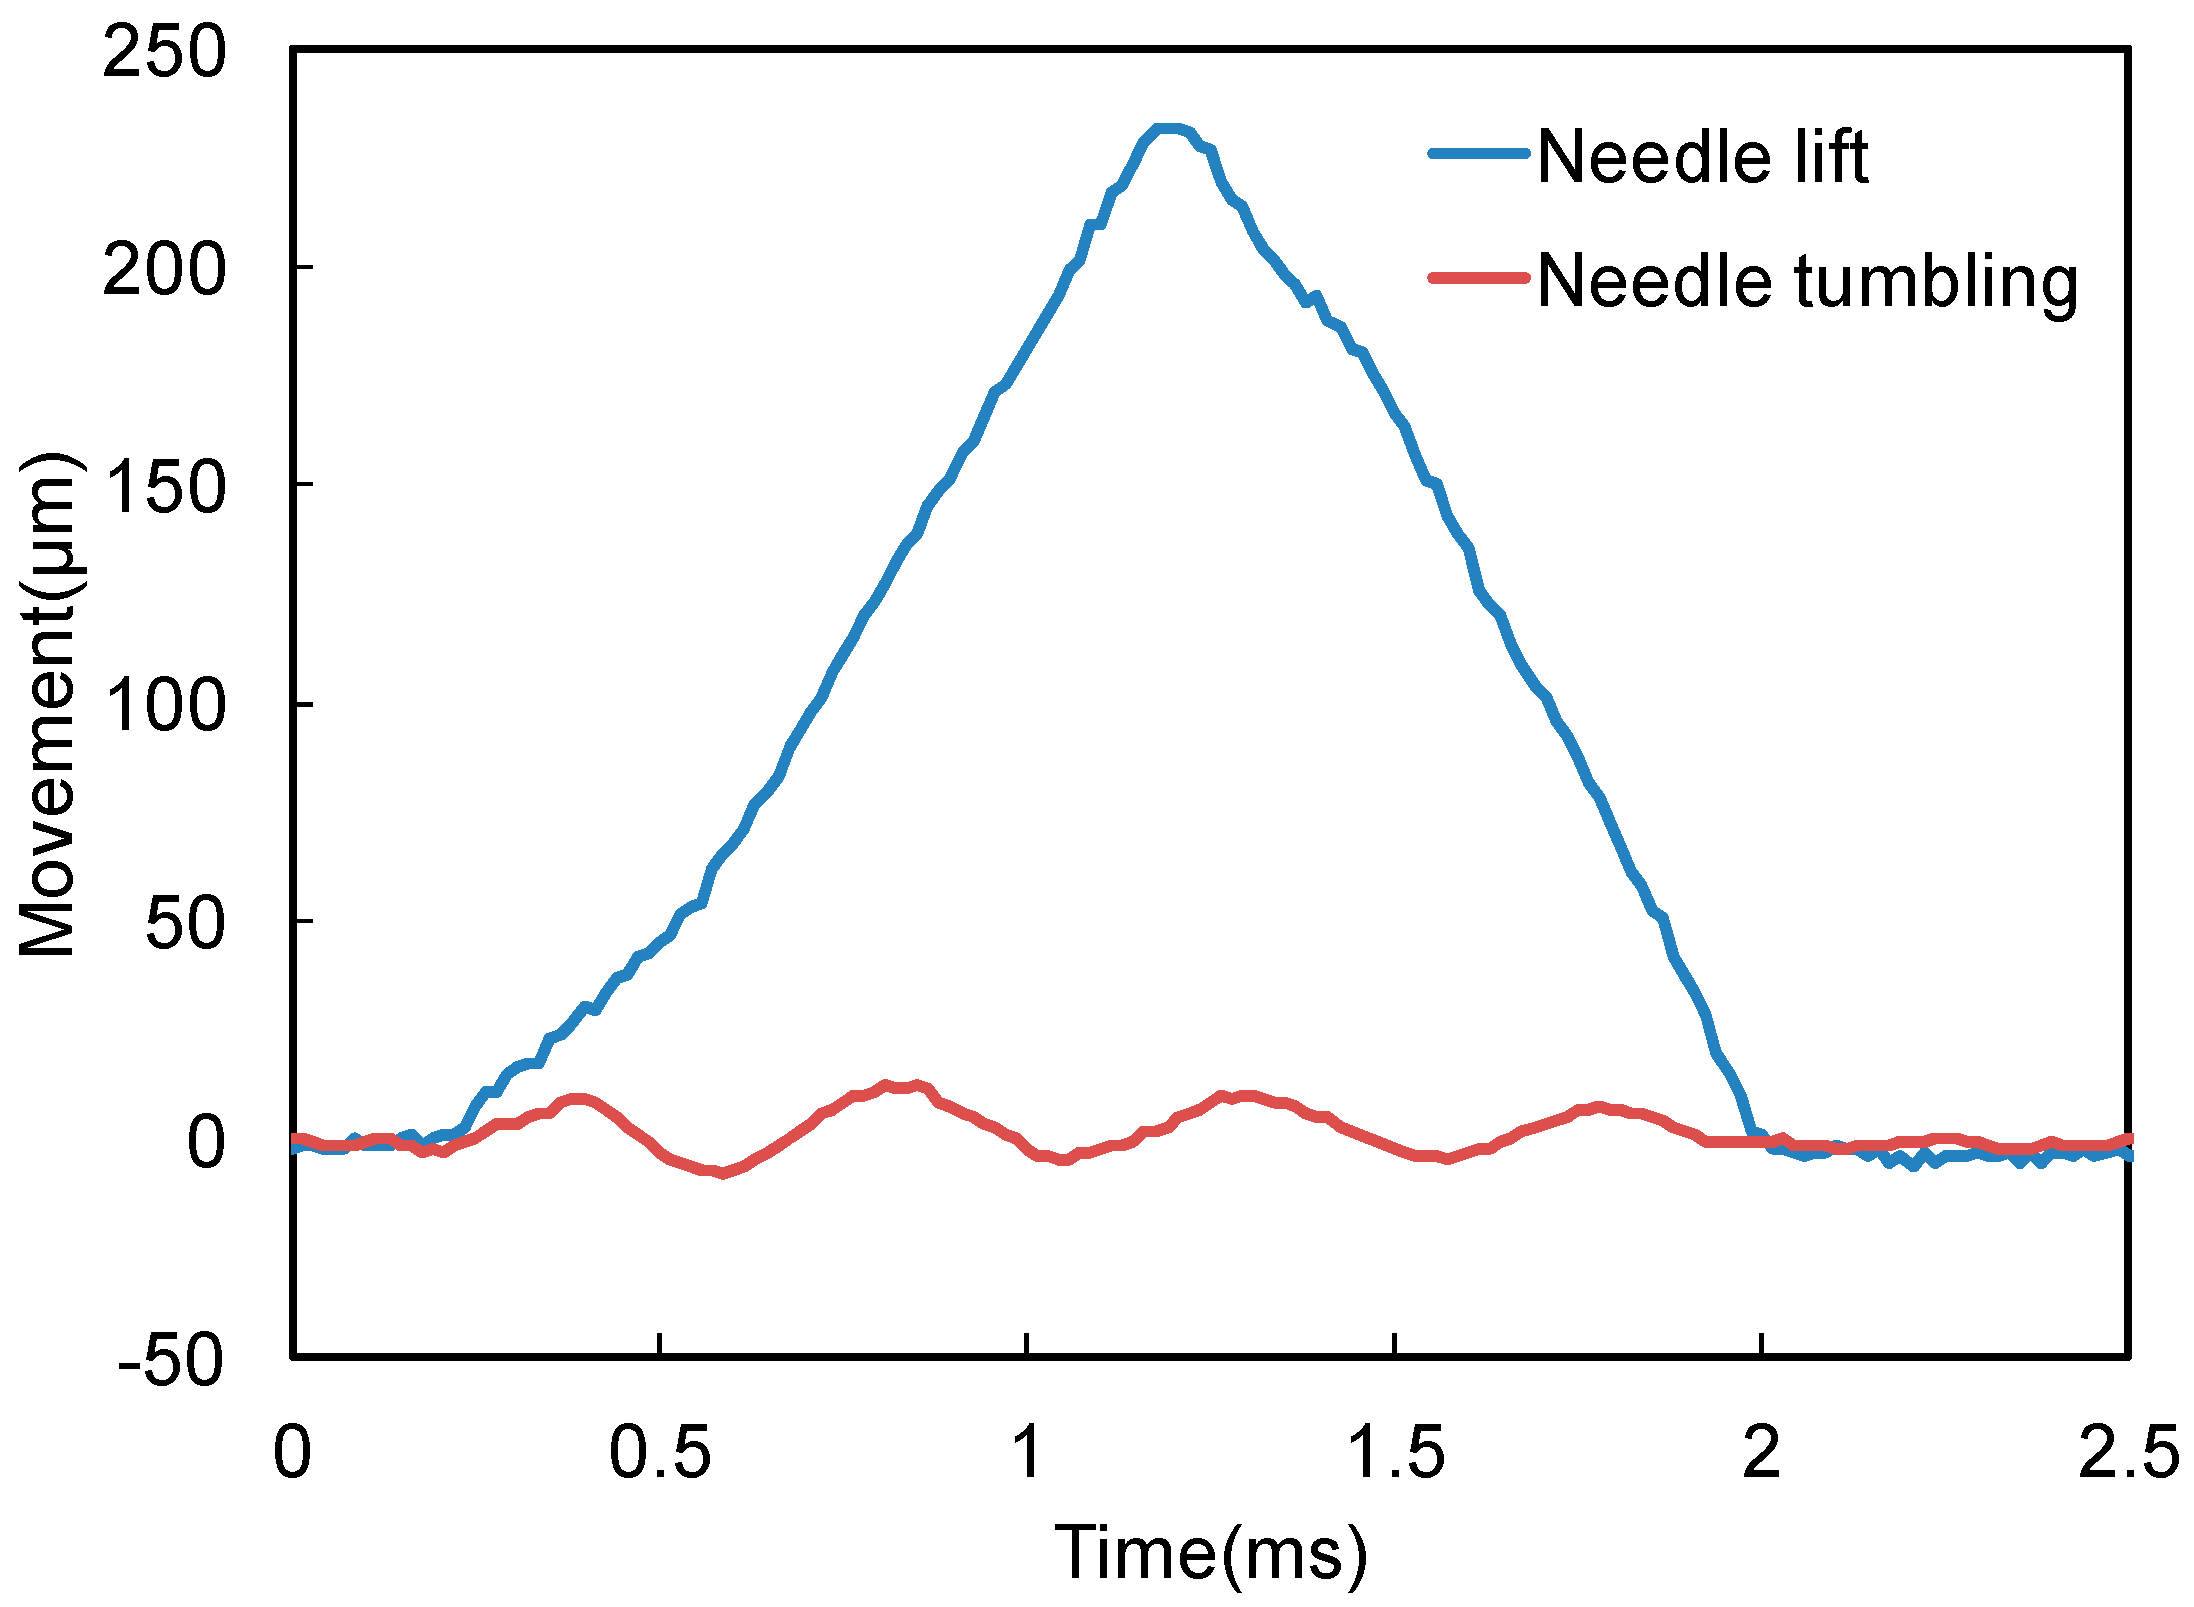
With high speed X-ray measurements, also taken at ANL, the movement of the injector needle is obtained during the injection period. The results are averaged over 10 injections. The needle lift (vertical movement) and the needle tumbling (horizontal movement) are shown in Figure 4 for the case of 25 MPa injection pressure. The needle lift curve almost has a triangle profile. The needle tumbling has a frequency of approximately 2 kHz and an amplitude of about 10 µm in this case.

2.2. Numerical Simulation of Flow Inside Nozzle

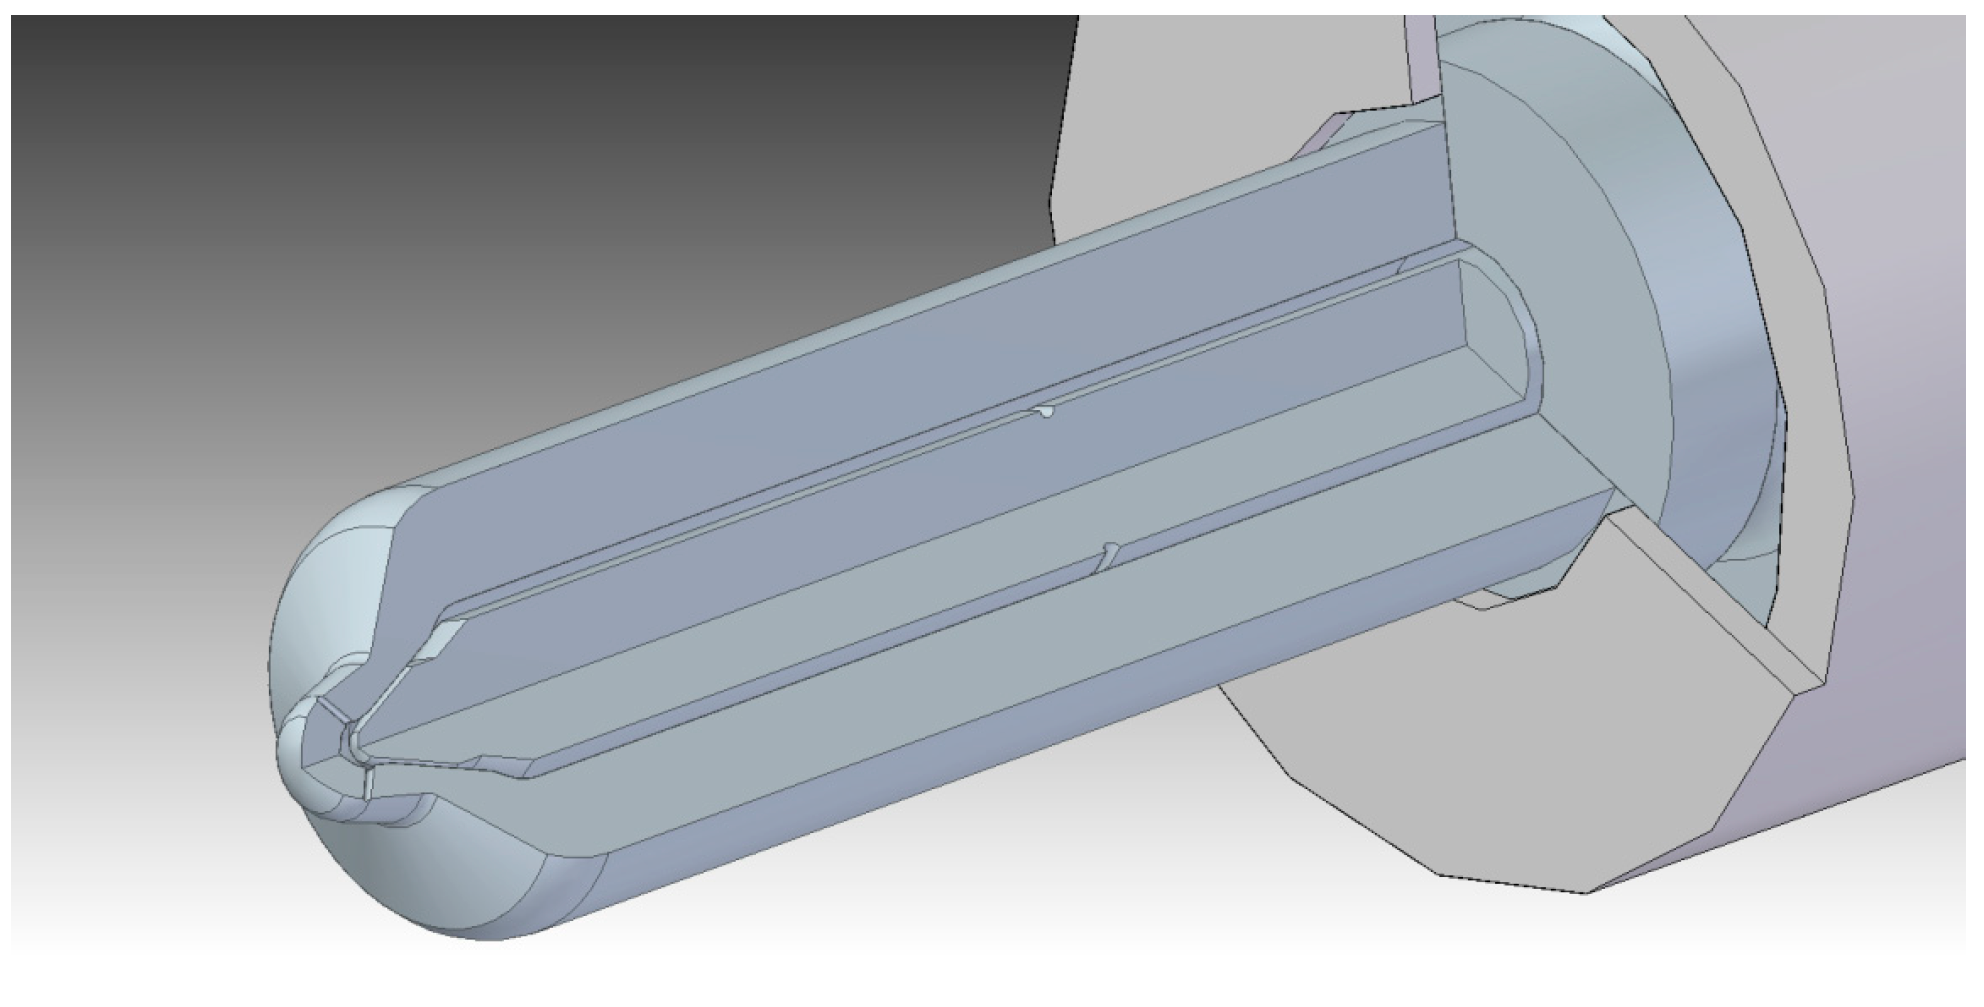
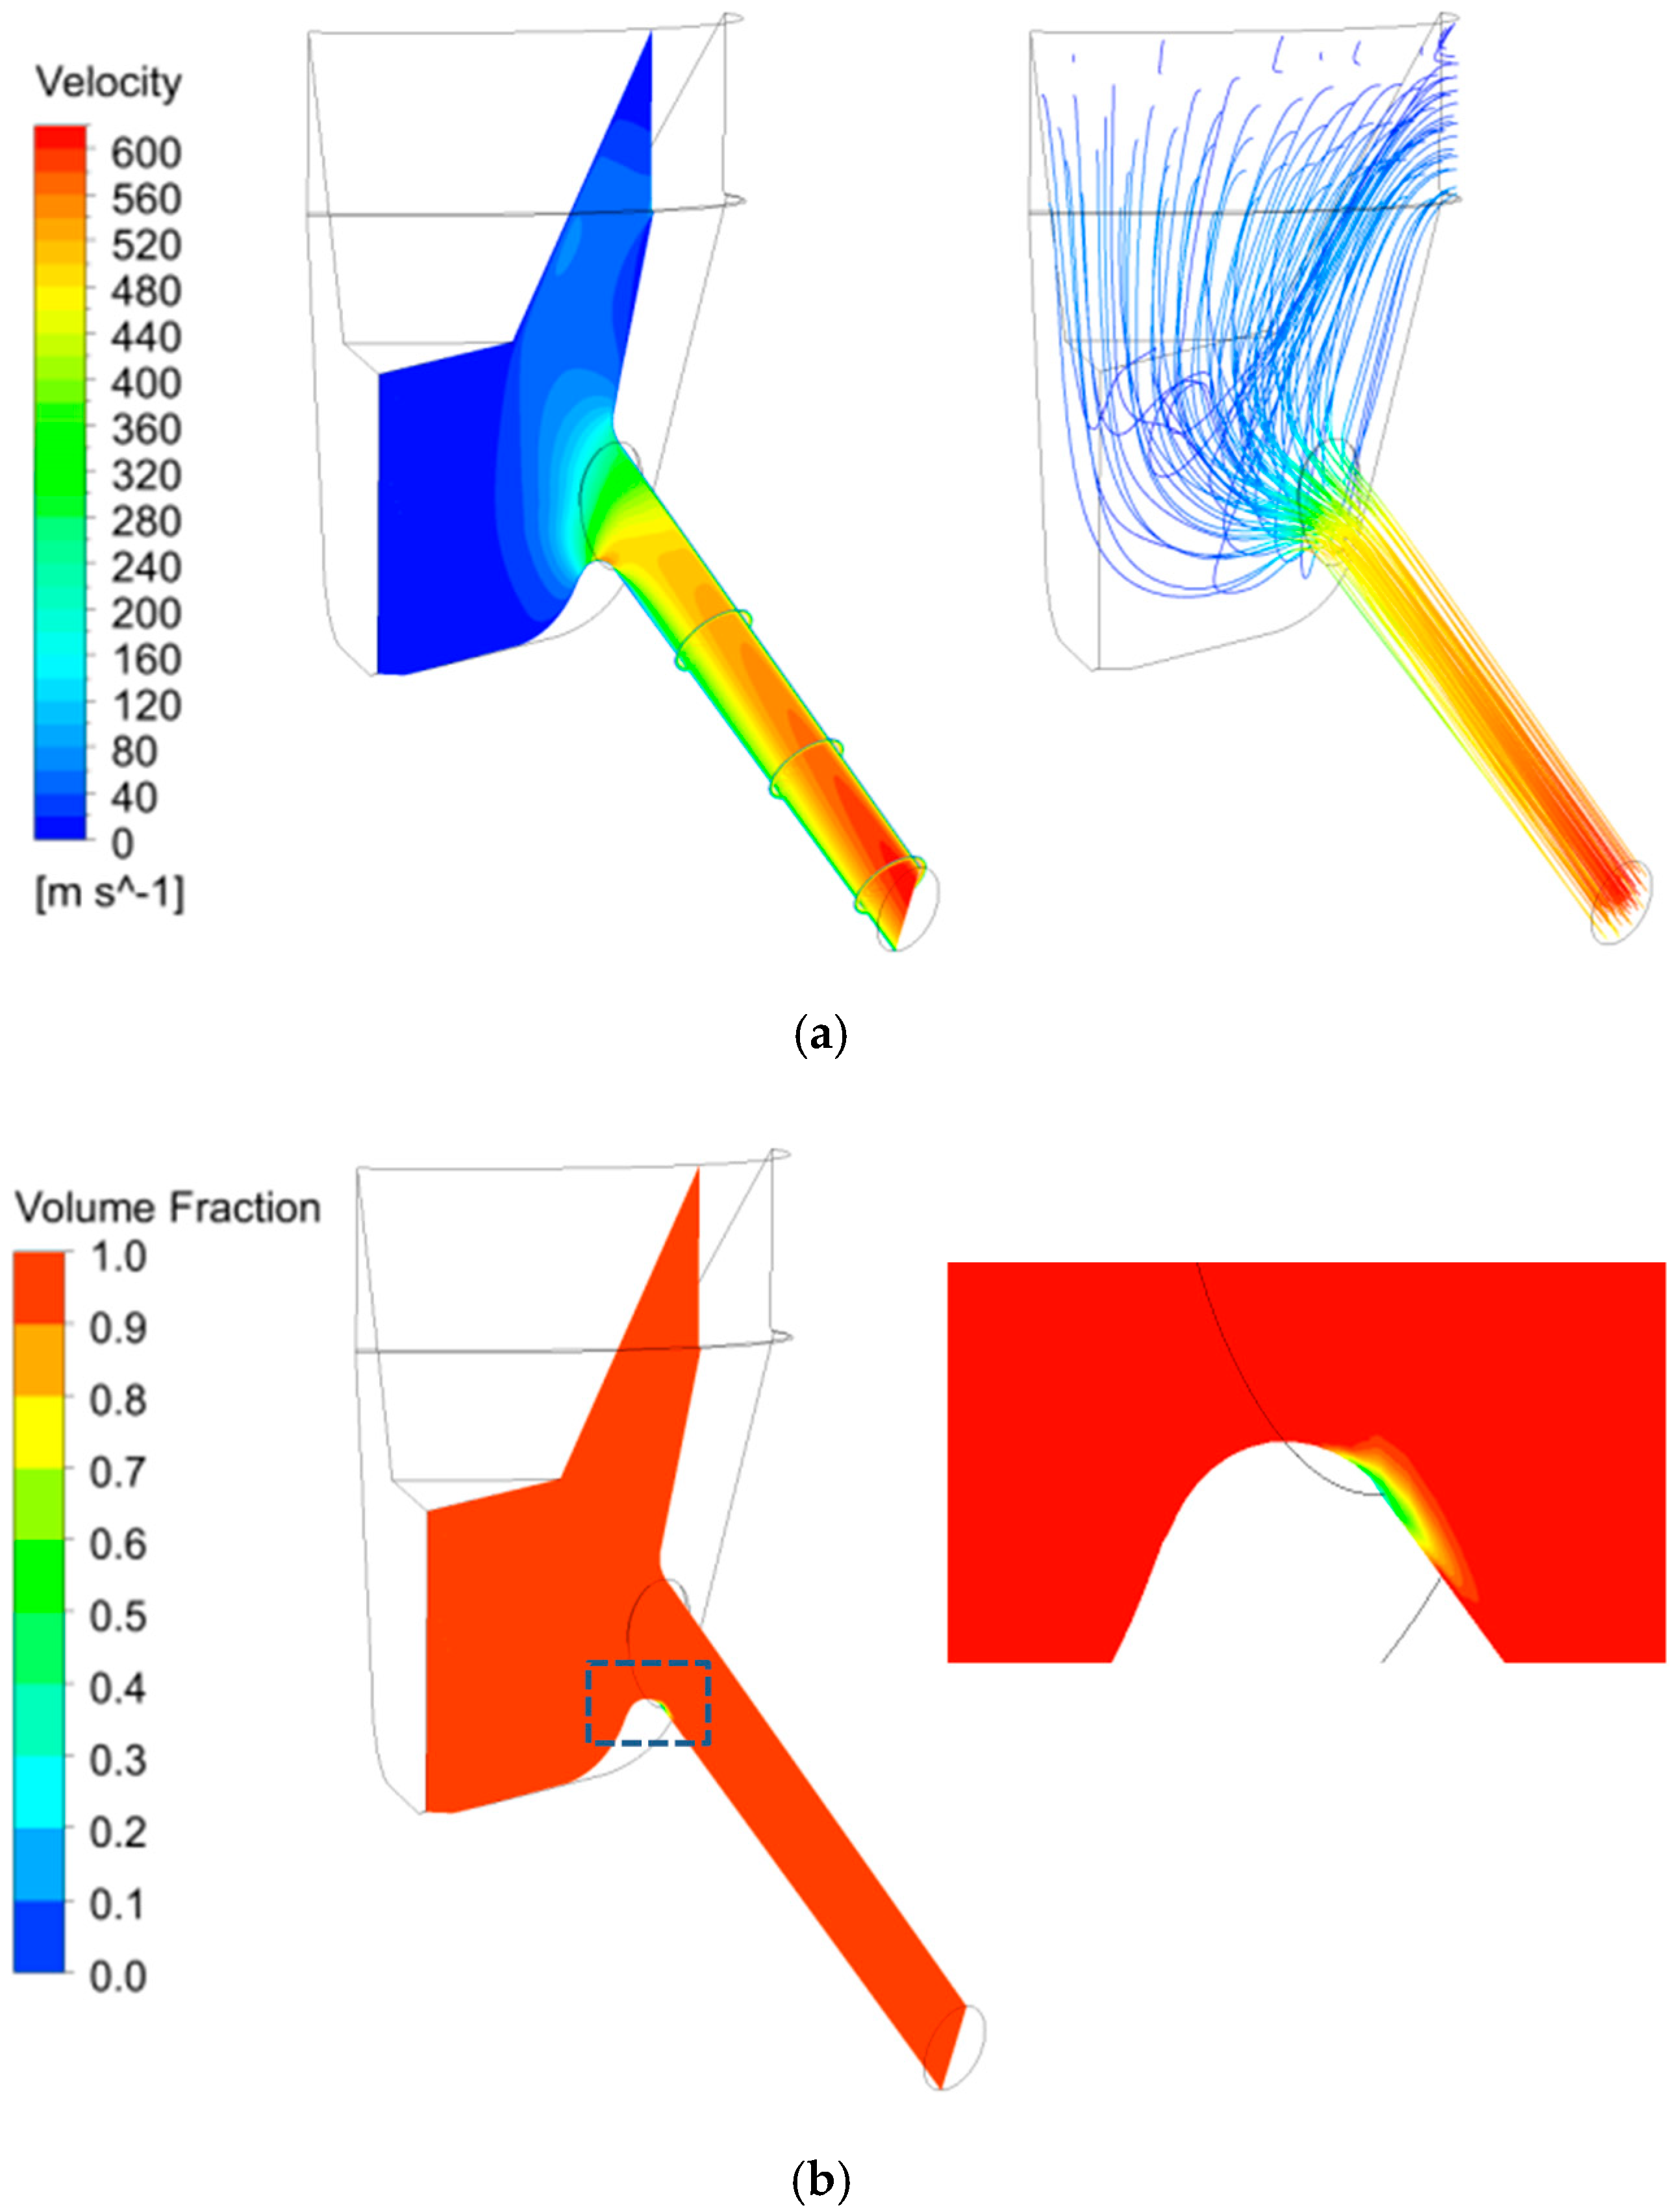
The 3D model of the injector is given in Figure 5. The geometry is designed according to the X-ray transmission measurement at ANL. Any other part of the geometry is similar to that of a standard injector. ANSYS-Fluent is used for 3D flow simulations with the method of computational fluid dynamics (CFD). The simulation has been performed on a 120-degree model of the nozzle tip with a periodic boundary condition. The injection pressure is set to 150 MPa, where cavitation effects can be seen clearly. The velocity contour, streamline and volume fraction inside the 120 degree segment of the nozzle at full needle lift condition are shown in Figure 6.
The figures of the velocity contour and the volume fraction show the plane which cuts vertically through the middle of the injector needle and the nozzle hole. The fuel flows through the needle seat and then into the sac hole. A part of the fuel does not flow directly to the nozzle hole, but slightly back from the sac. Together with the sharp lower edge of the nozzle inlet, a high velocity peak can be found here. Fitting to this flow pattern, cavitation appears on the lower side of the nozzle inlet for this geometry. The size of the cavitation area seems relatively small for the high pressure injection. The injector nozzle orifice has the conicity factor of 2 (the outlet diameter of 115 µm), 12 % hydro grinded inlet corners and the elliptical inlet. Torelli et al. reported that the effect of these design parameters, such as the orifice, with these designs suppresses the cavitation inside the nozzle orifice; even peak injection pressures approached 2500 bar [11]. It seems that the cavitation area in the nozzle is well suppressed by the geometry and therefore seems relatively small, even at 150 MPa injection pressure. The example shows that simulation is able to predict cavitation, however, the important question is, if the numerical models (e.g., being based on the Rayleigh–Plesset equation [12,13]) are able to predict it sufficiently correct. It is essential to compare simulations and experiments with the geometry as similar as possible to evaluate the models. Efforts in this direction with simplified geometry are described in the next section.

2.3. Transparent Nozzles

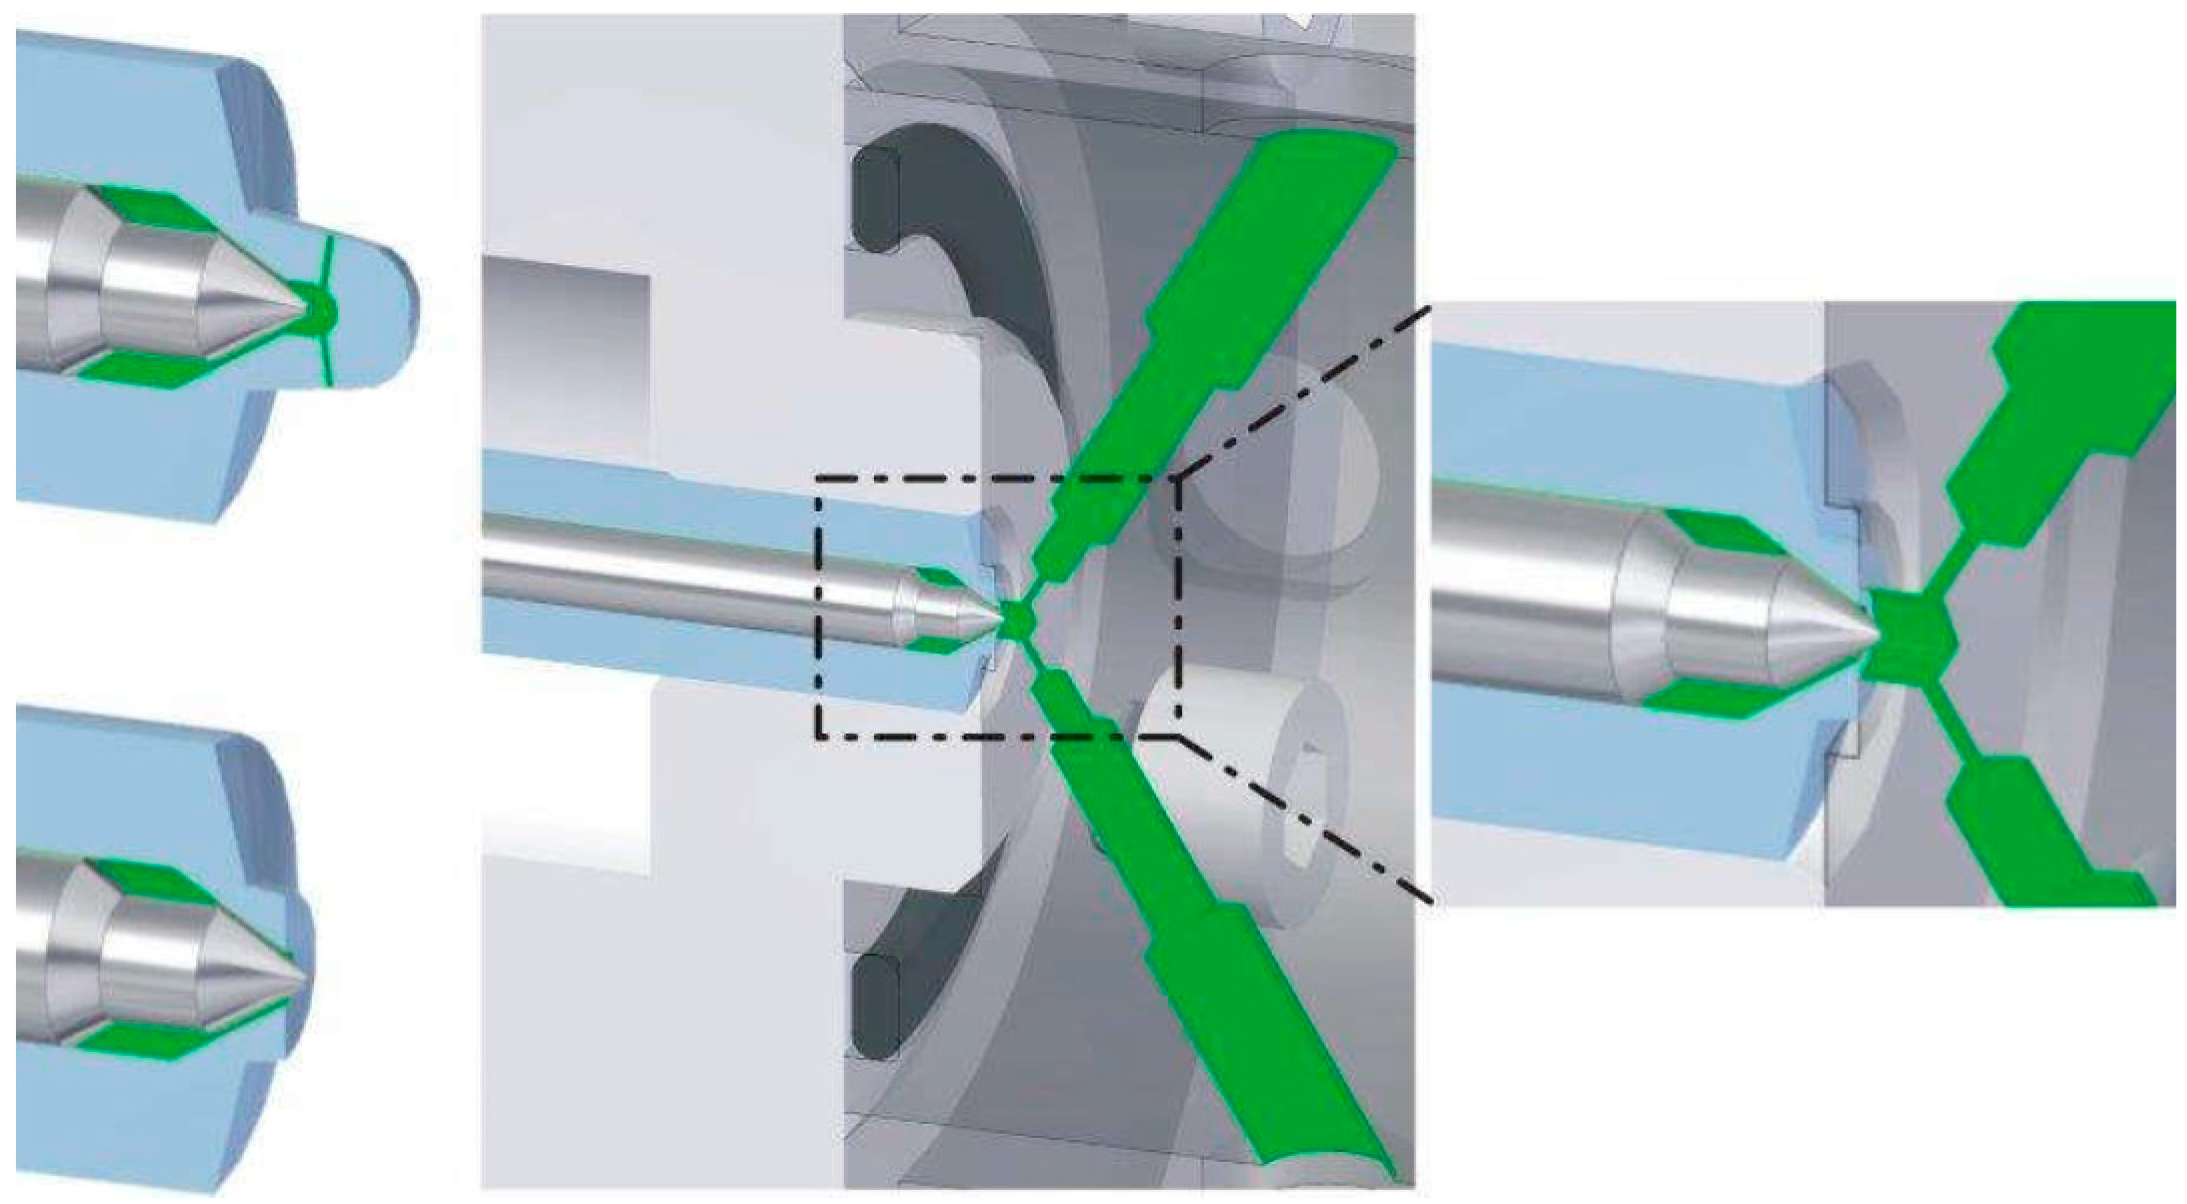
Optical accessible transparent nozzles are needed to investigate the cavitation phenomena inside the nozzle for the evaluation of the model capability [14]. For the approach taken, the tip of the original nozzle of the injector is removed with a fine milling process, Figure 7, left side. It is replaced by the transparent nozzle, being made from polymethyl methacrylate (PMMA), as this material has nearly the same refraction index as the fuel and allows the application of optical methods. Additionally, this material is sufficiently robust, if a suitable housing is constructed to absorb the forces of high-pressure fuel injection. With this setup, the nozzles were normally measured up to 100 MPa, and a maximum injection pressure of 180 MPa was feasible. The sac region and the injection holes are of original size. The outer body of the transparent part is much larger than the original, with plane surface area on the incoming and outgoing side of the optical path. In order to allow realistic injection hole sizes, bigger drilling holes are applied behind the exit of the nozzle (Figure 7, enlarged view on the right side, with the flow passages being indicated by a green color). With this arrangement the stability is given for the transparent nozzle, and the flow conditions inside the injector are realistic, while the spray breakup cannot be investigated here. The housing around the transparent nozzle is not shown in the figure. With such arrangements, it is possible to investigate transparent injectors with one, two or three nozzle holes. Because of the position of the cutting plane, the needle tip is visible through the transparent material.
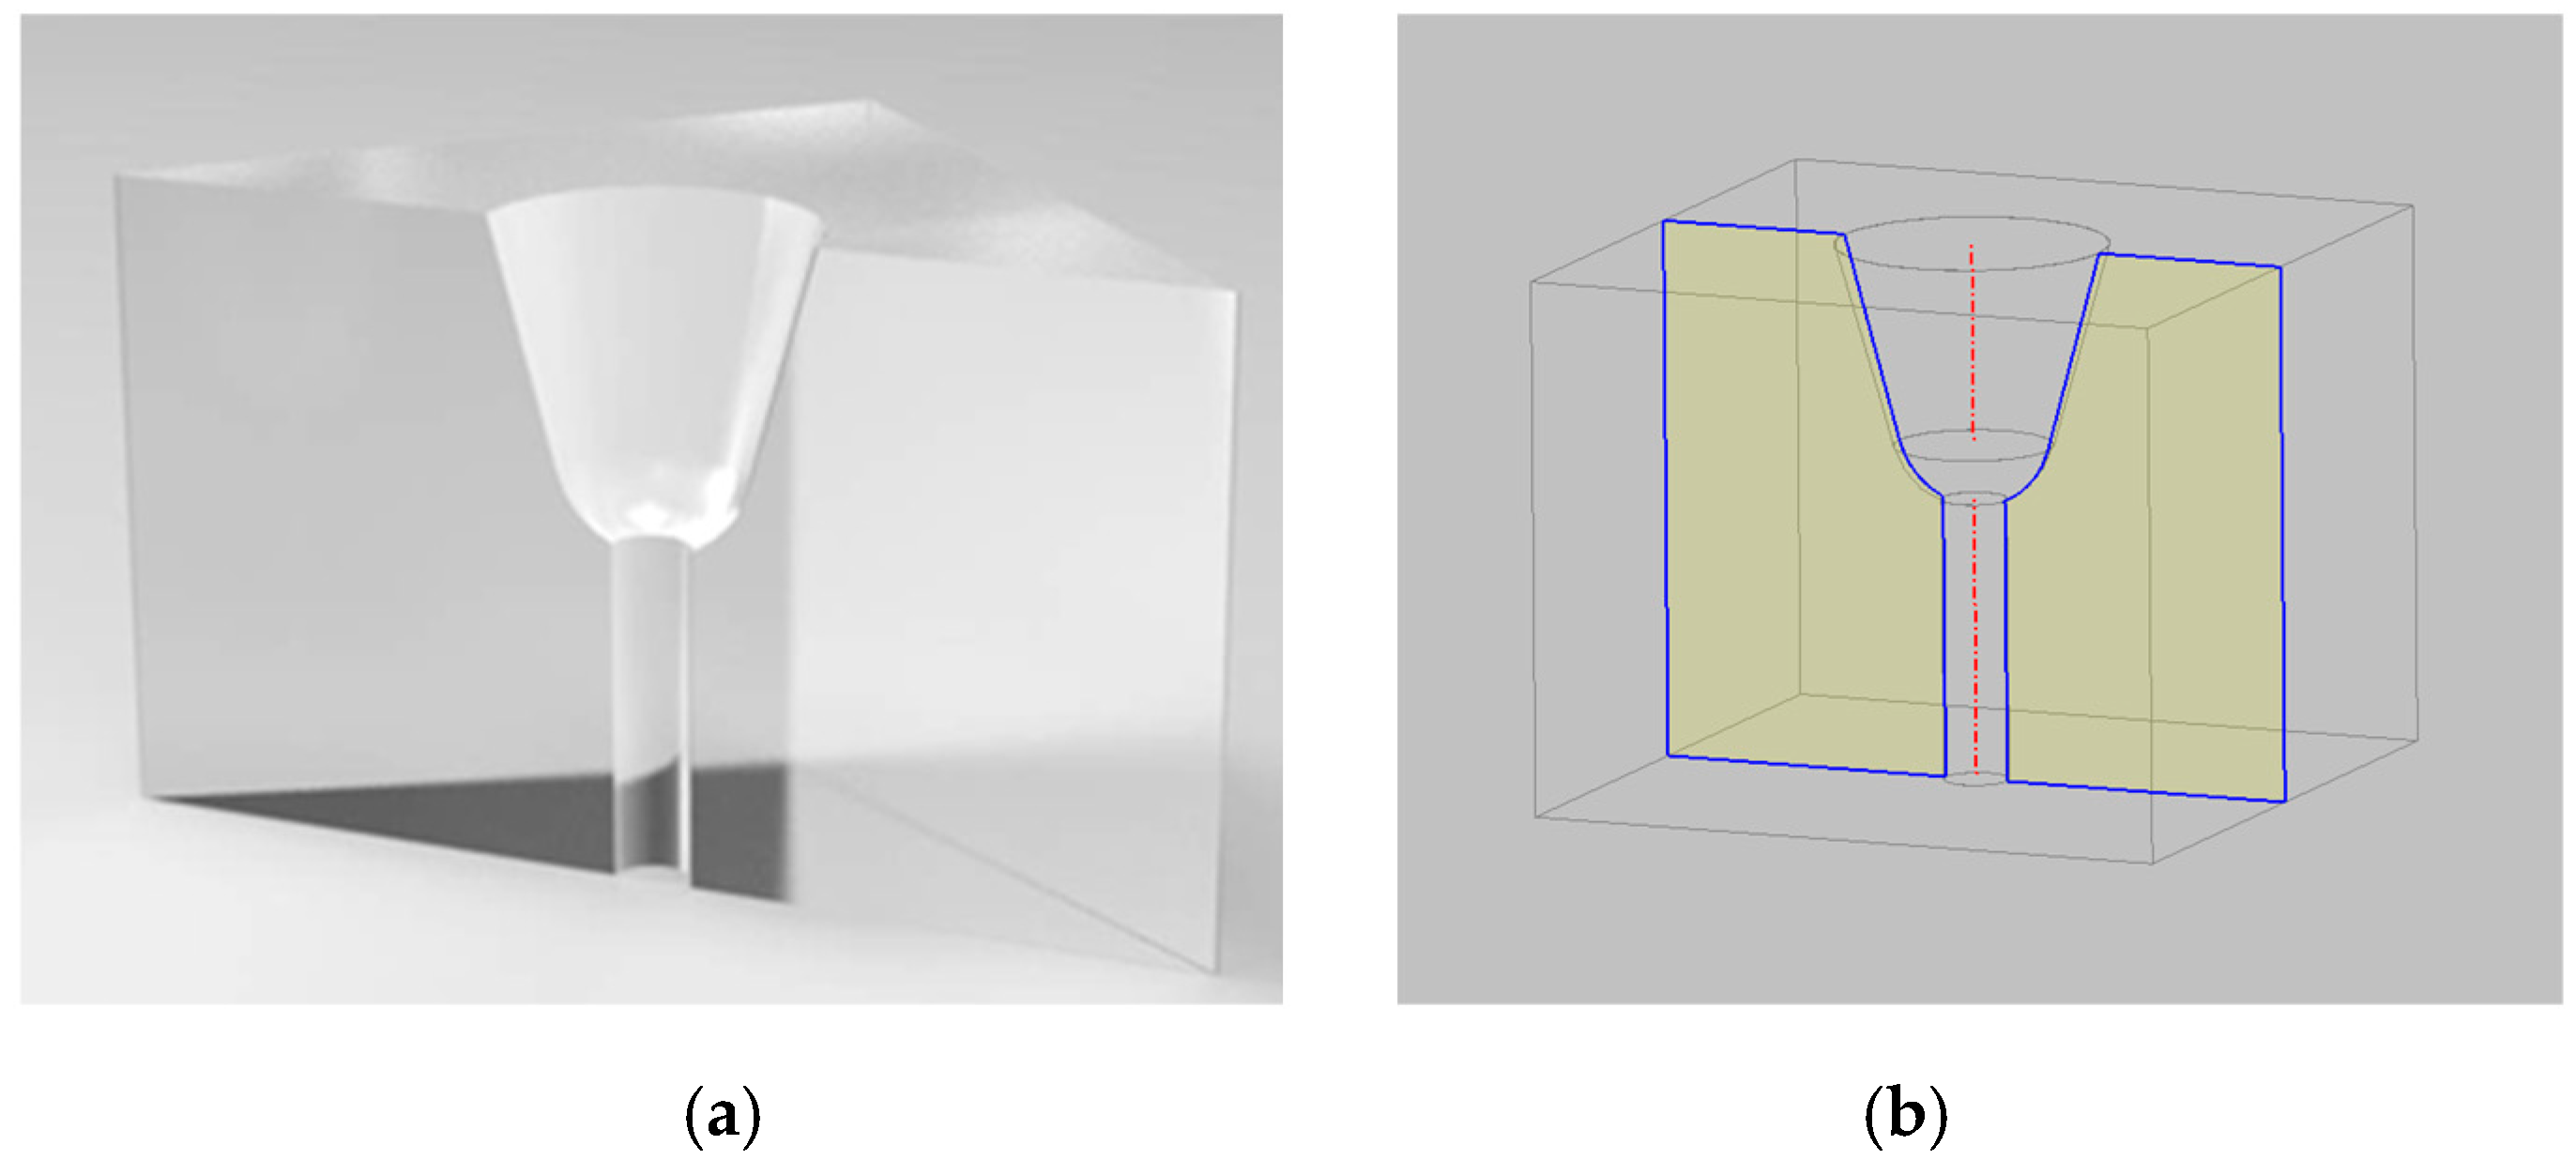
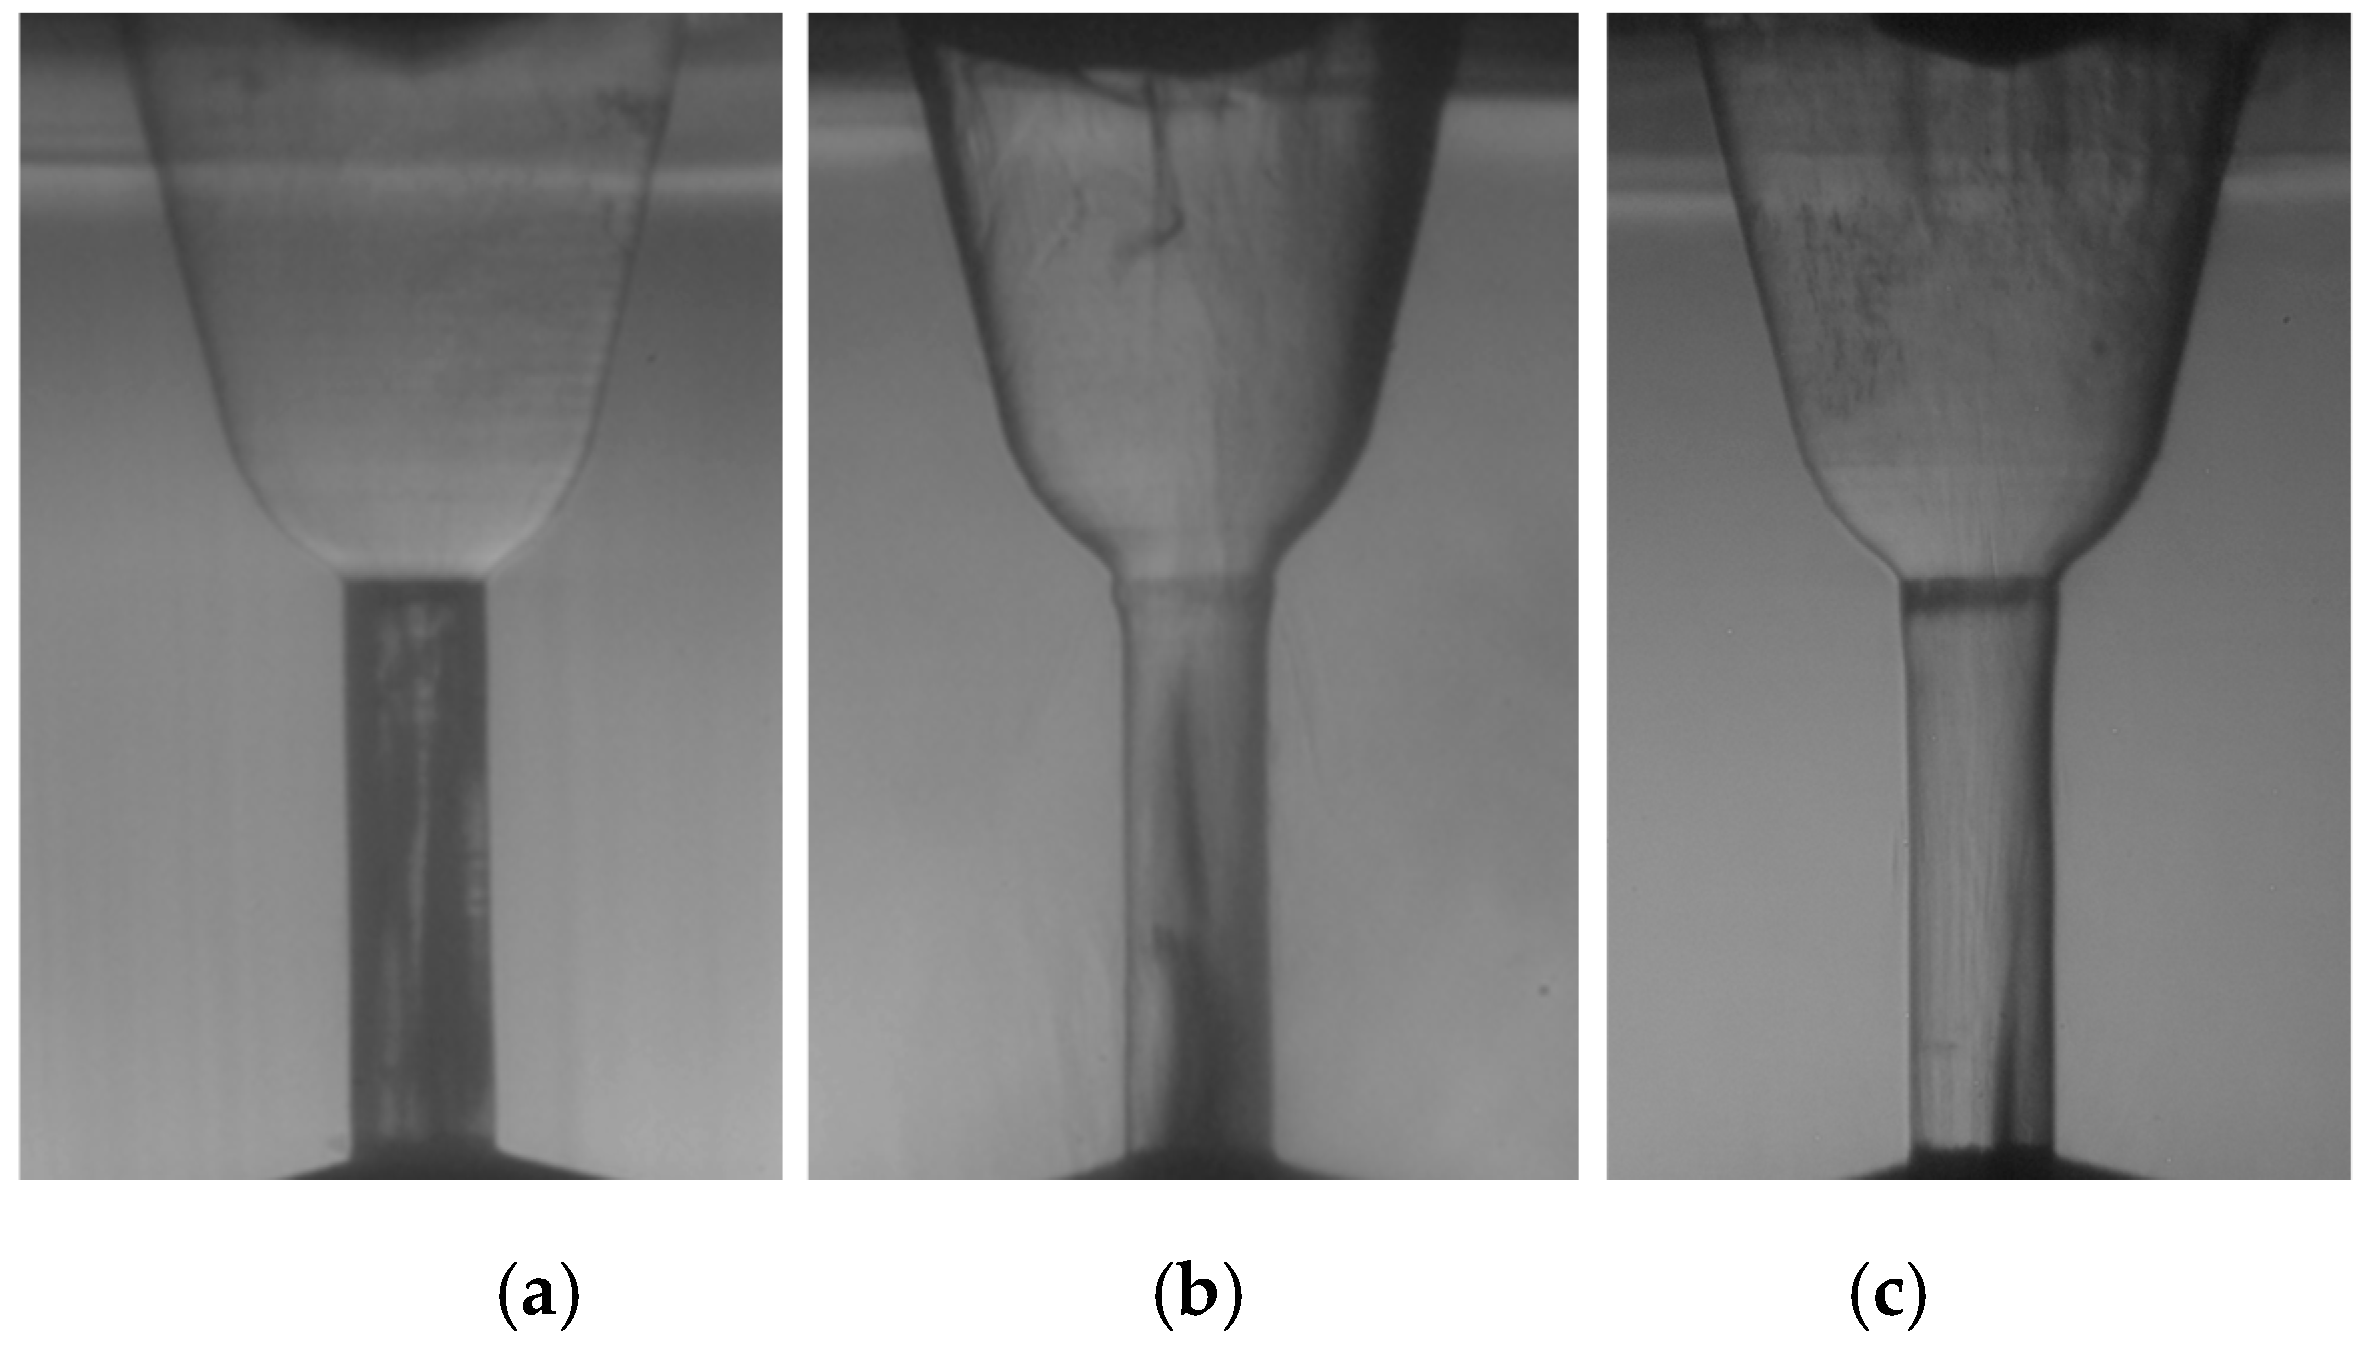
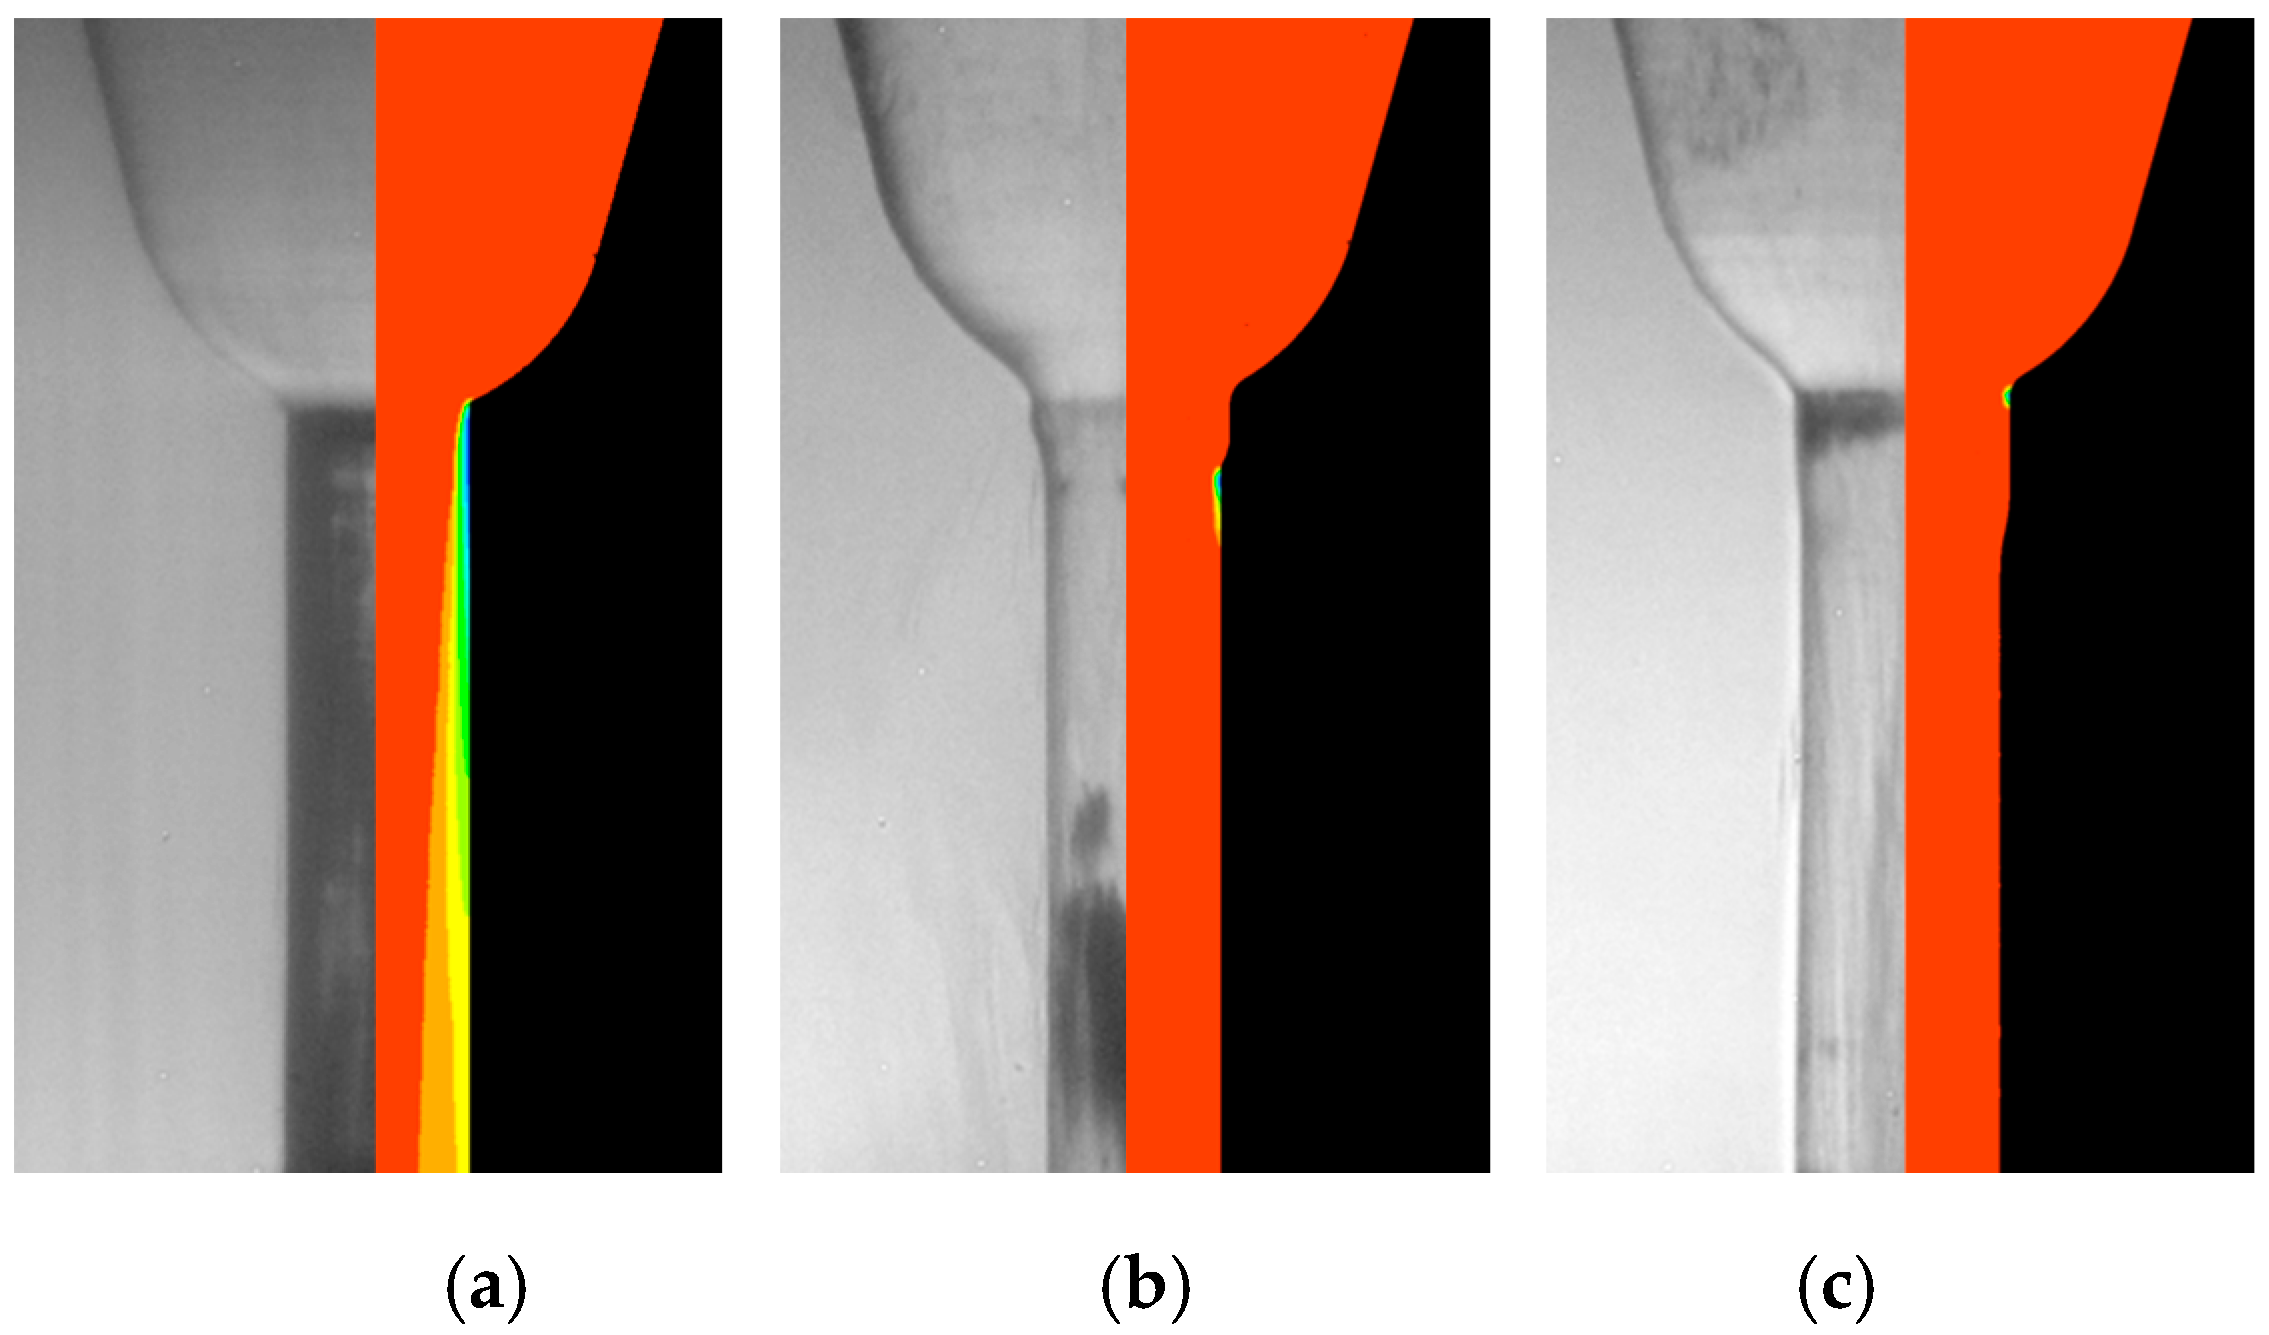
One basic geometry is a single hole nozzle, as is shown in Figure 8. The cylindrical orifice has a diameter of 200 µm and a length of 850 µm. The inlet of the orifice is slightly chamfered after drilling the orifice. Three transparent nozzles are manufactured with the same basic geometry (nozzle A). For two of them (nozzle B and C), a hydro-erosive rounding process is applied [15,16] to create a smooth curvature on their inlet. After this process, the actual nozzle shapes are slightly different (Figure 9). Both nozzles have a slight step at the nozzle inlet, being located for nozzle B “shortly” behind the inlet and for nozzle C about 100 µm downstream of the inlet (Figure 9). The detailed geometries of these cases are freely available on the Mendeley data base [17].
For the optical investigation of the cavitation region in the nozzle, a high speed camera with a long distance microscope was adapted to the injector setup. Additionally, the shapes of the transparent nozzles are traced from the images for generating the geometry for the comparable flow simulations. The transparent nozzles are slightly non-axisymmetric. In this study, the nozzle curvatures at the right and left side from the images were averaged and the axisymmetric geometries were used for the simulations. The experiments and simulations are performed under 60 MPa injection pressure. The phase interaction between two phases is defined by the mass transfer mechanism from the cavitation model of Schnerr-Sauer [18]. The Schnerr-Sauer model has been validated and discussed in earlier work [19,20] and by other research groups (e.g., [21,22]). There are tunable model constants, but in this study, the default constants are used, as the detailed modeling work is beyond the purpose of this publication. Preliminary and qualitative comparisons of the cavitation areas between experiment and simulation are presented in Figure 10. The left half of each image shows the high speed image of the cavitation at a quasi-steady state during the injection period. The right half side displays the calculated volume fraction of the liquid at the center cut plane of the nozzle. The red color indicates 100% diesel liquid, and the other colors indicate lower volume fraction regions with cavitation.
Nozzle A has an almost straight orifice and a sharp inlet. As cavitation depends strongly on the detailed shape, it is not suppressed here and it is clearly seen. The simulation results on nozzle A show a good agreement with the dark shadow graph images of the experiments here. The cavitation appears from the sharp inlet edge and the area stretches to the nozzle exit. It should be noted that the optical shadowgraphy integrates along the line of sight, so that the whole nozzle appears to be filled with phase transitions. The simulation predicts the gaseous phase on the outside of the nozzle until the nozzle exit. This corresponds to the experimental observation.
For the other two geometries (nozzle B and C) the inlet curvature section is different, being produced with hydro-erosive grinding, which, in these cases, has even led to slight steps of the diameter. The experiments show that the cavitation depends strongly on the detailed geometry, showing nearly no cavitation in the upper part of nozzle B and a cavitation cloud at the middle low of nozzle B, while for nozzle C, a small cavitation area is seen at the inlet corner. The detailed geometries are freely available on the Mendeley data base [17] for the modelling community, in order to develop models to predict such fine details. According to our preliminary comparisons, even using a standard model and constants, it was possible to predict the location of the beginning of the cavitation cloud, but it was not possible to predict the length of the cloud for the nozzle geometries B and C, and not the cavitation cloud in the lower part of nozzle B and string-like gradations in the center of the nozzle C. The prediction of these is also an important future topic.

3. Spray Development from Nozzle Orifices

The liquid jets are fragmented to ligaments or large droplets after leaving the nozzle orifice. The fragmentation is driven by the instability on the liquid column surface, which is induced by cavitation, turbulence and aerodynamic interaction between air and liquid. It is possible to measure the surface disturbance and the breakup process at low injection velocity conditions. However, at the velocity range of modern fuel injection systems, the liquid jets are fragmented almost immediately after leaving the nozzle orifice, and the fragmented liquids form a dense cloud surrounding the core of the jet. Therefore, it is difficult to measure optically from outside the spray. In the following, different approaches for measurements in the near field of the nozzle orifice are described. Although being difficult measurement approaches being applied near the limit of the measuring range, a first comprehensive description of the near spray process development is possible.

3.1. Determination of the Primary Spray Breakup with the Optical Connectivity Method

The liquid core of an injector breaks into structures and later into droplets within the spray. For the near field processes near the primary breakup zone the direct measurement is only rarely possible with common visualization techniques. Roosen has proposed an illumination of the liquid dense core from inside the nozzle in the early 1990th, allowing one to get an indication of the primary breakup length [23]. The laser light is guided into the injection nozzle to illuminate the liquid jet from inside. Roosen used fluorescent fuels for rather low injection pressures. Hardalupas and his team redeveloped and expanded this technique around 2009. They named it the optical connectivity method (OCM) and applied it to specially designed single hole injectors [24,25]. In our group, Heilig and Kaiser applied this measurement approach for the first time to a real-size Diesel injection nozzle and applied it also for high pressure injection [26,27]. The laser light is guided by an optical fiber into the sac volume of the nozzle and part of the light passes through the continuous liquid phase until it exits the nozzle orifice. The liquid dense core acts similar to an elongated optical fiber until it breaks into separate droplets or structures. On the boundary of the liquid phase, the light is emitted. With that, the optical connectivity method allows one to visualize the liquid dense core from inside the nozzle, and its structure becomes visible from outside the spray [26,28].
The OCM has the disadvantage, that a fiber has to be guided into the injector, which reduces the application flexibility within test cells with high temperatures. A modified OCM setup, the remote optical connectivity method (ROCM), has been proposed by Kaiser et al. 2015 [29]. Instead of a connected fiber between the laser and the injector, here, the incident laser light is focused on a short fiber core going through the wall of the injector tip. The fiber surface is polished and therefore the fiber acts as a laser incident window, through which the incident light passes into the sac of the nozzle. A part of this light illuminates the dense core at the jet exit from inside the nozzle (Figure 11a).
A single hole injector is applied with one nozzle hole with a length of 800 µm, a diameter of 120 µm, a conicity factor of 2 (slightly converging form) and a slightly rounded inlet corner of the nozzle hole with rinlet = 20 µm. Standard diesel fuel is injected for 2000 µs. Measurement examples are shown in Figure 11b for an early stage during the injection with tASOE = 0.4 ms (tASOE = time after start of energizing of the injector solenoid), and for the quasi-steady state of the injection with tASOE = 1.2 ms for three different injection pressures between 40 and 200 MPa.
Shown are exemplary single shot images. It should be noted that the images had to be filtered, as the focusing approach of the ROCM technique leads to background scatter [29]. Clearly seen is the evaluation of the spray, being shorter during the early injection phase. For the increased pressure cases, the spray length decreases, which is in accordance with the expectation.
From a statistical evaluation, it was found that the effect of increased injection pressure leads clearly to decreased dense core length, with measured values of 940 µm, 800 µm and 740 µm for injection pressures of 50, 100 and 150 MPa (for details, see [29]).
With a piezo driven three-hole diesel injector with a nozzle diameter of 115 µm, a conicity factor of 2 and 12 % hydro grinded inlet corners OCM measurements have been repeated with an improved optical setup, where the spatial resolution down to 1.5 µm per pixel was possible [30]. Here the same injector setup was also investigated with X-ray spray phase contrast imaging at the synchrotron in Chicago, with comparable high spatial resolution.
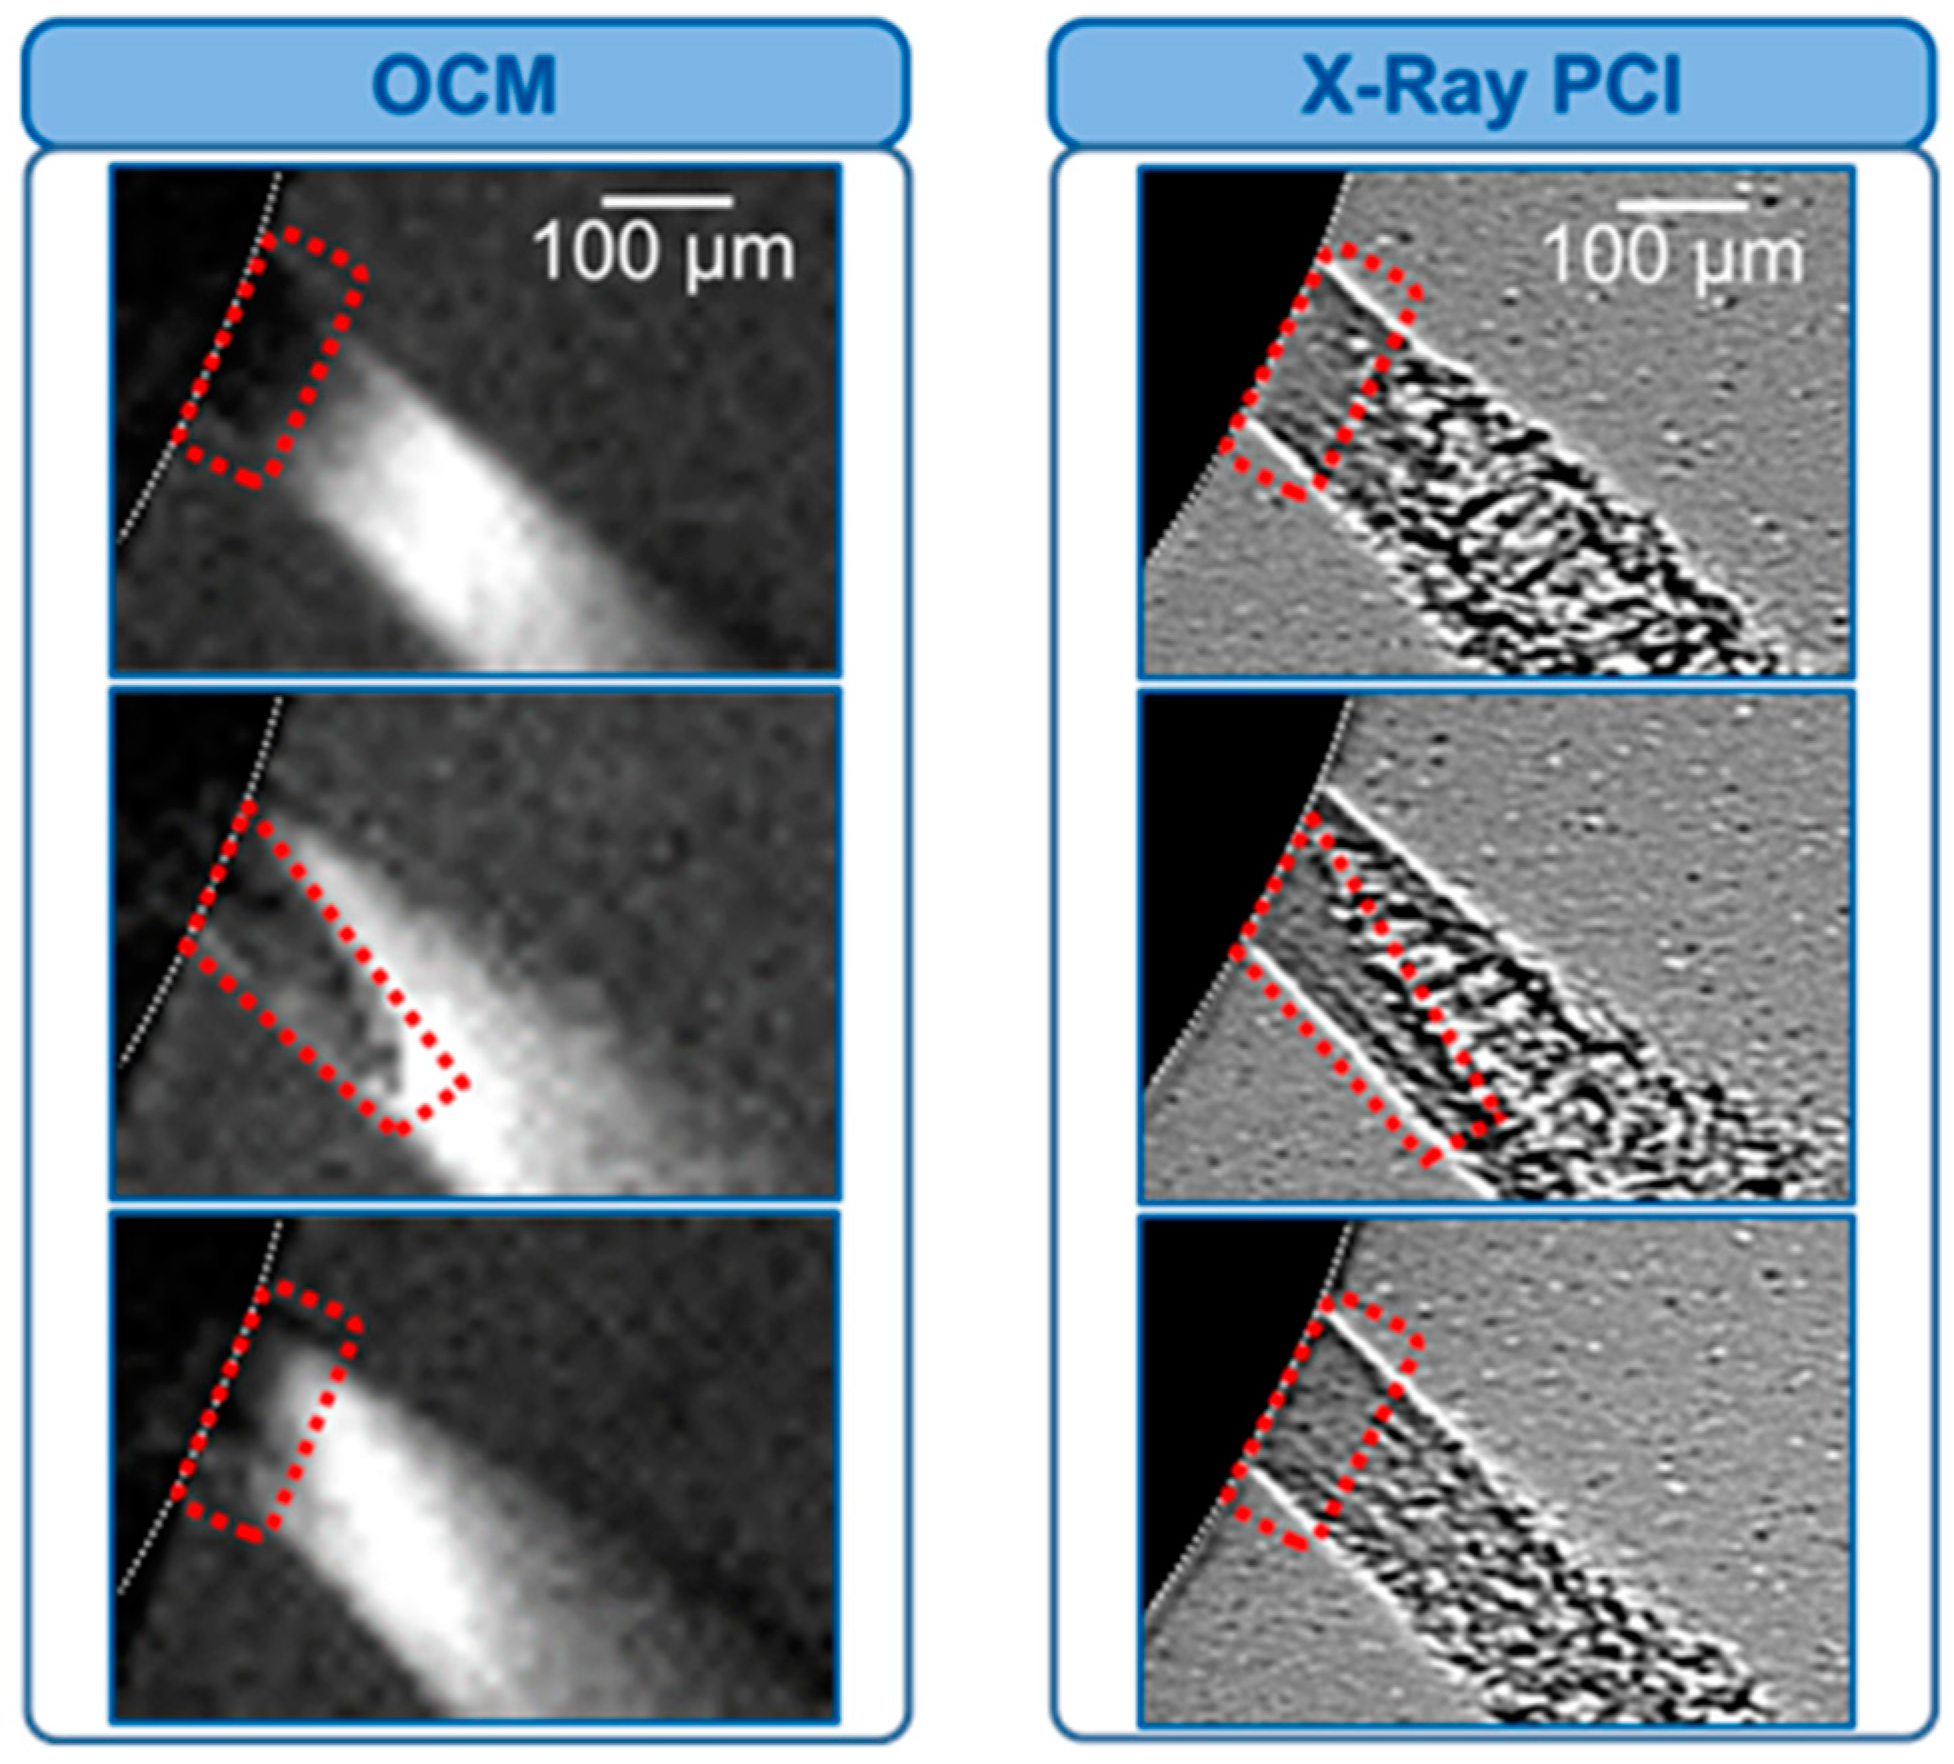
It was possible to resolve from the OCM not only the break-up length of the liquid dense core, but even more detailed information. It can be observed that directly behind the exit only low signal is visible from inside the injector. First, it was assumed that here the liquid dense core has a straight shape without perturbing structures. Here, only a small amount of light comes out of the liquid core due to total reflection inside. The X-ray phase contrast measurements confirm this assumption now very clearly (Figure 12). Here, no phase contrast is visible, showing that the liquid jet has a smooth surface. Even the unequally distributed spray structure can be visualized with both techniques with high spatial resolution, which is found for the steady injection state for this special injector (Figure 12, middle row, 1 ms ASOE). Both techniques confirm that the “non-perturbed length” can be measured (Figure 13, left side). This quantity refers to earlier measurements of Payri et al. [31], and it corresponds well with the smooth surface of a fuel jet being visible with other reported X-ray radiation [32].
In Figure 13 (right side), the measurement results of both quantities are plotted for injection pressures between 25 and 100 MPa. In the case of asymmetric values, the average is used. The measured values of the non-perturbed length are determined to be very similar for both measurement techniques. The value decreases with increasing pressure from 150 to 100 µm. The breakup length (sometimes being referred to as dense intact core length) is measurable only with the optical connectivity method, while it cannot be determined with the X-ray phase contrast technique. Here, the broken surface contributes already significantly to the visualized structures of the phase contrast method, so that the end of the intact core is not distinguishable with this measurement approach. For the investigated injector, the breakup length decreases again with increasing pressure, for this injector configuration from 330 to 280 µm.

3.2. Near Nozzle Velocity Measurement with the Structural Image Velocimetry

Velocity measurements are commonly based on the determination of the movement of droplets or tracer particles, or at least structures between two or more instants of time. For the very near region of the spray, the phase surface between liquid and gas could eventually give the required velocity information. Limitations are the very small scales, the high velocity, multiple scattering in the high dense spray region and eventually missing visible structures in the very near field of the spray. One successful approach is based on time dependent double point measurement of the structure, assuming that it moves downstream without changing the structural elements between the two measurement points. With two focus points in the main spray direction, the laser correlation velocimetry (LCV) method (Chaves et al. [33]) allows one to determine spray velocities, even very near the exit [34,35,36,37], with the help of a cross correlation evaluation of the two time-dependent signals.
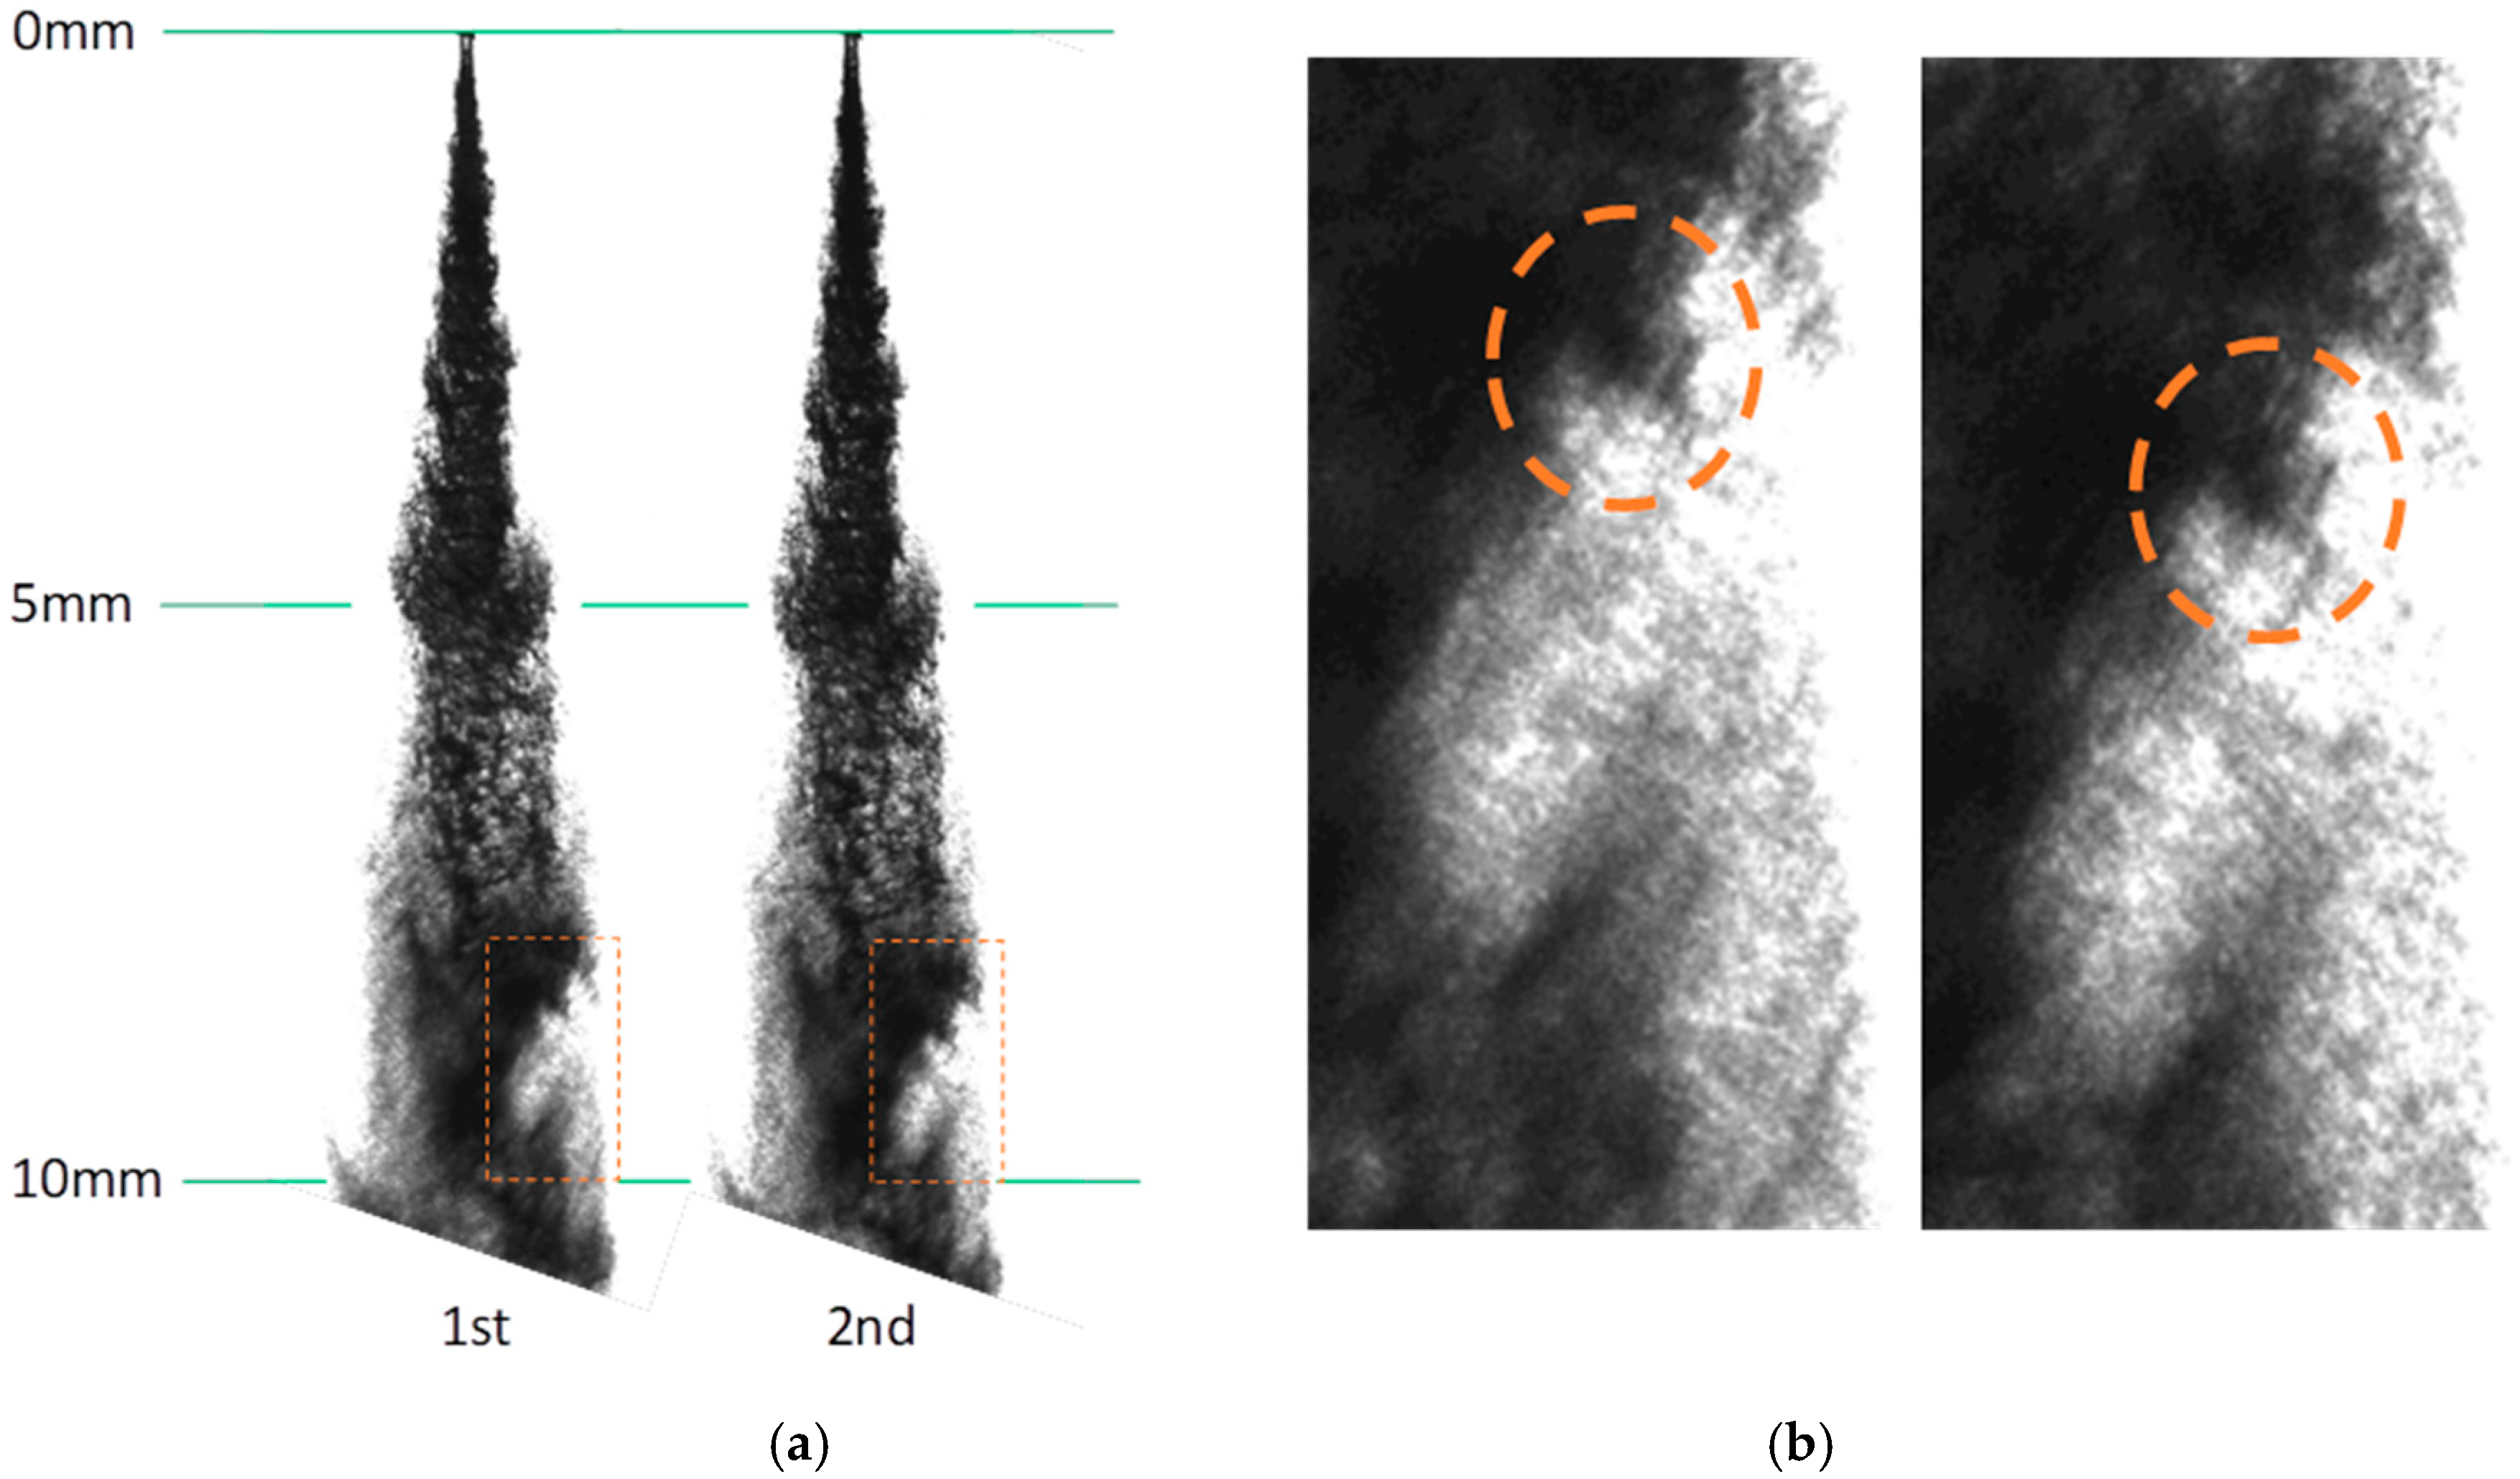
In our group, the structural image velocimetry (SIV) method was proposed in 2013, being based on direct double imaging with high resolution spray shadowgraphy [28]. With a double-shutter camera and a long distance microscope, image pairs can be obtained with time difference in the order of 1 µs. The working principle can be seen in Figure 14 for a 50 MPa injection process. The method is based on the observation that structural elements and gradations inside the spray are moving, as is highlighted on the right side, in this case with approximately 250 m/s.
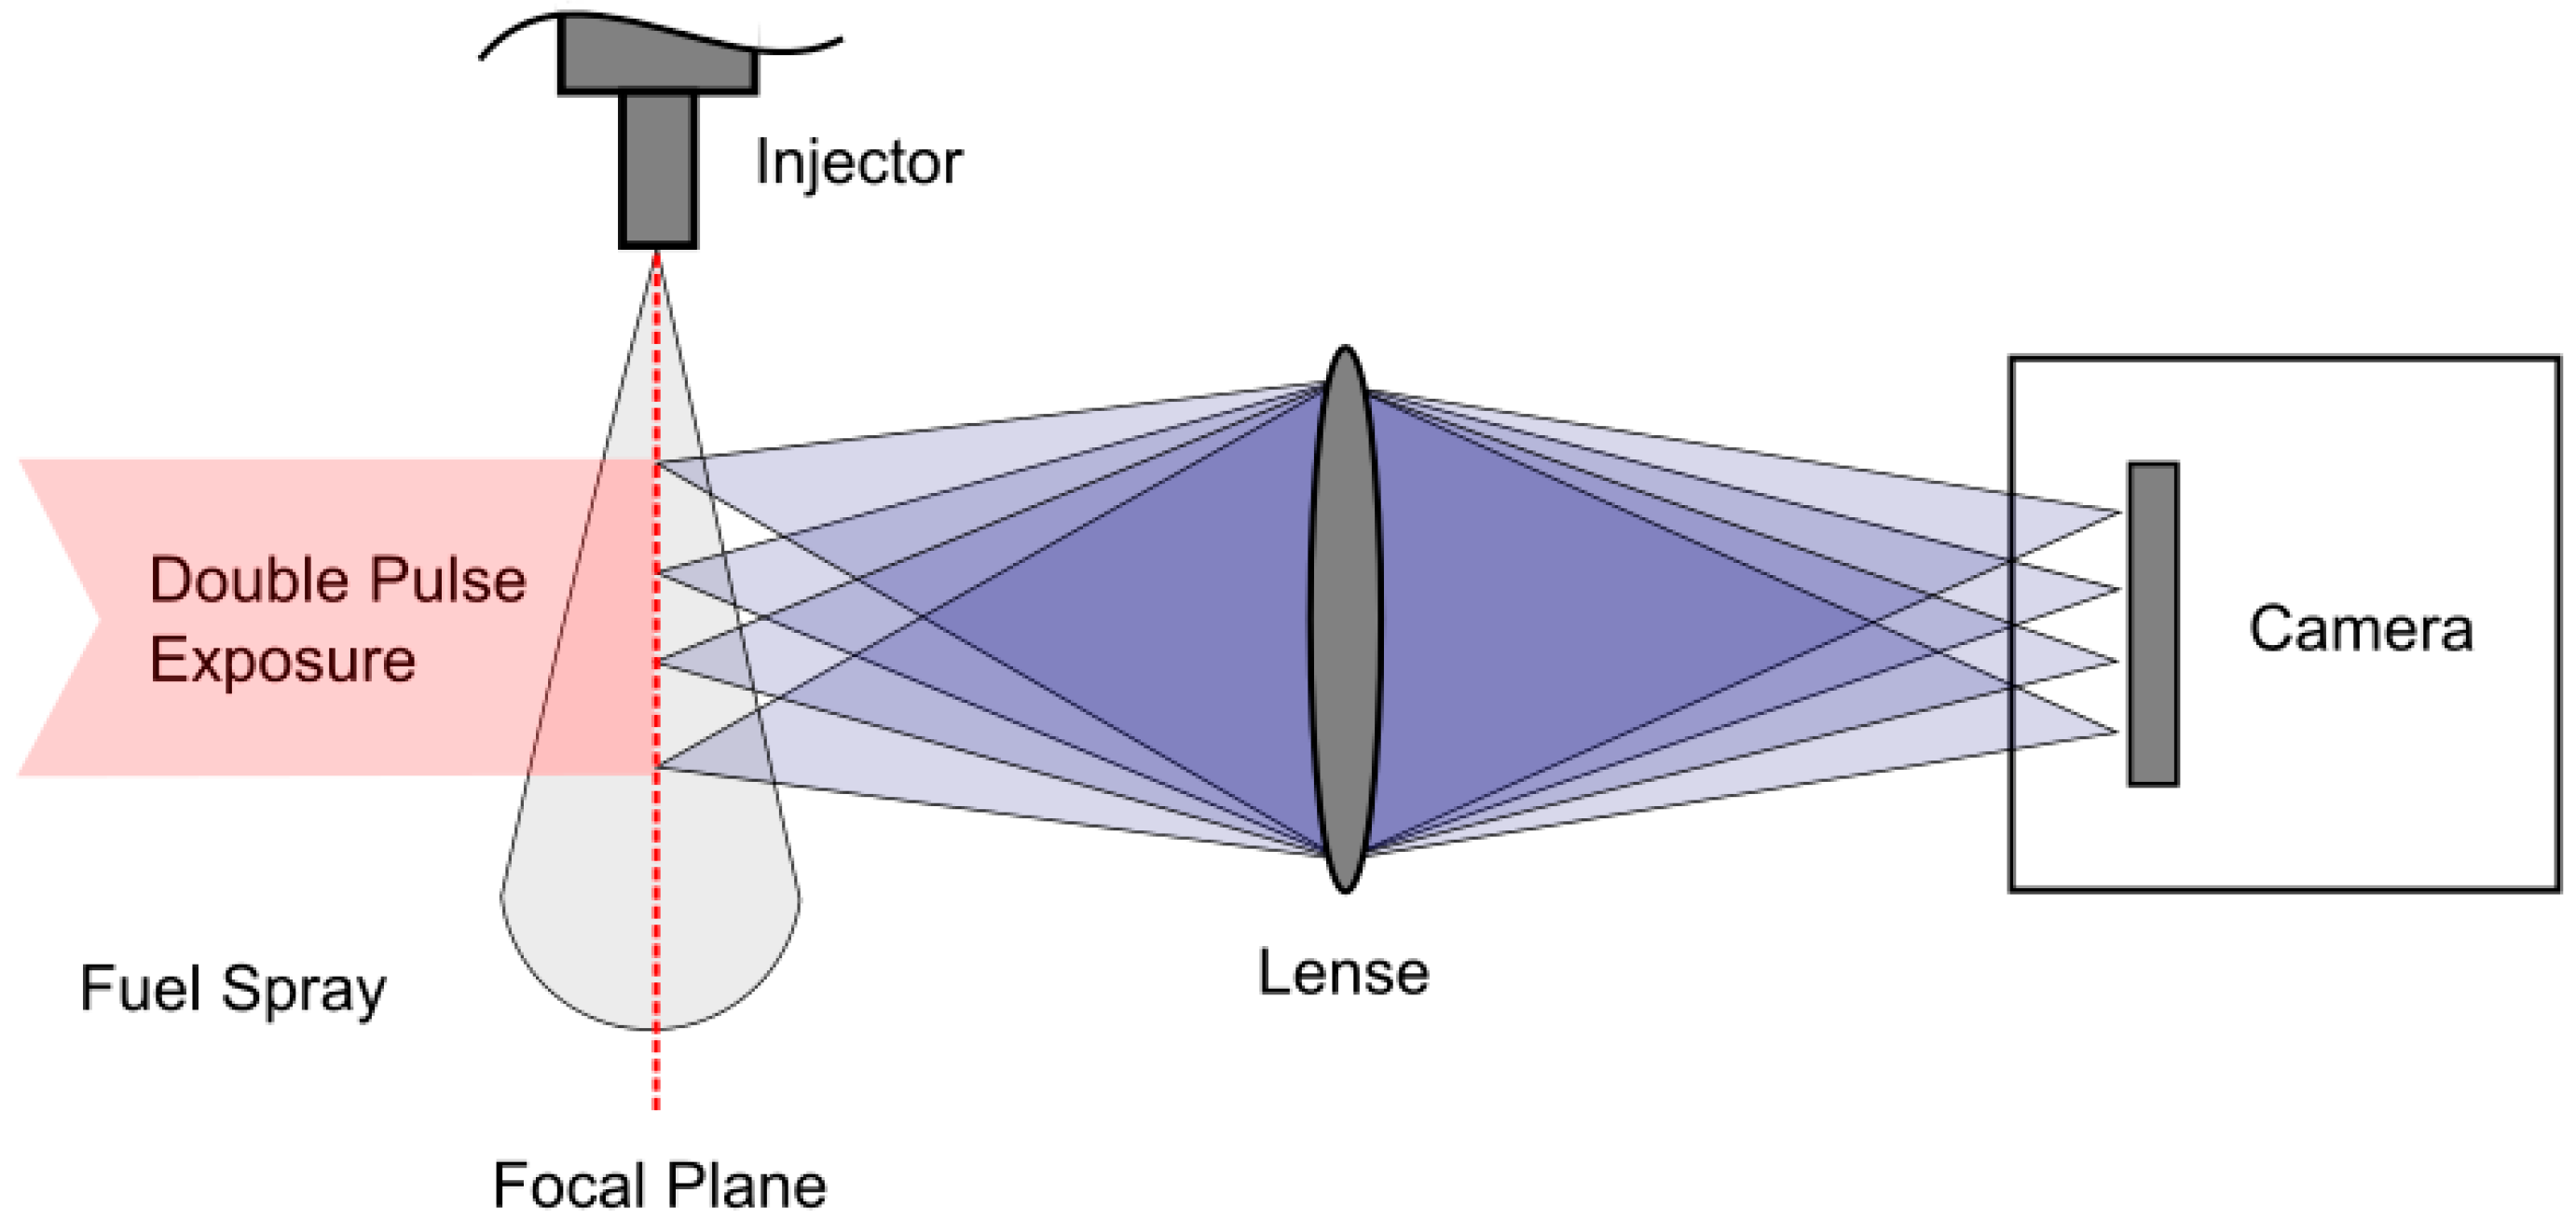
Similar to the LCV technique, the SIV approach can evaluate the velocity of such movements, as long as sufficient structural elements are detectable. For the automatic evaluation of velocity fields, the structural image velocimetry (SIV) follows the approach from particle image velocimetry (PIV), which is based on the evaluation of the spatial cross-correlation between two consecutive images [28,38,39]. The approach has some similarities to the optical flow method from Goldlücke et al. [40], where a similar evaluation approach is applied for the velocity determination of the tip and rim of large scale sprays during the early spray injection process. For the SIV approach, the velocity distribution inside the spray is evaluated from the moving structures inside the measured spray. According to the working principle, the velocity is especially evaluated from the object plane of the lens and camera system (Figure 15). However, the structural movements behind and in front of the image plane are also giving contributions to the autocorrelation signal in the camera plane. This can be reduced, if the focal length of the lens system is as small as possible.
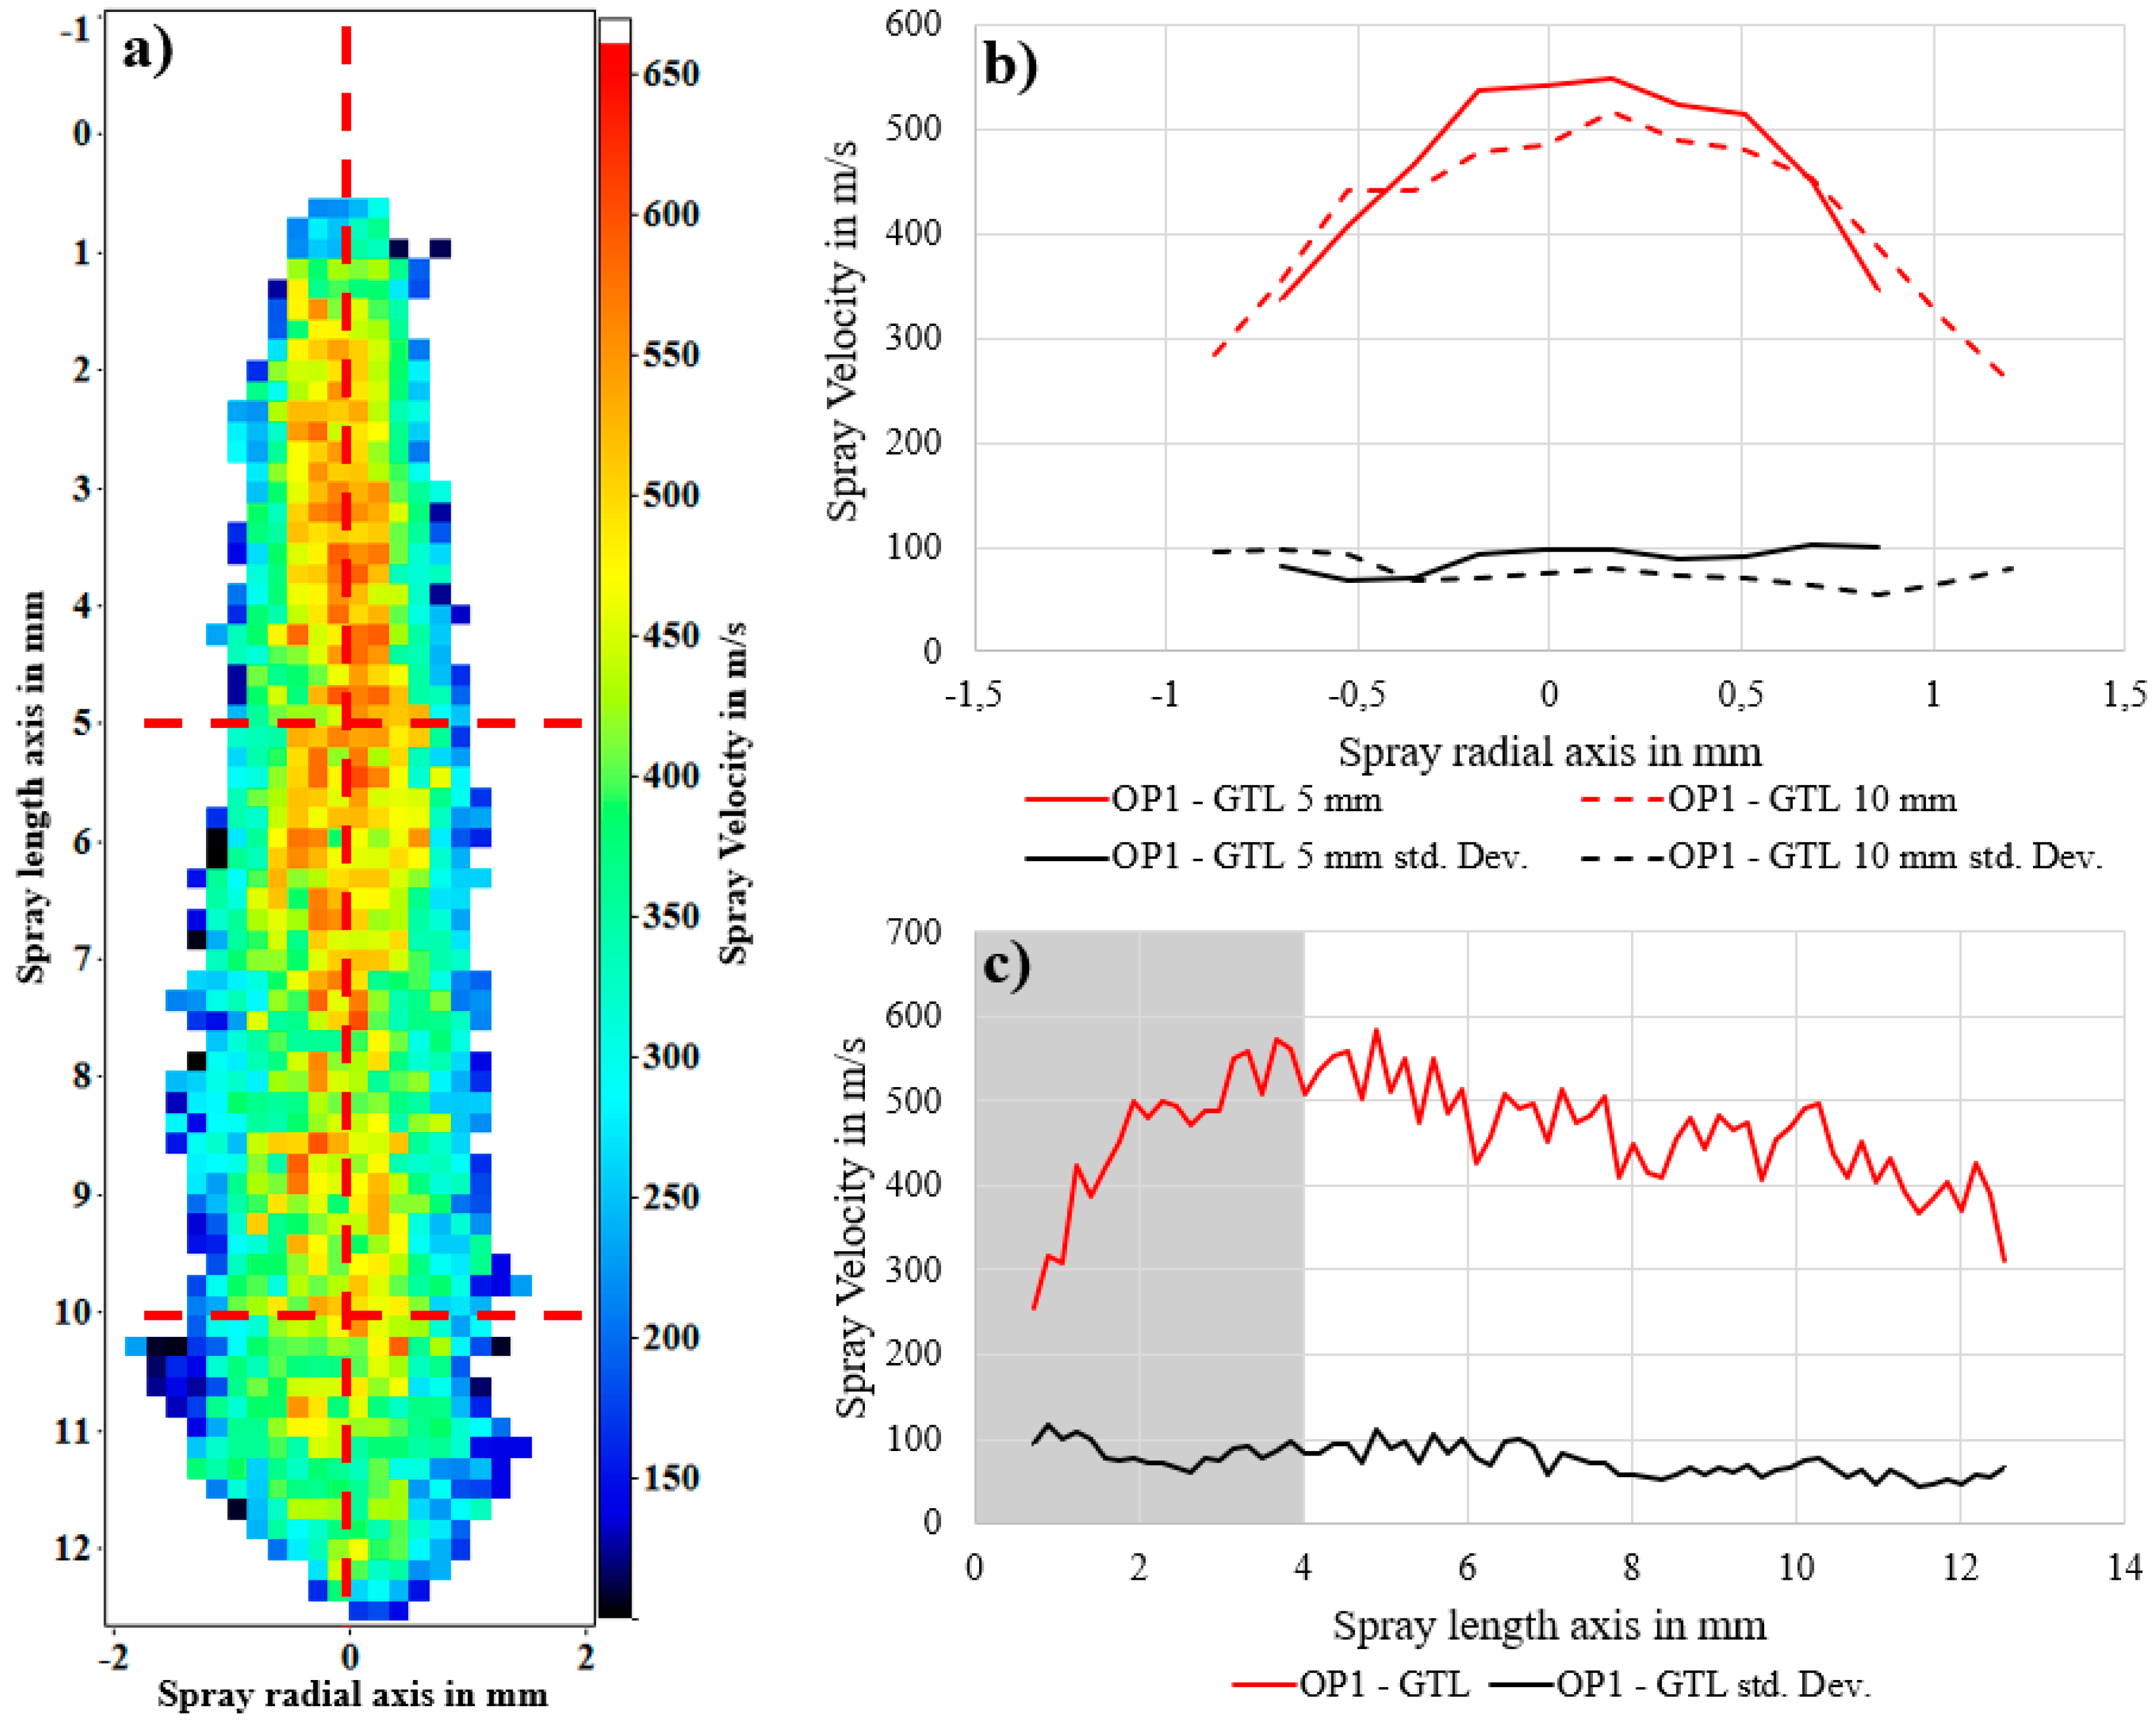
Figure 16a shows the evaluated velocity field of a fuel spray measured at 150 MPa injection pressure by high speed SIV for the similar injector, where the OCM and the X-ray measurements have been reported; see before. The color indicates the magnitude of the velocity. The vertical axis indicates the distance from the injector nozzle. The SIV method evaluates relatively high velocities (red) between 2 and 6 mm downstream from the nozzle around the spray center. Low velocities (blue) appear on the edges of the spray. The velocity distribution in the radial direction of the spray (Figure 16b) shows the high value in the center and the low value at the periphery in both positions at 5 mm downstream (red solid line) and 10 mm downstream (red dotted line). This tendency on the radial velocity profiles fit well with the common understanding of spray velocity distribution.
The velocity on the spray axis (red solid line) is shown in Figure 16c. The velocity from 4 mm downstream the injector is well comparable to the expectation. In [41], a comparison is done with other approaches to determine the spray velocity (from multiple illumination with X-ray scattering and from L2F measurement discussed below) and with the expectation from the measured flow rates and from the Bernoulli equation (assuming no friction and no cavitation), within about 20 percent, if the slope of the decreasing part is extrapolated to the nozzle exit. It is found that for Diesel sprays up to 100 MPa, the difference between the approaches results in exit velocities, even within 10 percent. Near the nozzle region the SIV velocity is reduced compared to the expected axial profile. Here, obviously, the spray structure is too dense and not dispersed enough for the SIV application to be discriminated. We define the applicable range, therefore, from the range where the axial profile decreases continually, while the range very near to the nozzle is marked out (gray background, having a width of 4 mm for 150 MPa and 2–3 mm for up to 100 MPa [41]). The radial profiles of the SIV values are very near to the expectation in Figure 16b. Neubauer [42] shows that the X-ray velocimetry gives too high velocities in the border regions of radial distributions, which can be understood with the property of X-ray velocimetry that small droplets below approx. 8 µm are not visible there (depending on the pixel resolution), which is consistent with the assumption that these are more dominant in the outer spray part.
Standard deviations (black lines in Figure 16b,c) are almost constant for the entire spray. It seems that this quantity depends essentially on the correlation window size being constant in this evaluation. It is likely that the application range of the SIV technique can be expanded with more applied adjustments of the correlation window size and higher spatial resolution images.

3.3. Velocity and Size Measurement with Laser 2-Focus Velocimetry

After primary breakup, the spray droplet or ligaments are fragmented to small droplets aerodynamically. It is possible to obtain the velocity of the droplets by a laser 2-focus velocimeter (L2F) [43], based on the measurement of time-of-flight when a droplet passes through two foci. The L2F has a highly concentrated measurement volume and therefore it is possible to adverse the effect of multiple scattering from the droplets in dense sprays. Ueki et al. showed that the velocity and the size of droplets can be simultaneously obtained by adding the measurement of time-of-scattering to the L2F [44].
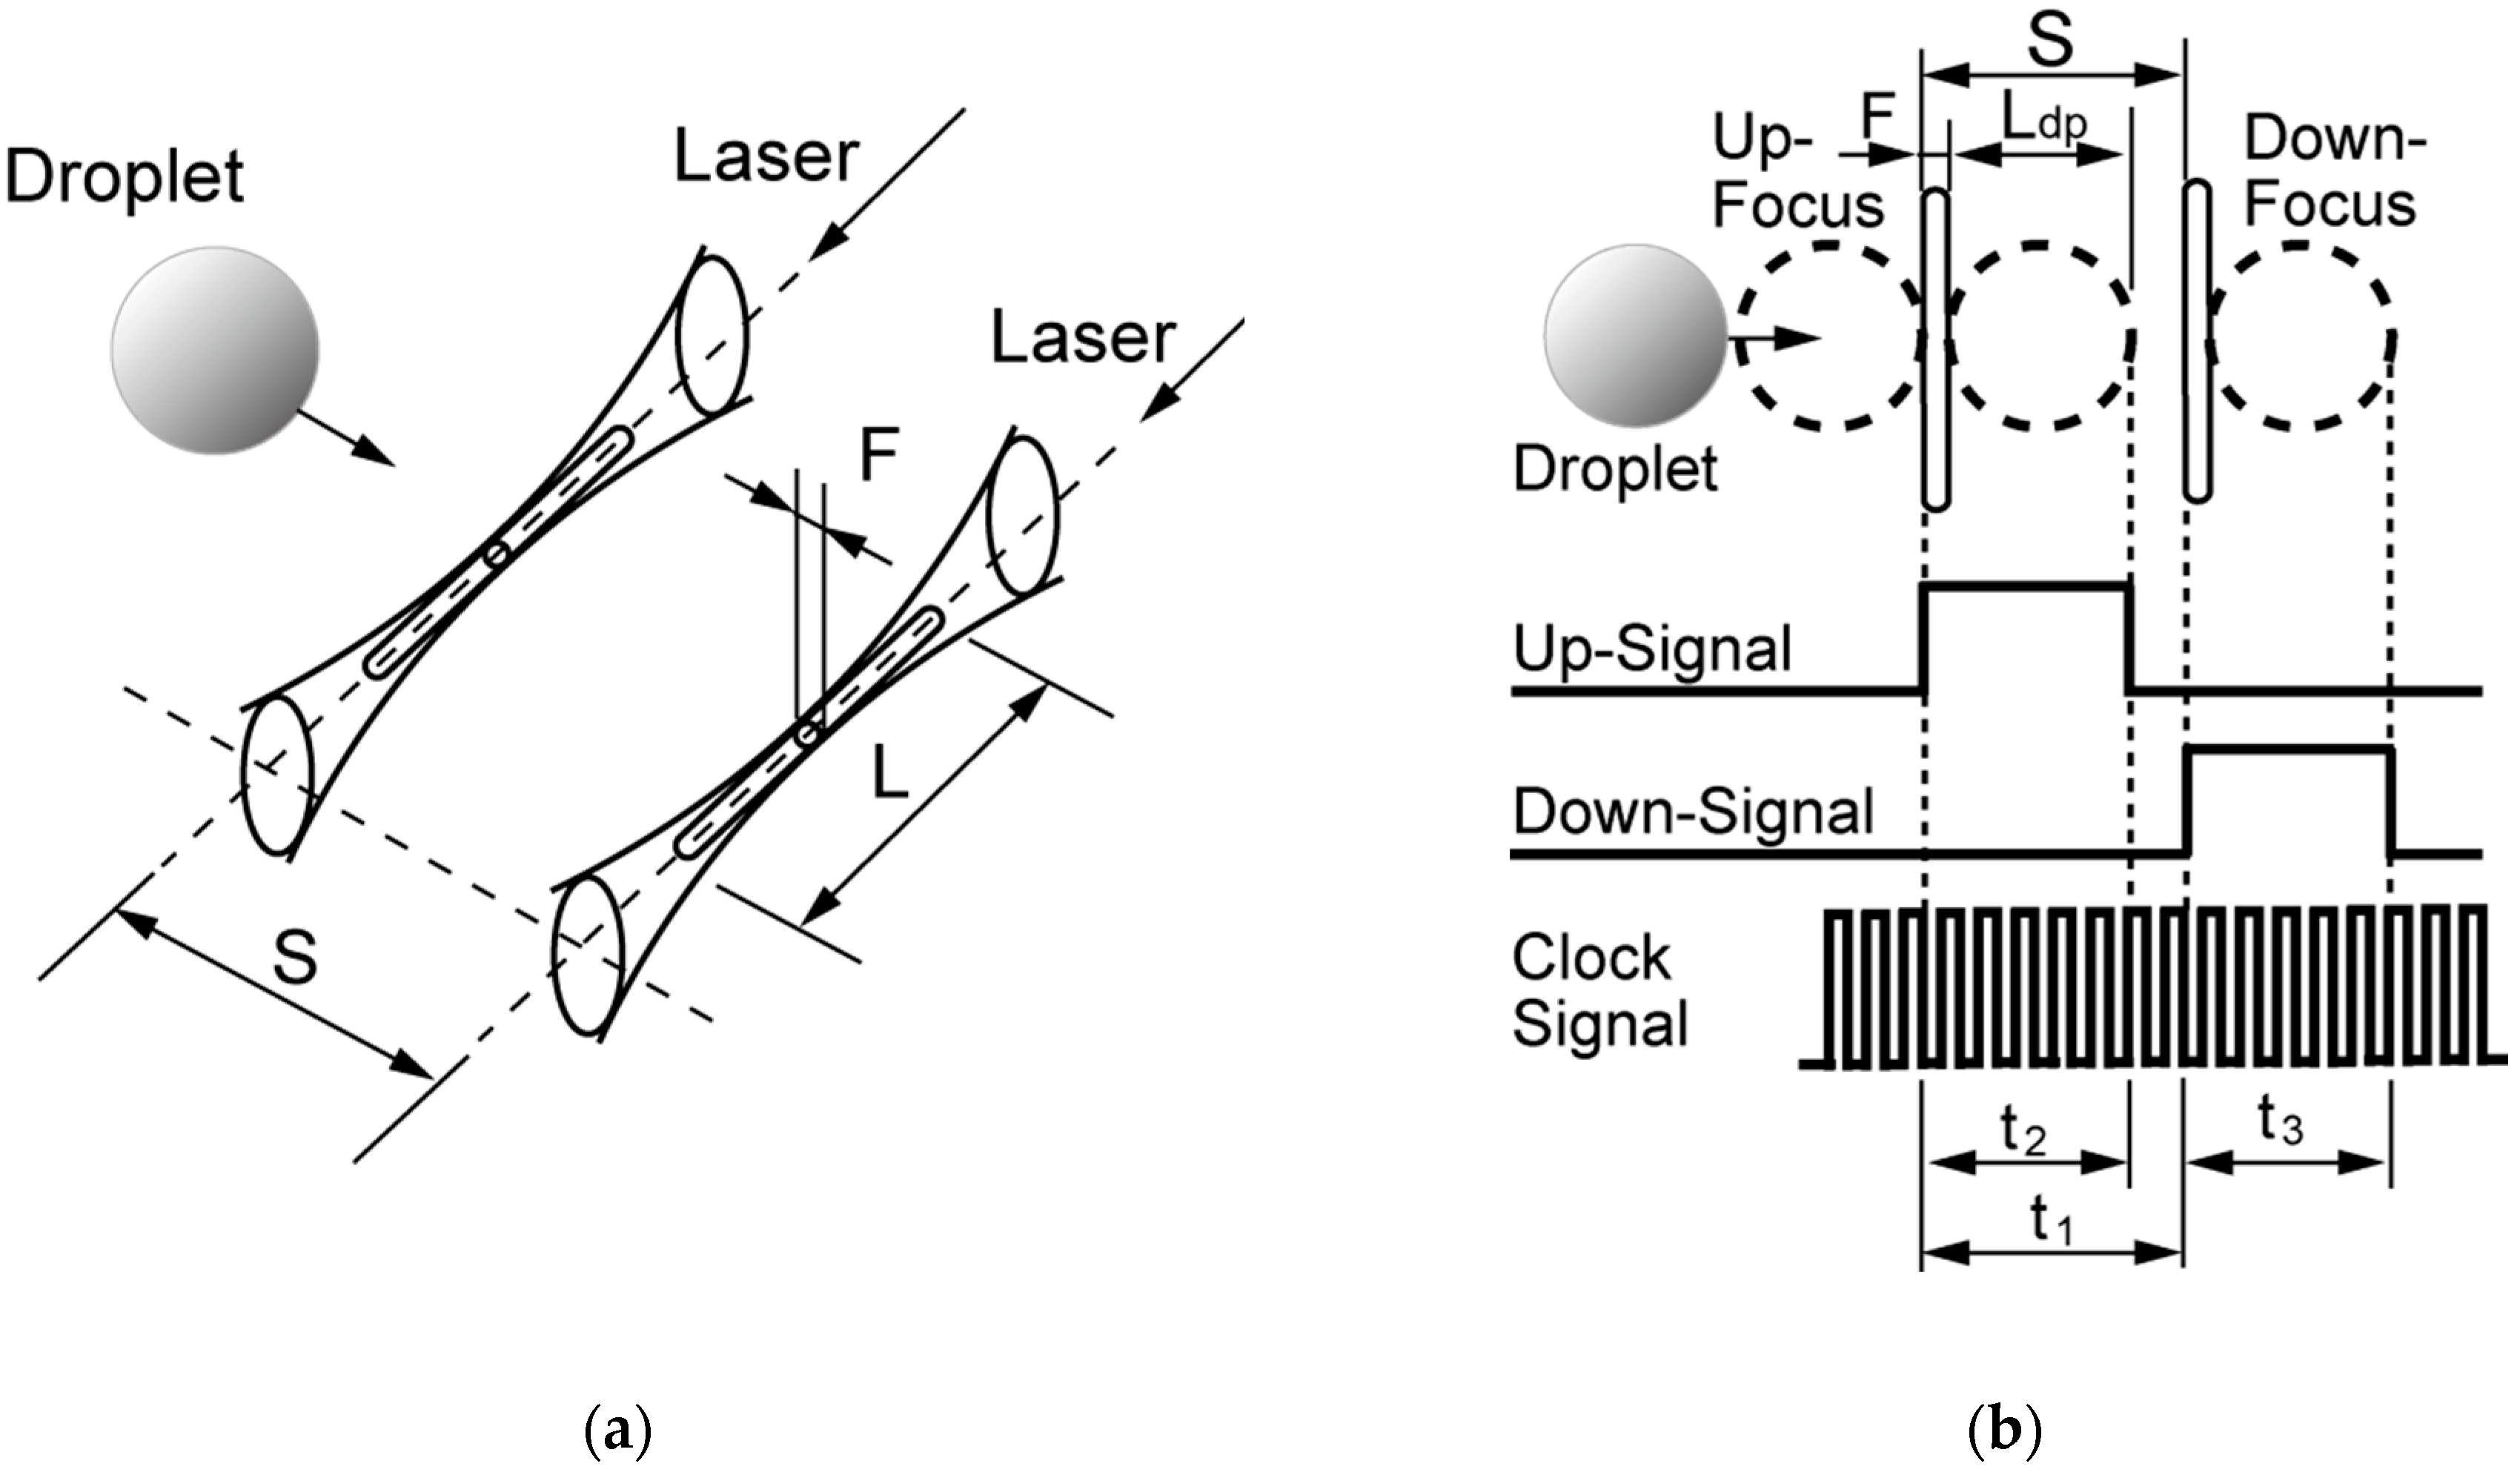
The light probe of the L2F consists of two highly focused laser beams, as shown in Figure 17a. The size F of the focus is about 3 μm, the distance S between two foci is 25 μm, and the length L is about 20 μm in the direction of the optical axis. When a droplet flies through both upstream and downstream foci, time-of-flight t1, time-of-scattering t2 on the upstream focus and time-of-scattering t3 on the downstream focus are measured. The velocity of a droplet is obtained by dividing the distance between two foci S with the measured time-of-flight t1. The schematic diagram of the time counter of L2F is shown in Figure 17b. The ratio of the time-of-flight and the time-of-scattering corresponds to the ratio of the distance between two foci S and the droplet size Ldp plus the focus size F. The time-of-scattering can be estimated by averaging two time-of-scattering values. Then, the droplet size Ldp can be estimated.
According to the basic L2F measurement principle, it is possible to measure droplets correctly only in the case that the same droplet appears at the foci sequentially. In order to exclude signals from different droplets or from droplets passing diagonally, the data which has an imbalance of time-of-scattering at both foci is filtered out. After this process, a velocity bias correction and a statistical processing for cutting outliers is applied. Due to this multi-stage processing, the valid data rate is around 10%. Therefore, 20,000 samples were collected on each measurement position to obtain enough valid data. The details of this data processing and its effectiveness have been discussed in [45].
Figure 18 shows the time resolved velocities on 50 MPa injection pressure condition. The measurements were performed under a collaborate research with Nagasaki university. The solid line shows the result from the L2F measurement. The dotted line indicates the velocity calculated from the mass flow rate measurement at the same condition. The droplet measurement by L2F is carried out 10 mm downstream from the nozzle (z = 10 mm) on the spray axis. For comparison, the calculated velocity from the measured mass flow rate is shown, assuming an averaged velocity at the nozzle exit without any losses. The velocity profile by L2F shows a similar curve to that from mass flow rate.
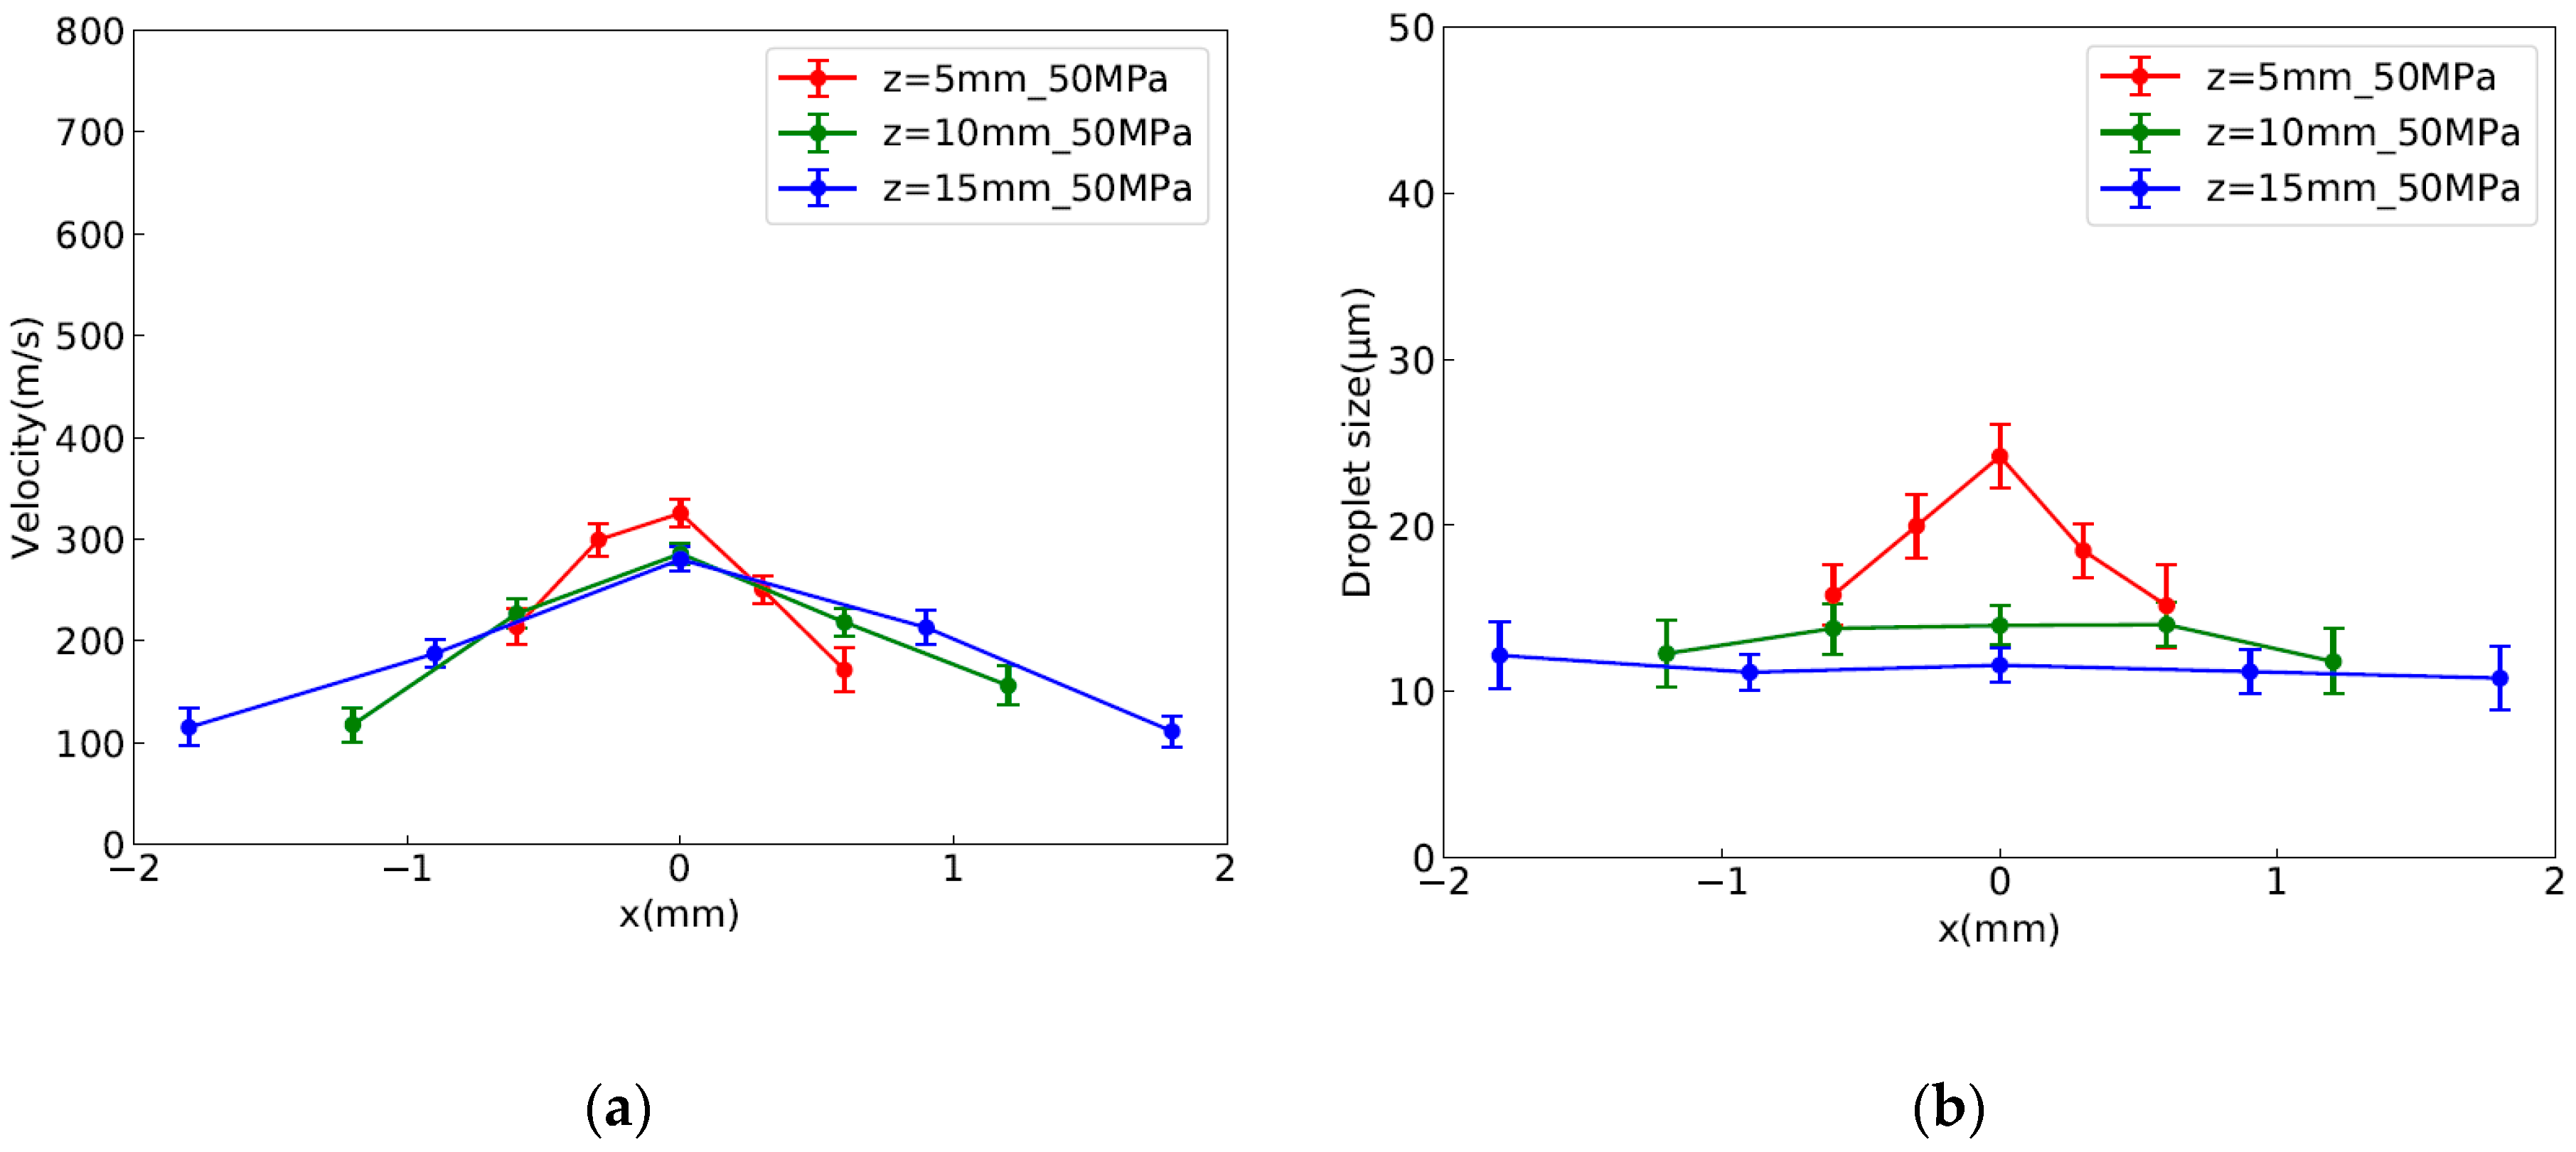
Figure 19a shows the spatial distribution of the droplet velocity at t = 1.2 ms ASOE on three planes of z = 5, 10 and 15 mm from the nozzle exit at 50 MPa injection pressure condition. The velocity data were averaged in a period of 0.1 ms from t = 1.15 to 1.25 ms (middle of the injection period). The velocity was highest at x = 0 mm on z = 5 mm and decreased with increasing the distance from the nozzle exit. The velocities in the spray periphery are lower, as is expected. Figure 19b shows the spatial distribution of the droplet size at the same conditions of Figure 19a. The droplet at the spray center decreased with the distance from the nozzle exit. At the z = 5 mm plane, the droplets show the highest sizes at the spray center, decreasing to the sides. This tendency does not appear on the other measurement planes.

4. Comprehensive Discussion on the Spray Processes near the Nozzle

The flow and atomization characterization of high-pressure injection systems inside and near the injector nozzle is challenging, due to very small dimensions and the optical dense and strongly transient nature. Up to now, many of the transient processes inside the injector and in the primary breakup region have been assumed, based on indirect evidence. In order to reach a comprehensive experimental based knowledge, several partly new and mostly optical measurement approaches are described in this work. Within the boundary that the optical access is limited to single, double or triple-hole injectors, we are able now to come to a more comprehensive discussion on the processes of high-pressure sprays.
Firstly, investigations about phenomenon inside the nozzle were focused. The X-ray and neutron transmission imaging techniques were applied to obtain the detailed nozzle geometry for defining the 3D geometry of an injector for the numerical simulation of the 3D flow inside the nozzle. The needle lift and needle tumbling were measured from the sequential images by X-ray transmission imaging techniques. Together with earlier reported measurements of strong cavitation inside the injector, and in the injection holes during the first 300 µs of the lifting process [22,23], we can state that the needle geometry and its movement has a significant influence on the transient spray processes, leading eventually also to an asymmetric spray pattern. The results of the 3D flow simulations show the flow pattern being highly affected by the detailed geometry [19,20]. This emphasizes the importance of detailed measurements on the nozzle geometry. For that, experiments with transparent nozzles have been designed, with a special focus on detailed geometry, where the injection pressure can especially be increased up to 180 MPa (1800 bar). As an example, the measured cavitation structures with 60 MPa are discussed in Chapter 2.3. These measurements, as well as the detailed geometry data of these injectors, will be provided for the community for the development and validation of numerical simulation models via the Mendeley data base [17]. As an example, the experimental results were compared with own numerical simulations based on a standard literature model, discussed in Chapter 2.3. The starting positions of the relatively large and stable cavitation clouds on the wall can be predicted well. However, the size of the cavitating area, unsteady string cavitation or film cavitation are not yet predicted with these models. Detailed measurements on high pressure conditions are needed here to allow validation data for the model development and test. Further enhanced geometric setups for such transparent measurements have to be evaluated, e.g., with three holes, where the redirection effects of the flow inside the injector are regarded as well. For the future, it would also be of value if the details of the turbulence production induced by the collapse of cavitation bubble in the nozzle flow could be measured quantitatively.
Secondly, investigations on the spray development near the nozzle have been conducted. One valuable approach is the application of the optical connectivity method (OCM) for the direct determination of the length of the primary break-up of the liquid core. In earlier publications, we were able to show that this length decreases with increasing injection pressure [26,28], which agrees well with the theoretical expectation. Typically, the time dependent OCM signal starts later than the injection, with a delay of about 300 µs, and it stops before the end of injection. Both fit very well to the observations in transparent injectors of strong cavitation behavior inside the whole nozzle during the opening and closing process of the injector needle. For full cavitation, the light for the OCM signal is disrupted. Heilig [27] also showed that the spray cone angle near the nozzle is significantly increased during this opening and closing process, being directly correlated to the appearance of the OCM signal. From that, the theoretical idea that the cavitation induced increased turbulence which, by itself, increases the spray breakup, can be confirmed.
The OCM technique was also applied in comparison with X-ray synchrotron measurements for the same injector and injection conditions [30]. With highly resolved OCM, not only the break-up length of the liquid dense core, but also an even more detailed length of the cylindrical smooth liquid jet in the first 100 µm behind the injector can be seen, as here, only a small amount of light comes out of the liquid core. With that, also the “non-perturbed length” can be measured. This quantity refers to earlier measurements of Payri et al. [31], and it corresponds well with the smooth surface of a fuel jet being visible with X-ray phase contrast method [32]. Even the details of the asymmetric behavior of the smooth jet surface is found to be comparable between OCM and X-ray radiation [30]. The “non-perturbed length” decreases with increasing pressure, similar to the break-up length. It can be noted that the breakup length (dense core length) is not visible from an X-ray phase contrast method, as the wrinkling of the surface gives the dominant signal here.
As the OCM technique requires an optical fiber to be introduced into the injector tip, this technique is limited to spray injection experiments without ignition and combustion. In order to overcome this limitation, the remote optical connectivity method (ROCM) was developed, where the light is delivered with a focused laser beam to a transparent orifice to be guided into the interior of the injector. Moreover, with the ROCM technique, it was possible to visualize the dense core of the injected spray in the near field of the nozzle and its influence with increasing injection pressure. A challenge for the application of the ROCM is stray light near the injector.
As a third approach, further techniques have been applied to measure the spray velocity as near as possible to the exit of the injector. Although not investigated in our group, it turns out that the laser correlation velocimetry (LCV) technique allows the nearest determination of the high velocity spray near the exit of the injector, as being developed by Chavez et al. [33,34], and being further developed and applied by several groups for velocity measurement very near to the spray exit. Here, the temporal cross correlation evaluation of two focused points with short focal length on the observation side allows the detection of moving structural elements (moving boundaries between liquid and gaseous phase), in some cases already very near to the spray exit in the sub-mm range.
An extension of this measurement principle to the movement of spatially measured structures has been proposed and applied with the structural image velocimetry (SIV) [28]. Here, the velocity of structures is determined from double imaging, with the evaluation similar to the particle image velocimetry (PIV). The measurement plane is defined from the short focal length of the imaging optics, but not from a laser sheet in PIV, as this is not possible in the near field of the spray. With that, the discrimination between structures moving in the measurement plane is better than for X-ray velocimetry approaches, as they integrate along their optical path (not discussed in this paper). However, it is lower than for the LCV approach, as for the SIV approach, only on the detection side is the differentiation between moving structures in the intended measurement plane and before or behind possible. However, from the spatially resolved measurements, it is easily possible to determine the usable measurement range from the condition that the axial profile decreases in injection direction. For the diesel injector measurements, this condition is given from 2-3 mm downstream of the injector onwards, for injection pressures up to 100 MPa and from 4 mm onwards for 150 MPa injection pressure. Radial profiles follow this expectation. Here, it can be mentioned that X-ray velocity measurements are given to high velocities outside of the spray axis, which can be explained from the situation that here typically smaller droplet structures are located, which are not seen from the X-ray technique. Details of this comparison are described in the recent PhD thesis of Neubauer [42].
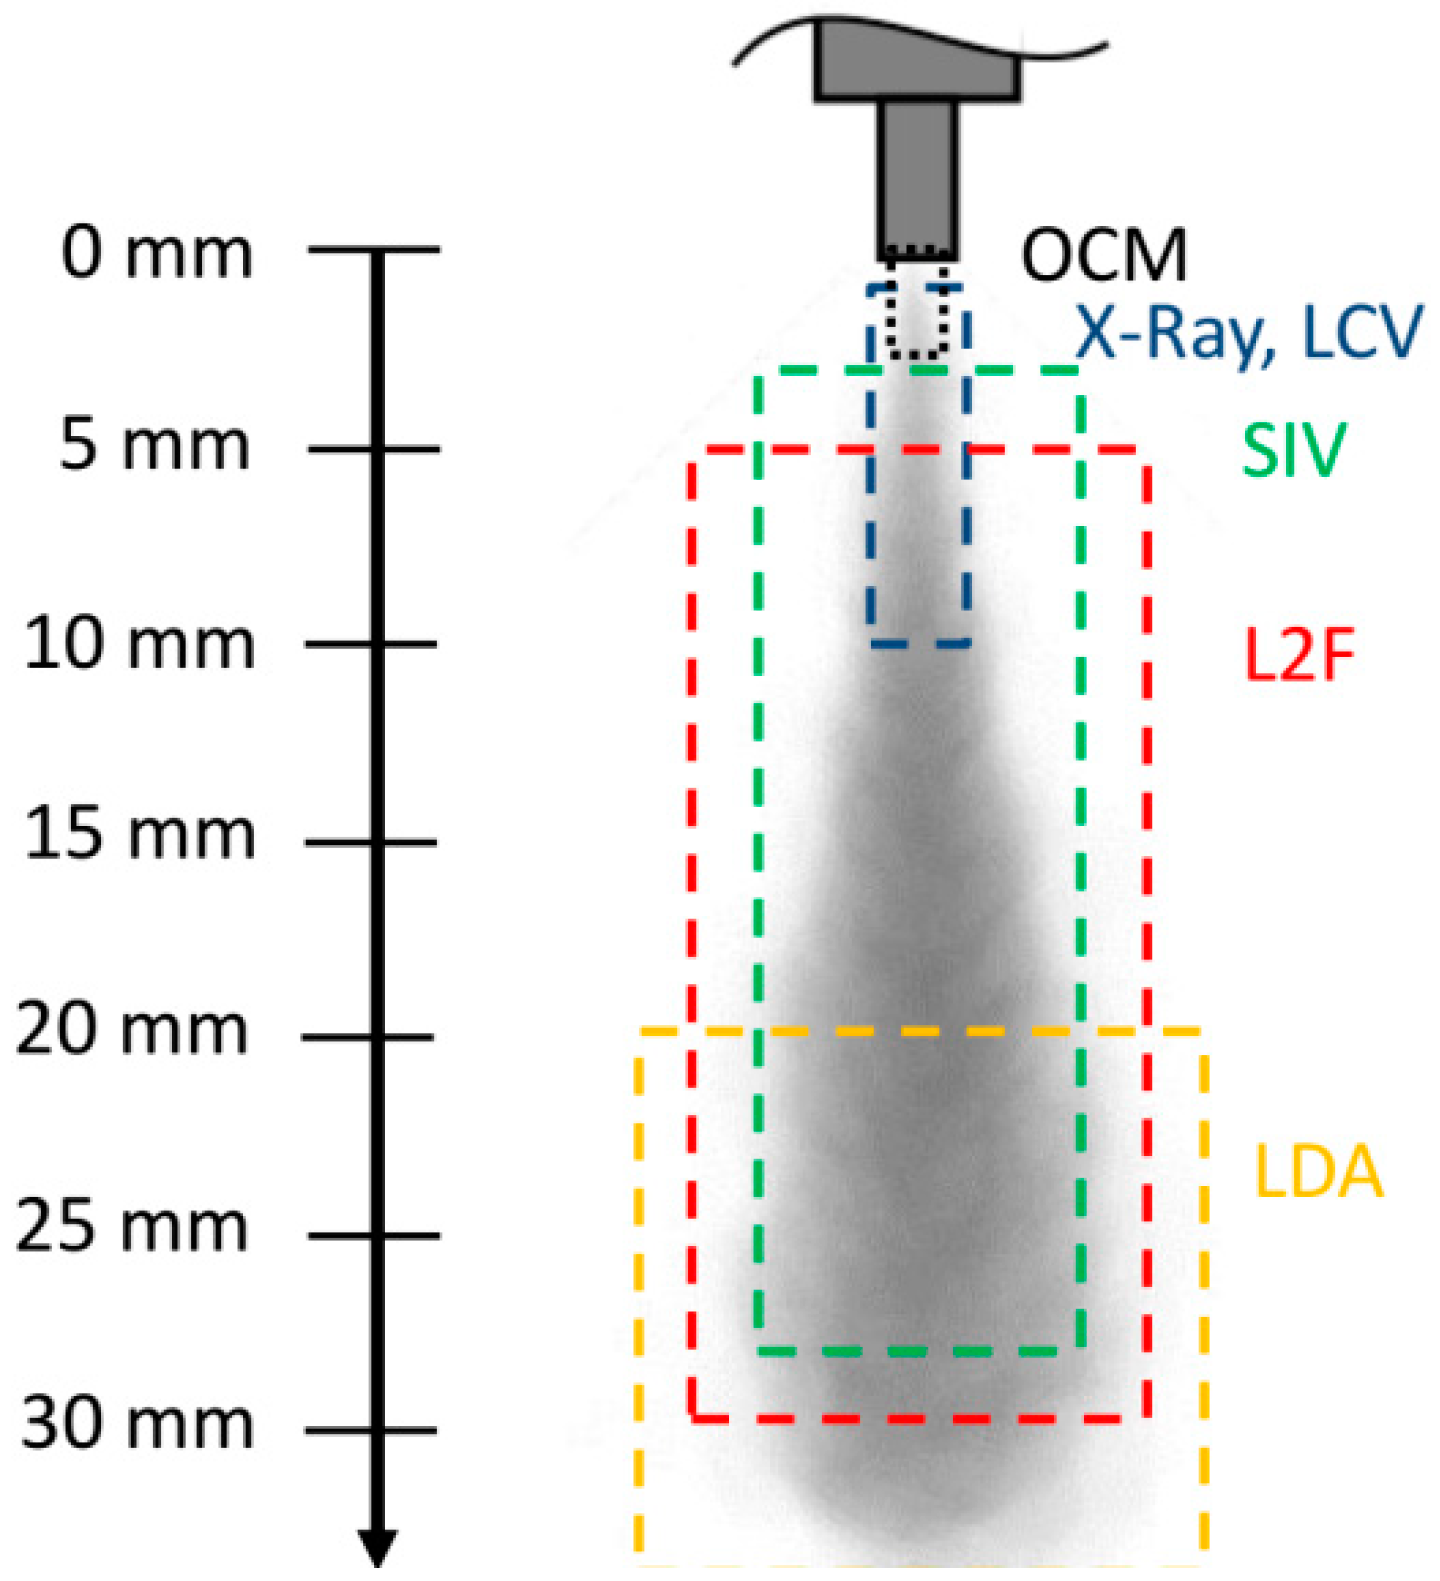
Moreover, the laser 2-focus velocimetry (L2F) approach was applied to the measurements of the velocity and size of droplets for the same injector. The L2F approach is based on the droplets flight time between two foci and the scattering time on each focus. The measurements show that the L2F method can be applied for the investigated diesel sprays from about 5 mm on downstream, following its assumption to have nearly spherical droplets as measurement objects. As here the velocity and the droplet size can be measured together, it is shown nicely for the same injection conditions that here both velocity and droplet size decrease downstream the spray on the axis and decrease on the radial profiles outside of the spray axis. For 15 mm distance, the size distribution becomes almost flat. These measurements show that the relatively large droplets measured at the 5 mm plane are fragmented to small droplets and these are dispersed homogeneously by the entrained air. The results from L2F and SIV show slightly asymmetric velocity distribution at 5 mm downstream. These results indicate that the flow conditions (and eventually in some cases also slight cavitation conditions) inside the nozzle are asymmetric. The droplets size results from L2F show that the droplets are still in the breakup process around 5 mm from the nozzle, reaching typical mean values of 10 µm 15 mm downstream of the nozzle. From 5 to 10 mm onwards, the spray consists essentially of droplets. Here, secondary spray breakup and evaporation are dominant processes. Further downstream, the laser doppler anemometry (LDA) and the particle image velocimetry (PIV) can also be applied. According to our experience, the LDA technique works from about 20 mm downstream of the diesel injector for lower injection pressures, and from about 25 mm downstream for higher injection pressures. The PIV technique was not applied, but it should be possible there as well, maybe in a kind of transformation from SIV even nearer to the injector. The difference is the illumination from a double pulsed laser light sheet (PIV) or from background illumination (SIV). In Figure 20, the measurement ranges for the different techniques are shown according to our experience with high pressure diesel injection systems.

5. Summarizing Discussion

Overall, the flow and spray characteristics are obtained from several measurement approaches described above. As far as possible, the same diesel injector and the same injection parameters have been used. It was possible to reach injection pressures of 180 MPa with transparent nozzles. The realistic flow simulation inside the nozzle is realized by the detailed inner geometry data. The predicted asymmetric flow and cavitation inside the nozzle affect the breakup process near the nozzle exit. With the optical connectivity method (OCM), and with special effort with the ROCM, the liquid structure can be visualized after leaving the nozzle, despite the very small size and extremely dense spray structure due to the increased illumination from inside the nozzle. Even the length of the cylindrical smooth liquid jet in the first 100 µm behind the injector can be seen with the OCM technique, and it fits perfectly in the smooth region measured with X-ray synchrotron radiation in the phase contrast imaging mode. The smooth surface does not disturb the X-ray signal as well as the OCM light. This confirms the measurability of this “unperturbed length”. The breakup length (or dense core length) is found to be two-to-three times higher than the unperturbed length, being observed in the range of 300 µm for the investigated three-hole injector, with 115 µm nozzle holes. For increased injection pressure up to 150 MPa, both the unperturbed length and the dense core breakup length decrease. Both quantities are expected to depend on the amount of cavitation inside the nozzle, which is not yet investigated in detail.
For velocity measurements, the structural image velocimetry (SIV) is invented, being an approach between the laser correlation velocimetry (LCV) and the evaluation of the particle image velocimetry (PIV). It is found to be a rather simple measurement technique, being now even capable for high speed application. The differentiation between the measurement plane and the moving objects in front and behind this plane is partly given, being lower than for the LCV approach, but being better than for X-ray velocimetry. SIV is applicable for diesel sprays from 2–3 mm on (partly from 4 mm on) downstream. It is a rather easy applicable measurement technique. Further downstream, from 5–10 mm on, the laser 2-focus (L2F) velocimetry is applicable, allowing not only the measurement of the spray velocity, but also of the droplet size. The different measurement approaches are supporting each other. They now allow one to confirm the theoretical ideas of spray breakup, even for high pressure injection. Additionally, they allow one to measure detailed data such that numerical models can be validated. It should be emphasized that the combined approach of the description of the processes inside the nozzle and outside in the spray has to be taken, and that the combination of experimental work with numerical models will be needed, in order to reach predictive models of the overall engine processes (e.g., [6]).

Author Contributions

F.D. and N.K. wrote the paper; N.K., L.T., T.D., and K.G. performed the measurements, simulations and the data processing; H.H. and F.D. supervised the related projects. All authors have read and agreed to the published version of the manuscript.

Funding

The research work for the investigations on the flow and cavitation inside nozzles is financially supported by German Research Foundation (Deutsche Forschungsgemeinschaft, DFG) within the project DI 591/29-1. The research activity for the spray measurements near the nozzles is financially supported by Research Association for Combustion Engines (Forschungsvereinigung Verbrennungskraftmaschinen, FVV) within the project Methods of Spray diagnostics II (FVV IGF 18958 N). The publication of this article was funded by the Open Access Fund of the Leibniz Universität Hannover.

Acknowledgments

The authors would like to express our gratitude to DFG and FVV for their financial support. We also thank the project partners, M. Wensing and A. Neubauer (Univ. Erlangen-Nürnberg), the measurement collaborators, J. Wang (Argonne National Lab Chicago) and H. Ueki (Nagasaki University), and the former working group members, A. Heilig, M. Kaiser and S. Jollet for their support on this joint research work.

Conflicts of Interest

The authors declare no conflict of interest.

References

  1. Fansler, T.D.; Parrish, S.E. Spray Measurement Technology: A Review. Meas. Sci. Technol. 2015, 26, 1–34. [Google Scholar] [CrossRef]
  2. Linne, M. Imaging in the Optically Dense Regions of a Spray: A Review of Developing Techniques. Prog. Energy Combust. Sci. 2013, 39, 403–440. [Google Scholar] [CrossRef]
  3. Baumgarten, C. Mixture Formation in Internal Combustion Engines; Springer: Heidelberg, Germany, 2006. [Google Scholar]
  4. Som, S.; Aggarwal, S.K. Effects of Primary Breakup Modeling on Spray and Combustion Characteristics of Compression Ignition Engines. Combust. Flame 2010, 157, 1179–1193. [Google Scholar] [CrossRef]
  5. Yu, W.; Yang, W.; Mohan, B.; Tay, K.; Zhao, F.; Zhang, Y.; Chou, S.; Kraft, M.; Alexander, M.A.; Yong, A.; et al. Numerical and Experimental Study on Internal Nozzle Flow and Macroscopic Spray Characteristics of a Kind of Wide Distillation Fuel (WDF)—Kerosene 2016-01-0839. SAE Tech. Paper 2016. [Google Scholar] [CrossRef]
  6. Yu, W.; Yang, W.; Zhao, F. Investigation of internal nozzle flow, spray and combustion characteristics fueled with diesel, gasoline and wide distillation fuel (WDF) based on a piezoelectric injector and a direct injection compression ignition engine. Appl. Therm. Eng. 2017, 114, 905–920. [Google Scholar] [CrossRef]
  7. Lehmann, E.; Grünzweig, C.; Jollet, S.; Kaiser, M.; Hansen, H.; Dinkelacker, F. Visualization of Diesel Injector with Neutron Imaging. J. Phys. Conf. Ser. 2015, 656, 1–4. [Google Scholar] [CrossRef] [Green Version]
  8. MacPhee, A.G.; Tate, M.W.; Powell, C.F.; Yue, Y.; Renzi, M.J.; Ercan, A.; Narayanan, S.; Fontes, E.; Walther, J.; Schaller, J.; et al. X-ray Imaging of Shock Waves Generated by High-Pressure Fuel Sprays. Science 2002, 295, 1261–1263. [Google Scholar] [CrossRef] [Green Version]
  9. Kastengren, A.; Powell, C.F.; Wang, Y.; Im, K.S.; Wang, J. X-ray Radiography Measurements of Diesel Spray Structure at Engine-Like Ambient Density. Atomiz. Sprays 2009, 19, 1031–1044. [Google Scholar] [CrossRef]
  10. Im, K.S.; Cheong, S.K.; Powell, C.F.; Lai, M.C.D.; Wang, J. Unraveling the Geometry Dependence of In-Nozzle Cavitation in High-Pressure Injectors. Sci. Rep. 2013, 3, 1–5. [Google Scholar] [CrossRef] [Green Version]
  11. Torelli, R.; Magnotti, G.M.; Som, S.; Pei, Y.; Traver, M.L. Exploration of Cavitation-Suppressing Orifice Designs for a Heavy-Duty Diesel Injector Operating with Straight-Run Gasoline 2019-24-0126. SAE Tech. Paper 2019. [Google Scholar] [CrossRef]
  12. Lord Rayleigh: On the Pressure Developed in a Liquid during the Collapse of a Spherical Cavity. Philos. Mag. 1917, 34, 94–98. [CrossRef]
  13. Plesset, M.S. The Dynamics of Cavitation Bubbles. J. Appl. Mech. 1949, 16, 277–282. [Google Scholar] [CrossRef]
  14. Kawaharada, N.; Thimm, L.; Dinkelacker, F. Transient Cavitation Structure inside real Scale Transparent Nozzles. In Proceedings of the 20th ILASS-Asia & 28th ILASS-Japan Symposium, Ube, Japan, 21–23 December 2019; pp. 1–8. [Google Scholar]
  15. Diver, C.; Atkinson, J.; Befrui, B.; Helml, H.J.; Li, L. Improving the Geometry and Quality of a Micro-Hole Fuel Injection Nozzle by Means of Hydroerosive Grinding. Proc. Inst. Mech. Eng. Part B J. Eng. Manuf. 2007, 221, 1–9. [Google Scholar] [CrossRef]
  16. Bergstrand, P. The Effects of Orifice Shape on Diesel Combustion. SAE Trans. 2004, 113, 370–1379. [Google Scholar]
  17. Kawaharada, N.; Thimm, L.; Dinkelacker, F. Cavitation Investigation Database for Model Evaluations and Developments, Part 1. Mendeley Data 2020, v1. [Google Scholar] [CrossRef]
  18. Schnerr, G.H.; Sauer, J. Physical and Numerical Modeling of Unsteady Cavitation Dynamics. In Proceedings of the 4th International Conference on Multiphase Flow, New Orleans, LA, USA, 27 May–1 June 2001; pp. 1–12. [Google Scholar]
  19. Jollet, S.; Heilig, A.; Bitner, K.; Niemeyer, D.; Dinkelacker, F. Comparison of experiments and numerical simulations of high pressure transparent injection nozzles. In Proceedings of the 25th ILASS Europe, Chania, Crete, 1–4 September 2013; pp. 1–7. [Google Scholar]
  20. Jollet, S. Experimentelle und Numerische Untersuchungen der Instationären Dynamischen Innenströmung in Dieselinjektoren. Ph.D. Thesis, University Hannover, Hannover, Germany, 2014. PZH-TEWISS Verlag Garbsen, Germany: Berichte aus dem ITV, Band 1/2014 (In German). [Google Scholar]
  21. Villafranco, D.O.; Do, H.K.; Grace, S.M.; Ryan, E.M.; Holt, R.G. Assessment of Cavitation Models in the Prediction of Cavitation in Nozzle Flow. In Proceedings of the the ASME, Montreal, QC, Canada, 15–20 July 2018; pp. 1–10. [Google Scholar] [CrossRef]
  22. Cazzoli, G.; Falfari, S.; Bianchi, G.M.; Forte, C.; Catellani, C. Assessment of the Cavitation Models Implemented in OpenFOAM Under DI-like Conditions. Energy Procedia 2016, 101, 638–645. [Google Scholar] [CrossRef]
  23. Roosen, P. Einspritzstrahlstruktur vor Dieseldüsen. MTZ, Motortechn. Z. 1991, 52, 526–531. [Google Scholar]
  24. Charalampous, G.; Hardalupas, Y.; Taylor, A. Novel Technique for Measurements of Continuous Liquid Jet Core in an Atomizer. AIAA Journal. 2009, 47, 2605–2615. [Google Scholar] [CrossRef]
  25. Charalampous, G.; Hadjiyiannis, C.; Hardalupas, Y. Proper orthogonal decomposition analysis of photographic and optical connectivity time resolved images of an atomizing liquid jet. In Proceedings of the 24th ILASS Europe, Estoril, Portugal, 5–7 September 2011. [Google Scholar]
  26. Heilig, A.; Kaiser, M.; Dinkelacker, F. Near Nozzle High-Speed Measurements of the Intact Core for Diesel Spray. In Proceedings of the 12th ICLASS, Heidelberg, Germany, 2–6 September 2012; pp. 1–8. [Google Scholar]
  27. Heilig, A. Untersuchung des Primärzerfalls von Hochdruckdieselsprays Mittels Optischer Messtechnik. Ph.D. Thesis, University Hannover, Hannover, Germany, 2013. PZH-TEWISS Verlag, Germany: Berichte aus dem ITV, Band 1/2013 (In German). [Google Scholar]
  28. Heilig, A.; Kaiser, M.; Qian, D.; Dinkelacker, F. Optical Diagnostic Approaches of the Primary Breakup of Diesel Sprays. In Engine Combustion Processes Current Problems and Modern Techniques, XIth Congress. Ludwigsburg; ESYTEC: Erlangen, Germany, 2013; Volume 13.1, pp. 447–458. [Google Scholar]
  29. Kaiser, M.; Kawaharada, N.; Hara, T.; Gröger, K.; Dinkelacker, F. Introduction of the Remote Optical Connectivity Method. In Proceedings of the 13th ICLASS, Tainan, Taiwan, 23–27 August 2015; pp. 1–8. [Google Scholar]
  30. Gröger, K.; Kaiser, M.; Wang, J.; Dinkelacker, F. Comparison of the Optical Connectivity Method to X-Ray Spray Measurements in the Near Field of a Diesel Injector. Proc. Comb. Inst. 2019, 37, 3271–3278. [Google Scholar] [CrossRef]
  31. Payri, R.; Salvador, F.J.; Gimeno, J.; De la Morena, J. Analysis of diesel spray atomization by means of a near-nozzle field visualization technique. Atomiz. Sprays 2011, 21, 753–774. [Google Scholar] [CrossRef]
  32. Kastengren, A.; Powell, C.F. Synchrotron X-ray techniques for fluid dynamics. Exp. Fluids 2014, 55, 1686. [Google Scholar] [CrossRef]
  33. Chaves, H.; Knapp, M.; Kubitzek, A.; Obermeier, F. High Speed Flow Measurements within an Injection Nozzle. Spie Laser Anemometry Adv. Appl. 1993, 2052, 265–272. [Google Scholar]
  34. Chaves, H.; Kirmse, C.; Obermeier, F. Velocity measurements of dense diesel fuel sprays in dense air. At. Sprays 2004, 14, 589–609. [Google Scholar] [CrossRef]
  35. Schugger, C.; Renz, U. Influence of Spray Velocity and Structure on the Air Entrainment in the Primary Breakup Zone of High Pressure Diesel Sprays. In Proceedings of the ASME Internal Combustion Engine Division Fall Technical Conference, New Orleans, LA, USA, 8–11 September 2002; Paper No: ICEF2002-508. pp. 281–288. [Google Scholar] [CrossRef]
  36. Leick, P.; Bittlinger, G.; Tropea, C. Velocity measurement in the near nozzle region of common rail diesel sprays at elevated back-pressures. In Proceedings of the 19th ILASS Europe, Nottingham, UK, 6–8 September 2004; pp. 296–301. [Google Scholar]
  37. Hespel, C.; Blaisot, J.B.; Gazon, M.; Godard, G. Laser correlation velocimetry performance in diesel applications: Spatial selectivity and velocity sensitivity. Exp. Fluids 2012, 53, 245–264. [Google Scholar] [CrossRef]
  38. Weber, D.; Leick, P. Structure and Velocity Field of Individual Plumes of Flashing Gasoline Direct Injection Sprays. In Proceedings of the 26th ILASS, Bremen, Germany, 8–10 September 2014; pp. 1–12. [Google Scholar] [CrossRef]
  39. Gröger, K.; Kawaharada, N.; Klippenstein, A.; Dinkelacker, F. Velocity Measurement of High-Pressure Gasoline Direct Injections in the Primary Atomization Region on Flash Boiling Conditions. In Proceedings of the 29th ILASS Europe, Paris, France, 2–4 September 2019; pp. 1–8. [Google Scholar]
  40. Goldlücke, J.; Brüggemann, D.; Leidernberger, U.; Hüttl, C. Optical-Flow-Methode zur Strömungsanalyse in der motorischen Verbrennung. MTZ—Motortechn. Z. 2011, 72, 58–63. [Google Scholar] [CrossRef]
  41. Gröger, K. Entwicklung und Vergleich optischer Messverfahren zur Analyse des Düsennahen Strahlzerfalls von Diesel- und Ottoinjektoren. Ph.D. Thesis, University Hannover, Hannover, Germany, 2020. (In progress, In German). [Google Scholar]
  42. Neubauer, A. Messtechnische Erfassung Primärer Strahlstrukturen von Benzin- und Dieselsprays. Ph.D. Thesis, University Erlangen-Nürnberg, Erlangen, Germany, 2020. (In German). [Google Scholar]
  43. Schodl, R. A Laser-Dual-Beam Method for Flow Measurements in Turbomachines. In Proceedings of the ASME International Gas Turbine Conference and Products Show, Zurich, Switzerland, 30 March–4 April 1974; Paper-No: ASME 74-GT-157. pp. 1–7. [Google Scholar]
  44. Ueki, H.; Ishida, M.; Sakaguchi, D. Simultaneous Measurement of Particle Size and Velocity by Laser 2-Focus Particle Analyzer. In Proceedings of the 6th ICLASS, Rouen, France, 18–22 July 1994; pp. 483–490. [Google Scholar]
  45. Kawaharada, N.; Gröger, K.; Ueki, H.; Dinkelacker, F. Laser 2-Focus Velocimeter for Droplet Characterization in Dense Sprays. In Proceedings of the 19th International Symposium on Applications of Laser and Imaging Techniques to Fluid Mechanics, Lisbon, Portugal, 16–19 July 2018; pp. 1–13. [Google Scholar]
Figure 1. Overview of spray development [3].
Applsci 10 04410 g001
Figure 2. Neutron transmission image of diesel injection nozzle [7].
Applsci 10 04410 g002
Figure 3. X-ray transmission image of a diesel injection nozzle with three injection holes. Two on the left side are overlapping; the right one provides clear visibility. The injection needle is closed.
Applsci 10 04410 g003
Figure 4. Time resolved needle movement.
Applsci 10 04410 g004
Figure 5. Three-dimensional model of the nozzle tip.
Applsci 10 04410 g005
Figure 6. Three-dimensional numerical simulation of the flow inside the nozzle (shown is a 120-degree segment): (a) Velocity amount (left) and streamline (right); (b) Volume fraction of liquid.
Applsci 10 04410 g006
Figure 7. Transparent nozzle and the nozzle holder.
Applsci 10 04410 g007
Figure 8. Sketch of transparent nozzles: (a) 3D cut model; (b) Wireframe with a center plane.
Applsci 10 04410 g008
Figure 9. Actual geometries of transparent nozzles: (a) Nozzle A, Basic geometry; (b) Nozzle B, Basic geometry with hydro-erosive grinding (short step); (c) Nozzle C, Basic geometry with hydro-erosive grinding (long step).
Applsci 10 04410 g009
Figure 10. Comparisons of the cavitation area between experiment (shadowgraphy, left half side) and numerical simulation (right half side) for the different shaped nozzles at 60 MPa injection pressure: (a) Nozzle A, basic geometry; (b) Nozzle B, basic geometry with hydro-erosive grinding (short step); (c) Nozzle C, basic geometry with hydro-erosive grinding (long step).
Applsci 10 04410 g010
Figure 11. Principle and results from the Remote Optical Connectivity Method (ROCM): (a) Principle of ROCM; (b) Illuminated dense core signals for three conditions during start of injection (0.4 ms ASOE) and in the steady injection phase (1.2 ms ASOE) for different injection pressure (single shot examples, filtered signal).
Applsci 10 04410 g011
Figure 12. Comparison of Optical Connectivity Method (OCM) and X-ray phase contrast imaging (PCI) of the near field of a spray (from top to bottom 0.4/1.0/1.4 ms ASOE). Three-hole injector with 115 µm diameter. Injection pressure 100 MPa, gas pressure 0.1 MPa. Both techniques show the non-perturbed length very near to the spray injection, being in the range of 100 to 150 µm. Reproduced with permission from [30], Elsevier, 2019.
Applsci 10 04410 g012
Figure 13. Length scales of the primary breakup with the non-perturbed length (Lp) and the breakup length (intact core length, Lb). Determination of both quantities for different injection pressures for the steady injection state with two methods. Three-hole diesel injector with a nozzle diameter of 115 µm, gas pressure 0.1 MPa. Reproduced with permission from [30], Elsevier, 2019.
Applsci 10 04410 g013
Figure 14. Double shots shadow graph imaging: (a) Entire spray; (b) Close-up views. Injection with 50 MPa injection pressure.
Applsci 10 04410 g014
Figure 15. Working principle of the Structural Image Velocimetry (SIV). Adapted with permission from [28], Esytec, 2013.
Applsci 10 04410 g015
Figure 16. Results from high speed SIV at 150 MPa injection pressure: (a) Velocity field; (b) Velocity distribution in radial direction of spray (red) at two downstream positions of 5 and 10 mm, together with measured standard deviation (black); (c) Velocity on spray axis (red) with measured standard deviation (black).
Applsci 10 04410 g016
Figure 17. Schematic diagram and measurement principle of L2F: (a) Measurement prove of L2F; (b) Diagram of the time counter of L2F.
Applsci 10 04410 g017
Figure 18. Time resolved velocity calculated from mass flow rate and velocity measured by L2F.
Applsci 10 04410 g018
Figure 19. Droplet velocity and size results from L2F. Radial profiles at three downstream positions; (a) Droplet velocity; (b) Droplet size.
Applsci 10 04410 g019
Figure 20. Measurement range for different measurement techniques for high pressure diesel spray injection (OCM = Optical Connectivity Method, X-Ray = X-ray phase contrast imaging and X-ray velocimetry, LCV = Laser Correlation Velocimetry, SIV = Structural Image Velocimetry, L2F = Laser 2-Focus Velocimetry, LDA = Laser Doppler Anemometry).
Applsci 10 04410 g020