Article

Synthesis of Multiwalled Carbon Nanotubes on Stainless Steel by Atmospheric Pressure Microwave Plasma Chemical Vapor Deposition

School of Automation Engineering, University of Electronic Science and Technology of China, Chengdu 611731, China
*
Author to whom correspondence should be addressed.
Appl. Sci. 2020, 10(13), 4468; https://doi.org/10.3390/app10134468
Submission received: 24 April 2020 / Revised: 21 June 2020 / Accepted: 26 June 2020 / Published: 28 June 2020
(This article belongs to the Special Issue Plasma: From Materials to Emerging Technologies)

Abstract

:

Featured Application

Synthesis of carbon nanotubes on 304 stainless steel using ethanol as a carbon source at 500–800 °C by atmospheric pressure microwave plasma chemical vapor deposition.

Abstract

In this paper, we synthesize carbon nanotubes (CNTs) by using atmospheric pressure microwave plasma chemical vapor deposition (AMPCVD). In AMPCVD, a coaxial plasma generator provides 200 W 2.45 GHz microwave plasma at atmospheric pressure to decompose the precursor. A high-temperature tube furnace provides a suitable growth temperature for the deposition of CNTs. Optical fiber spectroscopy was used to measure the compositions of the argon–ethanol–hydrogen plasma. A comparative experiment of ethanol precursor decomposition, with and without plasma, was carried out to measure the role of the microwave plasma, showing that the 200 W microwave plasma can decompose 99% of ethanol precursor at any furnace temperature. CNTs were prepared on a stainless steel substrate by using the technology to decompose ethanol with the plasma power of 200 W at the temperatures of 500, 600, 700, and 800 °C; CNT growth increases with the increase in temperature. Prepared CNTs, analyzed by SEM and HRTEM, were shown to be multiwalled and tangled with each other. The measurement of XPS and Raman spectroscopy indicates that many oxygenated functional groups have attached to the surface of the CNTs.

1. Introduction

Since Iijima synthesized carbon nanotubes (CNTs) by the arc discharge process in 1991 [1], many CNT synthesis processes have been developed. Notably, the chemical vapor deposition (CVD) process has been one of the most successful methods to make multiwalled carbon nanotubes (MWCNTs) [2,3,4,5]. In order to improve the yield of CNTs, direct current plasma chemical vapor deposition (DC-PECVD) [6], radio-frequency plasma chemical vapor deposition (RF-PECVD) [7,8], and microwave plasma chemical vapor deposition (MPCVD) [9,10,11,12] were developed based on thermal CVD. Process temperatures for CVD production of CNTs typically lie in the range of 700 to 1200 °C in the pressure range of 10–105 Pa [2,3,4,5]. The typical temperature range for the synthesis of CNTs by PECVD is 520–1000 °C at the pressure range of 40–3000 Pa [6,7,8,9,10,11]. It has also been reported that PECVD has realized CNT synthesis at 340 °C [12]. Compared with thermal CVD, the CNT growth rates of DC-PECVD, RF-PECVD, and MPCVD are increased by 2–5 times at the same temperatures and pressures. They indicate that the plasma is very significant for the improvement of the growth rate of CNTs due to the plasma’s higher activation at the high temperatures on the precursor, which enhances reaction rates.
So far, all kinds of PECVD processes work under low pressure (<104 Pa). However, the atmospheric pressure microwave plasma has the advantages of higher electron density, electron activity, electron temperature, and stronger molecular decomposition, which are very powerful in the synthesis of nanomaterials. By atmospheric pressure microwave plasma, free-standing CNTs were synthesized with 900–1500 W plasma power and 1000 °C [13,14,15]; the CNT growth rate increased more than ten times by thermal CVD. Most atmospheric pressured microwave plasma nanomaterial synthesis systems use waveguide plasma generators with large volumes and high power. Usually, it needs more than 900 W microwave power to maintain high-power atmospheric pressure waveguide microwave plasma. It has several problems in the nanomaterial synthesis process because of the system structure and the high power: (1) The atmosphere of the system is not closed, making the synthesis area impure; there is residual air in the synthetic environment. (2) The growth area is small, and the flow rate is high, limiting the process in nanomaterial synthesis. Nevertheless, there is still great potential in the synthesis of nanomaterials by atmospheric pressure microwave plasma.
In this paper, a kind of AMPCVD system that includes a small-scaled 200 W atmospheric pressure 2.45 GHz coaxial microwave plasma generator and a heating device is presented. The combination of atmospheric pressure microwave plasma and a CVD tube furnace makes the technology have a strong precursor decomposition, a pure nanomaterial synthesis atmosphere, a large control range of particles density, and accurate temperature control, which overcomes the pressure limits of PECVD and achieves accurate control of the nanomaterials synthesis process. For now, this is the only study of nanomaterial synthesis by AMPCVD.
The CNTs are synthesized by using AMPCVD at the temperature of 500–800 °C. Compared with the CVD and all kinds of PECVD, the CNT growth rate of AMPCVD significantly increases. Compared with the experiments in [13,14,15], the decomposition capacity of 200 W atmospheric pressure microwave plasma of the AMPCVD is high enough to decompose the precursors completely.

2. Materials and Methods

2.1. AMPCVD

Figure 1 shows the AMPCVD, as well as the optical detection for emission spectroscopy measurements and exhaust gas detection devices. The 200 W atmospheric pressure 2.45 GHz microwave plasma generator includes a solid-state microwave source, a coaxial plasma generator, and a gas control system. The coaxial microwave plasma generator consists of two copper tubes. The diameters of the central and outer tubes are 6 and 20 mm, respectively, and their length is 90 mm. Through the center tunnel, a mixture of Ar gas and ethanol vapor is pumped into the plasma. H2 gas fills the space between the center and outer tubes for shaping the plasma. The solid-state microwave source provides a stable 200 W microwave power for the generator to produce atmospheric pressure plasma. The gas control system includes three mass flowmeters to give an axial gas and a swirling gas to sustain the plasma flame.
In the experiment, ethanol was used as the carbon source because it is cheap, easy to access, and safe—the concentration of ethanol vapor is controlled by the temperature. The 304 stainless steel sheet was used as both the substrate and the catalyst because it has a high content of iron and nickel, which are well-known catalysts for the synthesis of CNTs [16]. Briefly, 200 sccm (standard cubic centimeter per minute) argon (Ar) for the bubbling of ethanol was maintained at a temperature of 20 °C as the carbon source and 800 sccm Ar was pumped into the plasma generator through the center gas path. Via a tangential injection hole, 200 sccm hydrogen (H2) was swirled into the plasma generator. Central two-way airflow was used to control the precursor concentration and the side hydrogen was used to stabilize the plasma and work as the deoxidizer. The exhaust gas was emitted into the air through a gas-washing bottle, and the gas-washing bottle prevented air return to the tube furnace chamber. The 304 stainless steel substrate (solid sheet, 10 × 10 × 0.2 mm) was placed at the center of the high-temperature zone as the substrate for CNTs.

2.2. Experimental Setup

The pretreatment processes of the substrates are as follows: (1) Prepare a 10 × 10 × 2 mm 304 stainless steel sheet as substrate. (2) Use an automatic polishing machine to polish the substrate with 80#, 800#, and 1000# sandpaper for 30 min at 120 r/min, and then polish the substrate for 1 h with cleaning cloth. (3) After polishing, sonicated the substrate in acetone, acetic acid (20%), ethanol, and deionized water for 10 min. (4) The substrate is then dried at 60 °C for 30 min and put it into the tube furnace with the polishing plate upward.
The preparatory steps are as follows: (1) Empty the air in the quartz tube (inner diameter: 52 mm, length: 600 mm) for 10 min using a vacuum pump. (2) Swirl H2 into the apparatus with a flow of 200 sccm. When the pressure is raised to the atmosphere, the valve of the gas-washing bottle should be turn on. (3) The furnace is heated to 800 °C for 20 min to further reduce the oxygen in the quartz tube. (4) Adjust the furnace temperature to 400–1000 °C for the reaction. (5) After the furnace temperature is stable, 800 sccm Ar and 200 sccm mixture gas of Ar and ethanol vapor are pumped into the plasma generator to excite the plasma. (6) The synthesis process of CNTs lasts for 30 min, then the system is turned off. (7) Cool the apparatus down to room temperature under the H2 environment. The CNTs are now prepared on the surface of the stainless-steel substrate.

2.3. Characterizations

In this study, an Ocean Optics MAYA-pro 2000+ optical fiber spectrometer with the spectral range of 200–1100 nm and the resolution of 1.3 nm was employed to measure the ethanol vapor microwave plasma at atmospheric pressure. Two sets of spectra were measured: the first one was for Ar-H2 plasma, and the other one was for Ar-Ethanol-H2. The composition from the decomposition of ethanol in the plasma emits spectral lines at a specific frequency, which are detected through analysis of the spectrum line differences between these spectral lines. The decomposition rates of the ethanol precursor at different temperatures, with and without plasma, were measured by an Agilent 6890N gas chromatograph to measure the decomposition ability of the atmospheric pressure microwave plasma. A scanning electron micrograph (SEM; Hitachi S-5000 20 kV) and a high-resolution transmission electron microscope (HRTEM; FEI Tecnai G2 F20 200 kV) were used to examine the morphology and the microstructure of the CNTs. The composition and the contents of the samples were measured by X-ray photoelectron spectroscopy (XPS; Thermo Fisher Escalab Xi+) and Raman spectroscopy (Thermo Fisher DXD).

3. Results and Discussion

3.1. Plasma Parameters

The intensity of a spectral line is proportional to the population density in the upper level of the associated transition. Variations in the strength of the lines emitted relate to the processes that take place in the plasma. Thus, the spectral was measured to determine the gas composition of the ethanol vapor microwave plasma.
Figure 2 shows the emission spectrums of Ar-H2 and Ar-ethanol-H2 microwave plasma. The main luminescent groups in the plasma are Hα (656.19 nm), Hβ (486.25 nm), Hγ (434.09 nm), CH (389.02 nm, 431.31 nm), C2 (471.06 nm, 516.08 nm, 563.1 nm), and OH (308.75 nm). The intensity of Hα lines in both spectrums is almost equal, indicating a high H radical concentration in the plasma. H radicals can effectively etch the sp2 carbon phase and graphite phase, which is conducive to the preparation of high-purity CNTs. The relative intensity of the spectral lines between 690 and 900 nm are all Ar I lines and almost equal strength between both spectrums, indicating that the ethanol does not change the energy state of the microwave plasma.

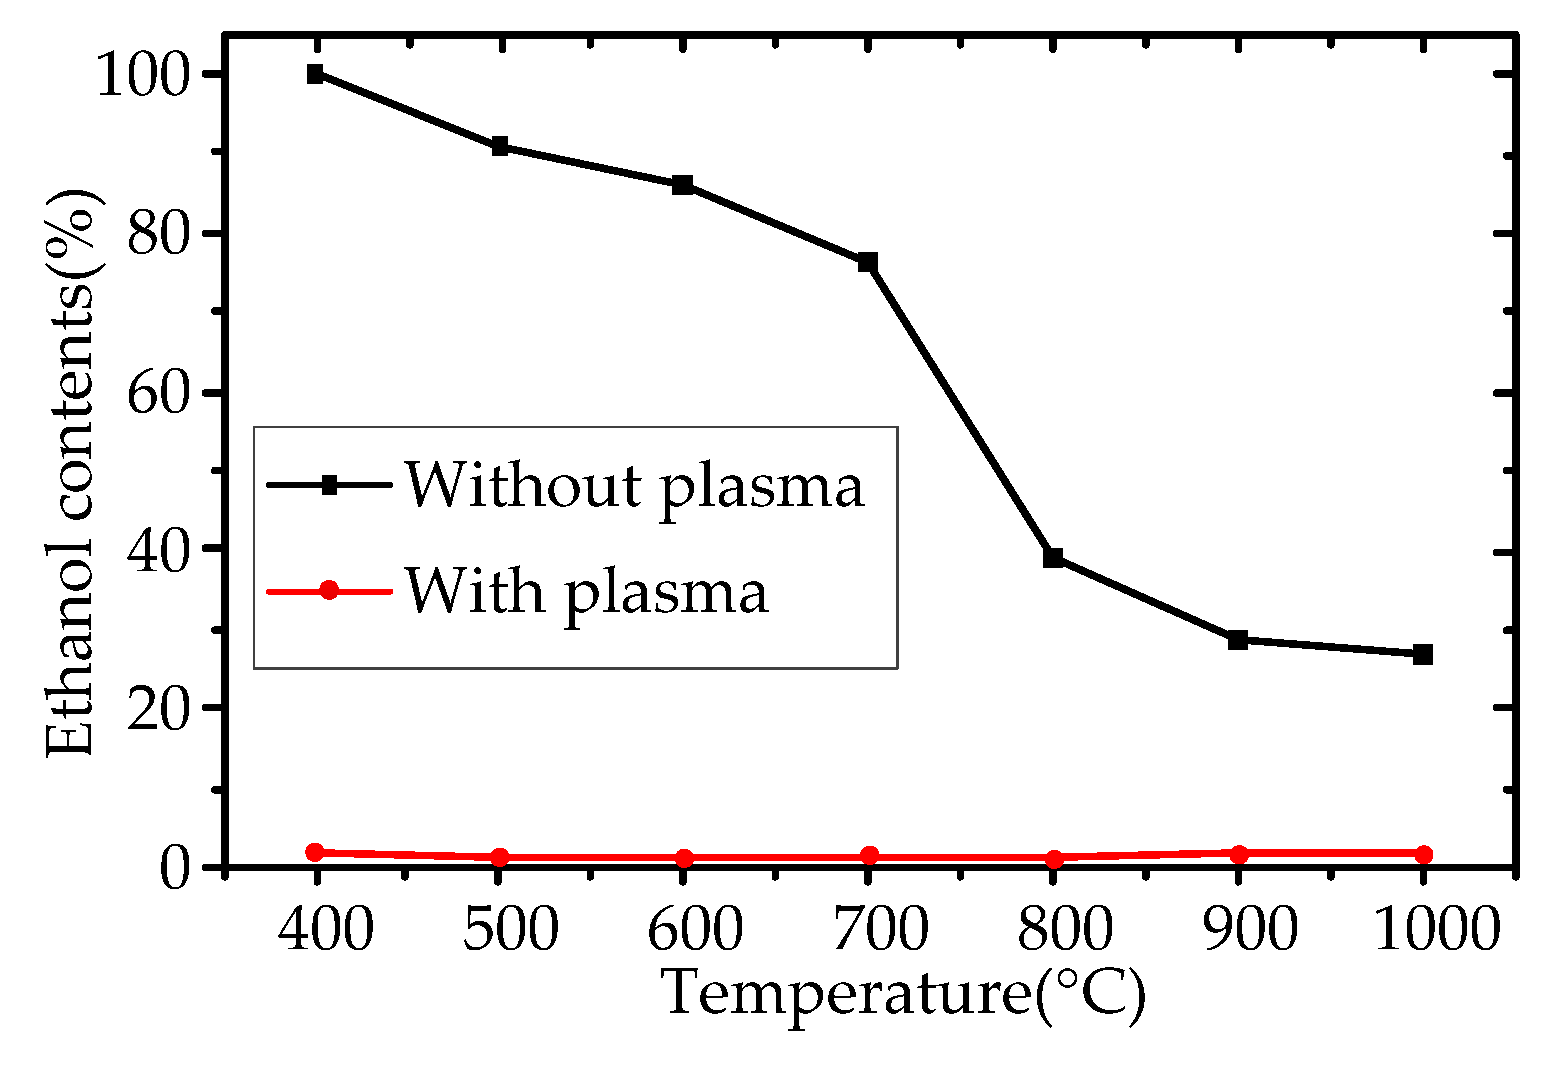
3.2. Exhaust Gas Detection
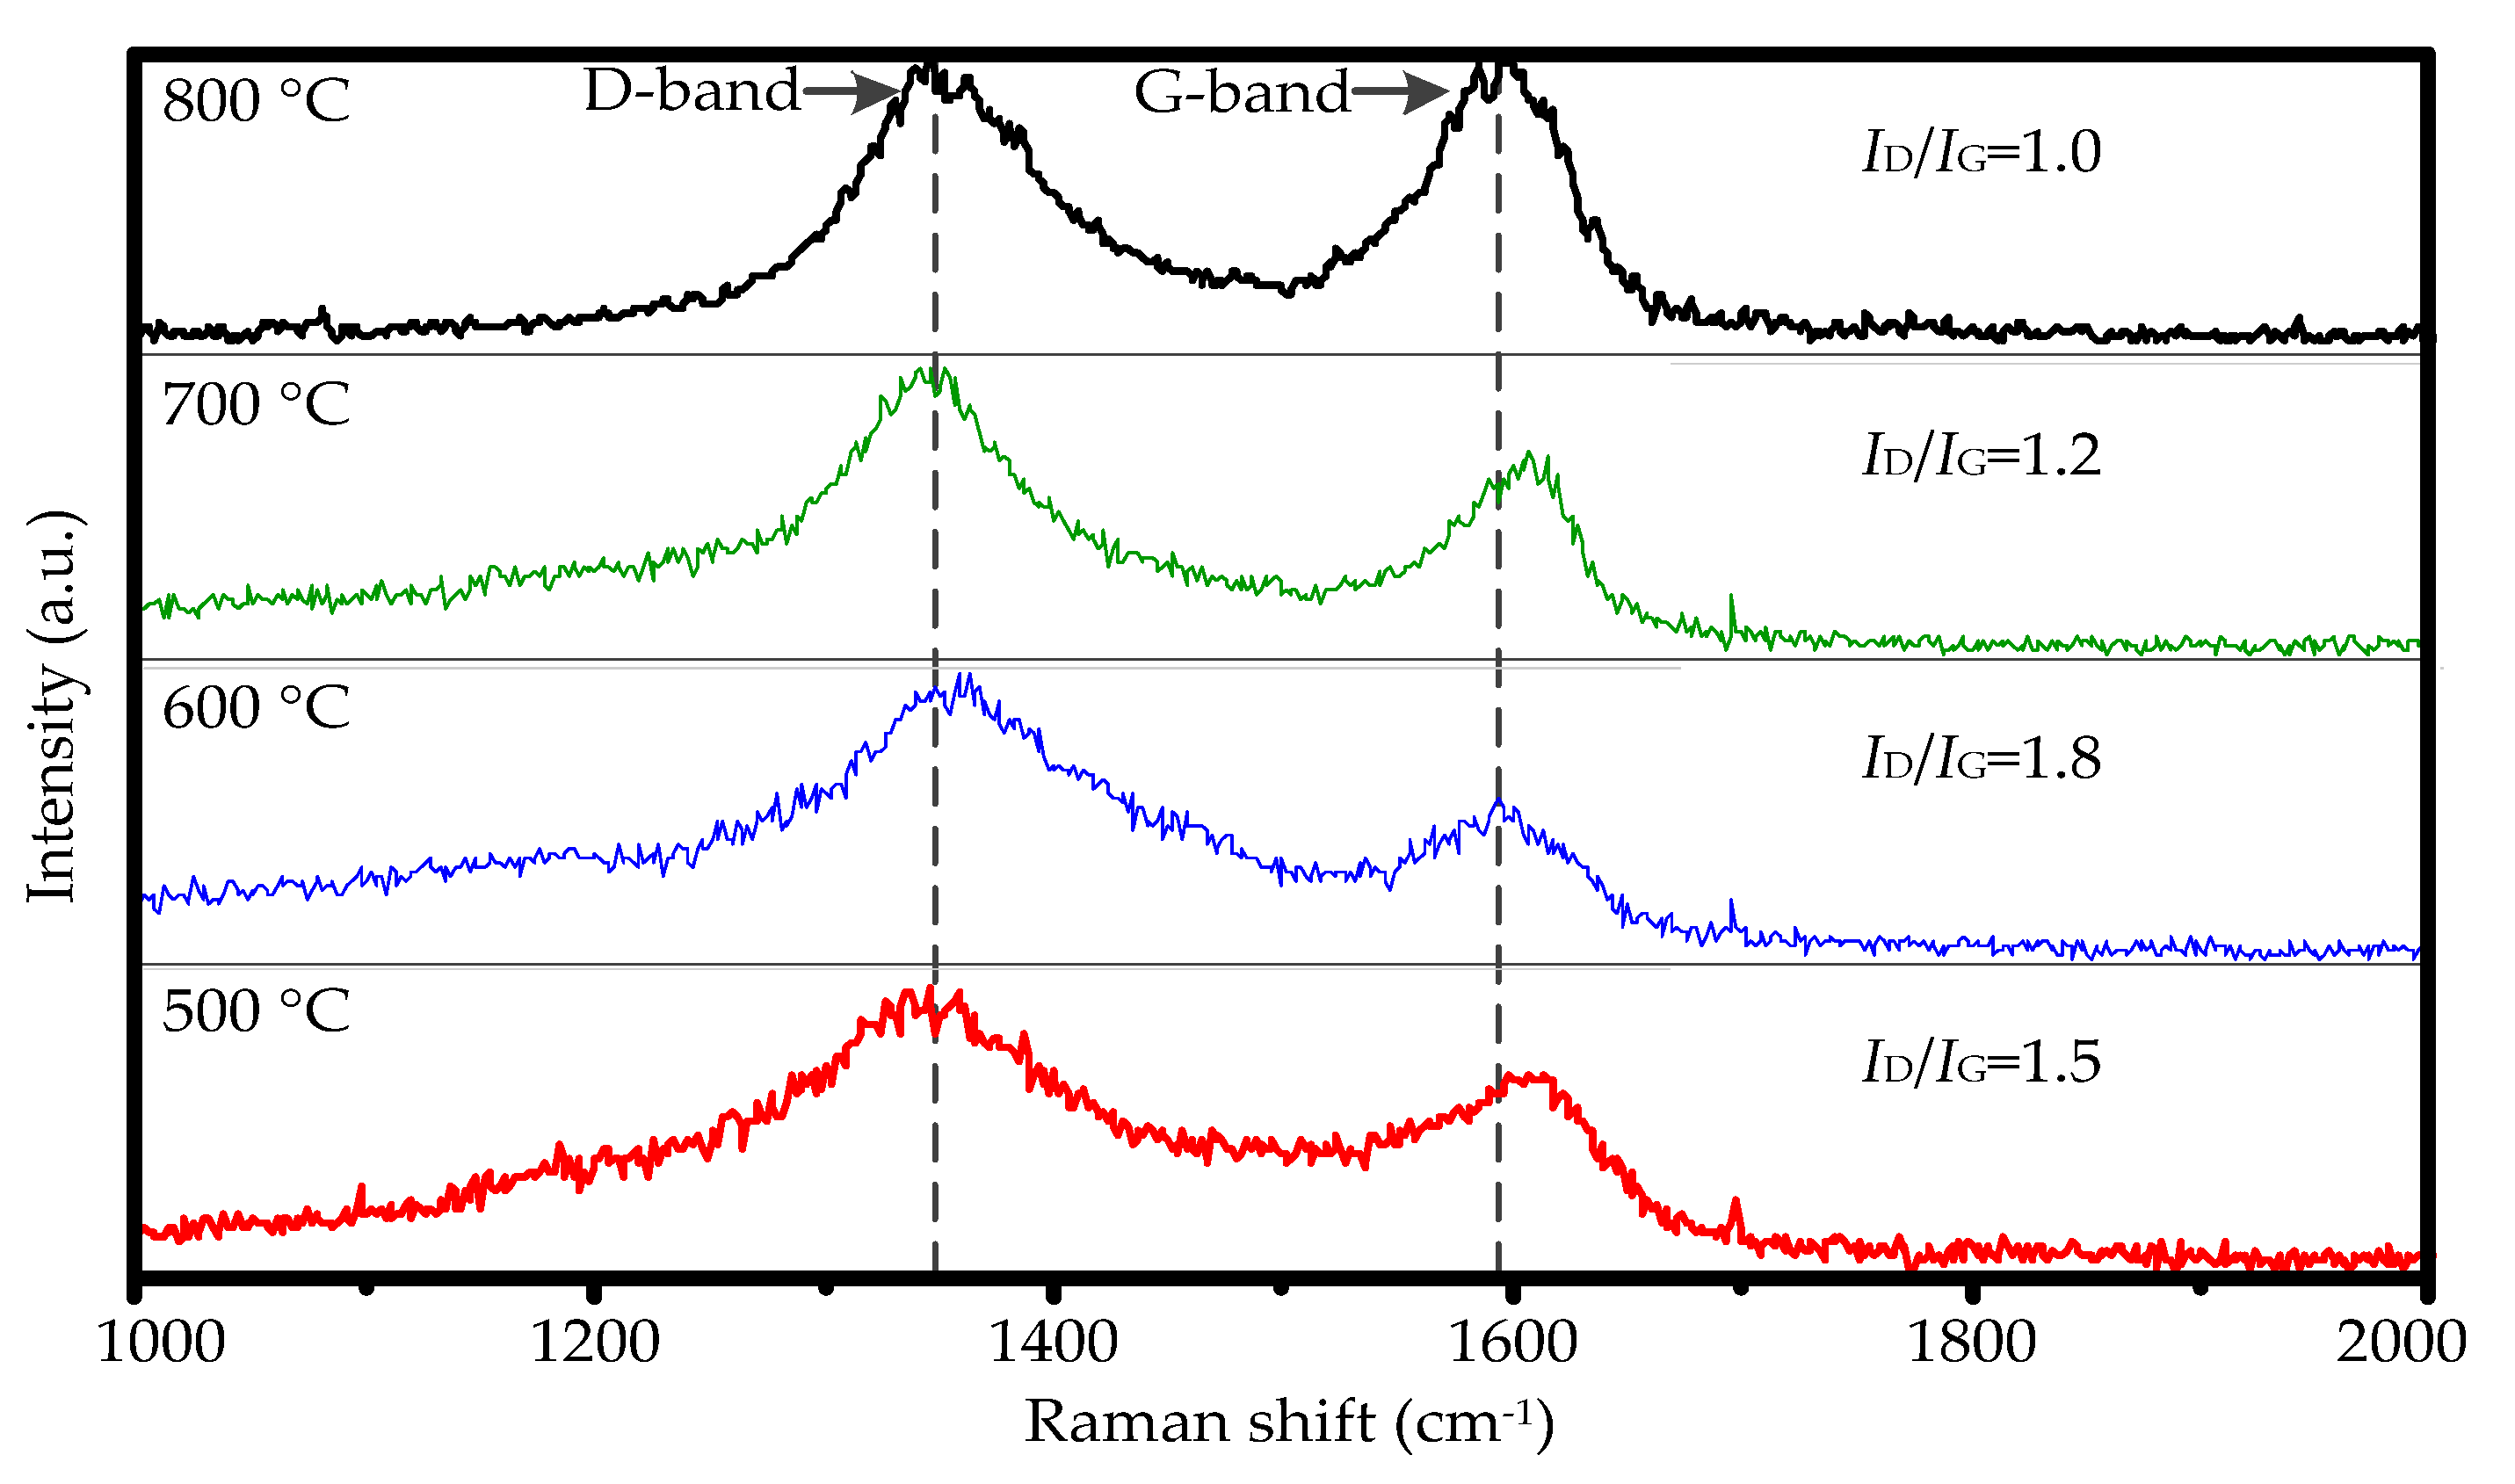
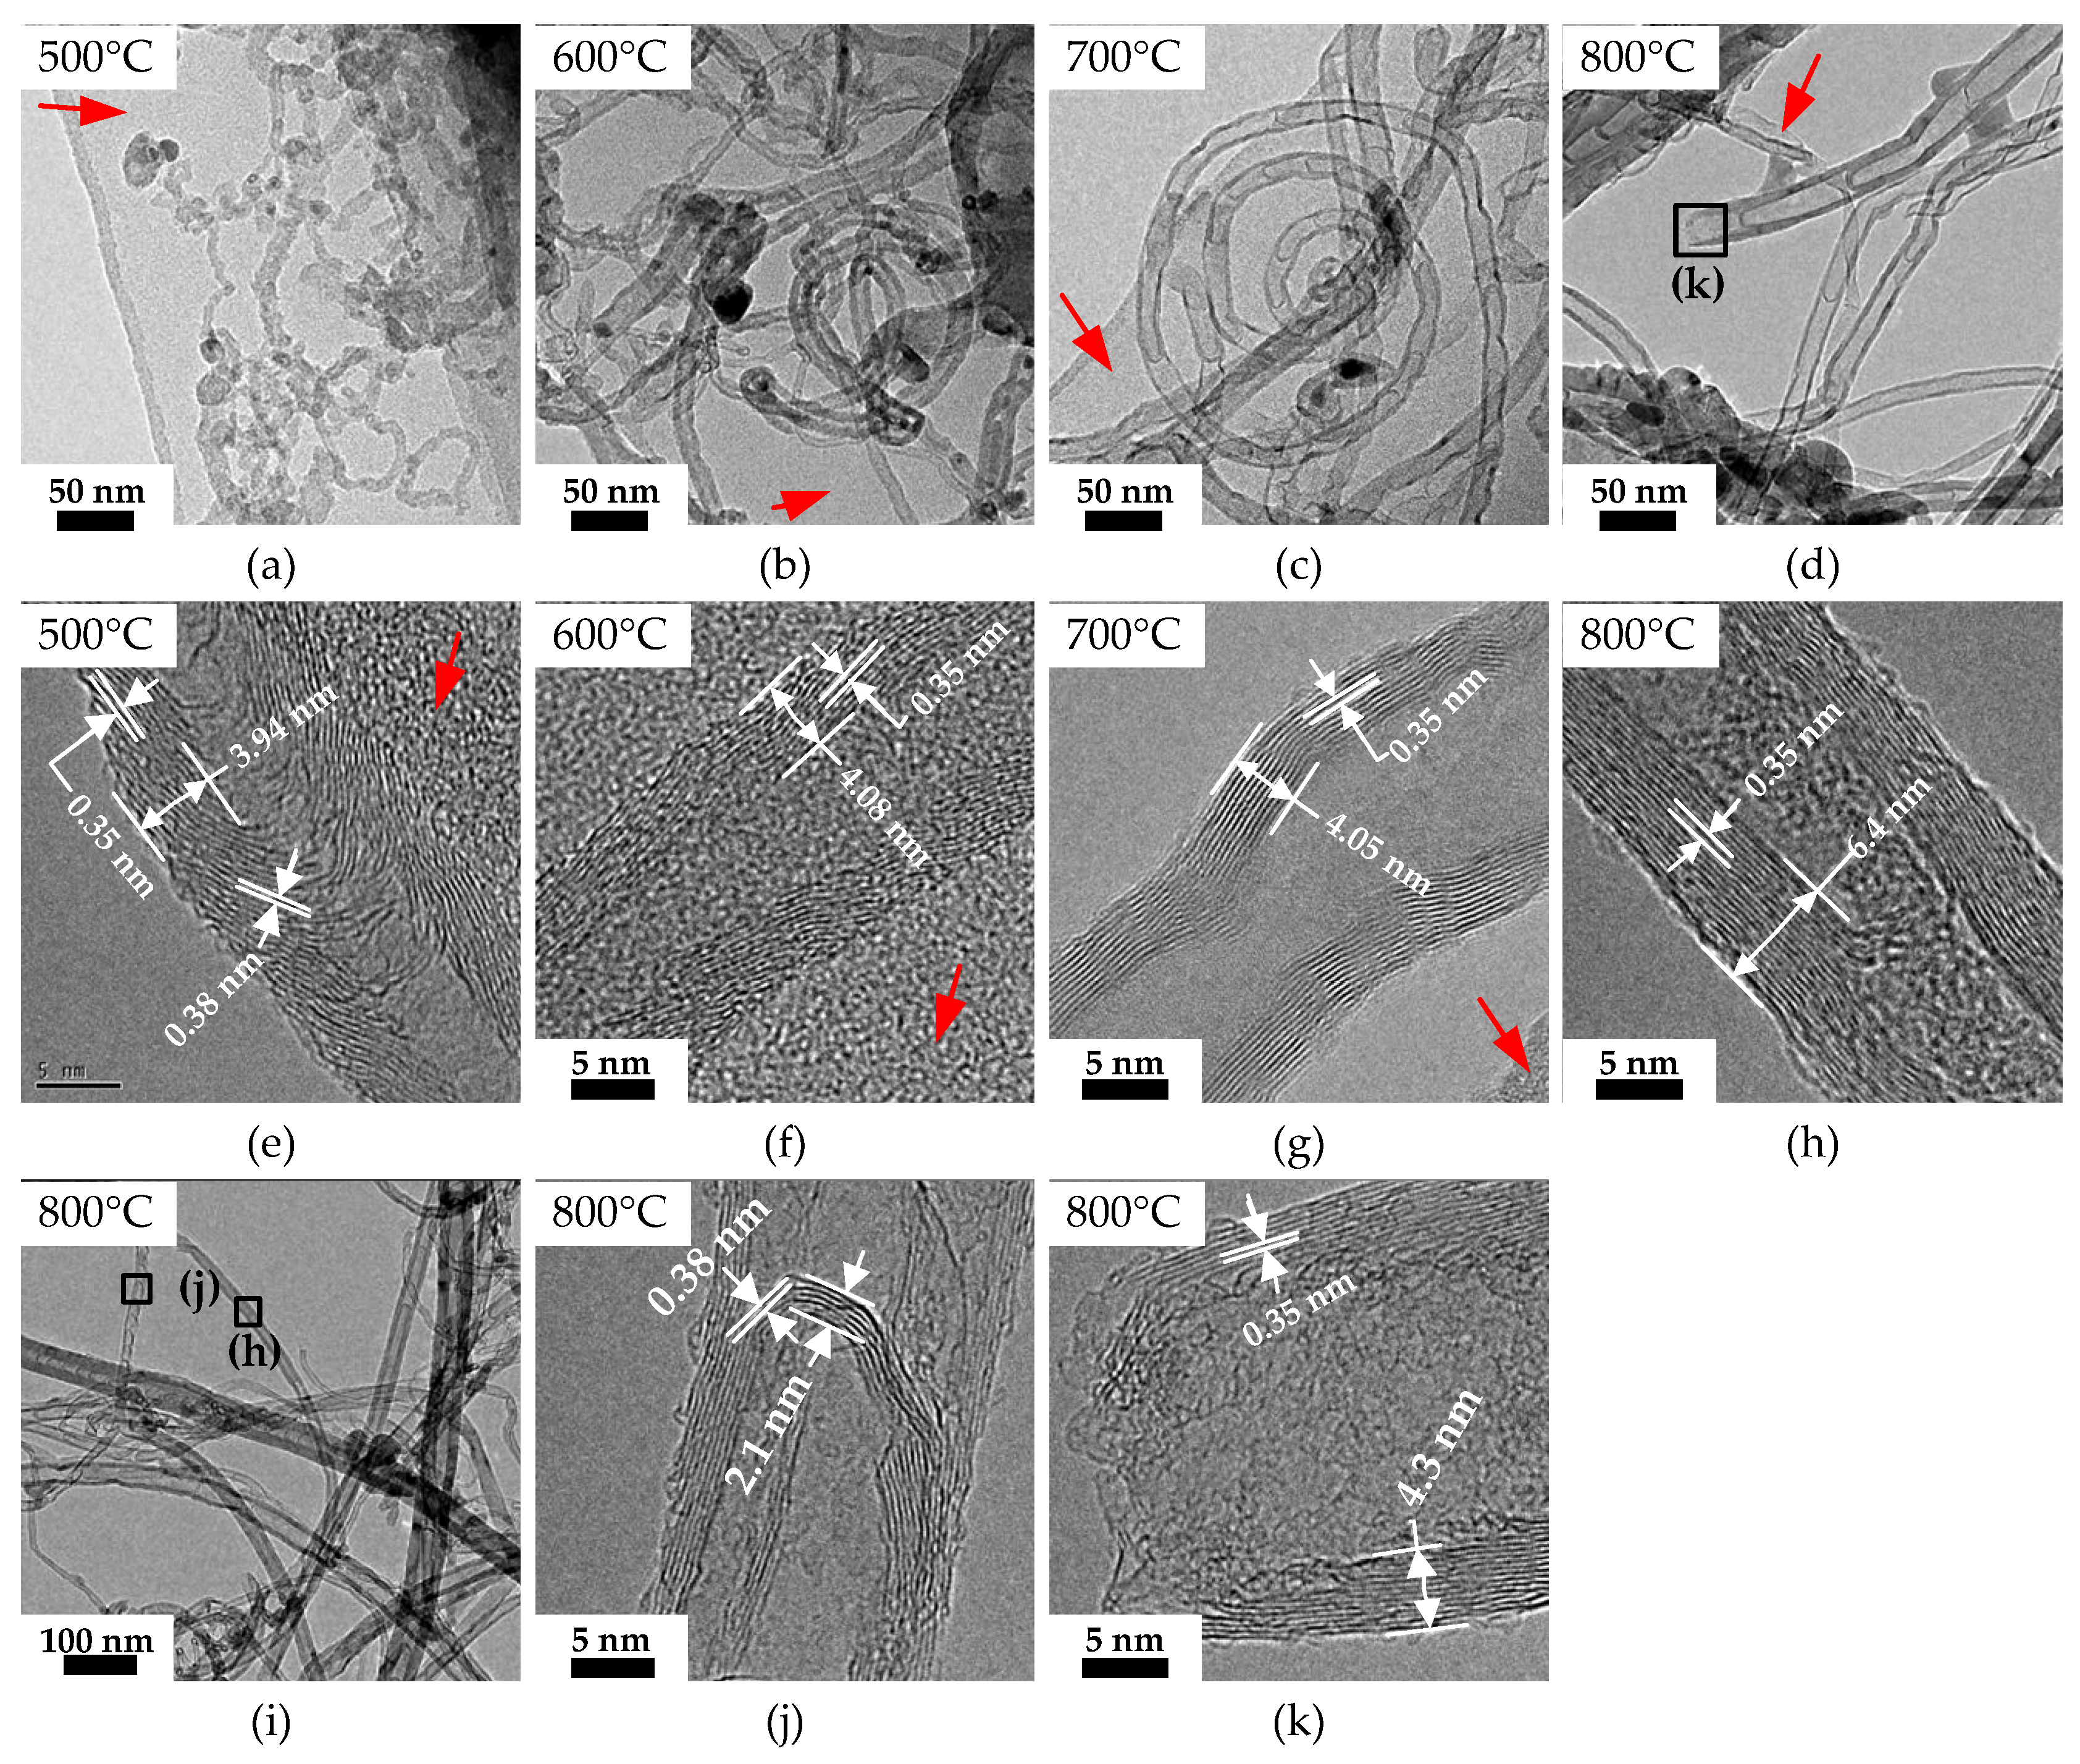
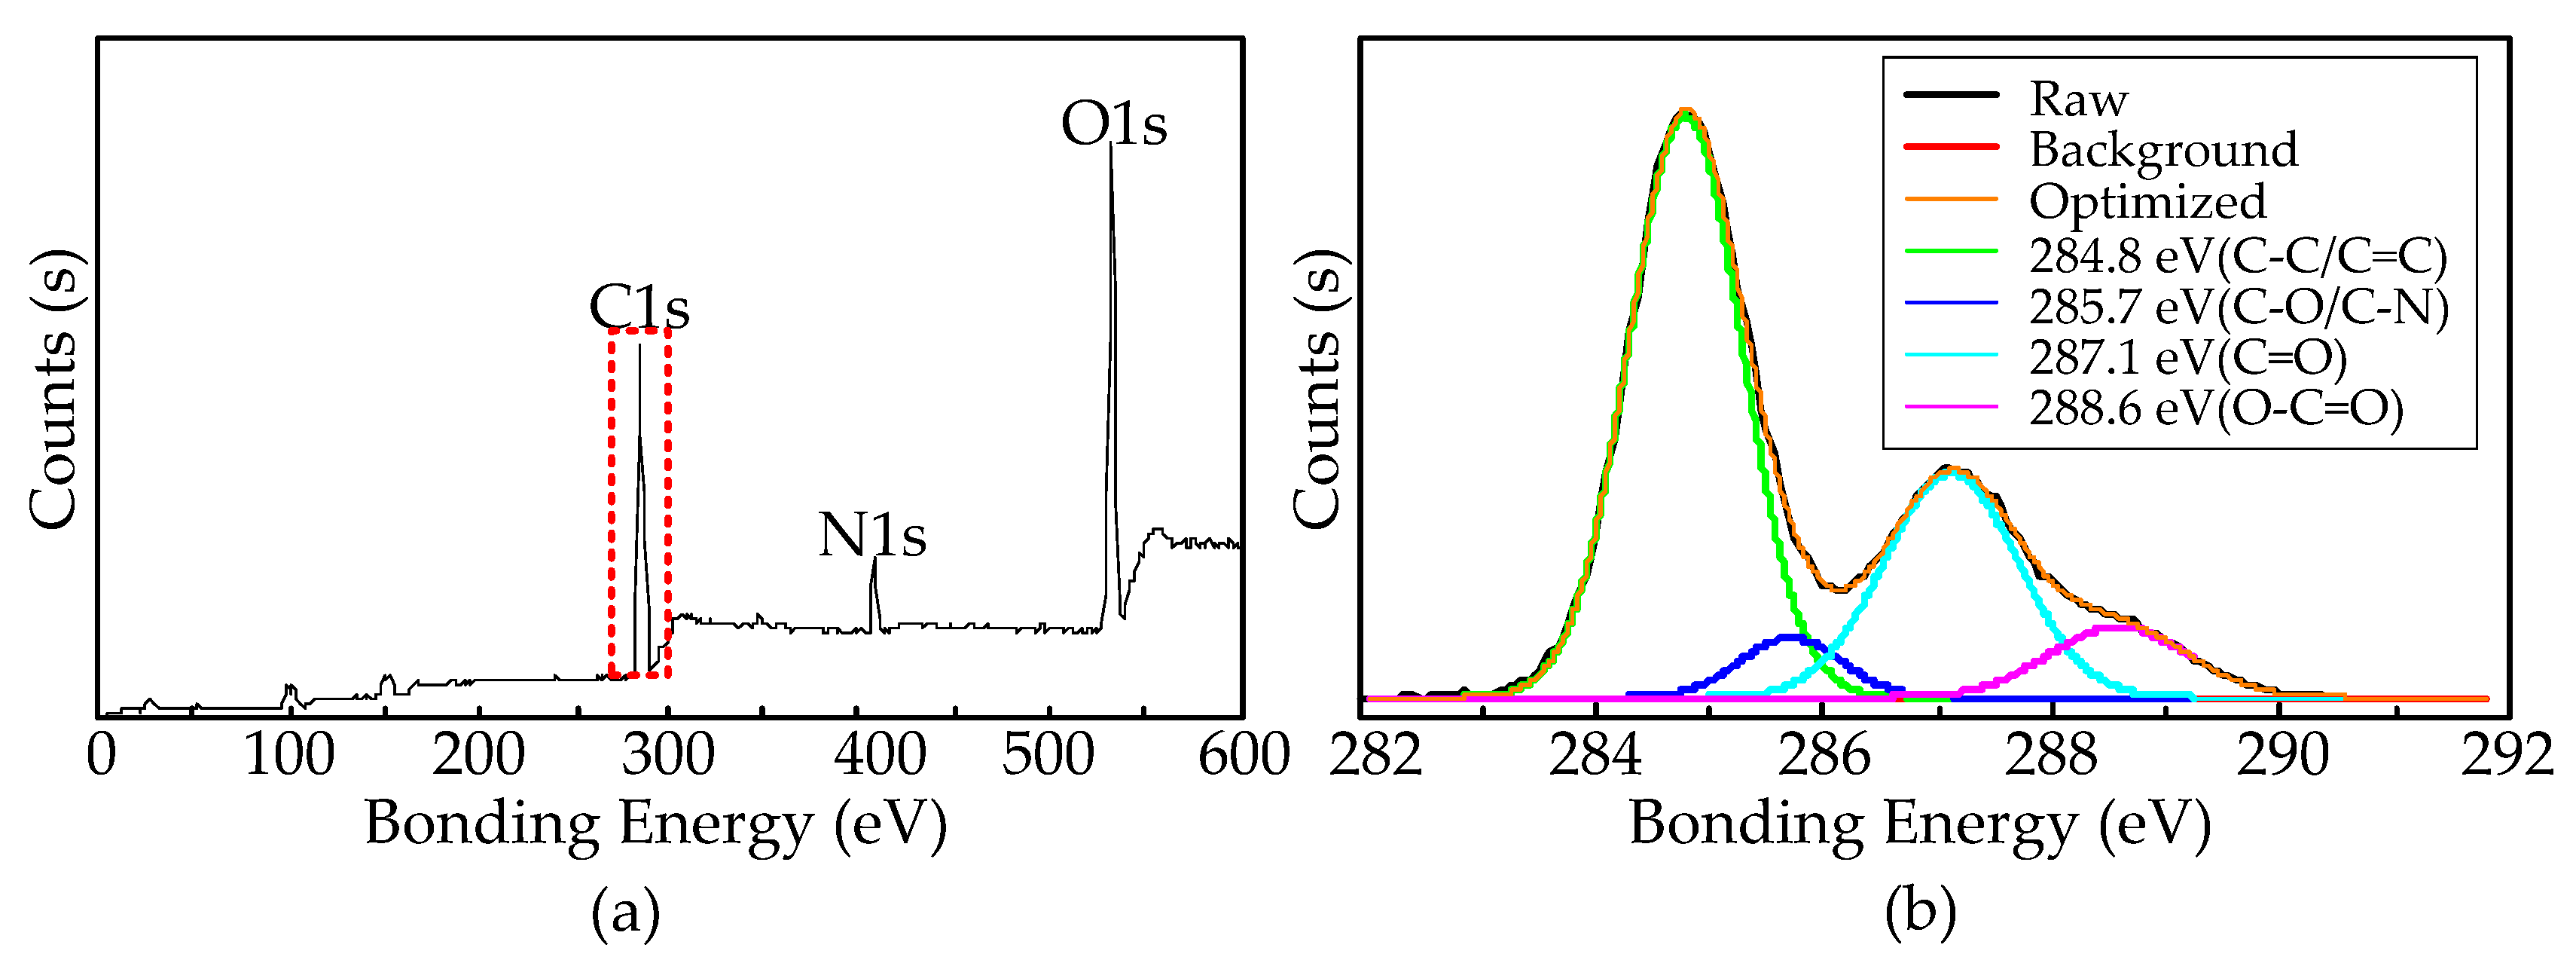
The experiment was carried out to understand the role of plasma in the decomposition of precursors. The research was divided into two groups: one was an experimental group with the 200 W atmospheric pressure microwave plasma, and the other was without plasma. When the plasma is turned off at room temperature, we measure the initial concentration of the exhaust gas and then use gas chromatography to detect the specific density of the exhausted gas treated by the different temperatures of 400, 500, 600, 700, 800, 900, and 1000 °C, with and without plasma. The ethanol content rates are obtained by comparing the ethanol content at different temperatures with the original content. Through the comparative analysis of exhaust gas composition at different temperatures, the roles of microwave plasma and temperature can be figured out.
Figure 3 shows the ethanol content rates at the temperature of 400, 500, 600, 700, 800, 900, and 1000 °C, with and without microwave plasma. When the plasma is turned off, the apparatus will become an atmospheric pressure CVD; the ethanol content rates decreased with the increase of furnace temperatures. When the furnace temperature was as high as 1000 °C, the ethanol content rate was 26.86%. However, the ethanol content rate was all about 1% at any furnace temperature when the microwave plasma was turned on. In the experiment, no other organic hydrocarbon except ethanol was found in the gas chromatograph test results, indicating that the active group did not recombine into hydrocarbons. Therefore, we can conclude that the 200 W atmospheric pressure microwave plasma almost completely decomposes the precursor.

3.3. CNTs

Figure 4 shows the Raman spectra of the samples grown at 500, 600, 700, and 800 °C on the surface of the substrate with the laser of 514 nm at room temperature. In all curves, two peaks centered at 1360 and 1593 cm−1 were observed. Both of them correspond to the D and G bands of the graphitic phase, indicating the presence of crystalline graphitic MWCNTs [16]. With the increase of the synthesis temperature, the D peak narrowed and the G peak heights increased. The intensity ratio of D peak and G peak (ID/IG) is sensitive to structural defects in the MWCNTs. The smaller the ratio, the higher the degree of graphitization. The ID/IG ratio decreased with the increase of the synthesis temperature from 600 to 800 °C; the lowest ID/IG ratio (1.0) was found at 800 °C. The G peak of pure graphite is at 1582 cm−1; the defects in the samples caused the blue shift of G peak, verifying that the products’ defect concentration is relatively high. From the view of the HRTEM, the products are mainly nanotubes, as shown in Figure 6; we can prove that the products are CNTs. The ID/IG ratio of CNTs grown on stainless steel substrate by PECVD [17,18,19,20,21] is 1.0–1.5, similar to that by AMPCVD. The ID/IG ratio of CNTs grown on 316 stainless steel pretreated by oxidation processes is 0.48–0.56 at 800–900 °C [16], indicating that the stainless steel substrate mainly determines the quality of the CNTs and the quality of CNTs synthesized by AMPCVD is as good as other kinds of PECVD processes.
According to the results of plasma spectrum detection and exhaust gas detection, the ethanol precursor almost completely decomposed into active groups by 200 W atmospheric pressure microwave plasma. The recombination of carbon groups into CNTs mainly depends on temperature. We introduced the concept of conversion efficiency of carbon to describe the effect of temperature on the growth of CNTs. It represents the ratio of the carbon content of the grown CNTs to the total ethanol precursor.
Figure 5 shows the SEM micrographs and the diameter distribution of the CNTs grown on the substrate with 200 sccm ethanol precursors at the temperature of 500, 600, 700, and 800 °C. The CNTs synthesized on the stainless steel substrate lie on the substrate face, with disordered orientation and uniform distribution, consistent with the results reported in the literature [19,21], which use stainless steel substrate to grow CNTs by CVD and PECVD. It is proved that the morphology of CNTs is caused by the stainless-steel substrate. Figure 5a,d,g,j and 5b,e,h,k is the low magnification and high magnification images of the CNTs grown at the temperature of 500, 600, 700, and 800 °C, respectively. The total mass of CNTs increased with the increase of the temperature at the range of 500–800 °C. When the temperature is 800 °C, the total mass of CNTs is 300 mg. The carbon content of the total ethanol precursor is about 312 mg, indicating that approximately 96% of the precursor converted into CNTs. The precursor conversion efficiency at 500, 600, 700, and 800 °C was calculated, and they are 2%, 17%, 42%, and 96%, respectively. In the temperature range of 700–800 °C, the conversion efficiency of precursor increases significantly, indicating that the most suitable temperature for the growth of CNTs should be in the range of 700–800 °C; this needs further research.
Figure 5c,f,i,l are the diameter distribution of the CNTs grown at the temperature of 500, 600, 700, and 800 °C, respectively. With the increase in temperature, the diameter of CNTs gradually increase. The reason is that the active Fe nanoparticle, as the “seed” of the CNTs produced on the stainless-steel substrate, needs a suitable temperature range. These active nanoparticles act as catalysts during the growth of CNTs. The size and quantity of active Fe nanoparticles on the substrate increases with the increase of temperature. It makes the diameter and the precursor conversion efficiency of the CNTs increase. When the tube furnace temperature is 400 °C and 1000 °C, no CNTs grow on the substrate. The reason is that the surface activity of the stainless-steel substrate is too low to catalyze the growth of the CNTs when the temperature of the furnace is 400 °C. At 1000 °C, the surface of the stainless-steel substrate melts completely, which then cannot provide “seeds” for the growth of the CNTs.
Figure 6 shows the HRTEM micrographs of CNT ethanol dispersions dropped on a carbon-coated TEM grid. The CNTs tangle with each other, and their layers are in the range of 10–20, respectively. The wall thickness and distance between layers of the CNTs at different temperatures were measured, as shown in Figure 6. The walls of the CNTs at all temperatures are tightly aligning with a high density of graphite sheets, with a distance between layers of 0.35–0.38 nm. The layer number and wall thickness of carbon nanotubes increase with the increase of temperature. A large number of amorphous carbon layers attached to the CNTs produced at low temperatures, as shown by red arrows in Figure 6. With the increase of the temperature, the content of amorphous carbon decreased. This phenomenon is consistent with our Raman analysis results. The CNTs prepared at 700 and 800 °C consist of hollow compartments, looking like bamboo, which are not apparent at 500 and 600 °C. The carbon walls of the hollow always bulge towards the root of the CNTs. According to the vapor–liquid–solid growth method, in the growth process of CNTs, active liquid Fe nanoparticles dissolve gaseous carbon particles and then precipitate carbon atoms to form CNTs. The carbon dissolution rate of active liquid Fe nanoparticles at the temperature of 700 and 800 °C is higher than that at 500 and 600 °C, so the growth rate of CNTs is faster. When the carbon dissolution rate of Fe nanoparticles is higher than that of precipitation, new carbon layers formed, resulting in the bamboo structure.
Compared with the carbon walls of the CNTs, we found that the carbon layers of CNTs grown at high temperatures are smoother and cleaner than that grown at low temperatures. The reason is that high temperature makes the process of dissolving and precipitating carbon faster and makes it easier to grow continuous carbon layers. Figure 6j,k shows the magnified view of the joint between the wall and the hollow and the open end structure of the CNTs. XPS further characterized the CNTs prepared at 800 °C.
XPS measurement was carried out to investigate the surface functional groups of the synthesized CNTs. As shown in Figure 7a,b, the CNTs contain C, N, and O, and the magnified view of C1s peak indicate that they are mainly composed of C-C/C=C (284.8 eV, 59.27%), and the surface defects of CNTs are -C-OH/C-N (285.7 eV, 5.33%), -C=O (287.1 eV, 26.73%), and -COOH (288.6 eV, 8.67%). The oxygenated functional groups on the surface of CNTs were mainly from the hydroxyl groups obtained from ethanol decomposition, which caused the high defect concentration of the CNTs.

4. Conclusions

We achieved the utilization of the AMPCVD to decompose ethanol precursor by microwave plasma and the controllable synthesis of nanomaterial in a high-temperature tube furnace separately. The emission spectrum of the Ar-ethanol-H2 microwave plasma shows that the plasma decomposed the ethanol precursor into CH, C2, and OH groups. The results of the ethanol contents in the exhausted gas at the temperature of 400, 500, 600, 700, 800, 900, and 1000 °C, with and without plasma, also show that the decomposition capacity of 200 W atmospheric pressure microwave plasma is powerful. The CNTs were synthesized by the AMPCVD using ethanol vapor as the carbon source, with a temperature of 500, 600, 700, and 800 °C at atmospheric pressure. The tube furnace temperature controls the growth of CNTs. The Raman spectra show that the defect concentration of CNTs decreases with the rise of furnace temperature, and the quality of CNTs obtained at 800 °C is relatively high. The prepared CNTs, characterized by SEM, HRTEM, and XPS, show that the CNTs are multiwalled, tangled with each other, bamboo-shaped structured, and have a large amount of oxygen-containing functional groups on the surface, especially aldehydes. Compared with CVD, the CNTs synthesized by AMPCVD have a higher growth rate and lower defect concentration with the same substrate. Compared with DC-PECVD, RF-PECVD, and MPCVD, the quality of the CNTs synthesized by AMPCVD is similar, but with no vacuum equipment required. This indicates AMPCVD has excellent potential in nanomaterial synthesis, and further research is needed.

Author Contributions

Conceptualization and supervision, L.T., and D.L.; methodology, D.L.; validation, L.T., and B.G.; formal analysis, D.L., and L.T.; resources, D.L.; data curation, D.L.; writing—original draft preparation, D.L. and L.T.; writing—review and editing, D.L. All authors have read and agreed to the published version of the manuscript.

Funding

This work is supported by the National Key Research and Development Program of China (2016YFF0102100) and the Pre-research Project of Civil Aerospace Technology of China (D040109).

Acknowledgments

The high temperature tube furnace and sealing technology are supported by Tianjin ZHONGHUAN Electric Furnace Co. Ltd.

Conflicts of Interest

The authors declare no conflict of interest. The funders had no role in the design of the study; in the collection, analyses, or interpretation of data; in the writing of the manuscript, or in the decision to publish the results.

References

  1. Iijima, S. Helical microtubules of graphitic carbon. Nature 1991, 354, 56–58. [Google Scholar] [CrossRef]
  2. Ren, Z.F.; Lan, Y.C.; Wang, Y. Physics, Concepts, Fabrication and Devices. In Aligned Carbon Nanotubes; Avouris, P., Bhushan, B., Bimberg, D., Klitzing, K., Sakaki, H., Weesendanger, R., Eds.; Springer: Berlin/Heidelberg, Germany, 2013; pp. 67–71. [Google Scholar]
  3. Cheng, J.; Zou, X.P.; Yang, G.Q. Temperature Effects on Synthesis of Multi-Walled Carbon Nanotubes by Ethanol Catalyst Chemical Vapor Deposition. Adv. Mater. Res. 2010, 123, 799–802. [Google Scholar] [CrossRef]
  4. Li, W.Z.; Xie, S.S.; Qian, L.X.; Chang, B.H.; Zou, B.S. Large-Scale Synthesis of Aligned Carbon Nanotubes. Science 1996, 274, 1701. [Google Scholar] [CrossRef] [PubMed]
  5. Eres, G.; Puretzky, A.A.; Geohegan, D.B. In situ control of the catalyst efficiency in chemical vapor deposition of vertically aligned carbon nanotubes on predeposited metal catalyst film. Appl. Phys. Lett. 2004, 84, 1759–1761. [Google Scholar] [CrossRef] [Green Version]
  6. Suman, N.; Mauricio, L.; Melissa, C. Synthesis and field emission properties of vertically aligned carbon nanotube arrays on copper. Carbon 2012, 50, 2641–2650. [Google Scholar]
  7. Wang, Y.H.; Lin, J.; Huan, C.H. Synthesis of large area aligned carbon nanotube arrays from C2H2-H2 mixture by rf plasma-enhanced chemical vapor deposition. Appl. Phys. Lett. 2001, 79, 680–682. [Google Scholar] [CrossRef]
  8. Caughman, J.B.O.; Baylor, L.R.; Guillorn, M.A.; Merkulov, V.I.; Lowndes, D.H. Growth of vertically aligned carbon nanofibers by low-pressure inductively coupled plasma-enhanced chemical vapor deposition. Appl. Phys. Lett. 2003, 83, 1207. [Google Scholar] [CrossRef]
  9. Okai, M.; Muneyoshi, T.; Yaguchi, T.; Sasaki, S. Structure of carbon nanotubes grown by microwave-plasma-enhanced chemical vapor deposition. Appl. Phys. Lett. 2000, 77, 3468. [Google Scholar] [CrossRef]
  10. Kuttel, O.M.; Groening, O.; Emmenegger, C.; Schlapbach, L. Electron field emission from phase pure nanotube films grown in a methane/hydrogen plasma. Appl. Phys. Lett. 1998, 73, 2113. [Google Scholar] [CrossRef]
  11. Bower, C.; Zhu, W.; Jin, S.H.; Zhou, O. Plasma-induced alignment of carbon nanotubes. Appl. Phys. Lett. 2000, 77, 830. [Google Scholar] [CrossRef] [Green Version]
  12. Xiao, Y.; Ahmed, Z.; Ma, Z.C.; Zhou, C.J.; Zhang, L.N.; Chan, M. Low Temperature Synthesis of High-Density Carbon Nanotubes on Insulating Substrate. Nanomaterials 2019, 9, 473. [Google Scholar] [CrossRef] [PubMed] [Green Version]
  13. Chen, C.K.; Perry, W.L.; Xu, H. Plasma torch production of macroscopic carbon nanotube structures. Carbon 2003, 41, 2555–2560. [Google Scholar] [CrossRef]
  14. Shin, D.H.; Hong, Y.C.; Uhm, H.S. Production of Carbon Nanotubes by Microwave Plasma-Torch at Atmospheric Pressure. Phys. Plasmas 2005, 12, 053504. [Google Scholar]
  15. Lenka, Z.; Marek, E.; Ondrej, J. Characterization of Carbon Nanotubes Deposited in Microwave Torch at Atmospheric Pressure. Plasma Process Polym. 2007, 4, S245–S249. [Google Scholar]
  16. Tripathi, P.V.; Durbach, S.; Coville, N.J. Synthesis of Multi-Walled Carbon Nanotubes from Plastic Waste Using a Stainless-Steel CVD Reactor as Catalyst. Nanomaterials 2017, 7, 284. [Google Scholar] [CrossRef] [PubMed]
  17. Abad, M.D.; Sanchez, J.C.; Berenguer, A.; Golovko, V.B. Catalytic growth of carbon nanotubes on stainless steel: Characterization and frictional properties. Diam. Relat. Mater. 2008, 17, 1853–1857. [Google Scholar] [CrossRef]
  18. Park, D.; Kim, Y.H.; Lee, J.K. Pretreatment of stainless steel substrate surface for the growth of carbon nanotubes by PECVD. J. Mater. Sci. 2003, 38, 4933–4939. [Google Scholar] [CrossRef]
  19. Park, D. Synthesis of carbon nanotubes on metallic substrates by a sequential combination of PECVD and thermal CVD. Carbon 2003, 41, 1025–1029. [Google Scholar] [CrossRef]
  20. Yao, B.D.; Wang, N. Carbon nanotube arrays prepared by MWCVD. J. Phys. Chem. B 2001, 105, 11395–11398. [Google Scholar] [CrossRef]
  21. Hashempour, M.; Vicenzo, A.; Zhao, F.; Bestetti, M. Direct growth of MWCNTs on 316 stainless steel by chemical vapor deposition: Effect of surface nano-features on CNT growth and structure. Carbon 2013, 63, 330–347. [Google Scholar] [CrossRef]
Figure 1. Schematic diagram of the atmospheric pressure microwave plasma chemical vapor deposition (AMPCVD) used for carbon nanotube (CNT) synthesis.
Applsci 10 04468 g001
Figure 2. The measured spectrums of Ar-H2 and Ar-ethanol-H2 microwave plasma in atmospheric pressure.
Applsci 10 04468 g002
Figure 3. The ethanol contents at different temperatures in the exhaust gas, with and without plasma treatment.
Applsci 10 04468 g003
Figure 4. Raman spectra of the samples obtained at 500, 600, 700, and 800 °C on the substrate.
Applsci 10 04468 g004
Figure 5. The SEM micrographs of the CNTs grown on the substrate with 200 sccm ethanol precursor at the temperature of 500, 600, 700, and 800 °C. (a,d,g,j): the low magnification images; (b,e,h,k): the high magnification images; (c,f,i,l): the diameter distribution of samples.
Applsci 10 04468 g005
Figure 6. HRTEM images of CNTs prepared by APMCVD at the temperature of 500, 600, 700, and 800 °C. (ad): low magnification images; (eh): high magnification images; (ik): specific structure of the CNTs grown at 800 °C.
Applsci 10 04468 g006
Figure 7. XPS and Raman spectra of CNTs prepared at 800°C. (a): the global spectra; (b): the magnification view of C1s.
Applsci 10 04468 g007

