Article

Ce- and B-Doped Silica Fibers for Monitoring Low-Energy Proton Beams on a Medical Cyclotron

1
Life Sciences Division, TRIUMF, 4004 Wesbrook Mall, Vancouver, BC V6T 2A3, Canada
2
Department of Computer Science, Mathematics, Physics and Statistics, University of British Columbia Okanagan, 1177 Research Road, Kelowna, BC V1V 1V7, Canada
3
BTI Targetry LLC, 1939 Evans Road, Cary, NC 27513, USA
4
D-Pace, 625 Front Street, Nelson, BC V1L 4B6, Canada
*
Author to whom correspondence should be addressed.
Appl. Sci. 2020, 10(13), 4488; https://doi.org/10.3390/app10134488
Submission received: 10 June 2020 / Revised: 25 June 2020 / Accepted: 27 June 2020 / Published: 29 June 2020
(This article belongs to the Special Issue Beam Diagnostics for Medical Application)

Abstract

:

Featured Application

Use of fiber optics to monitor a target on a medical cyclotron.

Abstract

Many medical isotopes can be produced on a small cyclotron. The alignment and profiles of low-energy proton beams from cyclotrons used for medical radioisotope production, such as the TR13 cyclotron at TRIUMF, Canada, cannot be directly quantified during dose delivery with simultaneous constant feedback and sharp spatial resolutions. Doped silica fibers are a potential solution that has been tested at TRIUMF. To measure the effects of irradiation inside an isotope production target, we attached fibers to the outside of an 18O gas target and measured the light output during irradiation. Different dopants, fiber diameters, and target materials were investigated. It was found that 200 µm diameter Ce- and B-doped fibers produce signals linearly proportional to the beam current. This only deviated when the target was moved such that the beam was steered into the target wall, increasing the production of prompt radiation and causing the beam current to decrease but the fiber signal to increase. With the technique described here, the beam can be monitored on the target, including its steering and its overall alignment with the target.

1. Introduction

Many isotopes for diagnostic and therapeutic applications can be produced on a medical cyclotron. To maximize the production of medical radioisotopes, the system’s parameters must be understood. Therefore, the shape, trajectory, and the location of the proton beam relative to the production target must be quantified to optimize production yields. Currently, for low energy cyclotrons, no techniques are available that allow for real-time monitoring of proton beams that also enable operators to evaluate the beam position and angle relative to the target being irradiated, or the beam shape in real time and in situ. High energy particle beams can be profiled in real time by intercepting the beam with sensors. Unfortunately, low energy cyclotrons cannot easily be profiled in this manner as these materials would absorb a large fraction of the beam’s energy; thus, reducing the cyclotron’s production efficiency [1]. Concomitantly, these devices are at risk of thermal failure due to their propensity to accumulate excess power at production currents. Alternative methods of beam profiling include periodically traversing the beam with a wire [2], radiographically analyzing irradiated foils using radiosensitive films [1,3], optimizing the beam while irradiating a scintillating material and quantifying the results [4], using electrically isolated materials at the front of the target such as collimators [5], or tuning the beam at the beginning of a production run using a beam profile monitor [1]. Nonetheless, none of these methods provide an online, rapid feedback with sharp spatial resolution for measuring the beam profile and trajectory simultaneously onto a target. Overall prompt radiation has also been measured to monitor target conditions [5].
One possible solution that has shown promise for profiling proton, photon, and electron beams are Ce-doped silica-fiber optics [6,7,8,9]. In fact, these fibers have previously been tested at TRIUMF to measure dose response and steering of proton beams for proton therapy [6,10], and at Bern University Hospital to characterize an 18 MeV proton beam used for medical isotope production [11] where it was used as a beam profile monitor incorporated into a beam line.
When placed near a proton beam, ionizing radiation such as gamma rays or neutrons deposit energy in doped optical fibers and excite or ionize electrons, and consequently leave the atoms of the dopant in an excited state. These excited states are short-lived, and thus the atoms decay fluorescently to return to their ground state. The fluorescence can be transmitted via an optical transport fiber and detected by a photodetector, converting the radiance reading into a current related to the energy imparted on the fiber. The combination of fast fluorescence with small fiber optics allows for near real-time data acquisition and high spatial resolution [9].
Overall, being extremely thin and potentially radiation resistant in comparison to organic fibers, inorganic fiber optics offer an elegant solution to profile low energy cyclotron proton beams [10,12,13]. However, as the proton beam profile is only measured in the plane in which the fiber(s) probe the beam, the direction and divergence of the beam is only accessible if it is measured in several locations along the beam axis. Many isotope production cyclotrons are very compact and do not have room for one or several profile monitors in front of the production target. To still give information about the beam current, beam direction and beam divergence, we explored the possibility of attaching the fibers onto the outside walls of targets to provide information about the beam movement and its position by comparing the differing fluorescence intensities of the fiber array. The objective of this research was to evaluate the potential of fiber optics to give information about the current, contour, and trajectory of low energy proton beams.

2. Materials and Methods

2.1. Fiber Optic Setup

The doped silica fibers provided by D-Pace were fabricated by the University of Milano-Bicocca’s Department of Material Science (UMB-DMS) using the sol–gel process [6,14]. The fibers were SiO2 doped with Ce3+ ions and were drawn to a diameter of 200 μm or 600 μm. The fiber produces radio-luminescence (RL) emitted by the Ce3+ dopant ions due to excitation by ionizing radiation, with an emission band centered at 450 nm. The SiO2 fiber also produces luminescence due to Cherenkov radiation, which is characterized by a broad spectral emission in the blue-UV wavelength region [7]. The boron-doped fibers are manufactured from commercial grade borosilicate glass (model 0500, Hilgenberg, Germany). None of these fibers had a cladding or protective layer. Each fiber was terminated with an SMA 905 connector. The fibers used are summarized in Table 1.
As the fibers are delicate, the unit was then slid into a custom plastic housing, as shown in Figure 1b. To reduce the noise due to background light, the detector assembly was subsequently wrapped in black electrical tape. The fibers were attached to the outside of the 18O(p,n)18F gas target in position D with an inner length of 12 cm, routinely in use at our facility, see Figure 1a and Figure 2. To transport the light output to the photodetector, 13.5 m long plastic fibers of 1 mm in diameter were then attached to the SMA connector, and on the other end to a Multi-Pixel Photon Counter (MPPC, Hamamatsu model C11208-01(X); 100 ms gate time and 0.5 photon equivalent threshold selected for all experiments). To further reduce the noise from ambient light, the SMA connectors were also covered in black electrical tape as shown in Figure 1a. The MPPC was connected to a PC via a USB cable and the data from the MPPC was displayed and recorded via the provided software. The entire configuration is summarized in Figure 1c.

2.2. TR13 Cyclotron

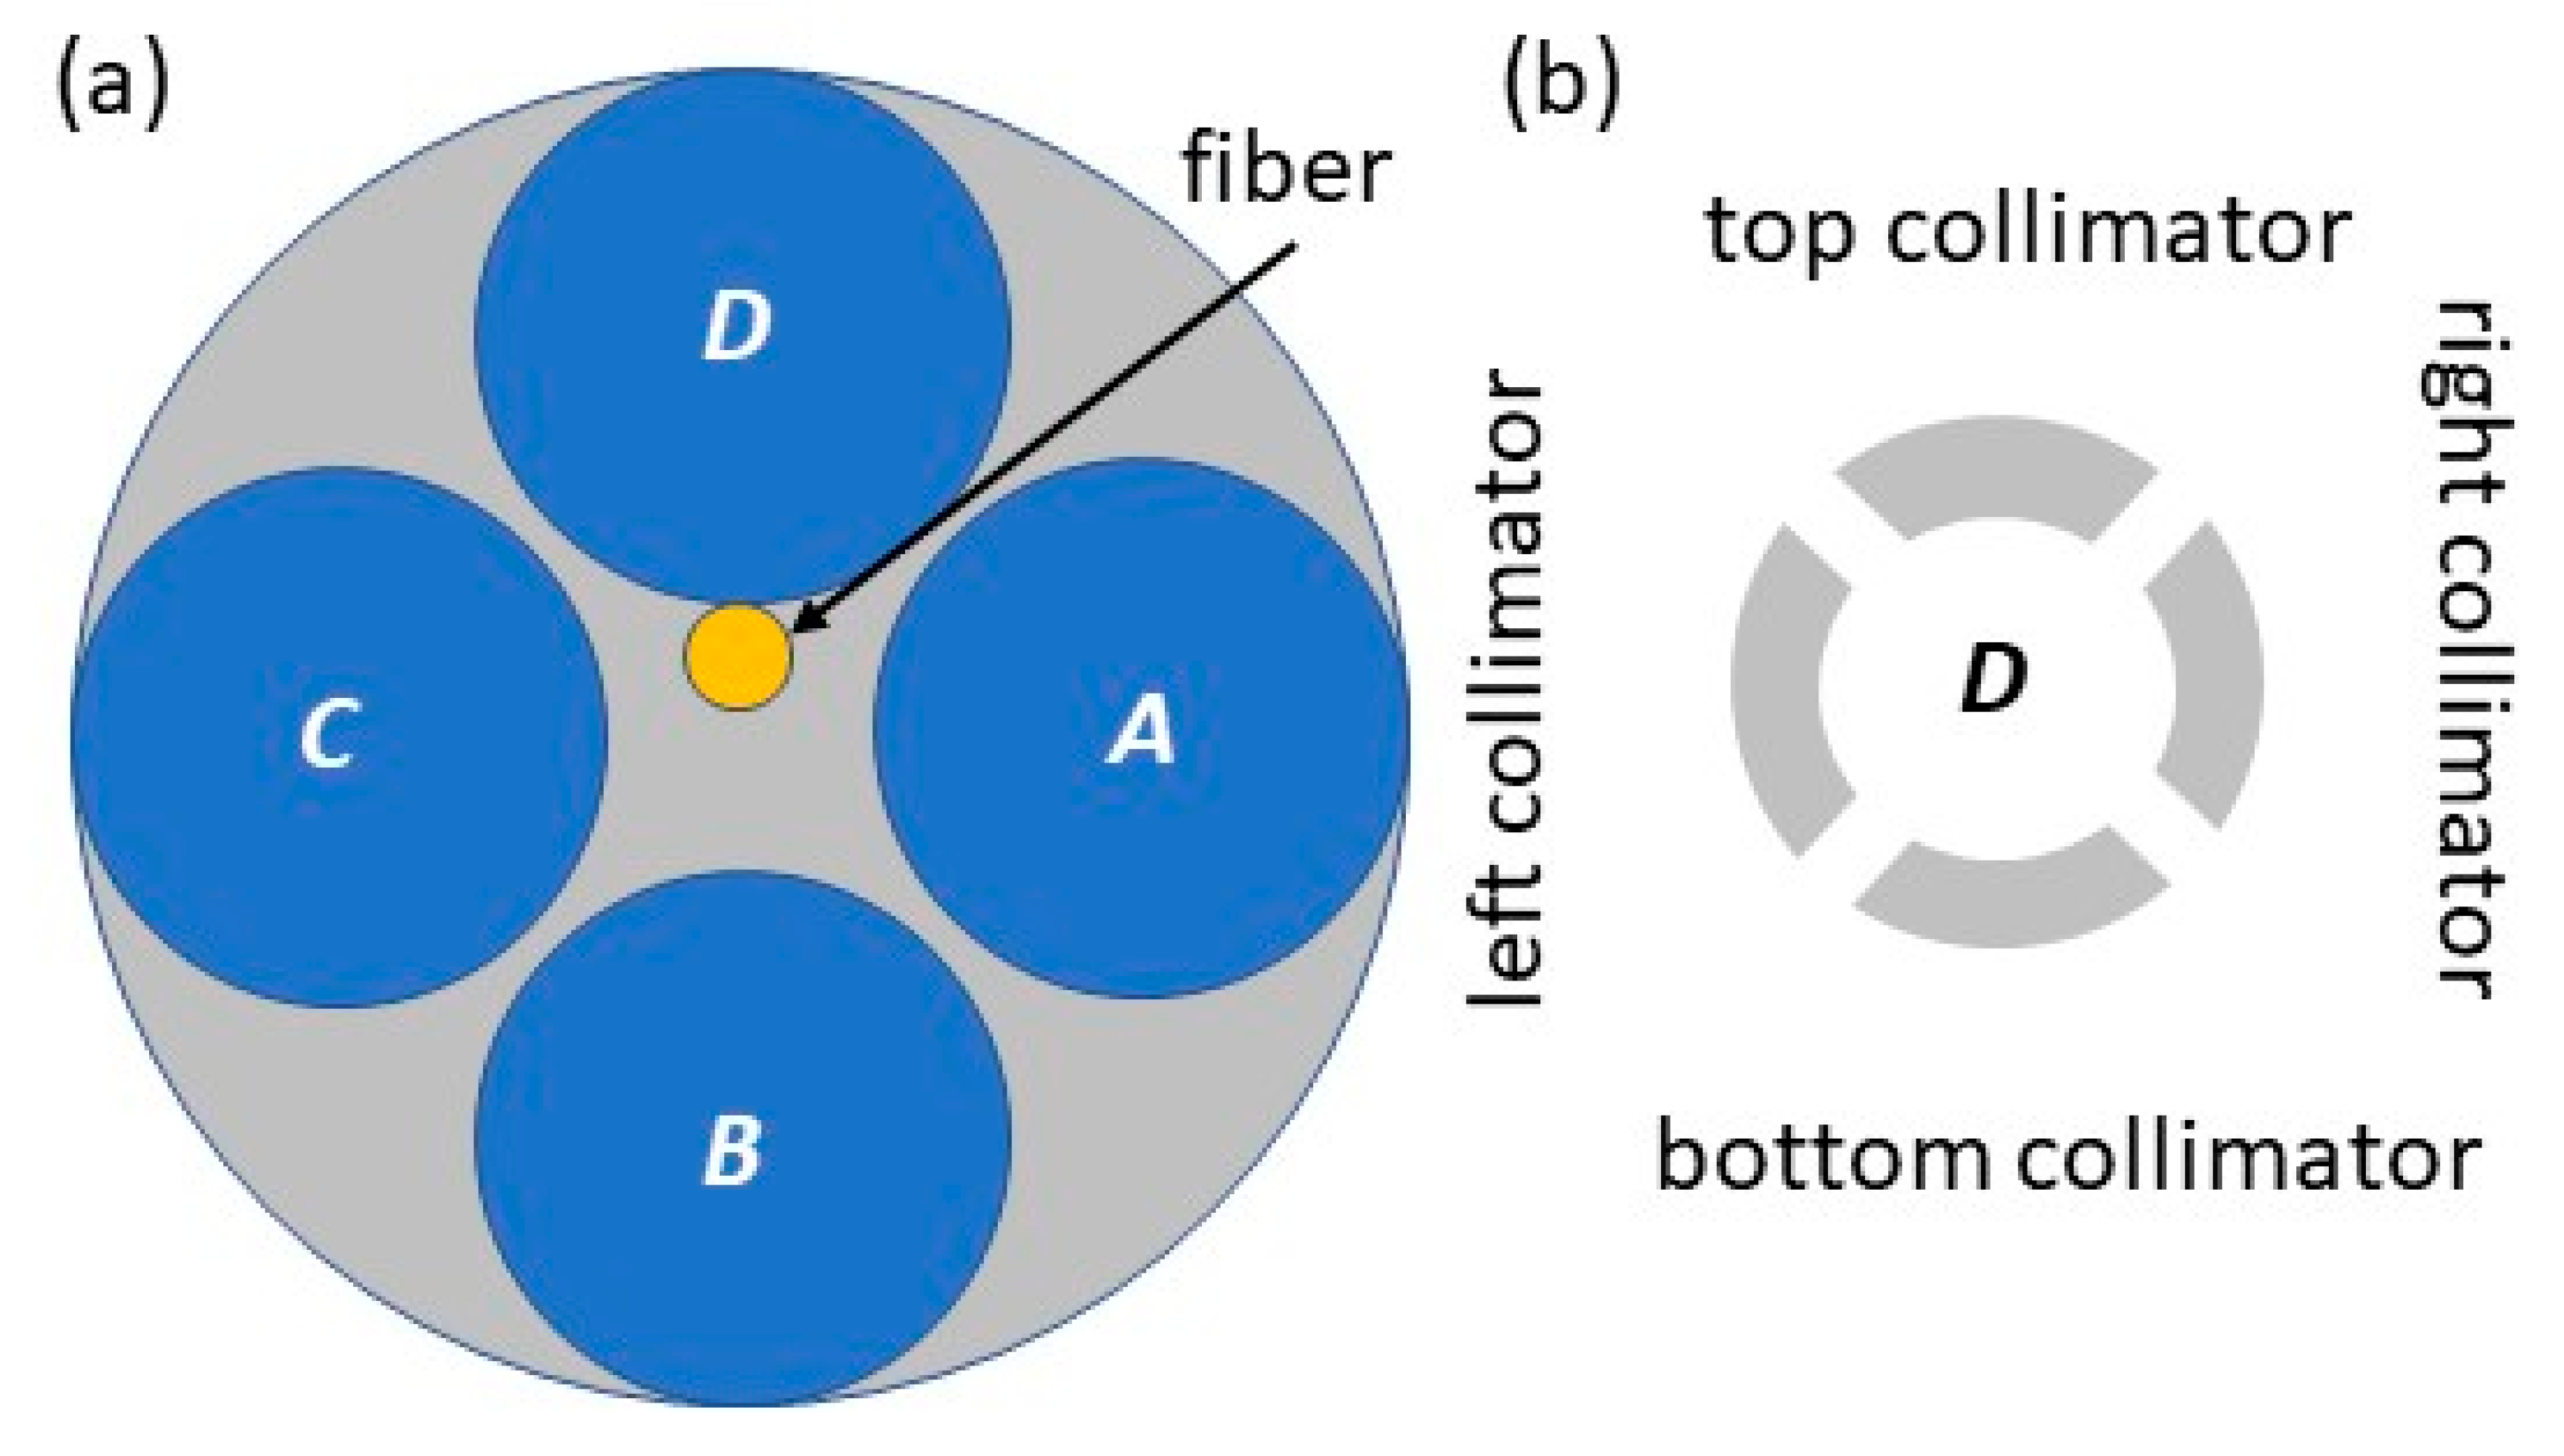
The TR13 at TRIUMF is a 13 MeV negative hydrogen-ion cyclotron used for producing medical isotopes [15]. This machine has a design energy output of 13–19 MeV. Due to its location at TRIUMF and shielding restriction, the extracted beam energy is restricted to 13 MeV by a permanent beam blocker installed in the acceleration plane. The H ions are transported through a short beam line from an external ion source. After they are accelerated to 13 MeV in the cyclotron, the ion flow is intercepted by a thin carbon foil, stripping the electrons from the H ions, reversing the charge, and thus yielding protons with a curvature opposite to the original trajectory. This allows for the extraction of the proton beam. The TR13 cyclotron has two beam exits on opposite sides, each with a target selector equipped with four target ports, mounted on moveable bellows. Every target position has four electrically isolated collimators tracing the beam’s position in relation to the target. A depiction of the target selector and a single target port is presented in Figure 2. The targets can be positioned into the axis of the beam using steering motors. The beam is centered by moving the target while monitoring the beam spill onto the collimators. The data points that were collected from the cyclotron during this analysis include the beam current, the left, right, top, and bottom collimator currents, and the gas pressure inside the target.
During the experiments, a solid target with a thallium disk was installed in target position A, a water target with de-ionized, natural water was installed in position B, a target plug was installed in position C, and the 18F gas target was installed in position D. The latter operates via a two-shot method, irradiating enriched 18O gas and subsequently irradiating an Ar/F2 mixture to recover the produced 18F from the target body wall. The maximum currents on each target were 10 µA for the water target, 15 µA for the thallium target, 20 µA for the Ar/F2 gas mixture, and 25 µA for the enriched 18O gas target.
The different irradiation conditions are summarized in Table 2. In general, the beam current was increased and decreased in 5 µA increments. As the MPPC only has one channel, the fiber was switched at the MPPC connector at the end of each current step so that the signal from both fibers could be measured during the same irradiation subsequently. In experiments 1A to C, no excessive beam steering by moving the target, other than to center the beam, was performed. For runs 2A and B, “regular” steering refers to instances where the current on each collimator was typically only increased to approximately 3 µA to stay under the trip level of the collimator. For experiment 3, “intense” steering refers to instances of steering the beam such that the collimator currents reached nearly 5 µA.

2.3. Analysis

To analyze each set of experiments, a Python 3.7.2 script was developed using JetBrains PyCharm Community Edition (2018.3.5 x64) equipped with the XlsxWriter (v1.1.5), numpy (v1.16.2), and pandas (v0.24.1) packages. Foremost, this code aligned the signals collected from the TR13 cyclotron (current on target and collimators and target pressure) with the signal received from the MPPC module. This was achieved by detecting the first increase in current readings, and the time when a change in the fiber’s signal measured a count-per-second reading greater than the average of the first 10 data points plus 1000 counts to be above the standard deviation of the noise level of the background. Additionally, since the MPPC module’s sample rate is 10 Hz and the TR13’s sample rate is 1 Hz, only one in every 10 fiber signals was used. If two fibers were being alternated during an experiment, the signals were separated by finding the point at which the fiber signal was reported as zero, signifying when a fiber was disengaged.
When investigating the effect of beam current on the fiber signal, a linear relationship is expected. Using the data acquired from the TR13 and the fiber, the Pearson correlation coefficients are then calculated in the code between the fiber signal and the collimator and beam currents. This coefficient is a statistical measure that evaluates the strength of a linear relationship where coefficients of ±1 signal a perfect positive or negative linear relationship, and of 0 corresponds to no linear relationship. This statistic was selected as our initial analyses revealed a linear relationship between the beam current and target pressure with the fiber signal, see Figure 3. The algorithm also returns the ranges of each beam current in steps of 5 µA. A signal processing method further detects the regions at which the target selector was moved, classified by points at which a collimator’s current is altered beyond a threshold of 0.045 µA. The correlations between the fiber signal and the beam current, and the correlations between the fiber signal and the affected collimators were calculated for each time period that the target selector was manipulated. The code also calculates the average signal of the beam and collimator currents, the pressure, and the fiber signal at each 5 µA step, and the corresponding standard deviations. This data is presented numerically and graphically in an Excel file using the XlsxWriter package. After all the experiments of a given configuration were analyzed, the correlation coefficients of each collimator and the incident beam current between the fiber signal were entered into an Excel file, along with the duration that the selector was moved for, and the beam current at which this occurred. With this information stored in a precise format, the code calculated the total average of the coefficients and the average at each current, along with the corresponding standard deviations.

3. Results and Discussion

3.1. Beam-Current Effect

Figure 3 shows the results from run 1A through D with the Ce-600 fiber, mounted on the Tl target (round/red points), the water target (square/black points) and the gas target (triangle/green points). The signal height tracks with the distance to the irradiated target and the target length and could be due to a geometric effect. It should also be noted that the prompt radiation from the different target materials is not the same due to the different nuclear reactions taking place.
Figure 3 shows the results from the Ce-200 fiber (inverted triangle/blue points). While the signal is lower than in the larger Ce-doped fiber when the 18O gas target is irradiated (triangle/green points), it does not scale with the cross-sectional area of the fiber by a factor of nine but only drops by a factor of four. It should be noted that the two Ce-doped fibers were of different lengths, with the larger fiber being 2.6 times longer, which may account for the difference in signal response.
The diamond/cyan points in Figure 3 show the result from the B-200 fiber with a signal height about 20% lower than with the Ce-200 fiber of the same diameter (inverted triangle/blue points). This could be due to a different light-output efficiency, especially as the B-doped fiber is 2.5 times longer than the Ce-doped fiber of the same diameter.
For all irradiations a correlation between the beam current and the fiber signal is observed, independent of the fiber diameter and dopant. The only deviation from linearity was observed for high currents in experiment 1C (triangle/green points), when the Ce-600 fiber was used at a current above 12 µA. Here, the correlation was anti-linear, decreasing with increasing beam current. This effect was reversible: Once the beam current was decreased, linearity was restored. One possible explanation could be the result of the high temperature due to the power deposition of the beam. In fact, previous research has indicated that excessive internal fiber temperatures lead to lower signal outputs [16]. Another hypothesis is that the MPPC at high light levels reacts with decreasing digital output. This is not observed with either 200 µm fiber, likely due to their reduced volume.
Based on the results, both the B-200 and Ce-200 fibers are valid candidates for measuring changes in beam current. A sufficiently strong signal is induced with a linear relationship even at higher currents, in addition to offering better spatial resolution than with the Ce-600 fiber.

3.2. Beam-Alignment Effect

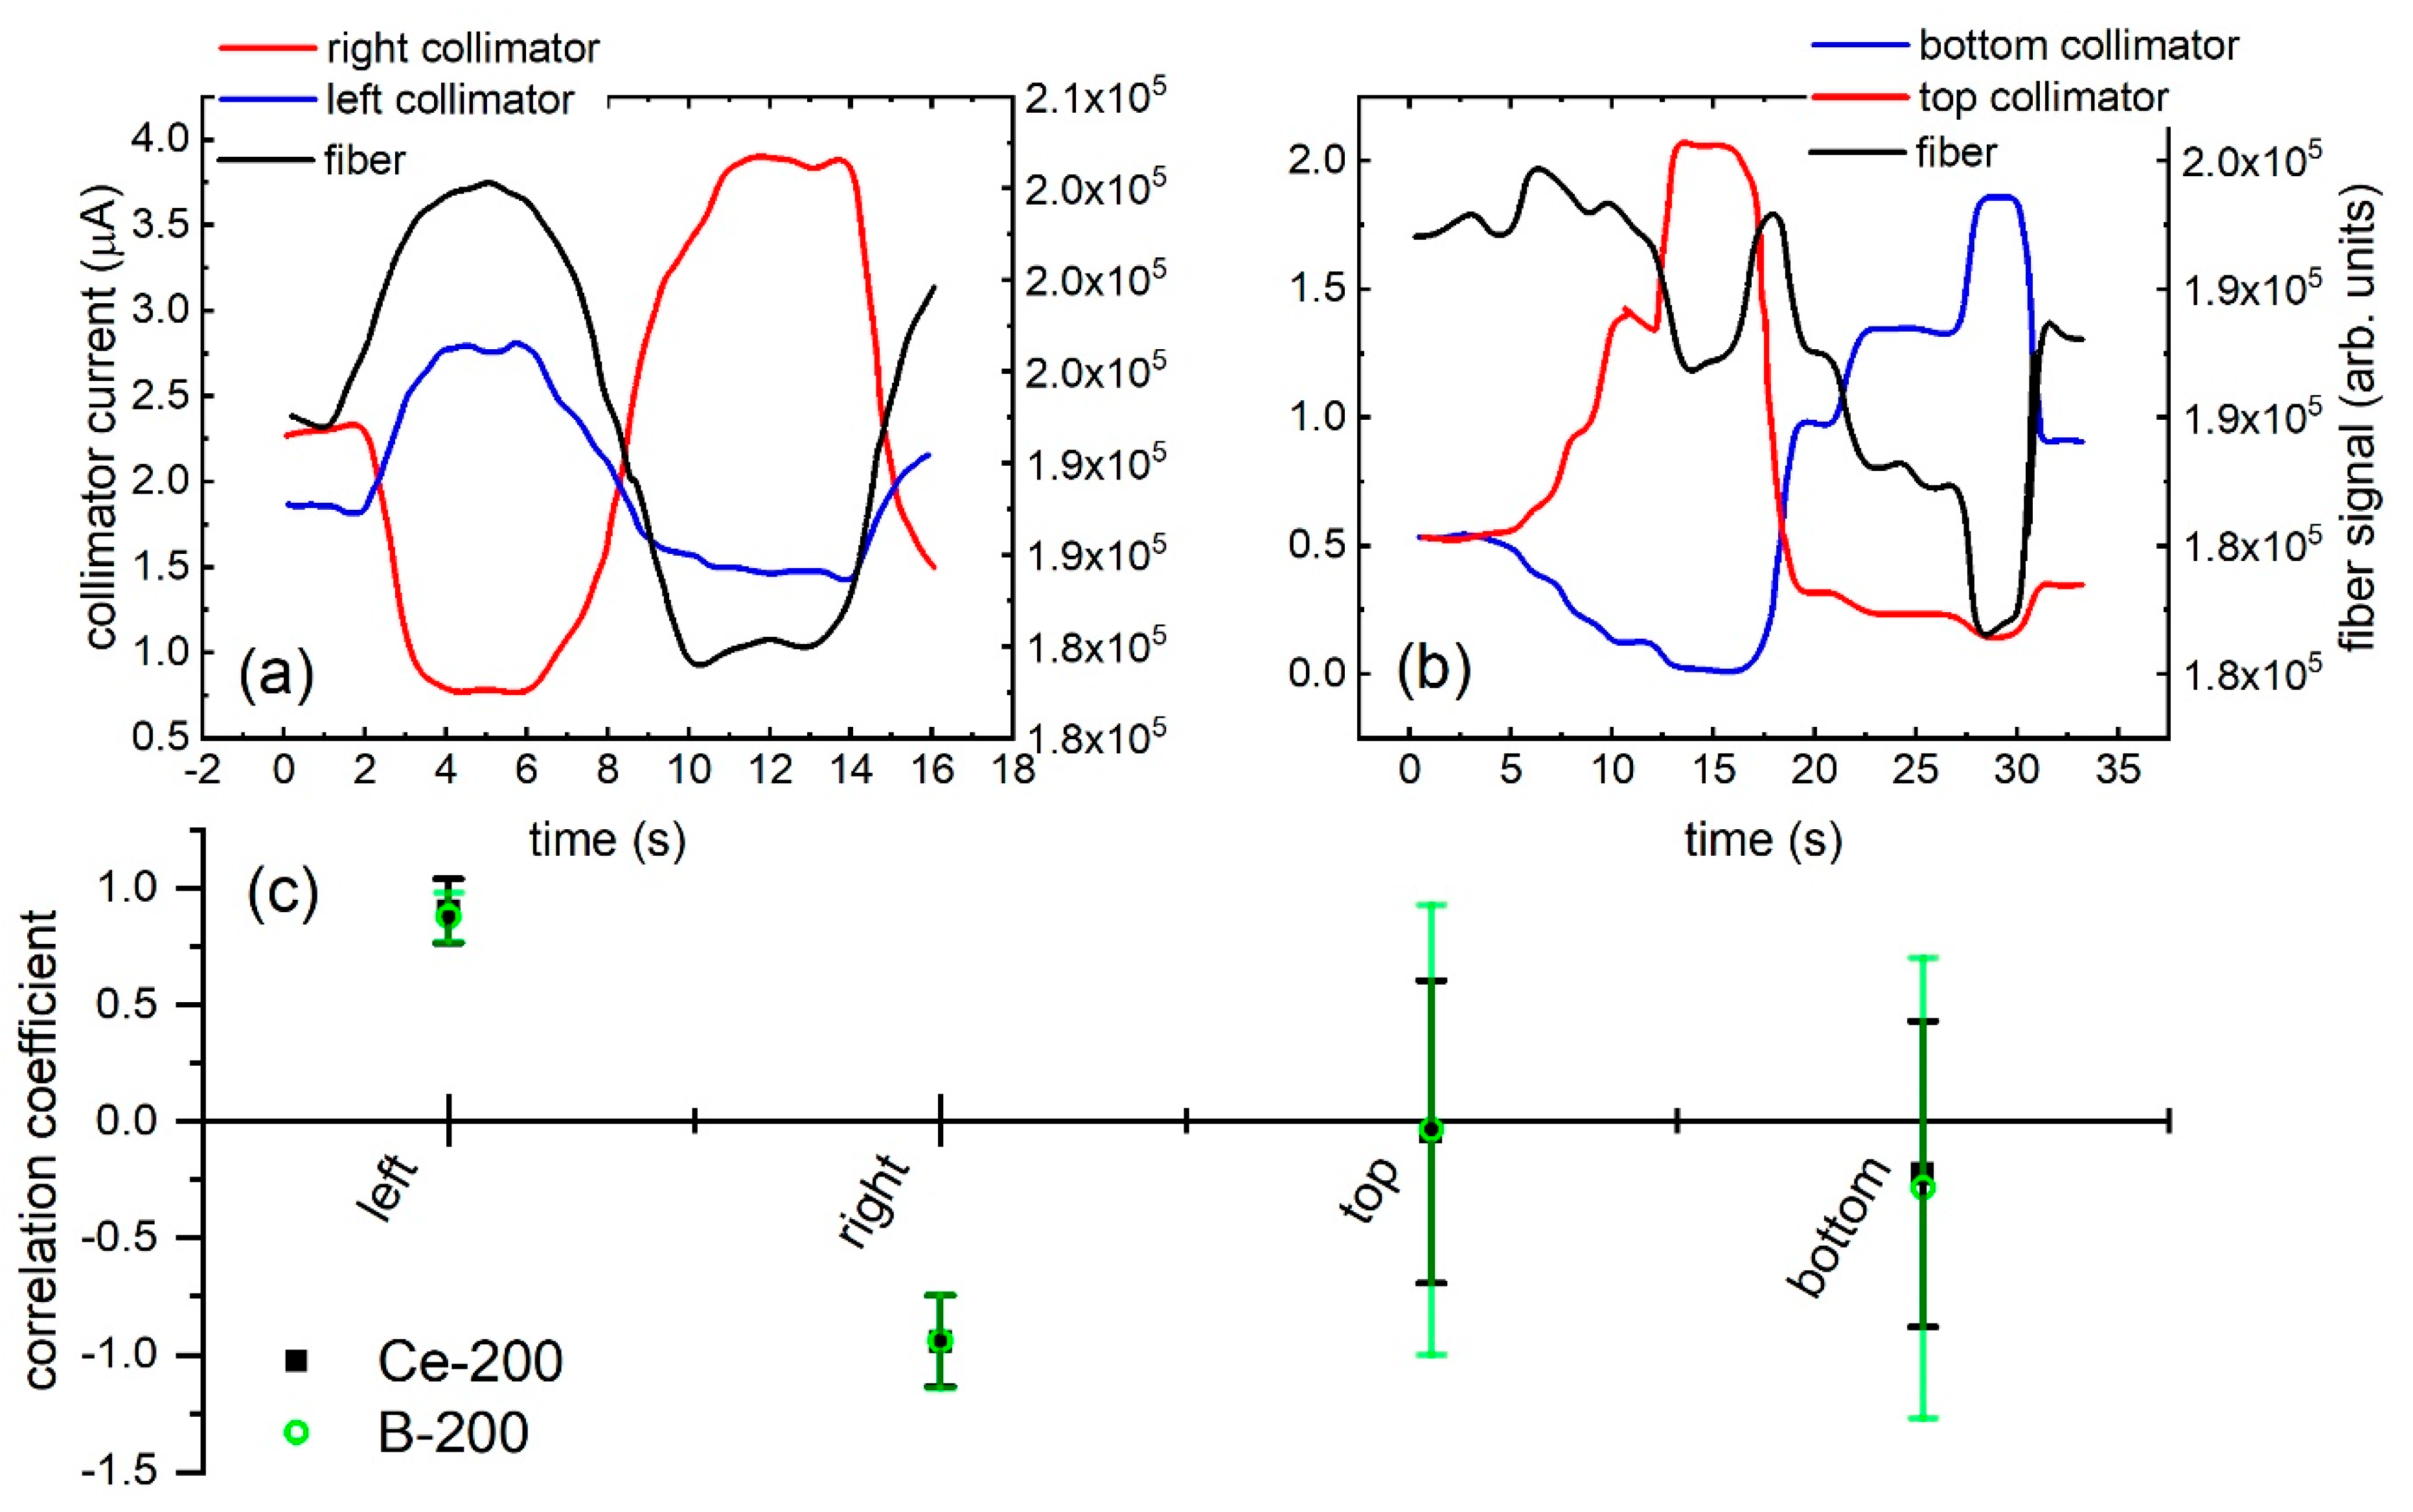
Experiments 2A and 2B were conducted at a target current of 20 µA when the beam was aligned with the target. The target selector was moved to resemble regular steering at each of the 5 µA current intervals. The purpose was to assess if the movement and position of the beam relative to the target could be detected using fiber optics. Figure 4a,b show an example from the Ce-200 fiber. Figure 4c summarizes all experiments with the Ce-200 and B-200 fiber, respectively. The fibers were mounted next to the bottom collimator, as shown in Figure 2.
Specifically, in Figure 4a the fiber signal increases when the beam is steered into the left collimator at time 5 s and decreases when it is steered into the right collimator at time 12 s. On the other hand, in Figure 4b, the fiber signal decreases when the beam is steered into the top collimator and decreases even more when it is steered into the bottom collimator. Additionally, the fiber signal peaks when the top collimator current is slightly greater than the bottom collimator current. Overall, there is not a clear correlation between the current on the top and bottom collimators with the fiber signal as expected if the fiber signal strength is a measure of the alignment with the target material. When the beam is misaligned with the target, more beam is measured on the respective collimator and does not reach the target material as much. On the other hand, Figure 4a shows a correlation for increasing beam current on the left collimator.
We suspect that this correlation with the left collimator current occurs due to the beam entering the target already at an angle since it is extracted at 13 MeV, the lower end of the TR13’s extraction energy range and the extreme position of the extraction foil. At the high energy the beam angel is directed into on direction, see Figure 5a, while at the lower extraction energy it is directed into the opposite direction, Therefore, when the beam is steered towards the left collimator by moving the target, the beam is actually steered into the wall of the target, thus increasing the prompt radiation. However, when the beam is moved in the opposite direction it cannot impinge as much on the opposite wall due to its angle and thereby stops in the collimator. This effect is not as strong in the top/bottom orientation as the beam does not have an extreme angle entering the target in this direction. An illustration of this hypothesis is shown in Figure 5.
The relationships between the steering and the fiber signal were further explored at different beam currents and steering levels as shown in Figure 6, with regular steering in (a) and (b) and intense steering in (c) and (d) (experiment 3). While regular steering has a correlation with the fiber signal, especially in the right and left collimators, intense steering appears to have no clear correlation.
To further explore this effect, the left collimator current (displaying correlation with the fiber signal) and top collimator current (displaying no clear correlation with the fiber signal) were graphed against the fiber signal, the beam current, and the target’s pressure. The pressure p was normalized to match the range of the current data for comparison using the transformation formula
p   ¯ = I m a x I m i n p m a x p m i n × ( p p m a x ) + I m a x
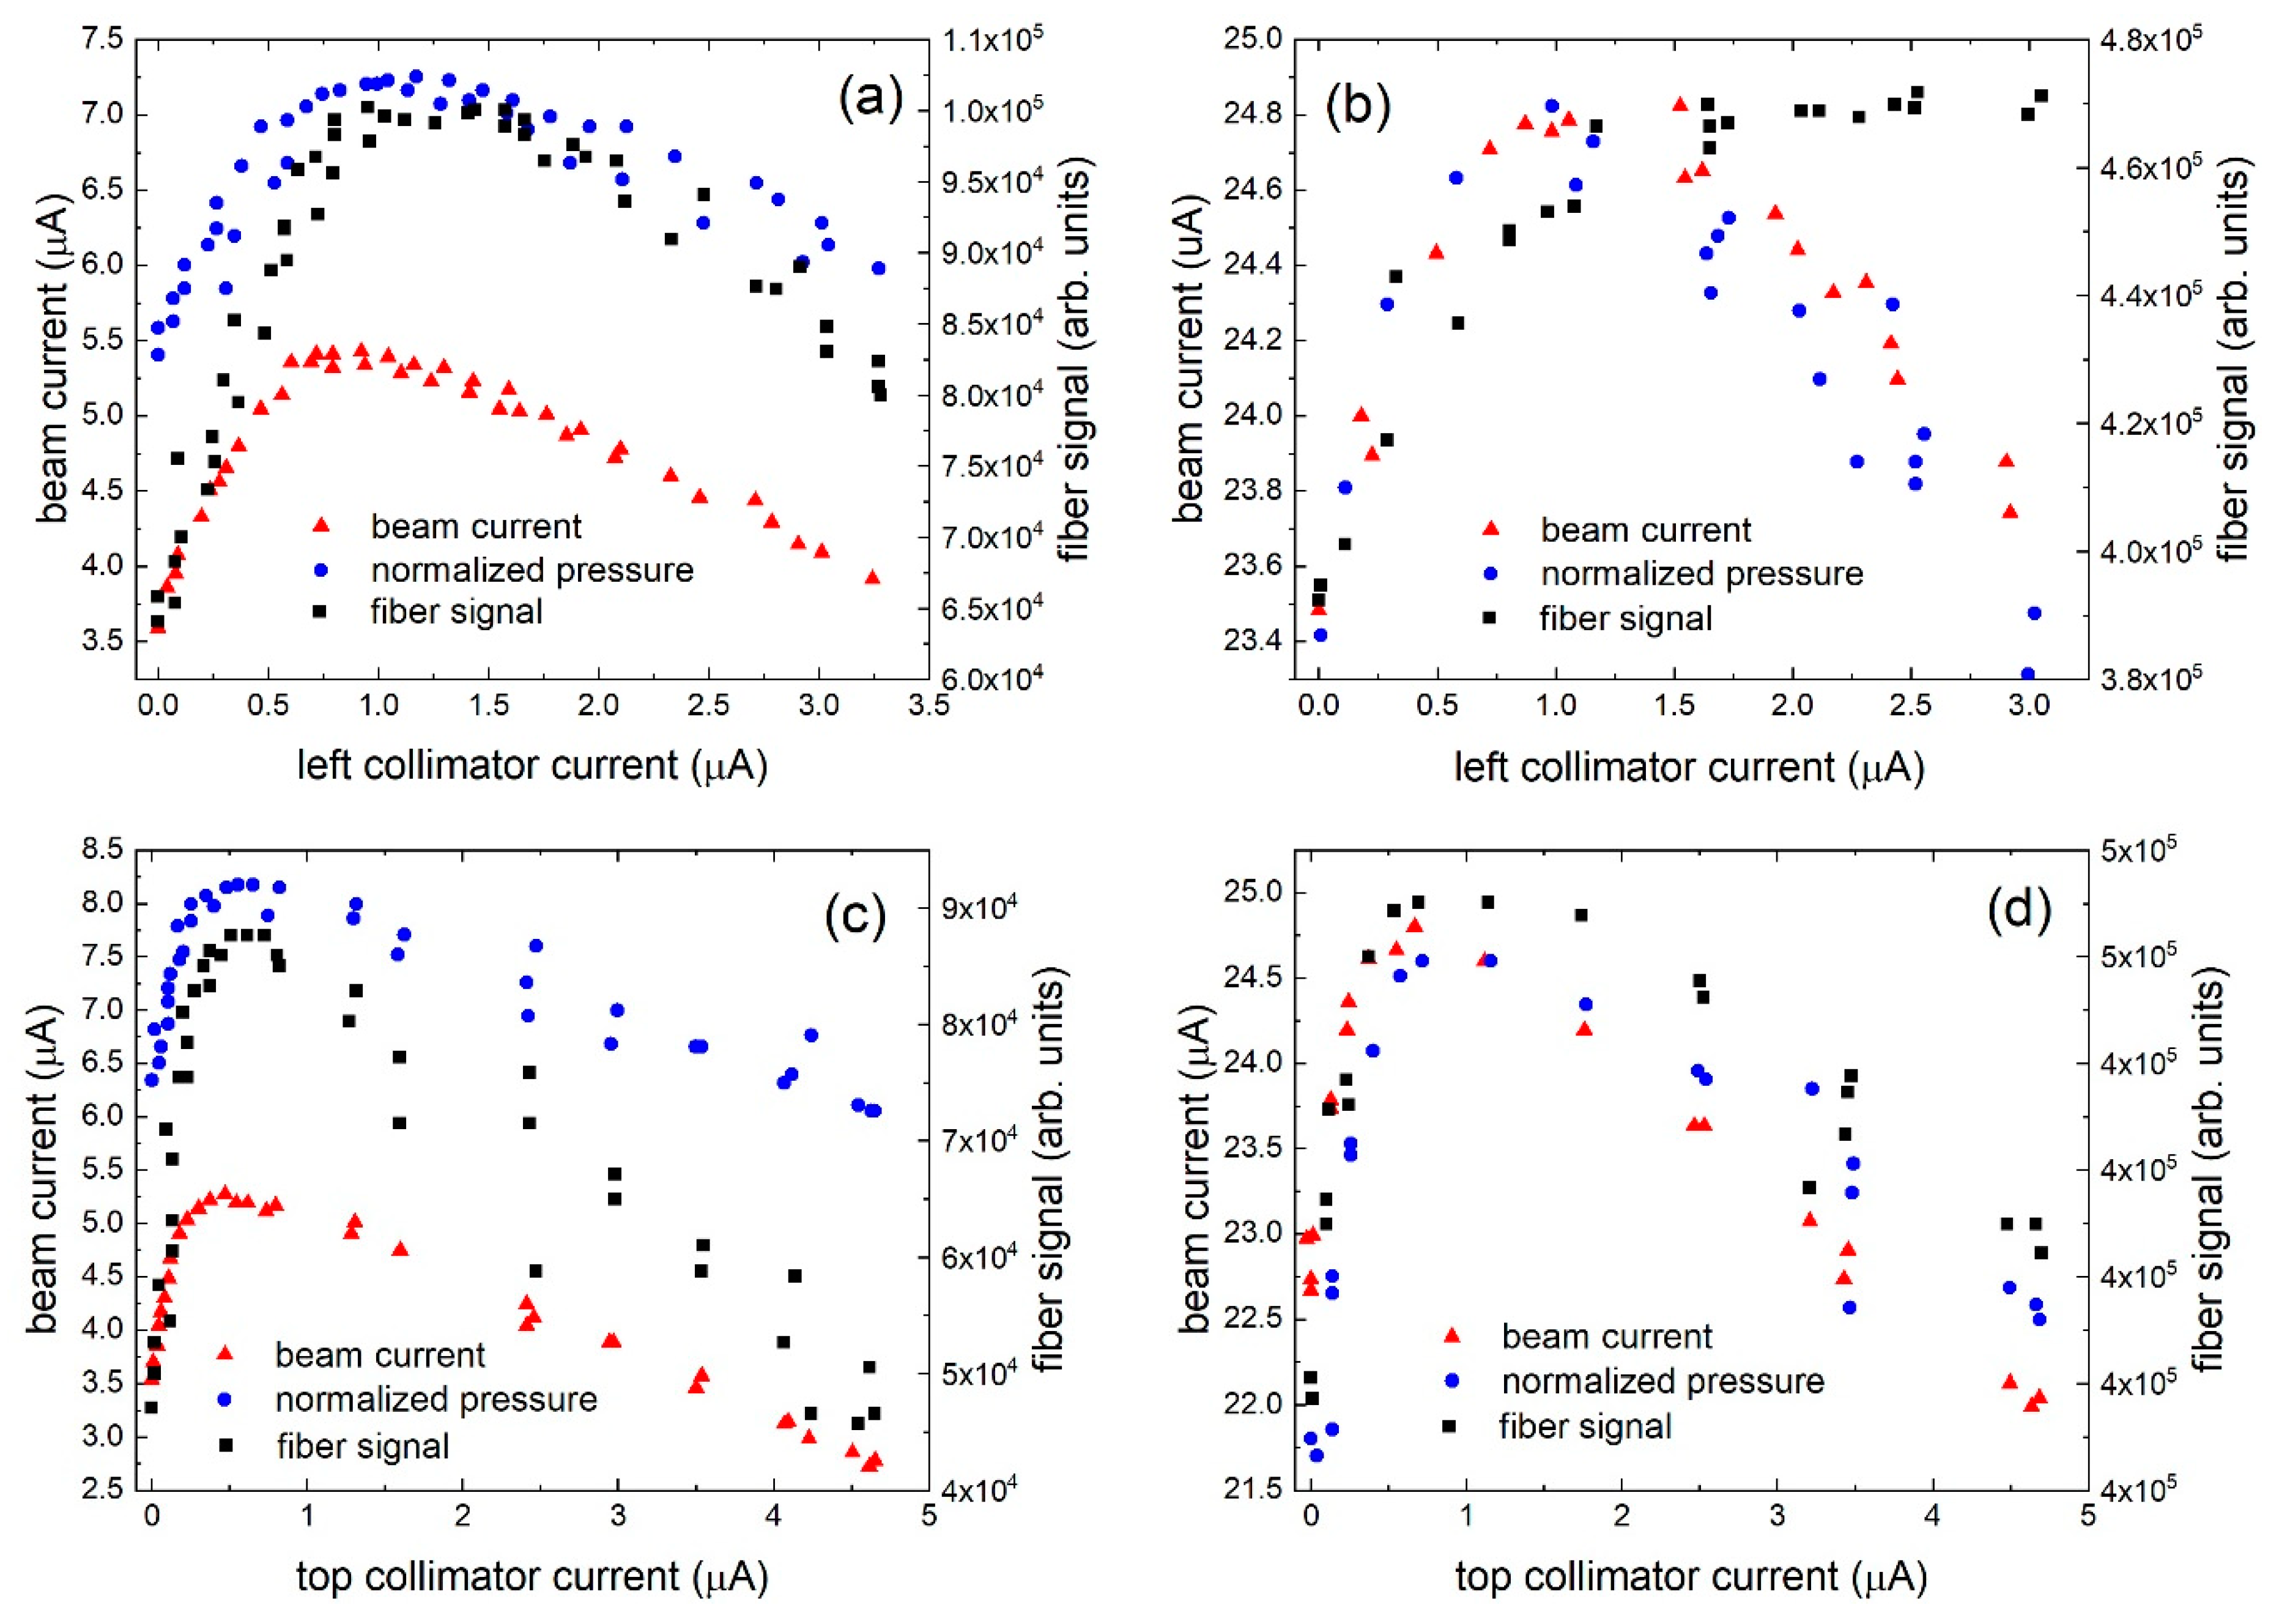
where Imax and Imin are the maximum and minimum currents for the given data set and pmax and pmin are the maximum and minimum pressures for the time period the data corresponds to. The data was collected during an irradiation with maximum beam steering, where the Ce-200 and B-200 fibers were attached to the bottom collimator’s side of the target, see Figure 2. The results comparing the left collimator’s current with the fiber signal are displayed in Figure 7a,b, while the top collimator’s current is compared in Figure 7c,d. Note that the negative collimator current outputs are believed to be the result of a minor calibration error in the TR13 current read-out module.
In all four conditions, the target current, the target pressure and the fiber signal increase with increasing collimator current before decreasing again. This is indicative of the beam being slightly misaligned with the target center. For instance, a peak in the target pressure implies that the beam is irradiating the largest target-area cross section and depositing the most power. Since the pressure increases when the beam is steered slightly towards the left and top collimators, the beam must not have been optimally aligned despite balanced collimator currents. The only exception is when the beam is steered onto the left collimator at high currents, in which case the fiber signal continues to increase slightly after 1 µA. Again, this can be explained by the beam angle in relationship to the target axis as sketched in Figure 5. In addition, the maximum for the pressure and fiber signal for the left/right plane is at a left-collimator current of ~1.25 µA, while in the top/bottom plane, it is at top-collimator current of 0.75 µA. This can be explained by a larger beam size in the left–right direction than in the top–bottom direction, as confirmed by beam profile measurements [1].
The results in this section imply that our fiber-sensing technique holds information about the centering of the beam on the target material and the alignment with the target axis. In addition, it may be possible to extract information about the size of the beam as a larger beam results into potentially more beam deposition into the target wall, which in turn results in a higher fiber signal.

3.3. Target-Material Effect

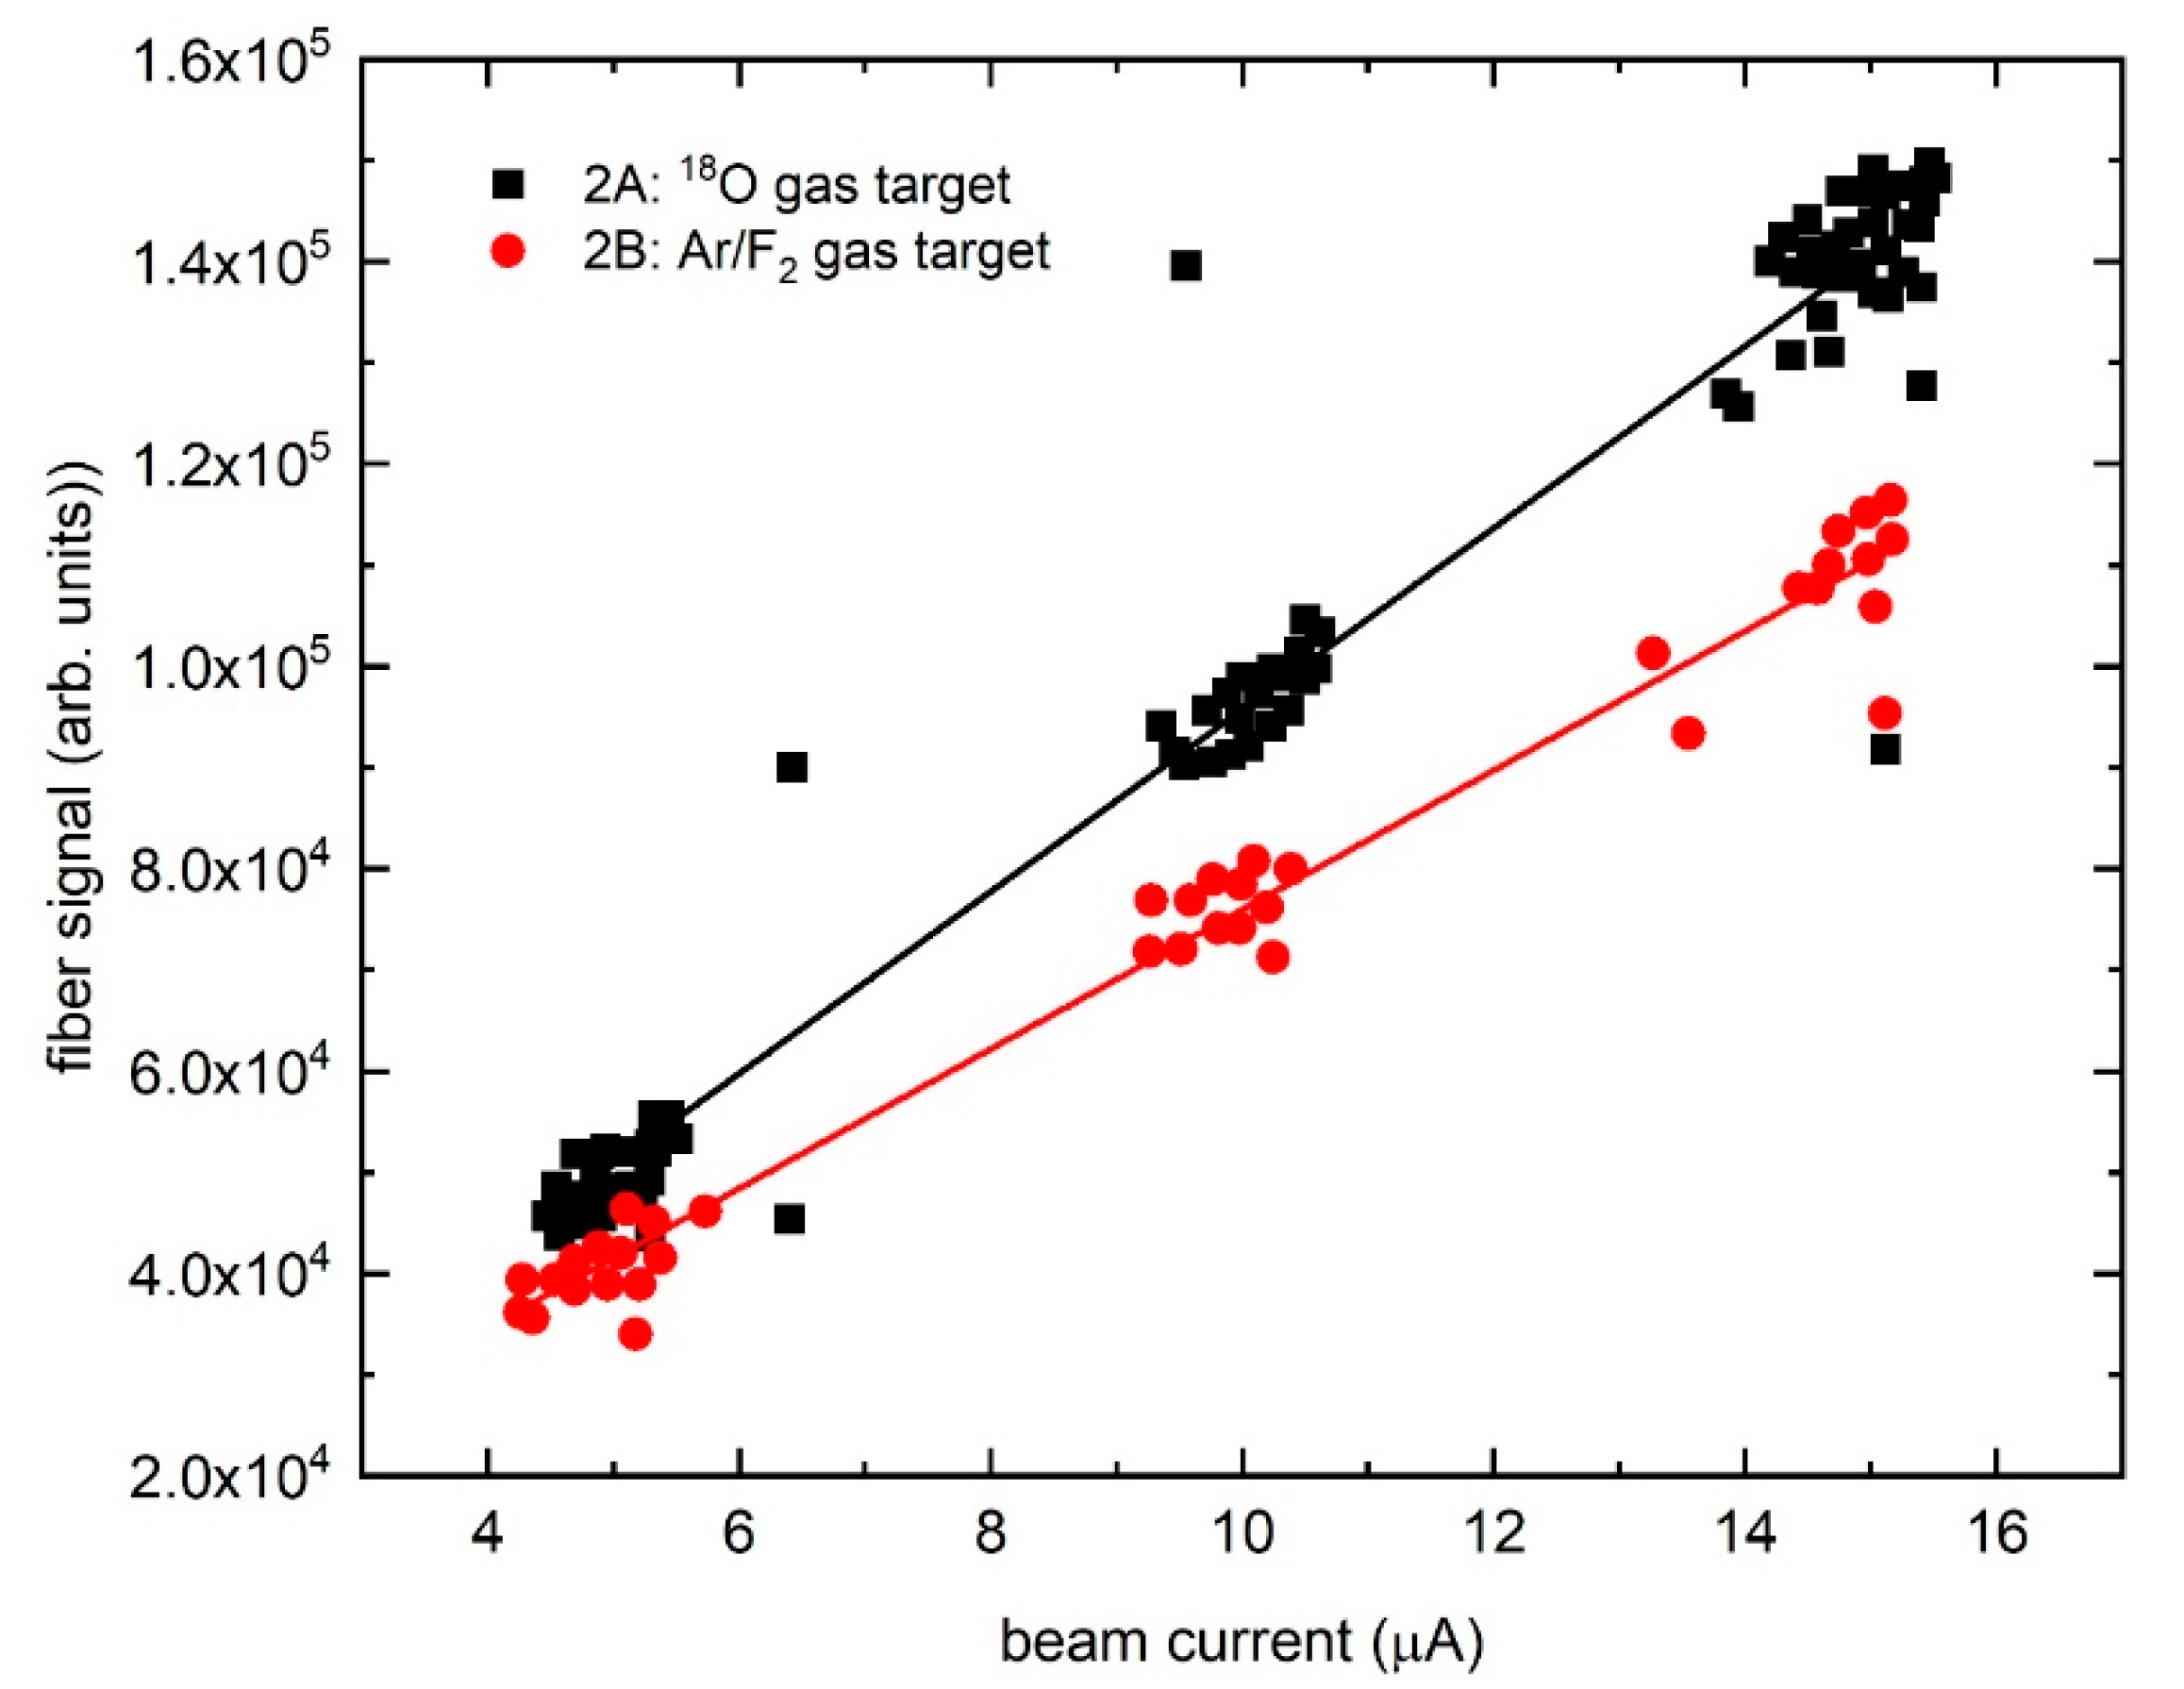
The Ce-200 fiber signal output generated via the irradiation of 18O gas and the Ar/F2 gas mixture in the same target body is compared in Figure 8. The results reflect that the fiber signal generated during the 18O(p,n)18F irradiation is greater than the signal from the irradiation of Ar/F2. We suspect that this is the result of more neutrons being generated in the 18O(p,n)18F reaction. According to these results, the signal–current relationship for a given target material could be calibrated in advance. During routine operation this technique could then be employed to verify that the correct material has been loaded into the target. It may be also indicative of fill levels as the irradiation of for example an 18F production target with less target material would yield fewer neutrons.

4. Conclusions

A technique for monitoring beam delivery on solid, liquid, and gas targets on a low-energy medical cyclotron has been demonstrated using doped silica fibers of different diameters (600 µm and 200 µm) and different dopants (cerium and boron). The fibers are easily attached to the outside of the target body and capture the prompt radiation during irradiation of the target. It has been demonstrated that the signal output of the fibers is a direct measure of the beam current on target for the smaller fibers, as the larger fiber seems to saturate in high radiation fields. The smaller diameter fibers are also ideal for future applications as more fibers can be mounted around the target body. The fiber signal also holds information about beam centering, beam steering and beam size. In addition, the fiber signal depends on the irradiated target material, potentially enabling a rapid test to confirm that the correct target material has been loaded into the target holder. As different beam energies and target systems will create different levels of prompt radiation, the sensitivity will need to be explored further. Overall, fibers offer an easy and cost-efficient monitoring solution for isotope production targets.

Author Contributions

Conceptualization, M.D., M.S., and C.H.; methodology, M.D, C.P., and C.H.; software, C.P.; validation, S.Z. and M.H.; formal analysis, M.H. and S.Z.; investigation, M.H. and S.Z.; resources, M.D. and C.H.; data curation, M.H. and C.H.; writing—original draft preparation, M.H. and C.H.; writing—review and editing, all authors; visualization, M.H. and C.H.; supervision, S.Z. and C.H.; project administration, M.D. and C.H.; and funding acquisition, M.D. and C.H. All authors have read and agreed to the published version of the manuscript.

Funding

TRIUMF receives funding via a contribution agreement with the National Research Council of Canada. This research was funded by the Natural Sciences and Engineering Research Council (NSERC) of Canada via the Discovery Grant program, grant number RGPIN 2016-03972. D-Pace provided partial salary support for M.H.

Acknowledgments

We would like to acknowledge the TRIUMF TR13 cyclotron operators, David Prevost, Linda Graham, and Toni Epp for controlling the cyclotron during each of these experiments and assisting with the installation and adjustment of the fiber optical system.

Conflicts of Interest

The authors declare no conflict of interest.

References

  1. Hendriks, C.; Uittenbosch, T.; Cameron, D.; Kellogg, S.; Gray, D.; Buckley, K.; Schaffer, P.; Verzilov, V.; Hoehr, C. A real-time intercepting beam-profile monitor for a medical cyclotron. Rev. Sci. Instrum. 2013, 84, 113305. [Google Scholar] [CrossRef] [PubMed]
  2. Gelbart, W.; Johnson, R.; Abeysekera, B. Simple beam profile monitor. AIP Conf. Proc. 2012, 1509, 38–40. [Google Scholar]
  3. Avila-Rodriguez, M.; Wilson, J.; McQuarrie, S. The use of radiochromic films to measure and analyze the beam profile of charged particle accelerators. Appl. Radiat. Isot. 2009, 67, 2025–2028. [Google Scholar] [CrossRef] [PubMed]
  4. Laxdal, R.; Altman, A.; Kuo, T.; Kadantsev, T. Beam measurements on a small commercial cyclotron. In Proceedings of the Europen Particle Accelerator Conference, London, UK, 27 June–1 July 1994. TRI-PP-94-56. [Google Scholar]
  5. Avila-Rodriguez, M.; Wilson, J.; McQuarrie, S. A Simple Method for Measuring the Beam Profile of Charged Particle Accelerators. In Proceedings of the 12th International Workshop on Targetry and Target Chemistry, Seattle, WA, USA, 21–24 July 2008; Available online: https://wttc.triumf.ca/pdf/2008/WTTC12ABSTRACTBOOK.pdf (accessed on 11 April 2019).
  6. Vedda, A.; Chiodini, N.; Di Martino, D.; Fasoli, M.; Keffer, S.; Lauria, A.; Martini, M.; Moretti, F.; Spinolo, G.; Nikl, M.; et al. Ce3+-doped fibers for remote radiation dosimetry. Appl. Phys. Lett. 2004, 85, 6356–6358. [Google Scholar] [CrossRef]
  7. Mones, E.; Veronese, I.; Moretti, F.; Fasoli, M.; Loi, G.; Negri, E.; Brambilla, M.; Chiodini, N.; Brambilla, G.; Vedda, A. Feasibility study for the use of Ce3+-doped optical fibres in radiotherapy. Nucl. Instrum. Methods Phys. Res. Sect. A 2006, 562, 449–455. [Google Scholar] [CrossRef]
  8. Veronese, I.; Cantone, M.; Chiodini, N.; Coray, A.; Fasoli, M.; Lomax, A.; Mones, E.; Moretti, F.; Vedda, A. Feasibility study for the use of cerium-doped silica fibres in proton therapy. Radiat. Meas. 2010, 45, 635–639. [Google Scholar] [CrossRef]
  9. Girard, S.; Di Francesca, D.; Morana, A.; Hoehr, C.; Paillet, P.; Duzenli, C.; Kerboub, N.; Reghioua, I.; Li Vecchi, G.; Alessi, A.; et al. X-Rays, γ-Rays, and Proton Beam Monitoring With Multimode Nitrogen-Doped Optical Fiber. IEEE Trans. Nucl. Sci. 2019, 66, 306–311. [Google Scholar] [CrossRef]
  10. Savard, N.; Potkins, D.; Beaudry, J.; Jirasek, A.; Duzenli, C.; Hoehr, C. Characteristics of a Ce-Doped silica fiber irradiated by 74 MeV protons. Radiat. Meas. 2018, 114, 19–24. [Google Scholar] [CrossRef]
  11. Nesteruk, K.; Auger, M.; Braccini, S.; Carzaniga, T.; Ereditato, A.; Scampoli, P. A system for online beam emittance measurements and proton beam characterization. J. Instrum. 2018, 13, P01011. [Google Scholar] [CrossRef] [Green Version]
  12. Yanagida, Y. Study of rare-earth-doped scintillators. Opt. Mater. 2013, 35, 1987–1992. [Google Scholar] [CrossRef]
  13. Girard, S.; Capoen, B.; El Hamzaoui, H.; Bouazaoui, M.; Bouwmans, G.; Morana, A.; Di Francesca, D.; Boukenter, A.; Duhamel, O.; Paillet, P.; et al. Potential of Copper- and Cerium-doped Optical Fiber Materials for Proton Beam Dosimetry. IEEE Trans. Nuclear Sci. 2017, 64, 567. [Google Scholar] [CrossRef]
  14. Barnhart, T.E.; Engle, J.W.; Valdovinos, H.F.; Severin, G.W.; Nickles, R.J. Prompt radiation detectors to monitor target conditions. AIP Conf. Proc. 2012, 1509, 34–37. [Google Scholar]
  15. Buckley, K.R.; Huser, J.; Jivan, S.; Chun, S.K.; Ruth, T.J. 11C-methane production in small volume, high pressure gas targets. Radiochim. Acta 2000, 88, 201–205. [Google Scholar] [CrossRef]
  16. Braccini, S.; Ereditato, A.; Giacoppo, F.; Kreslo, I.; Nesteruk, K.; Nirkko, M.; Weber, M.; Scampoli, P.; Neff, M.; Pilz, S.; et al. A beam monitor detector based on doped silica and optical fibres. J. Instrum. 2012, 7, T02001. [Google Scholar] [CrossRef] [Green Version]
Figure 1. (a) 200 µm Ce-doped fiber and 200 µm B-doped fiber mounted to the 18F gas target. (b) 200 µm borosilicate fiber in plastic housing without the black tape wrapping to prevent background from ambient light. (c) Schematic of the setup.
Applsci 10 04488 g001
Figure 2. (a) Layout of the targets (blue) and fiber (yellow) in the inner position on the target selector (grey) looking upstream. Position A is housing a natural water target for the 16O(p,a)13N production, position B is a natural thallium target for the 203Tl(p,n)203Pb production, position C holds a target plug, and position D is an 18O(p,n)18F gas target. (b) Quadrant collimators in front of target port D looking upstream. Each target position has its own quadrant collimator.
Applsci 10 04488 g002
Figure 3. Response of the different fibers to changing beam current for different experiments. The R2 values of the linear fits are (1B) 0.9968, (1A) 0.9661, (1C ascending) 0.9397, (1C descending) 0.9905, (1D Ce-200) 0.9929, and (1D B-200) 0.9905, respectively.
Applsci 10 04488 g003
Figure 4. In (a,b), the collimator currents are compared with the Ce-200 fiber’s signal while at a beam current on the target of 20 µA. Both fibers are mounted at the side of the target closest to the bottom collimator. The bar graph in (c) expresses the correlations between the collimator currents and the fiber signal when the target selector was moved in the plane that the collimators were positioned in, and the beam current’s correlation during these periods.
Applsci 10 04488 g004
Figure 5. Illustrations comparing the 19 MeV (a) and 13 MeV (b) extractions and the resulting beam steering effects. The arrows indicate target movement in the left-right direction.
Applsci 10 04488 g005
Figure 6. (a) Correlation coefficients as a function of beam current on target for regular steering up to 3 µA on the right and left collimator and (b) on the top and bottom collimator. (c) Correlation coefficients as a function of beam current on target for intense steering up to 5 µA on the right and left collimator and (d) on the top and bottom collimator.
Applsci 10 04488 g006
Figure 7. Beam current on target, normalized target pressure and Ce-200 fiber signal as a function of the (a) left collimator current at low beam current, (b) left collimator at high beam current, (c) top collimator at low beam current, and (d) top collimator at high beam current. Summary of n = 6 experiments using both the B-200 and Ce-200 fibers.
Applsci 10 04488 g007
Figure 8. Graph comparing the difference in Ce-200 fiber signal between the irradiation of 18O gas and Ar/F2 mixture. The adjusted R2 values are 0.9838 and 0.9945, respectively.
Applsci 10 04488 g008
Table 1. Fiber samples.
FiberDopantLengthDiameter
Ce-600Ce3+8.0 cm600 µm
Ce-200Ce3+3.0 cm200 µm
B-200B3+7.5 cm200 µm
Table 2. List of Experiments. The fiber(s) were always installed on the gas target in position D, while not only target D but also A and B were irradiated. Only one fiber was read out at the time.
RunTarget MaterialTarget PositionFiber Position on Target DFiber(s) UsedConditions
1ASolid TlBInner Ce-600Up to 10 µA, no beam steering
1BWaterAInner Ce-600Up to 20 µA, no beam steering
1C18O gasDInner Ce-600Up to 25 µA, no beam steering
1D18O gasDInner Ce-200 & B-200Up to 25 µA, no beam steering
2A18O gasDAll four target quadrantsCe-200 & B-200Up to 25 µA, regular steering
2BAr/F2DAll four target quadrantsCe-200 & B-200Up to 15 µAs, regular steering
318O gasDInner Ce-200 & B-200Up to 25 µAs, intense steering