Article

Τhe February-March 2019 Seismic Swarm Offshore North Lefkada Island, Greece: Microseismicity Analysis and Geodynamic Implications

by
Anastasios Kostoglou
,
Vasileios Karakostas
,
Polyzois Bountzis
and
Eleftheria Papadimitriou
*
Geophysics Department, Aristotle University of Thessaloniki, 54124 Thessaloniki, Greece
*
Author to whom correspondence should be addressed.
Appl. Sci. 2020, 10(13), 4491; https://doi.org/10.3390/app10134491
Submission received: 24 May 2020 / Revised: 22 June 2020 / Accepted: 26 June 2020 / Published: 29 June 2020
(This article belongs to the Special Issue Data Processing and Modeling on Volcanic and Seismic Areas)

Abstract

:

Featured Application

Authors are encouraged to provide a concise description of the specific application or a potential application of the work. This section is not mandatory.

Abstract

A quite energetic seismic excitation consisting of one main and three additional distinctive earthquake clusters that occurred in the transition area between the Kefalonia Transform Fault Zone (KTFZ) and the continental collision between the Adriatic and Aegean microplates is thoroughly studied after the high-precision aftershocks’ relocation. The activated fault segments are in an area where historical and instrumental data have never claimed the occurrence of a catastrophic (M ≥ 6.0) earthquake. The relocated seismicity initially defines an activated structure extending from the northern segment of the Lefkada branch of KTFZ with the same NNE–SSW orientation and dextral strike slip faulting, and then keeping the same sense of motion, its strike becomes NE–SW and its dip direction NW. This provides unprecedented information on the link between the KTFZ and the collision front and sheds more light on the regional geodynamics. The earthquake catalog, which was especially compiled for this study, starts one year before the occurrence of the Mw5.4 main shock, and adequately provides the proper data source for investigating the temporal variation in the b value, which might be used for discriminating foreshock and aftershock behavior.

1. Introduction

A moderate magnitude Mw5.4 earthquake occurred on 5 February 2019 in the offshore area north of Lefkada Island, strongly felt in the Lefkada city and the onshore continental area to the east, with no major damage or injuries reported. In the area, an adequate number of moderate earthquakes have occurred in recent decades with not one having a magnitude larger than M6.0. The seismic excitation started with an Mw4.2 shock that occurred on 15 January 2019 to the northeast of the main shock which was followed by a very productive aftershock sequence with more than 250 located shocks by 15 March 2019.
The activated area is located at the boundary between the Kefalonia Transform Fault Zone (KTFZ) to the south and the Adriatic–Eurasian collision to the north. The continental collision is expressed by a belt of thrust faulting with an NE–SW direction of the axis of maximum compression. It runs along the eastern coastline of the Adriatic Sea and terminates just north of Lefkada Island. The KTFZ is a major dextral strike slip fault zone that frequently accommodates strong earthquakes, clustered in space and time probably due to the stress transfer between the fault segments comprised in the fault system [1]. The northernmost fault segment of the KTFZ was activated in 2003 with an Mw6.2 main shock and its rich aftershock sequence. The accurate location of these aftershocks provided for the first time the indication that the major fault segments bound the western coastlines of the island, and the contemporaneously activated secondary fault segments lie onshore [2]. No earthquakes with M ≥ 6.0 have occurred during the instrumental era along the collision front in the vicinity of the activated area. Smaller magnitude earthquakes are also sparse in comparison with the remarkably active KTFZ.
Geophysical and geodetic studies have provided sufficient knowledge of the seismotectonic properties of the area. Identifying in more detail the mechanism of transition along active boundaries from the one plate to its neighbor remains a major scientific challenge. Tracing the kinematic and dynamic variability along the active boundary can provide important clues for the transition area. Microseismicity is mainly concentrated along the KTFZ and at the same time manifests the swarm-type seismogenesis as a preferential style of strain release (Figure 1). This latter property becomes the tool to decipher the localized strain pattern, since strong earthquakes occur rarely and not all in optimally oriented faults, a fact that results in appreciable gaps in seismicity catalogs both in time and space. The investigation of this activity is challenging to shed light on the seismogenic setting and the complex geodynamics of the area, a prerequisite for any seismic hazard assessment study. Its location is critical to decipher how these secondary structures play a role in accommodating strain at the borderline of the KTFZ, an area where also reverse focal mechanisms were determined for moderate magnitude earthquakes that occurred in the last few decades.
The adequacy of proper data provided by an earthquake catalog compiled for the targets of this study allowed the monitoring of temporal variations of the b value, which from both laboratory experiments [3,4] and real data [5] seems to be linked with the stress state in a region in a way that higher differential stress corresponds to lower b values. We then extend our investigations to the temporal variations in b values aiming to detect whether they can act as an indicator for the main shock occurrence or not.

2. Seismicity Relocation

2.1. Data Acquisition and Earthquake Relocation

Since the occurrence of the 2003 Lefkada Mw6.3 main shock, continuous seismic monitoring was intensified in the area of the central Ionian Islands, namely Lefkada and Kefalonia, by firstly installing temporary broadband and short period digital seismological stations, then by upgrading this network into a permanent one [6] (http://geophysics.geo.auth.gr/ss/) and finally incorporating the stations in the Hellenic Unified Seismological Network (HUSN). For the purpose of this study, we used some additional stations located in the mainland, at distances not exceeding 90 km, in order to reduce the azimuthal gap in the events location.
In order to identify the activated structure of the northern end of the Kefalonia Transform Fault Zone (KTFZ), we compiled a catalog of 662 earthquakes, for the period February 2018–October 2019. The starting time of the catalog was decided to be a year before the main shock in order to study any pre-seismic patterns because it was observed that the seismic activity was considerable. The locations were made by manual picking of 3560 P- and 3197 S- phases, using 14 broadband and short-period stations of the HUSN. Phase pickings for the earthquakes with M ≥ 2.5 were performed manually by the analysts of the Geophysics Department of the Aristotle University of Thessaloniki (GD-AUTh). For the smaller magnitude earthquakes, phase picking was held manually by the authors of the present work, as an ongoing procedure of more deeply understanding the seismotectonic and geodynamic properties of the central Ionian islands.
Relocation was performed with the HYPOINVERSE [7] program using the 1D model (Table 1) along with the vP/vS ratio for this region suggested by [8], for the relocation of the 2015 Lefkada aftershock sequence. Station delays were calculated for further refining the locations, following a procedure described in [9], to account for lateral crustal variations that are not considered in a 1D model. The medians of the hypocentral errors derived by HYPOINVERSE are of the order of 2900m for the horizontal and 1500 m for the vertical dimension.
Further relocation took place by applying the double difference (DD) algorithm [10], taking into account both catalog and cross-correlation differential times and employing the conjugate gradients method (LSQR) [11] with appropriate damping. For the cross-correlation differential times, the time domain cross-correlation technique was realized [12,13]. Waveforms with a duration of 60 s, starting at the origin time of each earthquake, were prepared and band pass-filtered at 2–10 Hz with a second order Butterworth filter. Cross-correlation was performed for a 1-s window length starting at the arrival of the P and S phases, searching over a lag of 1 s. Differential times with a correlation coefficient of 0.8 or more (CC ≥ 0.8) were kept being used in hypoDD.
In the application of the DD algorithm, five sets of iterations with five iterations each were performed. The cross-correlation differential times were down weighted by a factor of 100 for the first 10 iterations, to obtain locations from the catalog data [8,14]. The catalog data was downweighted by the same factor for the remaining 15 iterations to allow cross-correlation differential times to better define the active structures. For the first five iterations, and considering the catalog data alone, weighting was not applied. The relocation procedure took place for interevent distances less than or equal to 5 km for the first 10 iterations of catalog data and cross-correlation times, reaching at 3 km for the cross-correlation dataset at the final set of iterations.

2.2. Location Errors Estimation

The location errors calculated by hypoDD are underestimated, usually being a few tens of meters. Thus, a bootstrap method was applied to the final residuals, creating a dataset by drawing samples from the observed residual distribution, adding them to the differential times and then repeating the relocation [15,16]. This procedure was repeated 200 times and then the 95% error ellipsoid per event was computed by the resulting catalogs.
The jackknife method [15] was also applied to evaluate the station distribution effect on the final catalog. The relocation was repeated omitting one station at a time, followed by a calculation of the standard deviations per event. The medians calculated for the axis of the ellipsoids produced by the bootstrap method and the medians of the standard deviations calculated from the jackknife method are summarized in Table 2.
The errors produced by both methods show that in the west–east horizontal direction, they are much larger than in the north–south direction. This reveals the effect of the station distribution on the location accuracy, as the closer stations are located south of the activated area in the Lefkada and Kefalonia islands, in a rather narrow N–S oriented zone covering a small azimuthal range in the E–W direction. In addition, the number of stations is small to the east and north of the study area, in western Greece, and obviously there are no stations to the west, an area covered entirely by sea.

3. Fault Plane Solutions Determination

A centroid moment tensor for the main shock of the sequence was published soon after by GCMT (https://www.globalcmt.org/CMTsearch.html), suggesting an almost pure strike slip motion with the two nodal planes steeply dipping and striking either N–S or E–W. None of the nodal planes agree with the epicentral distribution in the area surrounding the main shock. In the framework of this study, the first polarities were exploited with the use of the FPFIT program [17]. The recordings of the HUSN stations for earthquakes with magnitudes ML ≥ 3.0 were used for polarities identification. Since most of the stations are located south of the activated area, providing a poor azimuthal coverage, only impulsive onsets were used for the focal mechanism determination. Information on eight focal mechanisms that were calculated in this study is provided in Table 3. The available recordings in all but one solution were in the azimuthal gap range of 122°–138°, with a median equal to 128°.
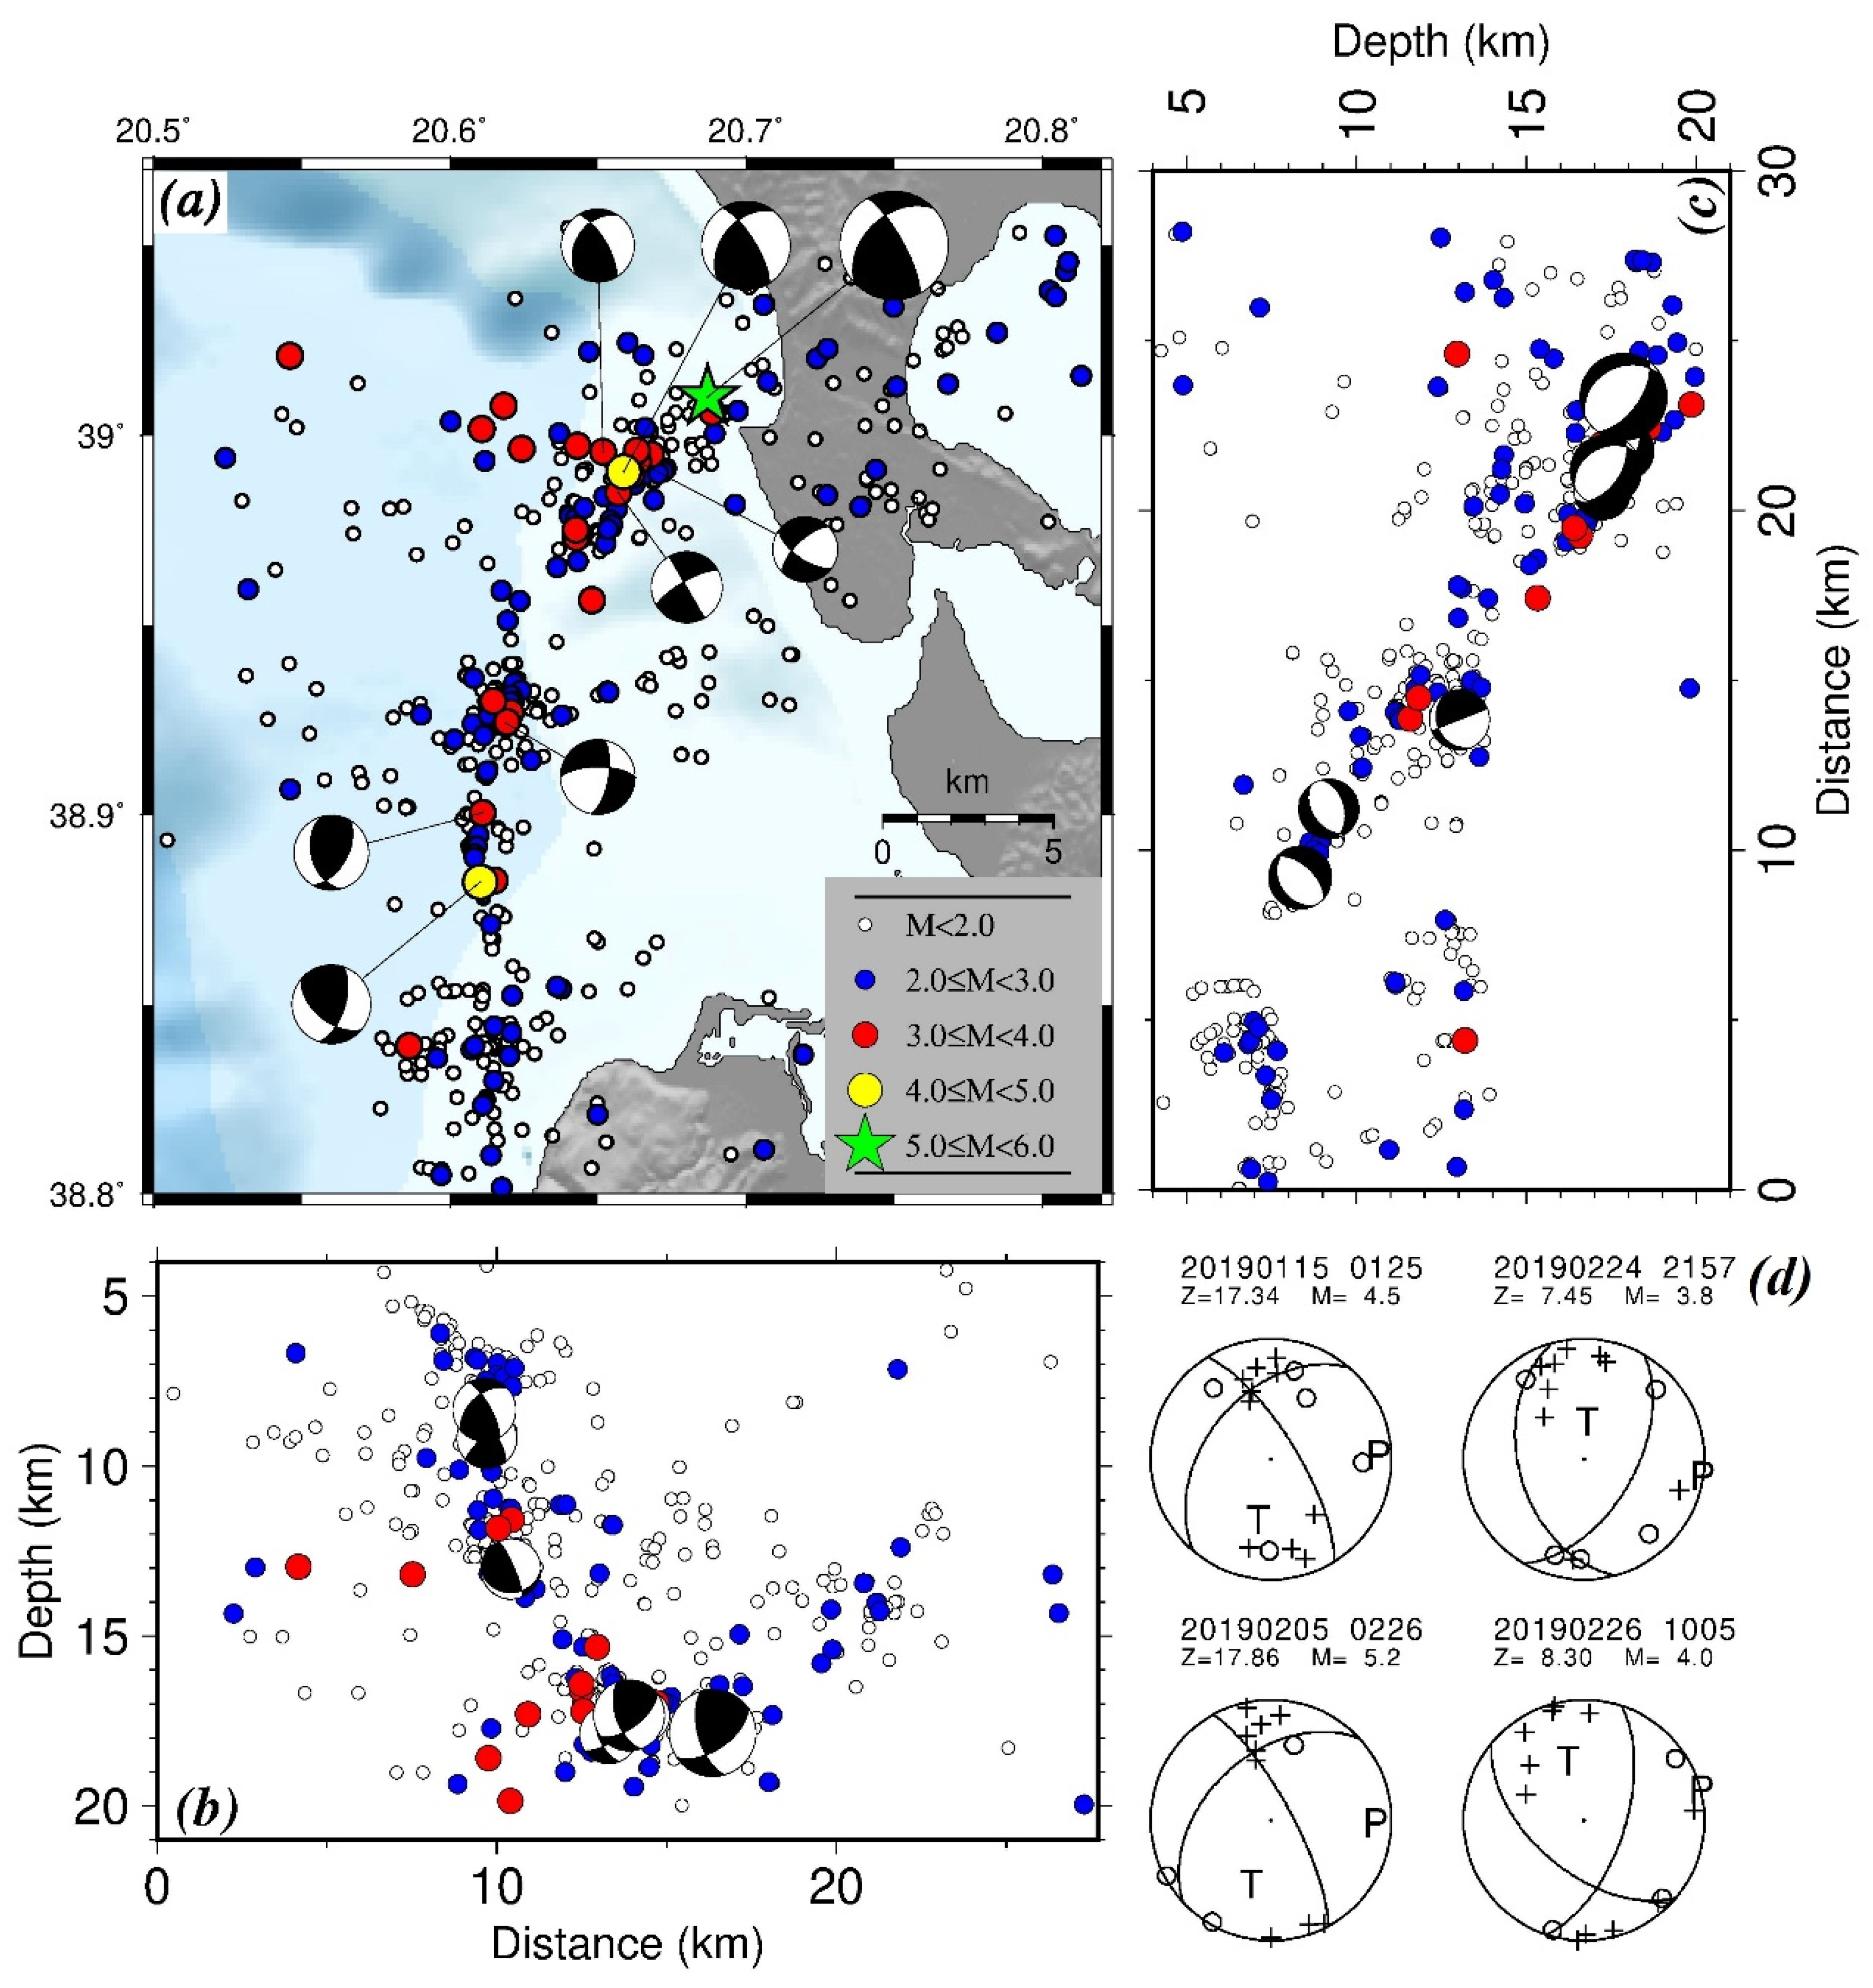
One of the nodal planes determined for the main shock of Mw5.4, listed fourth in Table 3, striking at 227°, dipping to the northwest at an angle of 45°, shows a good agreement with the epicentral distribution of the relocated seismicity, as this will be discussed in the next section. For the four strongest earthquakes, the available close opposite polarities projections ascertain the robust constraint of the solution (Figure 4d). The significant dextral strike slip component (rake = 160°) agrees well with the regional stress field pattern. Most of the focal mechanisms determined for the smaller magnitude earthquakes that belong to the same cluster along with the main shock (numbered 1, 2, 3 and 5 in Table 3) are similar to that of the main shock. The fault plane solutions of the stronger earthquakes that occurred south and west of the main cluster, and impressively all of them following the stronger events occurrence of the main cluster, exhibit differentiation of the first nodal plane strike (10° and 30° for the events numbered 6 and 7 in Table 3 that belong to the second cluster, and 18° for the eighth earthquake belonging to the southernmost cluster). They also differ from the gross faulting properties of the Lefkada segment of the KTFZ [8,18].

4. Seismicity Temporal and Spatial Characteristics

4.1. Temporal Distribution of Earthquakes

The seismic excitation attracted our attention from the first days, given that it started on 13 January with an M3.6 earthquake, followed by numerous smaller ones, then an M4.5 shock on 15 January, followed by an M3.7 after an hour and a half (see Table 3 for occurrence dates and times), all of them felt by the inhabitants of the surrounding urban areas. The activity continued for months, exhibiting alteration of active and relatively quiet periods. In order to investigate and analytically describe the temporal behavior of this rather complex seismic activity, the cumulative number and magnitude distribution of the earthquakes as a function of time are investigated and discussed.
Figure 2a shows the cumulative number of earthquakes that occurred since February 2018. The total period is divided into four subintervals separated by three turning points where the color in the symbols is changed. The first period spans from February 2018 until 15 January 2019, where a magnitude 4.5 earthquake occurred close to the incoming main shock. The activity of the first period (green symbols in Figure 2a) presents two small swarms in February–March and May–June 2018 (temporal clustering in Figure 2b), alternating with an almost stable seismicity rate, which could be considered as the background rate (Figure 2b). The occurrence of the M4.5 earthquake on January 15 2019, along with its offsprings in one single day, is impressive (blue symbols in Figure 2a), as impressive is the relative quiescence for about 20 days, which is more obvious in Figure 2b, when on 5 February, the main shock with Mw5.4 occurred. One hundred aftershocks followed in two days and the activity presented an exponential-like decrease up to shortly before the occurrence of the M4.0 earthquake on 26 February. It seems that its occurrence followed a rejuvenation that could be considered as a foreshock phase, and then its imminent aftershocks created a new short seismicity intensification. Soon after, the activity declined as a function of time, as expected for an aftershock sequence.
A map of the relocated seismicity is shown in Figure 3, where four colors are used to illustrate the epicenters, corresponding to the four different periods as defined in Figure 2. The seismicity is sparse and evenly distributed in the study area during 2018 (green color epicenters in Figure 3). The M4.5 earthquake triggers significant microseismicity close to its epicenter and in an area of several kilometers around (blue colored epicenters in Figure 3), much longer than its source dimensions. The Mw5.4, strongest earthquake in the seismic excitation, triggered aftershocks in a rather large seismic zone having an NE–SW orientation (red epicenters in Figure 3) for a short time interval during which the activity was considerably increased (red dots in Figure 2b). In one day, the activity expanded in the entire study area, manifesting a remarkable cluster comparatively far from the main shock, to the southwest of its aftershock area. The earthquake magnitudes in this cluster are all smaller than 4.0.
In less than twenty (20) days of regular aftershocks rate decay, the activity was appraised again on 26 February, when an M4.0 earthquake followed (yellow star in Figure 2 and Figure 3). This indicates a migration and expansion of the activity to the southern part of the study area. It is of paramount importance then to explore further the sequential occurrence of the stronger members of this activity and the possible triggering through transfer of stress among the activated fault segments, which will be given in a later section of this study.

4.2. Spatial Distribution

The relocated seismicity allowed a refined and more reliable picture than the disperse epicentral distribution provided from the regional catalog as shown in Figure 1, revealing four distinctive clusters along with the disperse activity (Figure 4a). The northernmost cluster is associated with the main shock epicenter, the location of which is shown with a green star, occupying an area of almost 7km in length, slightly larger than expected for an MW5.4 earthquake, according to well-accepted scaling laws [19,20,21]. The epicentral elongation at an NE–SW direction agrees with one of the nodal planes of the focal mechanisms of the main shock and the four aftershocks that belong to this cluster (Figure 4a and Table 3).
The activated fault segment with a strike of 220° dips to NW at an angle of 45° and is associated with dextral strike slip faulting (rake = 160°) with a considerable thrust component. This agrees with the dextral strike slip motion of the KTFZ to the south of the study area, and the continental collision to the north. The almost E–W azimuth of the axis of maximum compression also agrees with the regional stress pattern. For a more detailed investigation of the geometry of this fault segment, the relocated epicenters of the specific cluster alone are plotted in Figure 5a, along with two cross-sections, strike parallel and strike normal that are shown in Figure 5b,c, respectively. It is worth to note here that the focal depths are restricted in depths between 14 and 20 km, with the vast majority between 16 and 18 km, an important result for the identification of the seismogenic layer in the study area. The dip of the fault plane as derived from the fault plane solution is again in perfect agreement with geometry of the activated fault segment as this is revealed by the strike normal cross-section in Figure 5c.
The next seismicity concentration is located to the south of the previous cluster and encompasses several earthquakes, the spatial distribution of which shows a barely preferable E–W elongation, in agreement with the strike of the one nodal plane from the 05/02/2019 earthquake of M3.3 (Figure 4a). The depth range is between 10 and 15 km, shallower than and exactly above the activated layer in the main cluster and with a steeper dip angle (Figure 5b,c). The faulting type, in addition to the rotation of its strike more to the north as mentioned before, exhibits a dextral strike slip motion with a slight normal component.
The epicentral distribution delineates a distinctly N–S striking structure, as one proceeds more to the south, where two sub-clusters might be recognized, forming an almost N–S striking-activated structure: the northern one, hosting the M4.0 strong event (yellow circle in Figure 4a) and forming a narrow strip of relocated epicenters, and one to its south where the activity appears sparser. The focal depths are now even more shallow, between 5 and 11 km, than the depth range of the relocated seismicity further south to Lefkada [8,22]. Almost N–S striking, dipping to the east, a dextral strike slip faulting holds for the two focal mechanisms determined for the M4.0 earthquake and one of its foreshocks, again in full agreement with the faulting properties of the Lefkada fault branch of the KTFZ [2].

5. Coulomb Stress Changes and Possible Triggering

The spatial aftershock distribution is known to be affected by the static stress changes caused by the main shock [23]. The change in Coulomb failure function (ΔCFF) is used to quantify closeness to failure [24]. A positive value of ΔCFF on a fault indicates increased likelihood that this fault will rupture in an earthquake. Values as small as 0.1 bar have been repeatedly shown to influence aftershock activity ([23,25] among others). ΔCFF depends on the changes of shear and normal stress, Δτ and Δσ, respectively, along with changes in the fluid pore pressure Δp of the rupture area, expressed by the relation
Δ CFF = Δ τ   +   μ   ( Δ σ + Δ p ) ,
where μ is the coefficient of friction. Δp is expressed by the relation [25]
Δ p = B   ( Δ σ k k ) / 3 ,
if undrained conditions are considered during the coseismic phase. B is the Skempton’s coefficient (0 ≤ B < 1), with experimental values between 0.5 and 0.9 shown to be appropriate for rocks [26], and Δ σ k k is the trace of the induced stress tensor. Assuming a ductile fault zone enclosed by a homogeneous and isotropic medium, Equation (1) becomes
Δ CFF = Δ τ   +   μ   Δ σ ,
where μ′ is the apparent coefficient of friction [24], which contains the effects of pore fluid as well as the material properties of the fault zone. It is estimated by the equation
μ = μ ( 1 Β )
For this study, the values used to compute ΔCFF are μ=0.75 and Β=0.5 as in [27] and as adopted in other studies in Greece [28,29]. These values result in an apparent coefficient of friction of μ′ 0.4, suggested by [1] for the area of the central Ionian Islands after testing different values and finding the most appropriate one for this estimation. We calculated the stress changes due to the coseismic slip of the main shock with the causative fault being approximated as a planar area with a length of 7 km and a width of 3 km, equal to the width of the seismogenic layer as explained in the previous section. A seismic moment of Μο = 1.68 · 1017 Ν · m was adopted from the GCMT solution and with the above source dimensions and a shear modulus of 33 GPa, a mean slip of 0.1745 m was estimated. The Poisson ratio was fixed equal to 0.25.
The Coulomb stress changes were calculated for the faulting type of the main shock (strike = 227°, dip = 45°, rake = 160°) at a depth of 16.5 km, which is approximately the middle of the seismogenic layer (Figure 5c), and are shown in Figure 6a along with the relocated aftershocks. It is evident that the vast majority of the off-fault activity is located into stress enhanced areas. Given that the faulting type of the earthquakes encompassing the other clusters differs from the one of the main shock, and that the activity was more shallow, the stress field is inverted according to the faulting type of the M4.0 shock (strike = 18°, dip = 62°, rake = 139°) at a depth of 11.5 km (Figure 6b). The earthquakes that occurred south of the main cluster are located inside areas of positive stress changes, an evidence for possible triggering, although with smaller values than in Figure 6a, possibly due to the difference in the calculation depth.

6. Aftershock Sequence Analysis in Relation with Temporal Variations of b Value

The evolution of an aftershock sequence is among the key factors for operational forecasting, given that the areas already hit by the main shock are continuously under the threat of a strong aftershock or even a higher magnitude earthquake. Monitoring the seismicity is the means to evaluate the imminent seismic hazard and several powerful tools have been developed in this respect. The occurrence of a strong aftershock, or of a larger magnitude earthquake that is afterwards considered as the main shock, along with the occurrence frequency of aftershocks depend upon the stress residuals and stress redistribution before and after the target earthquake. The direct manifestation of the stress state is the seismicity and one approach to detect fluctuations in its temporal behavior might be through the detection of the temporal variations in the b value. The disadvantages of this procedure are frequently connected with the lack of adequate data before the main shock that could prevent us from a robust estimation of the b value, and the overlapping of the coda-waves in the first hours after the main shock that can limit the early aftershocks detection capability [30]. However, the duration of our relocated catalog starting one year before the main shock and careful inspection and manual phase picking for aftershocks augmented the data sample and diminished the possible uncertainties in the b value estimations. The approach that we apply is described in the next steps and follows the procedure of [31].
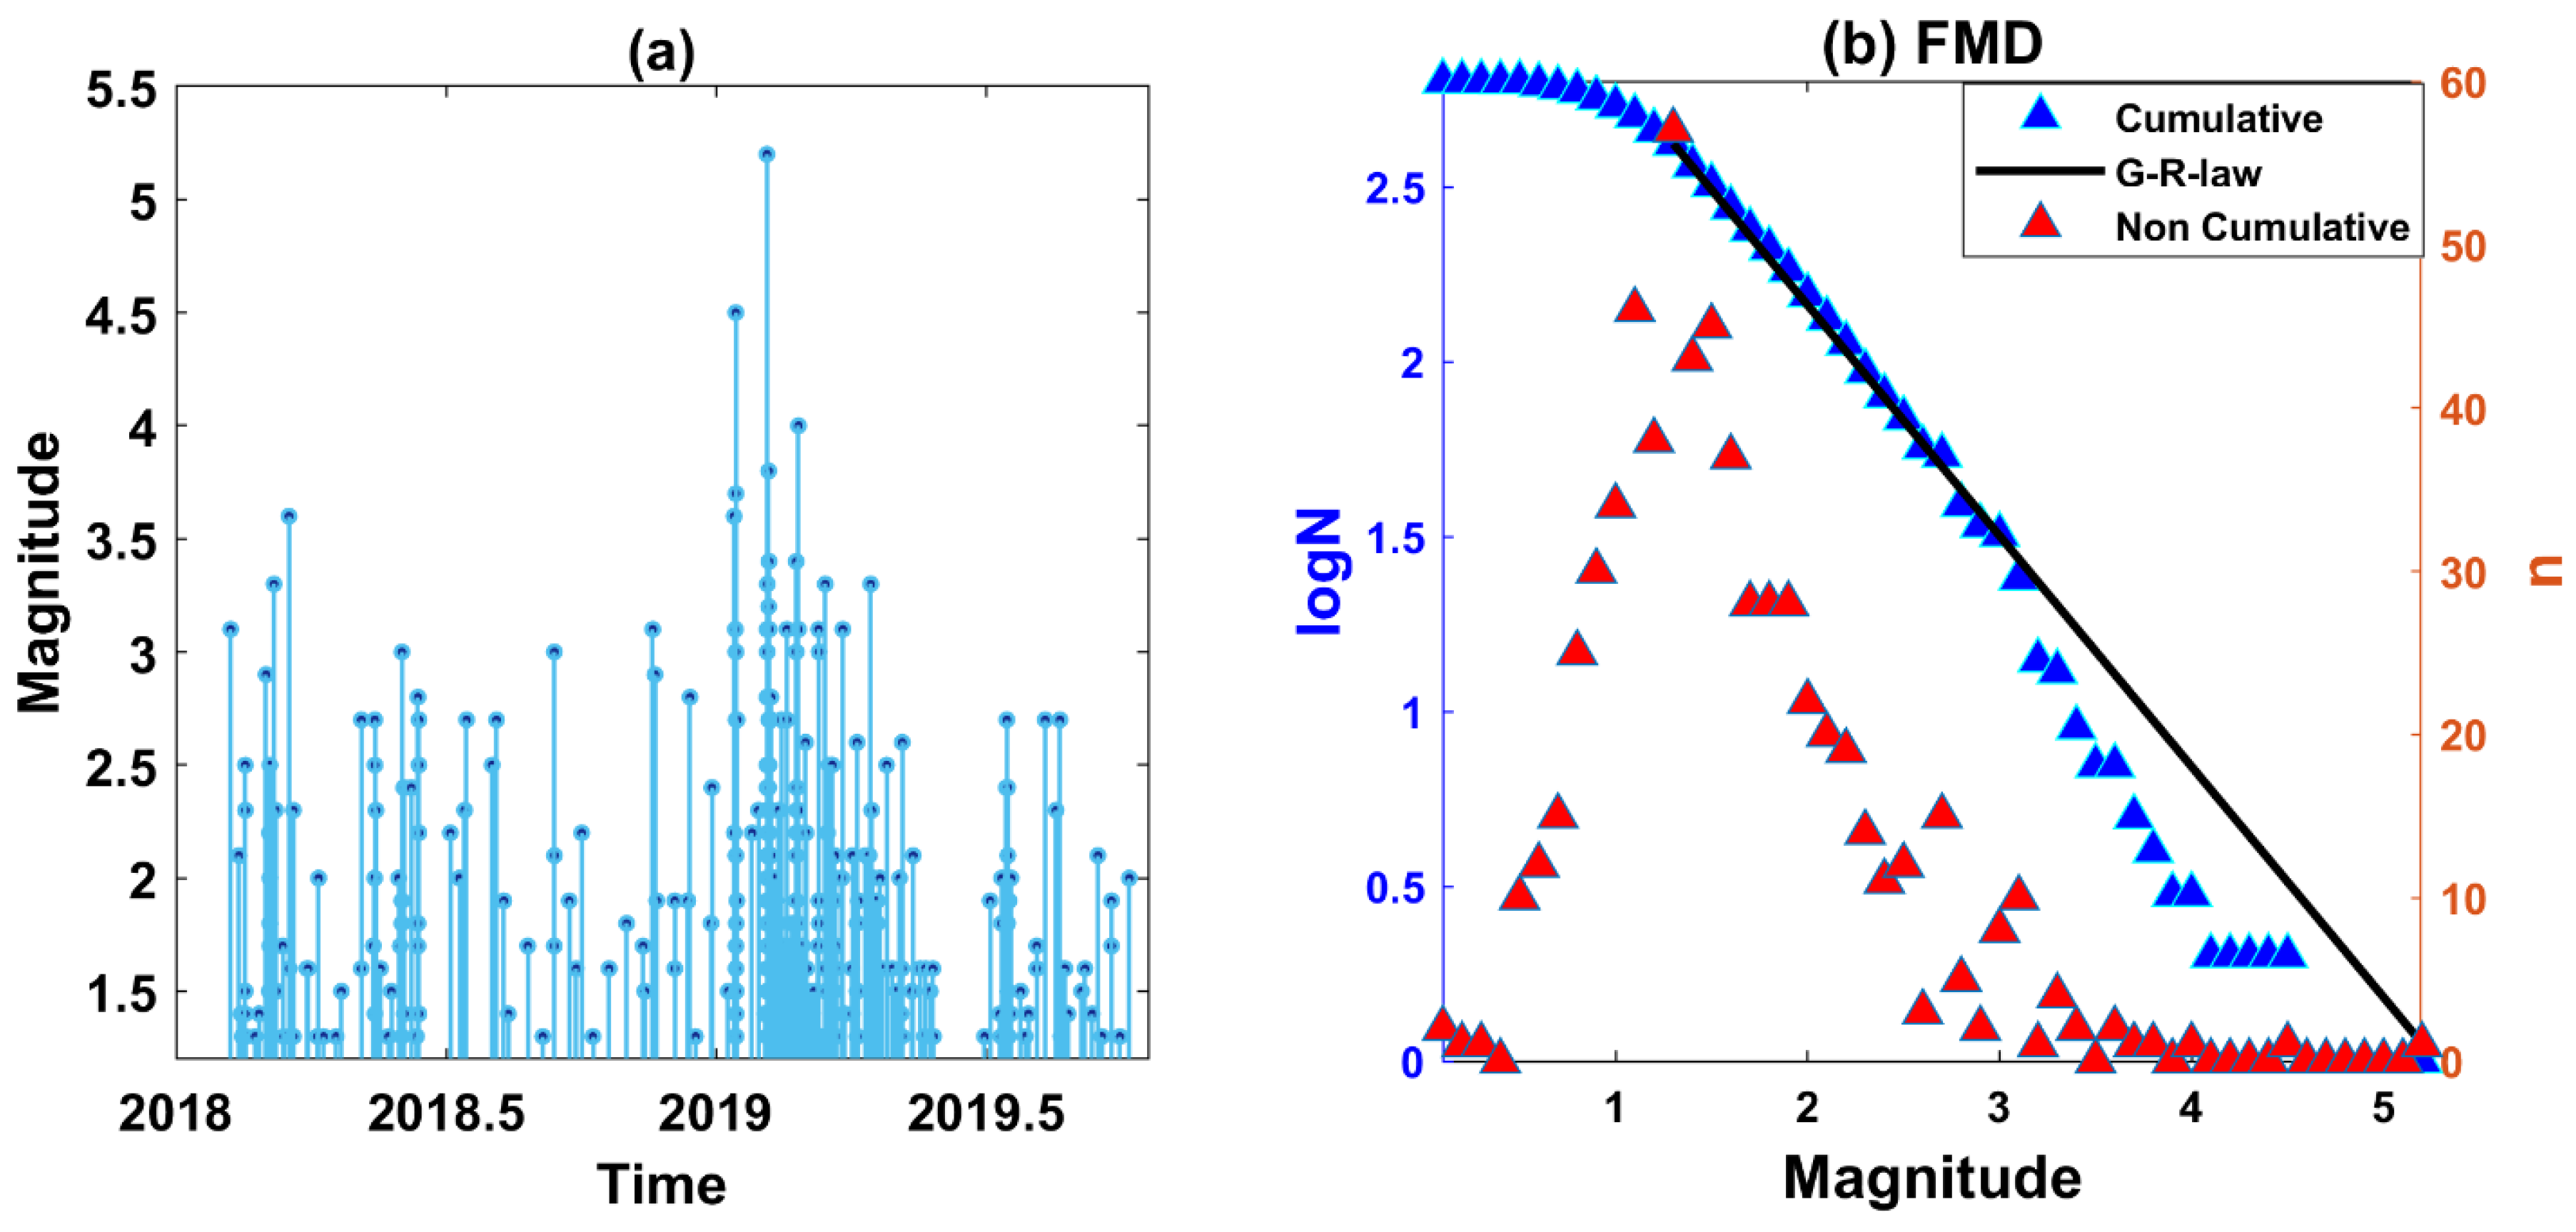
A catalog encompassing 662 earthquakes that occurred from 4 February 2018 up to 10 October 2019 consists of our data sample for investigating the temporal behavior of the b value before and after the main shock that occurred on 5 February 2019, one year after the incipience of the catalog. Firstly, the completeness magnitude is detected through the maximum curvature (MAXC) method [32], which is insensitive to sample sizes and shows great stability in estimating MC [33]. The magnitude bin with the highest frequency of events corresponds to the threshold value, which in our case is found to be M c = 1.3 (Figure 7). The b value of the GR law is computed through the maximum likelihood estimation (MLE) method [34]:
b = 1 ln ( 10 ) ( M ¯ M c + Δ Μ / 2 ) ,
where M ¯ is the mean value of the magnitudes and Δ Μ is the magnitude bin, usually chosen to be equal to 0.1 . This relation evidences the dependence of the b value on the choice of MC. Figure 7b reveals a lack of earthquakes with magnitudes M ≥ 3.2 compared with expected ones from the FMD fit. Similar breaks in FMD, also known as the nonlinearity problem, are attributed to aseismic stress release [35] as well as to a lack of faults in a particular area capable to fail in specific magnitude earthquakes [36]. In our case, the observed deficit could be related either to the seismotectonic characteristics of the study area or to the short time period of our dataset, or perhaps to both reasons. Nevertheless, the investigation of the physical mechanism responsible for the nonlinearity in the FMD remains an open issue for investigation and we believe that the data adequately support the investigation of the temporal variations in the b value for the specific seismic sequence.
For the assessment of the temporal variations in the b value before and after the main shock, firstly, we divided the catalog into two sub-catalogs, before and after the main shock with the N p r e and N a f t e r sample sizes, respectively. Then, for each dataset, we recomputed the magnitude of completeness with the same method, since it is more appropriate than the goodness of fit method for small sample sizes ( N *     200 ) , which is the case here. A correction factor of +0.2 is considered in order to avoid biased results in the b value estimation, since the M c tends to be underestimated [33,37]. Table 4 summarizes the details of the two datasets. In both cases, the magnitude bin with the highest frequency corresponds to M = 1.3 , so the completeness magnitude after the addition of the correction factor + 0.2 is M c = 1.5 , leading to N p r e = 94 events before the main shock and N a f t = 226 aftershocks (see Figure S1 for the GR law distribution of both datasets). Then, a sample window of size n p r e and n a f t is determined for the datasets before and after the main shock, respectively, for which we iteratively estimated the b values moving at each iteration one event forward. A minimum number of events for the sample size n t h r = 50 is defined, which is the threshold for an approximately 15 % error in the estimation of the b value [35]. In this way, we achieved statistically reliable results.
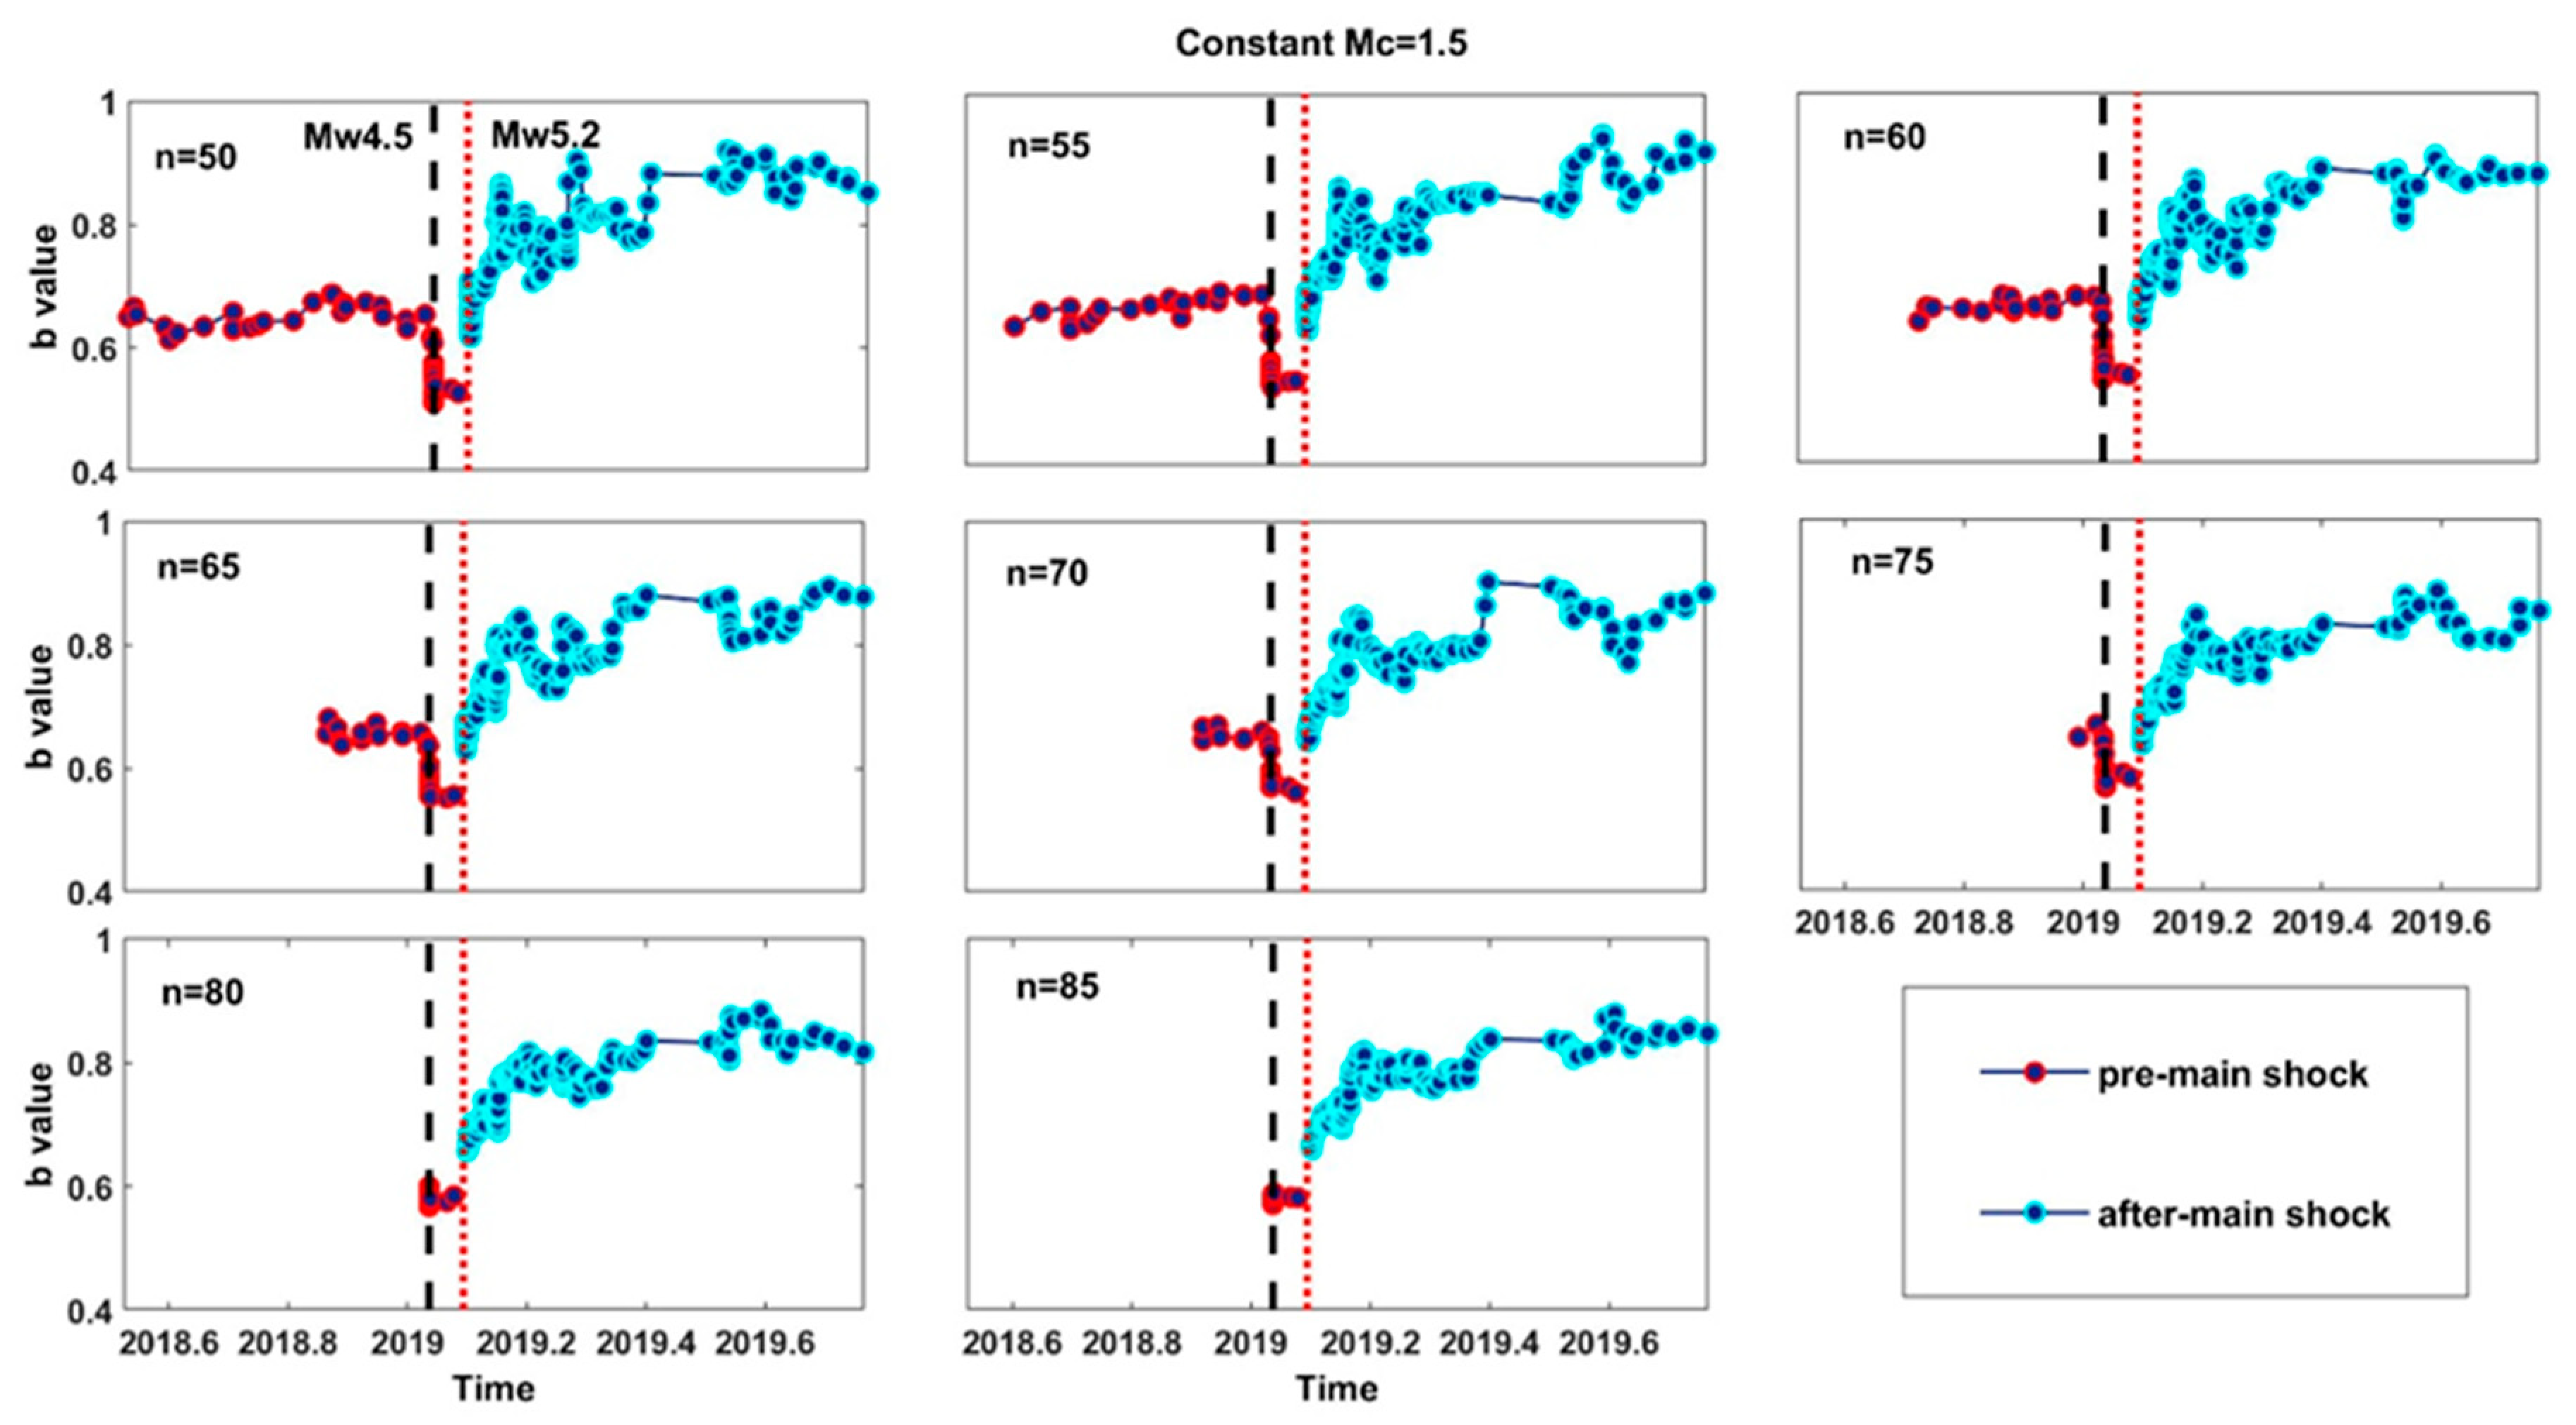
We tested different sample sizes in order to examine the dependency of the results on the choice of the free parameters, n p r e and n a f t (Figure 8). The time-varying evolution of the b value does not significantly depend on the choice of these parameters in the size ranges ( 50   ,   85 ) . We set n p r e = 50 and n a f t = 70 , with 45 and 157 number of samples, respectively. However, we stress that with any other combination, the same conclusions would have been reached.
In our case, the magnitude completeness is assumed constant, however, it is generally suggested to reevaluate it at each step since it can change in time, due to seismic network modifications or detection limitations. We keep the same initially estimated completeness threshold for two reasons. Firstly, the dataset covers a short period with relatively few events since it concerns the aftershock sequence of a moderate size main shock, which must be taken into account with caution for a robust estimation of the b value while evaluating iteratively the completeness threshold (many samples fall under the minimum value n t h r ). Secondly, we verified that the geometry of the seismic network during the study period was stable, meanwhile, we are highly confident about the monitoring analysis quality since it was under our surveillance for the entire time interval. Nevertheless, we tested the temporal fluctuations of the b values both with constant and moving magnitude completeness thresholds and we did not observe significant variations through time (Figures S2 and S3). In all cases, the main observation of decreasing b values after the M 4.5 foreshock (dashed black line in Figure 8) compared to the increasing ones just after the main shock held true, therefore, in our analysis, we continued with a constant threshold that let us include more samples.
Finally, we computed the median of the b values for the period of almost one year (from February 2018 until the last event before the foreshock of M4.5) as a reference value for the comparison with the period between the foreshock and the main shock that occurred 21 days later, as well as with the entire aftershock period. In Figure 9, the temporal variation in the b values with b r e f = 0.64 is illustrated. We can see that after the foreshock of M4.5 on 15 January 2019, the b values decrease rapidly compared with the reference value by approximately 10 % . In contrast, a general increase in the b values after the main shock occurrence is observed, that exceeds 10 % a day after, continues to increase and remains at a level reaching 20% or more up to the end of the study period.

7. Discussion and Conclusions

The seismic activity that manifested in 2019 in the offshore area north of Lefkada Island motivated our investigation for the identification of the geometry and kinematics of the activated fault segments, given that they are located at the junction between the two major active boundaries, namely the dextral strike slip Kefalonia Transform Fault Zone and the collision between the Adriatic microplate and the Greek mainland. It was expected to unveil the mode of kinematics and fill in the gap for the transition from transform to collision, adding value to the exhaustive relocation and manual picking of arrival phases for as many earthquakes as possible of the recorded ones, and the first polarities of the stronger shocks that are associated with the activated fault segments.
The exact location and geometry of the offshore part of the KTFZ and its termination against the thrust front was not identified with seismological data up to now. This lack of knowledge about its northern extent is mostly due to the lack of moderate earthquakes at this location during recent years where the seismological network detectability became efficient to provide the data for this analysis. The geometry of the offshore faults identified in this study exhibiting mostly strike slip motion do not match the orientation of the Lefkada fault branch. The difference in strike is ~20°, with the incorporation of a small thrust component in agreement with the adjacency of the compressional stress field regime. The three observed clusters that are traced from the relocated seismicity in this study exhibit spatial properties differentiation and reveal the 3D local structure, given that the focal depths were relocated with high accuracy. The northern fault segment, although traced in already suggested kinematic models [38,39], is for the first time to be identified and investigated with seismological recordings, and in particular, with such fine details. [38] referred to a right lateral strike-slip system that resulted from the collision of western Greece with the Apulian platform, and runs through western Greece to the KTFZ. The position of the identified activated fault segments, their strike and sense of slip agree with the active fault mapping and suggested regional tectonics of [40]. A clockwise rotation of the Ionian Islands and Akarnania block accommodated by major marginal strike-slip zones that appeared segmented along their strike was suggested by [41].
Available fault plane solutions of moderate and strong earthquakes (M ≥ 5.0) in the Lefkada segment of the KTFZ and the collision front extend as far as in the past such as 1973, from various sources ([42] for the earthquake of 1973/11/04, [43] for the earthquake of 25/02/1994 and the GCMT catalogue). Nevertheless, there are not any available focal mechanism solutions for earthquakes of such magnitude in the study area. Fault plane solutions for smaller magnitude earthquakes in the offshore area north of and close to Lefkada Island can be found in several studies ([8,44,45] among others). Those solutions are either covering the offshore area that is the southern edge of our study area, thus consistently following the NNE–SSW strike of the main fault zone, or they are not accompanied by a highly accurate focal distribution as in our study, because even in the most recent cases of the 2003 and 2015 earthquakes, the seismic activity in the area of the main fault under study was not intense.
Figure 10 shows the identified active structures and a kinematic sketch of the study area. Τhe focal mechanisms determined in the present study (compression quadrants shown in red, and numbering according to Table 3) along with the focal mechanisms of earthquakes with M ≥ 5.0 were already published (green compression quadrants). Their origin time (YYYY/MM/DD) is shown on the top of the beach balls. The thick gray lines denote the major active boundaries, namely the KTFZ, where the dextral strike slip motion is shown by the antiparallel yellow arrows, and the collision front by the sawtooth line. The prolongation of the KTFZ in the study area, as identified and documented in the present study, is colored in red. The inset map shows the axes of maximum stress, P-axes, as they have been taken from the fault plane solutions shown in the main part of the figure. The thick brown curved arrows follow the P-axis rotation in agreement with the strike slip motion along the KTFZ and the counterclockwise rotation of the Adria microplate.
The local fault system sheds more light on the transition from the dextral strike slip motion along the KTFZ to the thrust faulting along the collision front. The thrust component present in the fault plane solutions determined for the stronger earthquakes of the 2019 swarm put in evidence the influence of the compressive stress field to the strike slip faults that are either striking along the KTFZ (the southern ones) or “kinking” (the northern one) for compensating the kinematic direction prevalent at this location. The slight but gradually changing rotation in the azimuth of the maximum stress axes, from south (green arrows in Figure 10) to the northernmost edge of the 2019 activated structures (red arrows), supports the hypothesis of a transpression movement in a transition zone between the transform and collision zones.
The examination of the b value changes shows lower values before and higher after the main shock occurrence. A noticeable decrease in the b value (from 0.6 to 0.5) was observed immediately after the occurrence of the M4.5 foreshock on January 15 2019 and remained low until the main shock occurrence on 5 February 2019. Then, it sharply increased to the values before the M4.5 foreshock and gradually became higher, approaching the value of 0.9.

Supplementary Materials

The following are available online at https://www.mdpi.com/2076-3417/10/13/4491/s1, Figure S1: Frequency-magnitude distribution (FMD of pre-main shock and post-main shock datasets, Figure S2: Time-series of the b value of different sample sizes for the pre-main shock dataset, Figure S3: Same as in Figure S2 for the post-main shock dataset.

Author Contributions

Conceptualization, A.K., E.P. and V.K.; methodology, A.K. and P.B.; software, A.K. and P.B.; validation, A.K. and P.B.; formal analysis, A.K. and P.B.; investigation, A.K. and P.B., data curation, A.K.; writing—original draft preparation, A.K. and P.B.; writing—review and editing, E.P. and V.K.; visualization, A.K. and P.B.; supervision V.K. and E.P.; project administration, V.K. and E.P.; funding acquisition, V.K.; All authors have read and agreed to the published version of the manuscript.

Funding

This research is co-financed by Greece and the European Union (European Social Fund—ESF) through the Operational Programme «Human Resources Development, Education and Lifelong Learning 2014–2020» in the context of the project “Kinematic properties, active deformation and stochastic modelling of seismogenesis at the Kefalonia–Lefkada transform zone” (MIS–5047845).

Acknowledgments

The software Generic Mapping Tools was used to plot the map of the study area [46].

Conflicts of Interest

The authors declare no conflict of interest. The funders had no role in the design of the study; in the collection, analyses, or interpretation of data; in the writing of the manuscript, or in the decision to publish the results.

References

  1. Papadimitriou, E.E. Mode of strong earthquake recurrence in the central Ionian Islands (Greece): Possible triggering due to Coulomb stress changes generated by the occurrence of previous strong shocks. Bull. Seismol. Soc. Am. 2002, 92, 3293–3308. [Google Scholar] [CrossRef]
  2. Karakostas, V.G.; Papadimitriou, E.E.; Papazachos, C.B. Properties of the 2003 Lefkada, Ionian Islands, Greece, earthquake seismic sequence and seismicity triggering. Bull. Seismol. Soc. Am. 2004, 94, 1976–1981. [Google Scholar] [CrossRef] [Green Version]
  3. Goebel, T.H.; Schorlemmer, D.; Becker, T.W.; Dresen, G.; Sammis, C.G. Acoustic emissions document stress changes over many seismic cycles in stick-slip experiments. Geophys. Res. Lett. 2013, 40, 2049–2054. [Google Scholar] [CrossRef] [Green Version]
  4. Scholz, C.H. The frequency-magnitude relation of microfracturing in rock and its relation to earthquakes. Bull. Seismol. Soc. Am. 1968, 58, 399–415. [Google Scholar]
  5. Schorlemmer, D.; Wiemer, S.; Wyss, M. Variations in earthquake-size distribution across different stress regimes. Nature 2005, 437, 539–542. [Google Scholar] [CrossRef] [PubMed]
  6. Permanent Regional Seismological Network operated by the Aristotle University of Thessaloniki. Available online: http://geophysics.geo.auth.gr/the_seisnet/WEBSITE_2005/station_index_en.html (accessed on 17 May 2020). [CrossRef]
  7. Klein, F.W. User’s Guide to HYPOINVERSE-2000, A Fortran Program to Solve Earthquake Locations and Magnitudes; U.S. Geological Survey Open File Report, 02-171 Version 1.0; U.S. Geological Survey: Reston, VA, USA, 2000.
  8. Papadimitriou, E.; Karakostas, V.; Mesimeri, M.; Ghouliaras, C.; Kourouklas, C. The Mw6.5 17 November 2015 Lefkada (Greece) Earthquake: Structural Interpretation by Means of the Aftershock Analysis. Pure Appl. Geophys. 2017, 174, 3869–3888. [Google Scholar] [CrossRef]
  9. Karakostas, V.G.; Papadimitriou, Ε.Ε.; Gospodinov, D. Modeling the 2013 North Aegean (Greece) seismic sequence: Geometrical and frictional constraints, and aftershock probabilities. Geophys. J. Int. 2014, 197, 525–541. [Google Scholar] [CrossRef] [Green Version]
  10. Waldhauser, F. HypoDD—A Program to Compute Double–Difference Hypocenter Locations; US Geological Survey Open File Report; U.S. Geological Survey: Reston, VA, USA, 2001; pp. 1–113.
  11. Paige, C.C.; Saunders, M.A. LSQR: An Algorithm for Sparse Linear Equations and Sparse Least Squares. ACM Trans. Math. Softw. 1982, 8, 43–71. [Google Scholar] [CrossRef]
  12. Schaff, D.P.; Bokelmann, G.H.R.; Ellsworth, W.L.; Zanzerkia, E.; Waldhauser, F.; Beroza, G.C. Optimizing correlation techniques for improved earthquake location. Bull. Seismol. Soc. Am. 2004, 94, 705–721. [Google Scholar] [CrossRef] [Green Version]
  13. Schaff, D.P.; Waldhauser, F. Waveform cross–correlation–based differential travel–time measurements at the northern California seismic network. Bull. Seism. Soc. Am. 2005, 95, 2446–2461. [Google Scholar] [CrossRef] [Green Version]
  14. Mesimeri, M.; Karakostas, V.; Papadimitriou, E.; Tsaklidis, G.; Jacobs, K. Relocation of recent seismicity and seismotectonic properties in the Gulf of Corinth (Greece). Geophys. J. Intern. 2018, 212, 1123–1142. [Google Scholar] [CrossRef]
  15. Efron, B. The Jackknife, the Bootstrap and Other Resampling Plans. Soc. Idustr. Appl. Math. Phila. 1982, 5–11. [Google Scholar] [CrossRef]
  16. Waldhauser, F.; Ellsworth, W.L. A double-difference earthquake location algorithm: Method and application to the Northern Hayward Fault, California. Bull. Seism. Soc. Am. 2000, 90, 1353–1368. [Google Scholar] [CrossRef]
  17. Reasenberg, P.; Oppenheimer, D.H. FPFIT, FPPLOT and FPPAGE; Fortran Computer Programs for Calculating and Displaying Earthquake Fault-Plane Solutions; Open-File Rep. 85-739; U.S. Geological Survey: Reston, VA, USA, 1985.
  18. Karakostas, V.G.; Papadimitriou, E.E. Fault complexity associated with the 14 August 2003 Mw6.2 Lefkada, Greece, aftershock sequence. Acta Geophys. 2010, 58, 838–854. [Google Scholar] [CrossRef]
  19. Wells, D.L.; Coppersmith, K.J. New Empirical Relationships among Magnitude, Rupture Length, Rupture width, Rupture Area, and Surface Displacement. Bull. Seismol. Soc. Am. 1994, 84, 974–1002. [Google Scholar]
  20. Papazachos, B.C.; Scordilis, E.M.; Panagiotopoulos, D.G.; Papazachos, C.B.; Karakaisis, G.F. Global relations between seismic fault parameters and moment magnitude of earthquakes. In Proceedings of the 10th International Congress of the Geological Society, Thessaloniki, Greece, 14–17 April 2004; pp. 539–540. [Google Scholar] [CrossRef] [Green Version]
  21. Thingbaijam, K.K.S.; Mai, P.M.; Goda, K. New Empirical Earthquake Source-Scaling Laws. Bull. Seismol. Soc. Am. 2017, 107, 2225–2246. [Google Scholar] [CrossRef] [Green Version]
  22. Ganas, A.; Elias, P.; Bozionelos, G.; Papathanassiou, G.; Avallone, A.; Papastergios, A.; Valkaniotis, S.; Parcharidis, I.; Briole, P. Coseismic deformation, field observations and seismic fault of the 17 November 2015 M = 6.5, Lefkada Island, Greece earthquake. Tectonophysics 2016, 687, 210–222. [Google Scholar] [CrossRef]
  23. King, G.C.P.; Stein, R.S.; Jian, L. Static stress changes and the triggering of earthquakes. Bull. Seismol. Soc. Am. 1994, 84, 935–953. [Google Scholar] [CrossRef]
  24. Harris, R.A. Introduction to Special Section: Stress Triggers, Stress Shadows, and Implications for Seismic Hazard. J. Geophys. Res. Solid Earth 1998, 103, 24347–24358. [Google Scholar] [CrossRef]
  25. Reasenberg, P.A.; Simpson, R.W. Response of regional seismicity to the static stress change produced by the Loma Prieta earthquake. Science 1992, 255, 1687–1690. [Google Scholar] [CrossRef]
  26. Rice, J.R.; Cleary, M.P. Some basic stress diffusion solutions for fluid–saturated elastic porous media with compressible constituents. Rev. Geophys. Space Phys. 1976, 14, 227–241. [Google Scholar] [CrossRef]
  27. Robinson, R.; McGinty, P.J. The enigma of the Arthur’s Pass, New Zealand, earthquake: 2. The aftershock distribution and its relation to regional and induced stress fields. J. Geophys. Res. 2000, 105, 16139–16150. [Google Scholar] [CrossRef]
  28. Karakostas, V.; Papadimitriou, E.; Mesimeri, M.; Gkarlaouni, C.; Paradisopoulou, P. The 2014 Kefalonia Doublet (Mw6.1 and Mw6.0), central Ionian Islands, Greece: Seismotectonic implications along the Kefalonia transform fault zone. Acta Geophys. 2015, 63, 1–16. [Google Scholar] [CrossRef] [Green Version]
  29. Karakostas, V.; Mirek, K.; Mesimeri, M.; Papadimitriou, E.; Mirek, J. The Aftershock Sequence of the 2008 Achaia, Greece, Earthquake: Joint Analysis of Seismicity Relocation and Persistent Scatterers Interferometry. Pure Appl. Geophys. 2017, 174, 151–176. [Google Scholar] [CrossRef]
  30. Lippiello, E.; Cirillo, A.; Godano, C.; Papadimitriou, E.; Karakostas, V. Post Seismic Catalog Incompleteness and Aftershock Forecasting. Geosciences 2019, 9, 355. [Google Scholar] [CrossRef] [Green Version]
  31. Gulia, L.; Wiemer, S. Real-time discrimination of earthquake foreshocks and aftershocks. Nature 2019, 574, 193–199. [Google Scholar] [CrossRef] [PubMed]
  32. Wiemer, S.; Wyss, M. Minimum magnitude of completeness in earthquake catalogs: Examples from Alaska, the Western United States, and Japan. Bull. Seism. Soc. Am. 2002, 90, 859–869. [Google Scholar] [CrossRef]
  33. Zhou, Y.; Zhou, S.; Zhuang, J. A test on methods for MC estimation based on earthquake catalog. Earth Planet. Phys. 2018, 2, 150–162. [Google Scholar] [CrossRef]
  34. Aki, K. Maximum likelihood estimate of b in the formula log N=a-bM and its confidence limits. Bull. Earthq. Res. Inst. 1965, 43, 237–239. [Google Scholar]
  35. Tormann, T.; Wiemer, S.; Mignan, A. Systematic survey of high-resolution b value imaging along Californian faults: Inference on asperities. J. Geophys. Res. Sol. Earth 2014, 119, 2029–2054. [Google Scholar] [CrossRef]
  36. Console, R.; Carluccio, R.; Papadimitriou, E.; Karakostas, V. Synthetic earthquake catalogs simulating seismic activity in the Corinth Gulf, Greece, fault system. J. Geophys. Res. Sol. Earth 2015, 120, 326–343. [Google Scholar] [CrossRef]
  37. Woessner, J.; Wiemer, S. Assessing the quality of earthquake catalogues: Estimating the magnitude of completeness and its uncertainty. Bull. Seismol. Soc. Am. 2005, 95, 684–698. [Google Scholar] [CrossRef]
  38. van Hinsbergen, D.J.J.; van der Meer, D.G.; Zachariasse, W.J.; Meulenkamp, J.E. Deformation of western Greece during Neogene clockwise rotation and collision with Apulia. Int. J. Earth Sci. (Geol. Rundsch.) 2006, 95, 463–490. [Google Scholar] [CrossRef]
  39. Vassilakis, E.; Royden, L.; Papanikolaou, D. Kinematic links between subduction along the Hellenic trench and extension in the Gulf of Corinth, Greece: A multidisciplinary analysis. Earth Planet. Sci. Lett. 2011, 303, 108–120. [Google Scholar] [CrossRef]
  40. Perouse, E.; Sebrier, M.; Braucher, R.; Chamot Rooke, N.; Bourles, D.; Briole, P.; Sorel, D.; Dimitrov, D.; Arsenikos, S. Transition from collision to subduction in western Greece: The katouna—Stamna active fault system and regional kinematics. Int. J. Earth Sci. (Geol. Rundsch.) 2017, 106, 967–989. [Google Scholar] [CrossRef] [Green Version]
  41. Haddad, A.; Ganas, A.; Kassaras, I.; Lupi, M. Seismicity and geodynamics of western Peloponnese and central Ionian Islands: Insights from a local seismic deployment. Tectonophysics 2020. [Google Scholar] [CrossRef]
  42. Baker, C.; Hatzfeld, D.; Lyon-Caen, H.; Papadimitriou, E.; Rigo, A. Earthquake mechanisms of the Adriatic Sea and Western Greece: Implications for the oceanic subduction-continental collision transition. Geophys. J. Int. 1997, 131, 559–594. [Google Scholar] [CrossRef] [Green Version]
  43. Louvari, E.; Kiratzi, A.A.; Papazachos, B.C. The Cephalonia Transform Fault and its extension to western Lefkada Island (Greece). Tectonophysics 1999, 308, 223–236. [Google Scholar] [CrossRef]
  44. Hatzfeld, D.; Kassaras, I.; Panagiotopoulos, D.; Amorese, D.; Makropoulos, K.; Karakaisis, G.; Coutant, O. Microseimicity and strain pattern in northwestern Greece. Tectonics 1995, 14, 773–785. [Google Scholar] [CrossRef]
  45. Benetatos, C.; Kiratzi, A.; Roumelioti, Z.; Stavrakakis, G.; Drakatos, G.; Latoussakis, I. The 14 August 2003 Lefkada Island (Greece) earthquake: Focal mechanisms of the mainshock and of the aftershock sequence. J. Seismol. 2005, 9, 171–190. [Google Scholar] [CrossRef]
  46. Wessel, P.; Smith, W.H.F.; Scharroo, R.; Luis, J.; Wobbe, F. Generic Mapping Tools: Improved Version Released. EOS Trans. Am. 2013. [Google Scholar] [CrossRef] [Green Version]
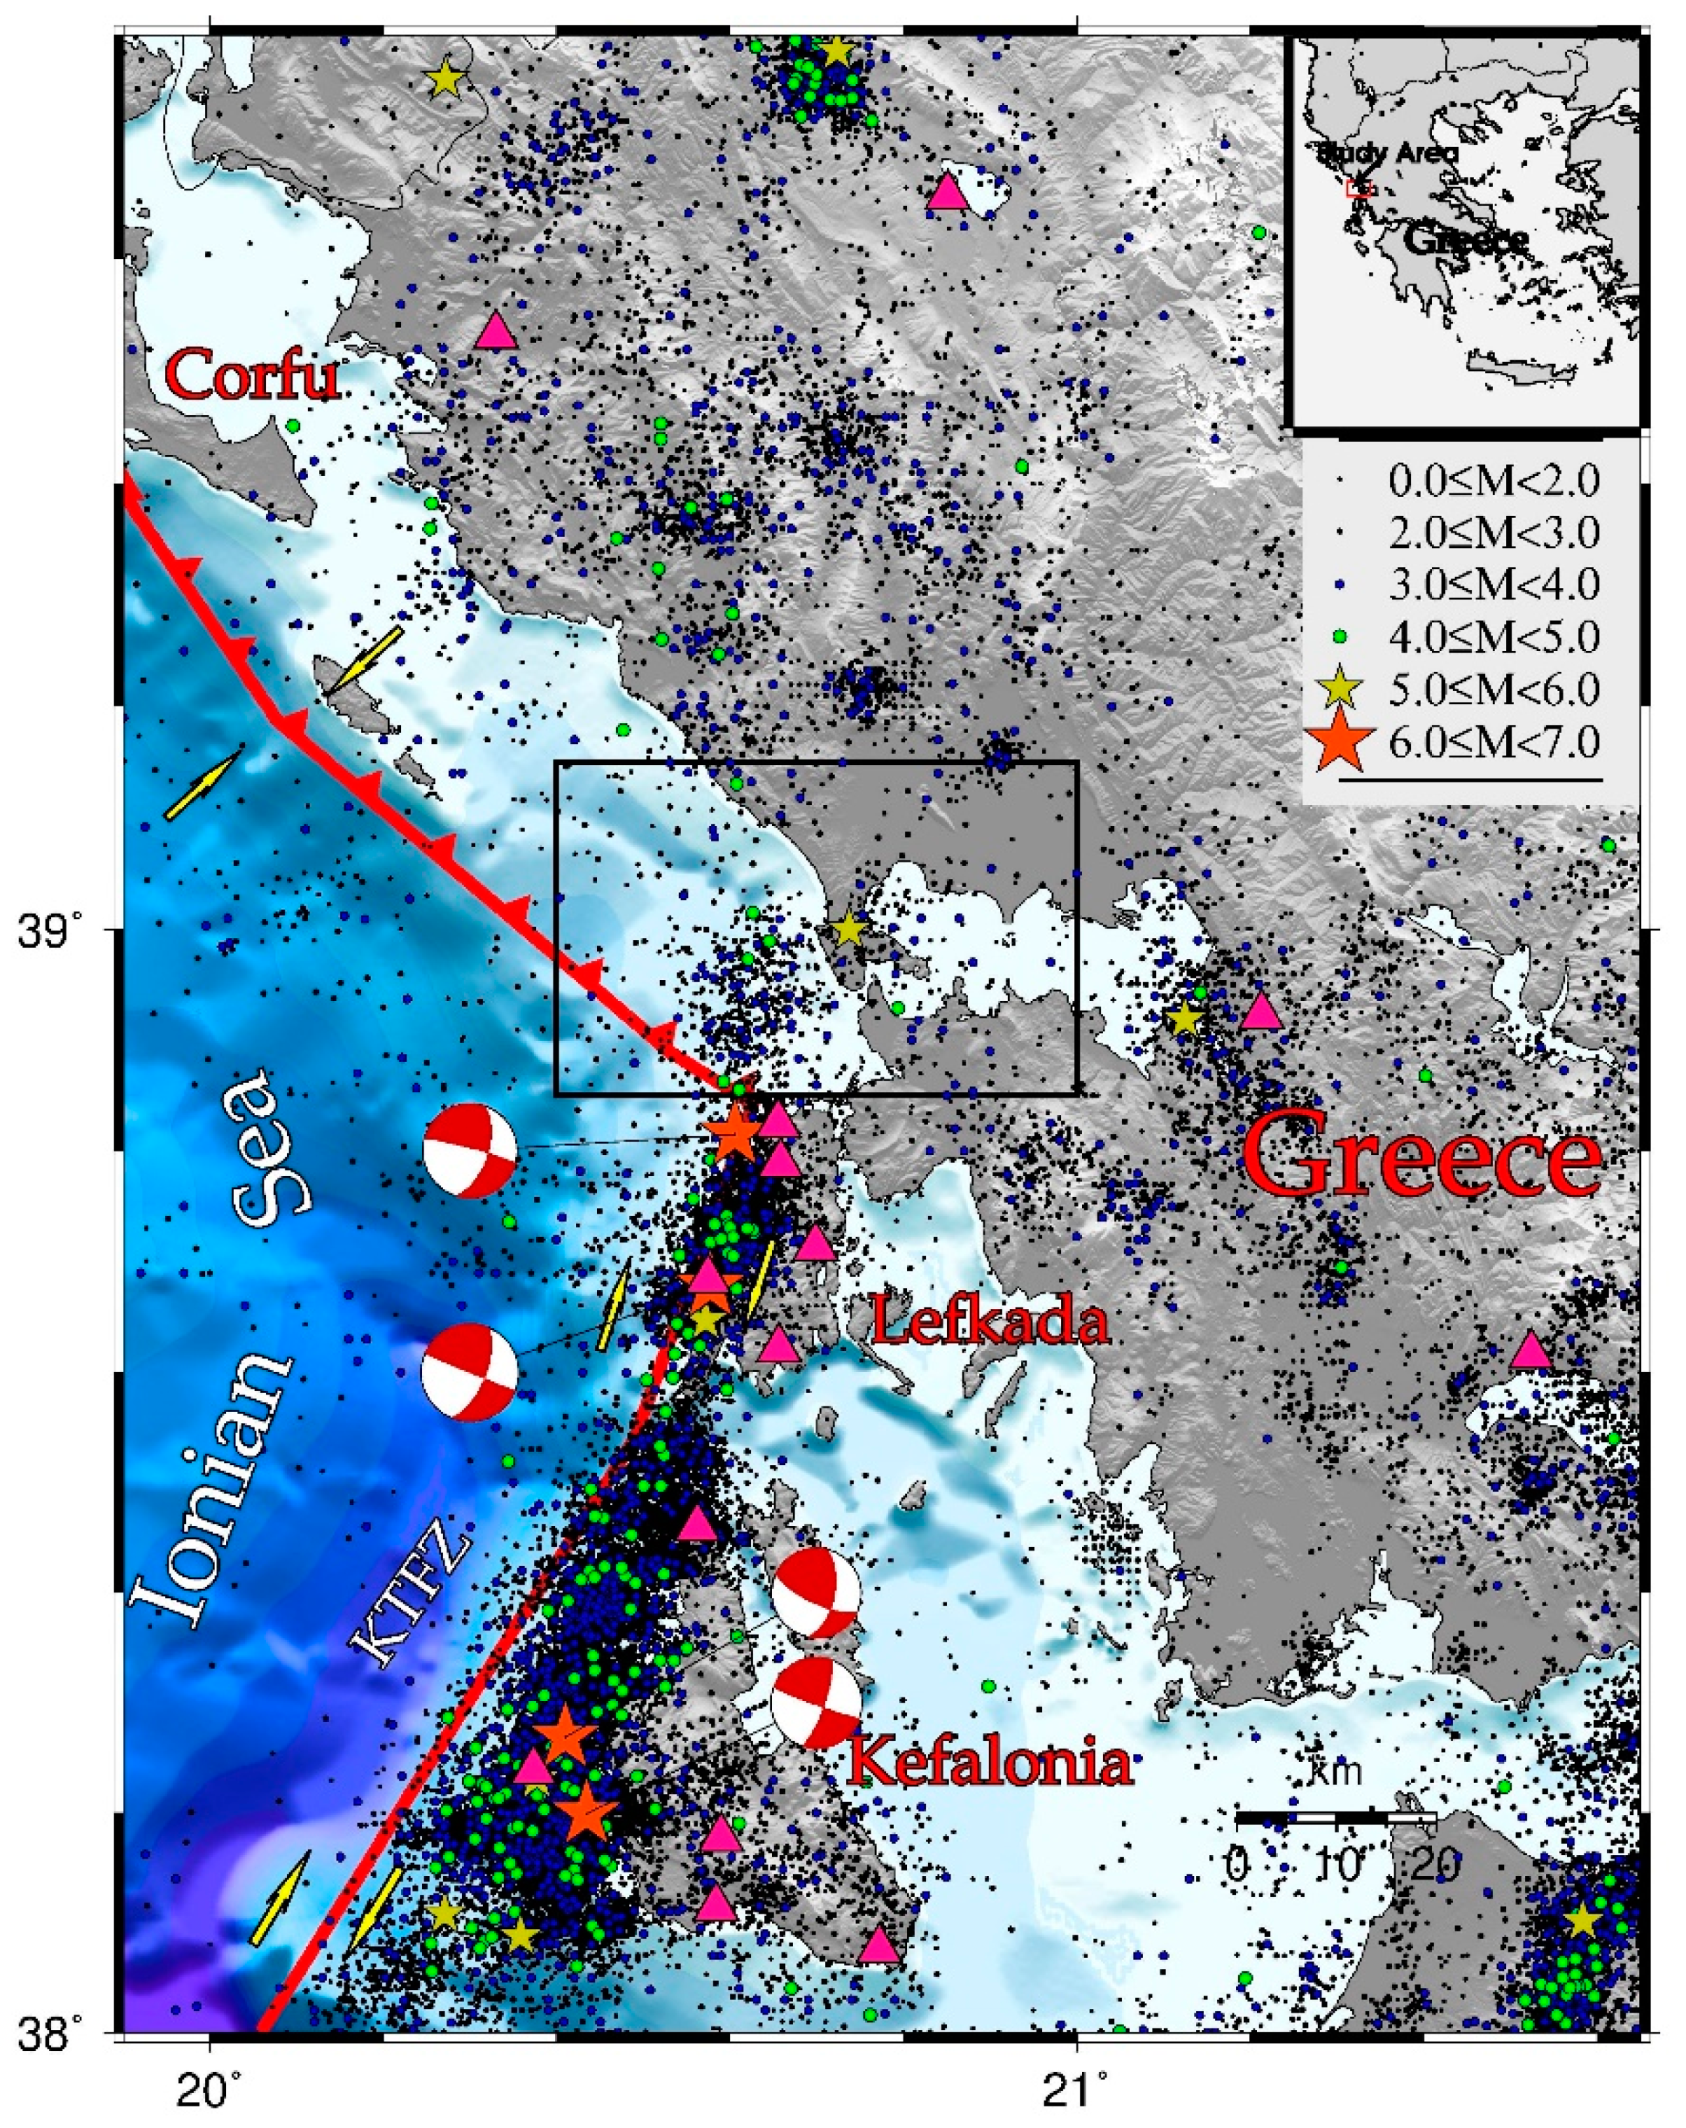
Figure 1. Active boundaries and seismicity in the Ionian Islands. The study area is delimited by a rectangle, also shown in the inset where the entirety of Greece is depicted. Earthquake epicenters are plotted according to the symbols and colors shown in the legend. The fault plane solutions of the most recent (since 2003) main shocks are shown as equal area lower hemisphere projections, where the compression quadrants are in red. The pink triangles denote the seismic stations used to record the relocated earthquakes in the current study.
Applsci 10 04491 g001
Figure 2. (a) Cumulative daily number of earthquakes as a function of time. A very small onset in seismicity is observed in Mid–January 2019 followed by the main onset after the main shock in early February 2019. (b) Earthquake magnitudes as a function of time. The small onset of seismicity in mid-January (blue symbols) corresponds to a magnitude 4.5 earthquake occurring near the main shock.
Applsci 10 04491 g002
Figure 3. Spatial distribution of the relocated seismicity. The epicenters are colored according to the period of their occurrence as these periods have been defined and shown in Figure 2.
Applsci 10 04491 g003
Figure 4. (a) Epicentral distribution of the relocated seismicity, plotted with different symbols and colors according to their magnitude as shown in the inset, along with the fault plane solutions determined in the current study depicted as equal area lower hemisphere projections, with the compression quadrants shown in black. (b) Cross-section across a N–S direction, containing the entire set of the relocated seismicity, with the hypocenters depicted with the same symbols as in (a) and the fault plane solutions as frontal projections. (c) Same as in (b) for a cross-section across a W–E direction. (d) Fault plane solutions along with the associated polarities (“+” for compression and “o” for dilatation) for the earthquakes numbered 2, 4, 7 and 8 in Table 3.
Applsci 10 04491 g004
Figure 5. (a) Epicentral distribution for the main cluster, located at the northernmost point of the activity, along with two cross-sections parallel and normal to its strike, PP and PN, respectively, (b) strike parallel cross-section, (c) strike normal cross-section of the main cluster.
Applsci 10 04491 g005
Figure 6. (a) Coulomb stress changes caused by the coseismic slip of the main shock, calculated at a depth of 16.5 km, according to the faulting type of the main shock. Thin black line is the fault trace at the depth of the top of the seismogenic layer, (b) same as in (a) for the faulting type of the strongest M4.0 aftershock at a depth of 11.5 km.
Applsci 10 04491 g006
Figure 7. (a) Earthquake magnitudes, M M c , as a function of time, (b) incremental (red triangles) and logarithm of the cumulative frequency (blue triangles) as a function of magnitude. The black line is the GR law fit with M c = 1.3 according to maximum curvature (MAXC).
Applsci 10 04491 g007
Figure 8. Time-series of the b value for different sample sizes. The number of shocks (n) of each sample is written at the left top corner of each box and it is the same for both the pre-main shock and after-main shock datasets. Red dotted line corresponds to the main shock occurrence time, black dashed line to the foreshock M 4.5 occurrence time and the red and blue dots are plotted at the occurrence time of the last event in each sample, respectively.
Applsci 10 04491 g008
Figure 9. Top: the percent difference in the b values (blue circles) compared with the reference value (cyan dashed-dot line). The vertical dotted line with the red star corresponds to the main shock occurrence time and the black dashed vertical line to the occurrence time of the foreshock. Bottom: same as in top but for the estimated b values.
Applsci 10 04491 g009
Figure 10. Fault plane solutions of 16 earthquakes projected as equal area lower hemisphere projections, where compression quadrants are in green for earthquakes of M > 5.0, that occurred before the earthquake sequence in study and in red for earthquakes that were determined and belong to the swarm investigated in this study. Thick grey lines denote the active boundaries of the Kefalonia Transform Fault Zone (KTFZ) and the Apulian collision front. Red lines depict the identified fault segment offshore Lefkada. Thin black line represents the Ionian thrust. Yellow arrows indicate relative plate motion. The inset shows the P-axis inferred from the focal mechanisms. Black arrows illustrate the characteristic direction of the axis, NE–SW for the earthquakes along the KTFZ and N–E for those.
Applsci 10 04491 g010
Table 1. 1D velocity model used for the seismicity relocation in the present study.
VP (km/s)Depth (km)
5.8500.0
5.8701.0
5.9802.0
6.6356.0
6.4908.0
6.5259.0
6.56011.0
6.58013.0
6.62521.0
6.70028.0
8.00040.0
Table 2. Median errors computed by the 95% confidence error ellipsoid for the bootstrap method and median errors of standard deviations obtained from the jackknife method. Errors are presented in the three main spatial directions.
DirectionW-EN-SDepth
Bootstrap Median error (m)14474221806
Jackknife Median St. Deviation Errors (m) 1055235330
Table 3. Information on the fault plane solutions determined in the present study. The first column gives the serial number of each solution ordered according to the occurrence date and time, shown in the second and third columns, respectively. The relocated epicentral coordinates and focal depths follow in the next three 5th to 7th columns and the magnitude in the 8th column. The strike, dip and rake of the 2 nodal planes are shown in columns 8–10 and 11–13, respectively. The azimuthal gap for each solution is given in the last column.
nDate Occurrence TimeLat
(oN)
Lon
(oE)
Depth
(km)
MLNodal Plane INodal Plane IIAz. Gap
Strike
(o)
Dip (o)Rake
(o)
Strike
(o)
Dip (o)Rake (o)
113/01/1921:07:21.1638.984920.656917.243.6240761803309014181
215/01/1901:25:05.0038.990420.658717.344.5220451553287348127
315/01/1902:58:46.9638.995720.651717.903.7215401503297154127
405/02/1902:26:09.2739.010120.687017.865.2227451603317647138
505/02/1909:25:28.4338.993120.663617.353.322667−15312565−25131
606/02/1905:30:05.5238.924220.619013.033.81067−15627068−25122
724/02/1921:58:30.2838.900520.61108.343.830551201654554127
826/02/1910:05:59.3938.882320.61039.184.018621391305535129
Table 4. Information on the two datasets used in the study.
DatasetsTime IntervalN M c N c a b
Pre-main shock4/2/2018–5/2/20191221.5942.840.58
After-main shock5/2/2019–8/10/20192981.52263.480.75