Article

Autonomous Dynamic Adaptability System to Maintain Irradiance Levels in a Steady-State Solar Simulator

1
Fort Hare Institute of Technology, University of Fort Hare, Alice 5700, South Africa
2
Department of Physics, University of Fort Hare, Alice 5700, South Africa
*
Author to whom correspondence should be addressed.
Appl. Sci. 2020, 10(13), 4534; https://doi.org/10.3390/app10134534
Submission received: 28 April 2020 / Revised: 31 May 2020 / Accepted: 4 June 2020 / Published: 30 June 2020
(This article belongs to the Section Electrical, Electronics and Communications Engineering)

Abstract

:
This paper presents the design of an autonomous dynamic adaptability system (ADAS) for maintaining the irradiance levels of a steady-state xenon arc lamp solar simulator (SS). The solar simulator is used to carry out indoor testing and accelerated age tests on photovoltaic (PV) cells at the Fort Hare Institute of Technology (FHIT). The ADAS was designed primarily for two reasons: Firstly, to maintain a set irradiance level, irrespective of external effects which may cause unintended irradiance drift or fluctuations, while carrying out indoor tests. Secondly, to achieve the solar simulator set point quicker, thus reducing temperature build up on the target area. At a cold start, the SS runs at 20% of its rated current (145 A). At 20% of 145 A, the simulator gave an irradiance of 145.97 Wm−2 with a non-uniformity of 1.02%, and a cell surface temperature of 24.9 °C. At 50%, the simulator produced irradiance of 501.30 Wm−2, with a non-uniformity of 1.53% and a cell surface temperature of 25.0 °C. The irradiance of 1000 Wm−2, with a non-uniformity of 3.26% and a cell surface temperature of 25.9 °C, was achieved at 90% of the rated current. From the results obtained, the ADAS demonstrates that it can reliably operate the SS with very minimal human–machine interaction. Through the autonomous dynamic adaptability, set irradiance levels are maintained in a steady-state solar simulator once the user supplies operational set points via the supervisory control and data acquisition (SCADA) interface.

1. Introduction

Solar simulators are often used for the indoor characterisation of photovoltaic cells [1,2,3]. This is due to the varying outdoor conditions [4]. Solar simulators are either pulse or steady-state simulators [5,6], and are classified in terms of their spectral match, spatial uniformity and temporal instability [5,7,8]. The properties mentioned above for any solar simulator must fall into class A, B, C or no class. A control system with dual operation modes was designed and built for the xenon (Xe) arc lamp solar simulator, to regulate the light intensity as well as to measure and store data. Control systems are widely used in the areas of research and industry [9]. The responsive control system designed in this study employs a modular approach [10], with a programmable logic control (PLC) module to maintain the light intensity of the steady-state solar simulator. The PLC allows the exchange of information among the other components that make up the control system, through a supervisory control and data acquisition (SCADA) tool, installed on a personal computer (PC), where inputs are made. At the same time, the outputs (irradiance, cell surface temperature, current, voltage and power) are measured and stored. In this paper, a control system capable of dynamically controlling the simulator’s light intensity, on-site as well as remotely, is presented. This system was designed and built at the Fort Hare Institute of Technology, as part of this study. The control system incorporates a SCADA, which starts the lamp, and processes, stores and visualises data from the solar simulator.

2. Materials and Methods

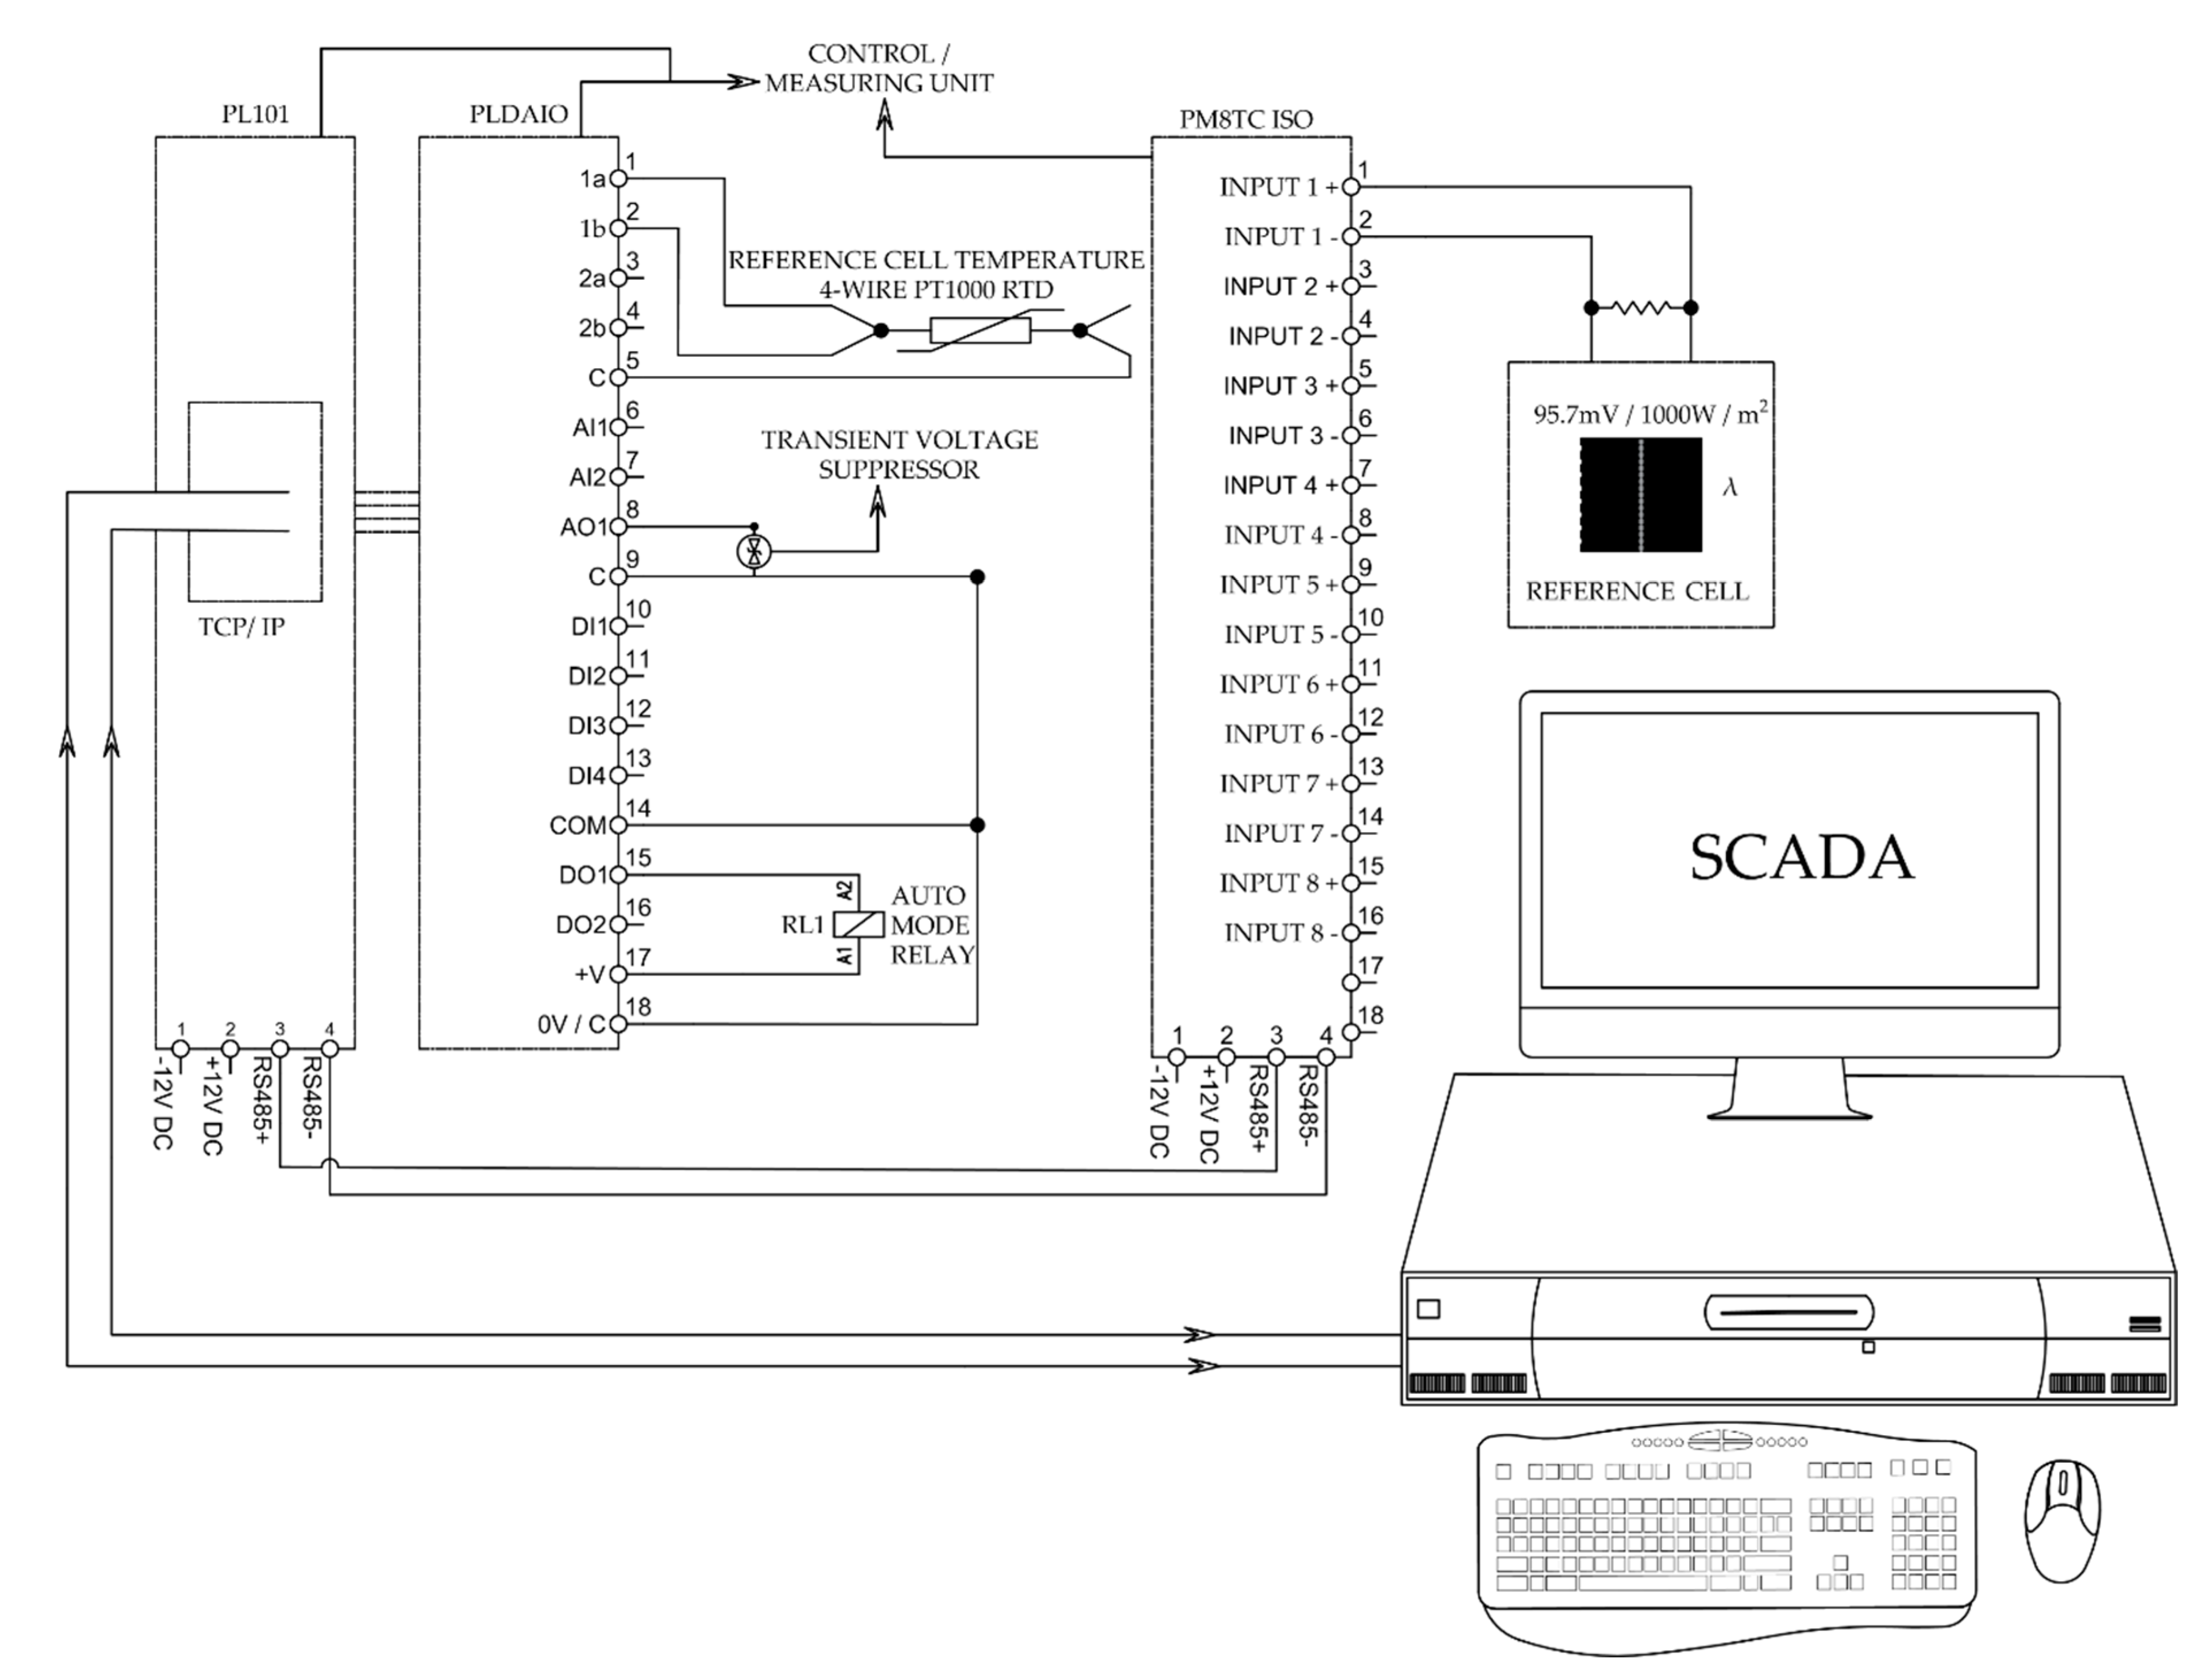
2.1. System Architecture

This section presents the design of the autonomous dynamic adaptability system (ADAS). The ADAS comprises of a programmable logic control unit (PLC), a digital as well as an analogue input and output module (PLDAIO), thermocouple input and output module (PM8TCISO) and supervisory control and data acquisition application/tool, on a personal computer, for operating and monitoring the autonomous dynamic adaptability system (ADAS). A simplified representation of the ADAS is presented in Figure 1.
Two DC power supplies (12 V and 24 V) provide power for the autonomous dynamic adaptability system (ADAS) in Figure 1. They are connected to the xenon lamp’s power supply through an interface port, to regulate the intensity of the solar simulator. The current and voltage inputs of the solar simulator, irradiance, and the reference cell’s surface temperature on the target test area are measured and stored by the SCADA.

2.2. Hardware Description

The ADAS is made up of various components which are described herein. The ADAS operates the solar simulator, monitors its performance, and electrically isolates the measuring unit from the PC through the use of a relay, as shown in Figure 1. The traditional peripheral component interconnect (PCI) card in the initial design was susceptible to electrical surges, and was incapable of starting the solar simulator due to its inability to source a sufficient reference input signal to start the solar simulator. A separate unit had to be designed to start, stop and monitor the operation of the solar simulator.

2.2.1. Metal Oxide Varistor

A metal oxide varistor (MOV) is made up various oxides, with zinc oxide constituting over 80% of the entire composition [11]. Because of its ability to arrest lightning due to its non-linear characteristics [12], it is widely used to protect electronics and other electric equipment from overvoltage [13]. Hence, MOV was used to protect the electronics in the ADAS.

2.2.2. Miniature Circuit Breaker

A miniature circuit breaker (MCB) is widely used in electric circuit protection, for releasing and disconnecting the electronic circuit when there is a short circuit. The use of an MCB has proven to be reliable in the protection of electrical equipment and lines from overloads and short-circuits [14].

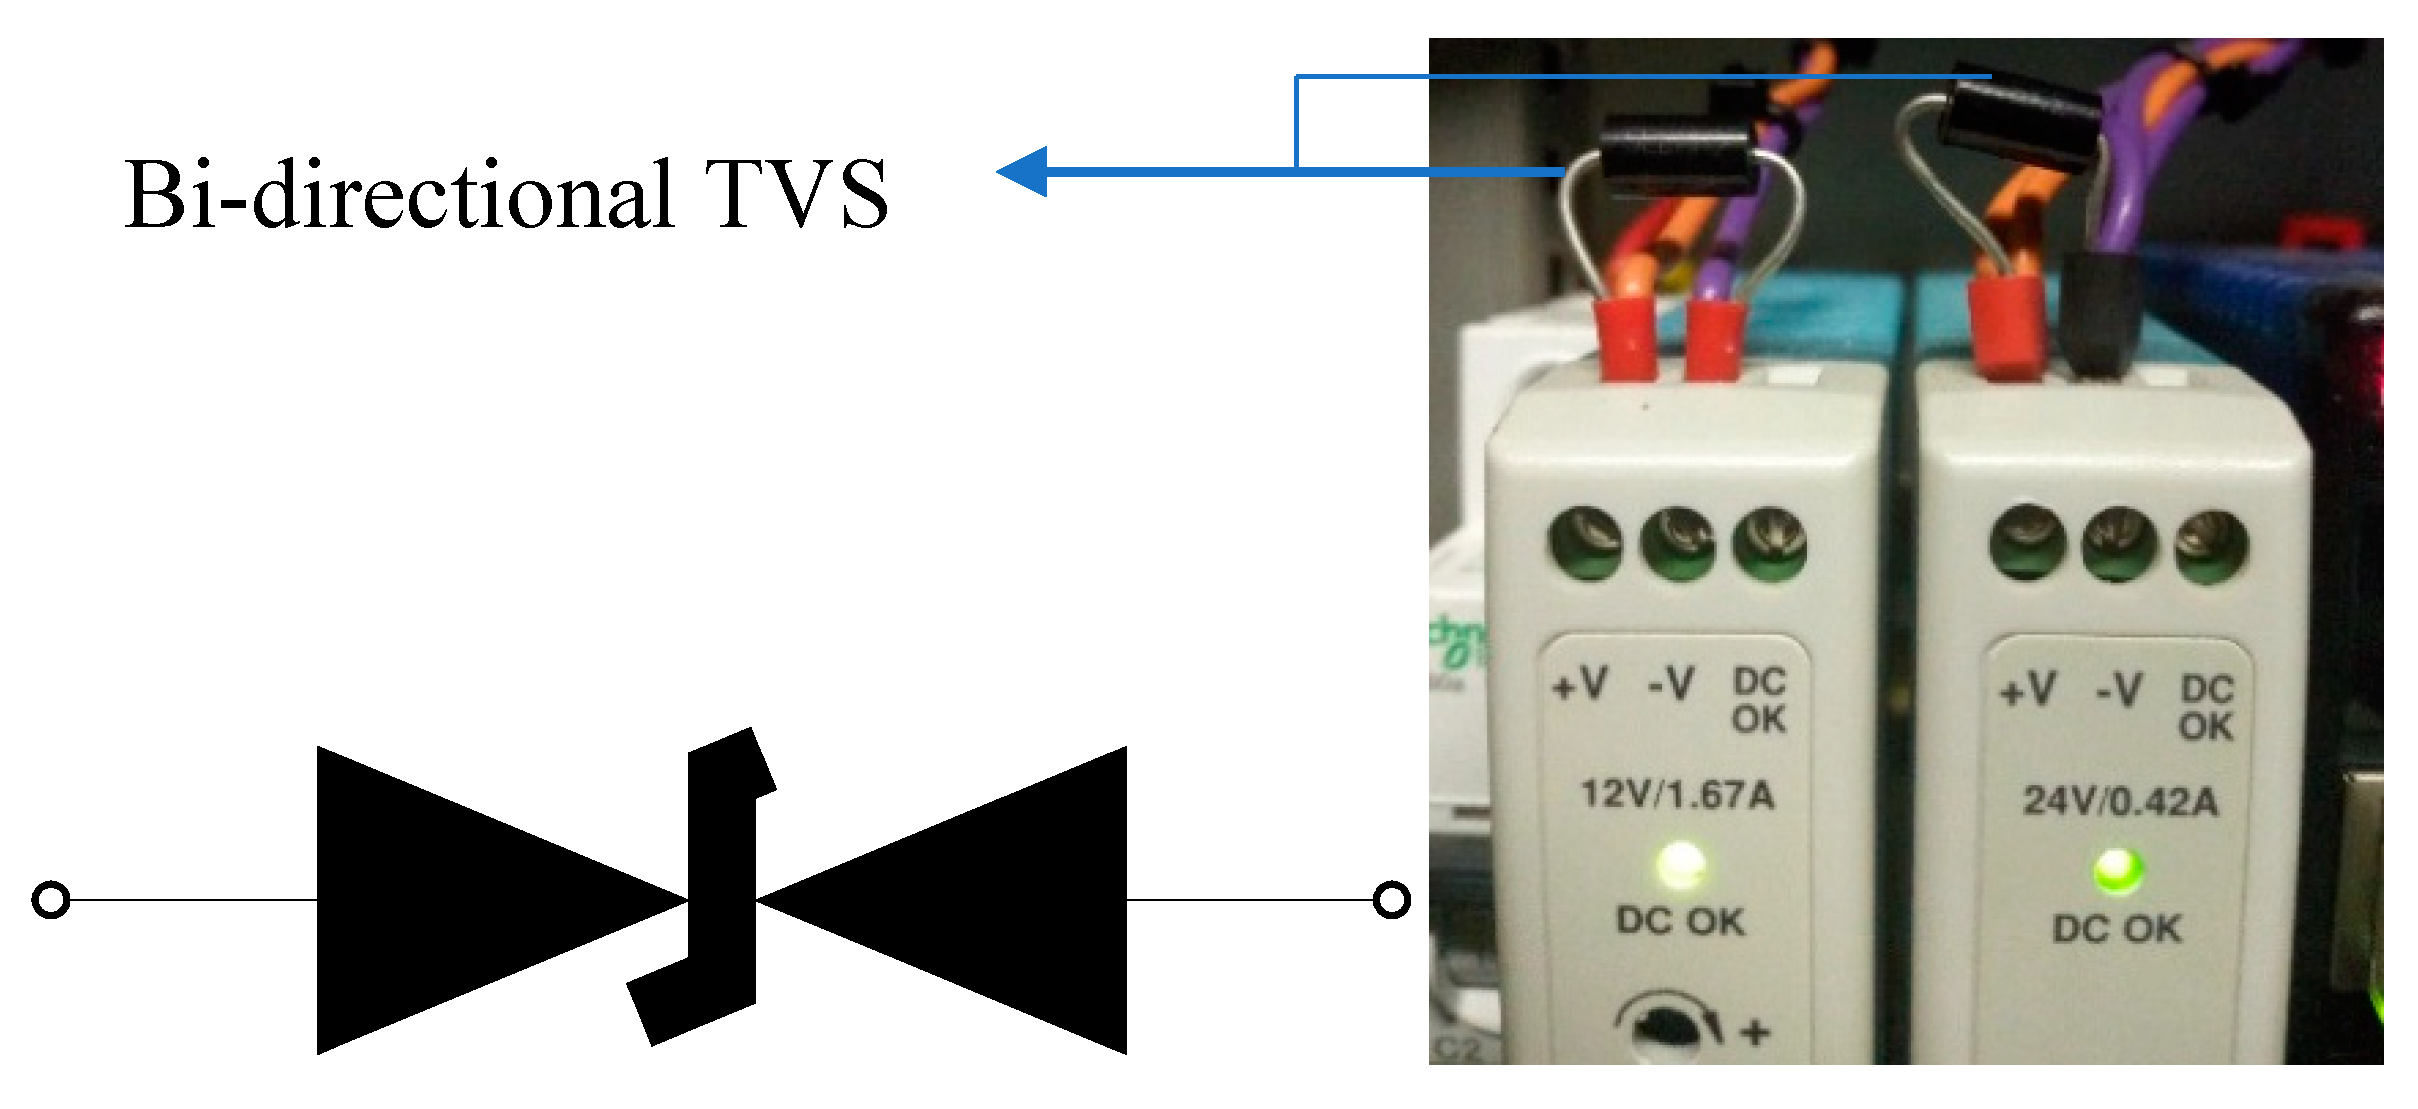
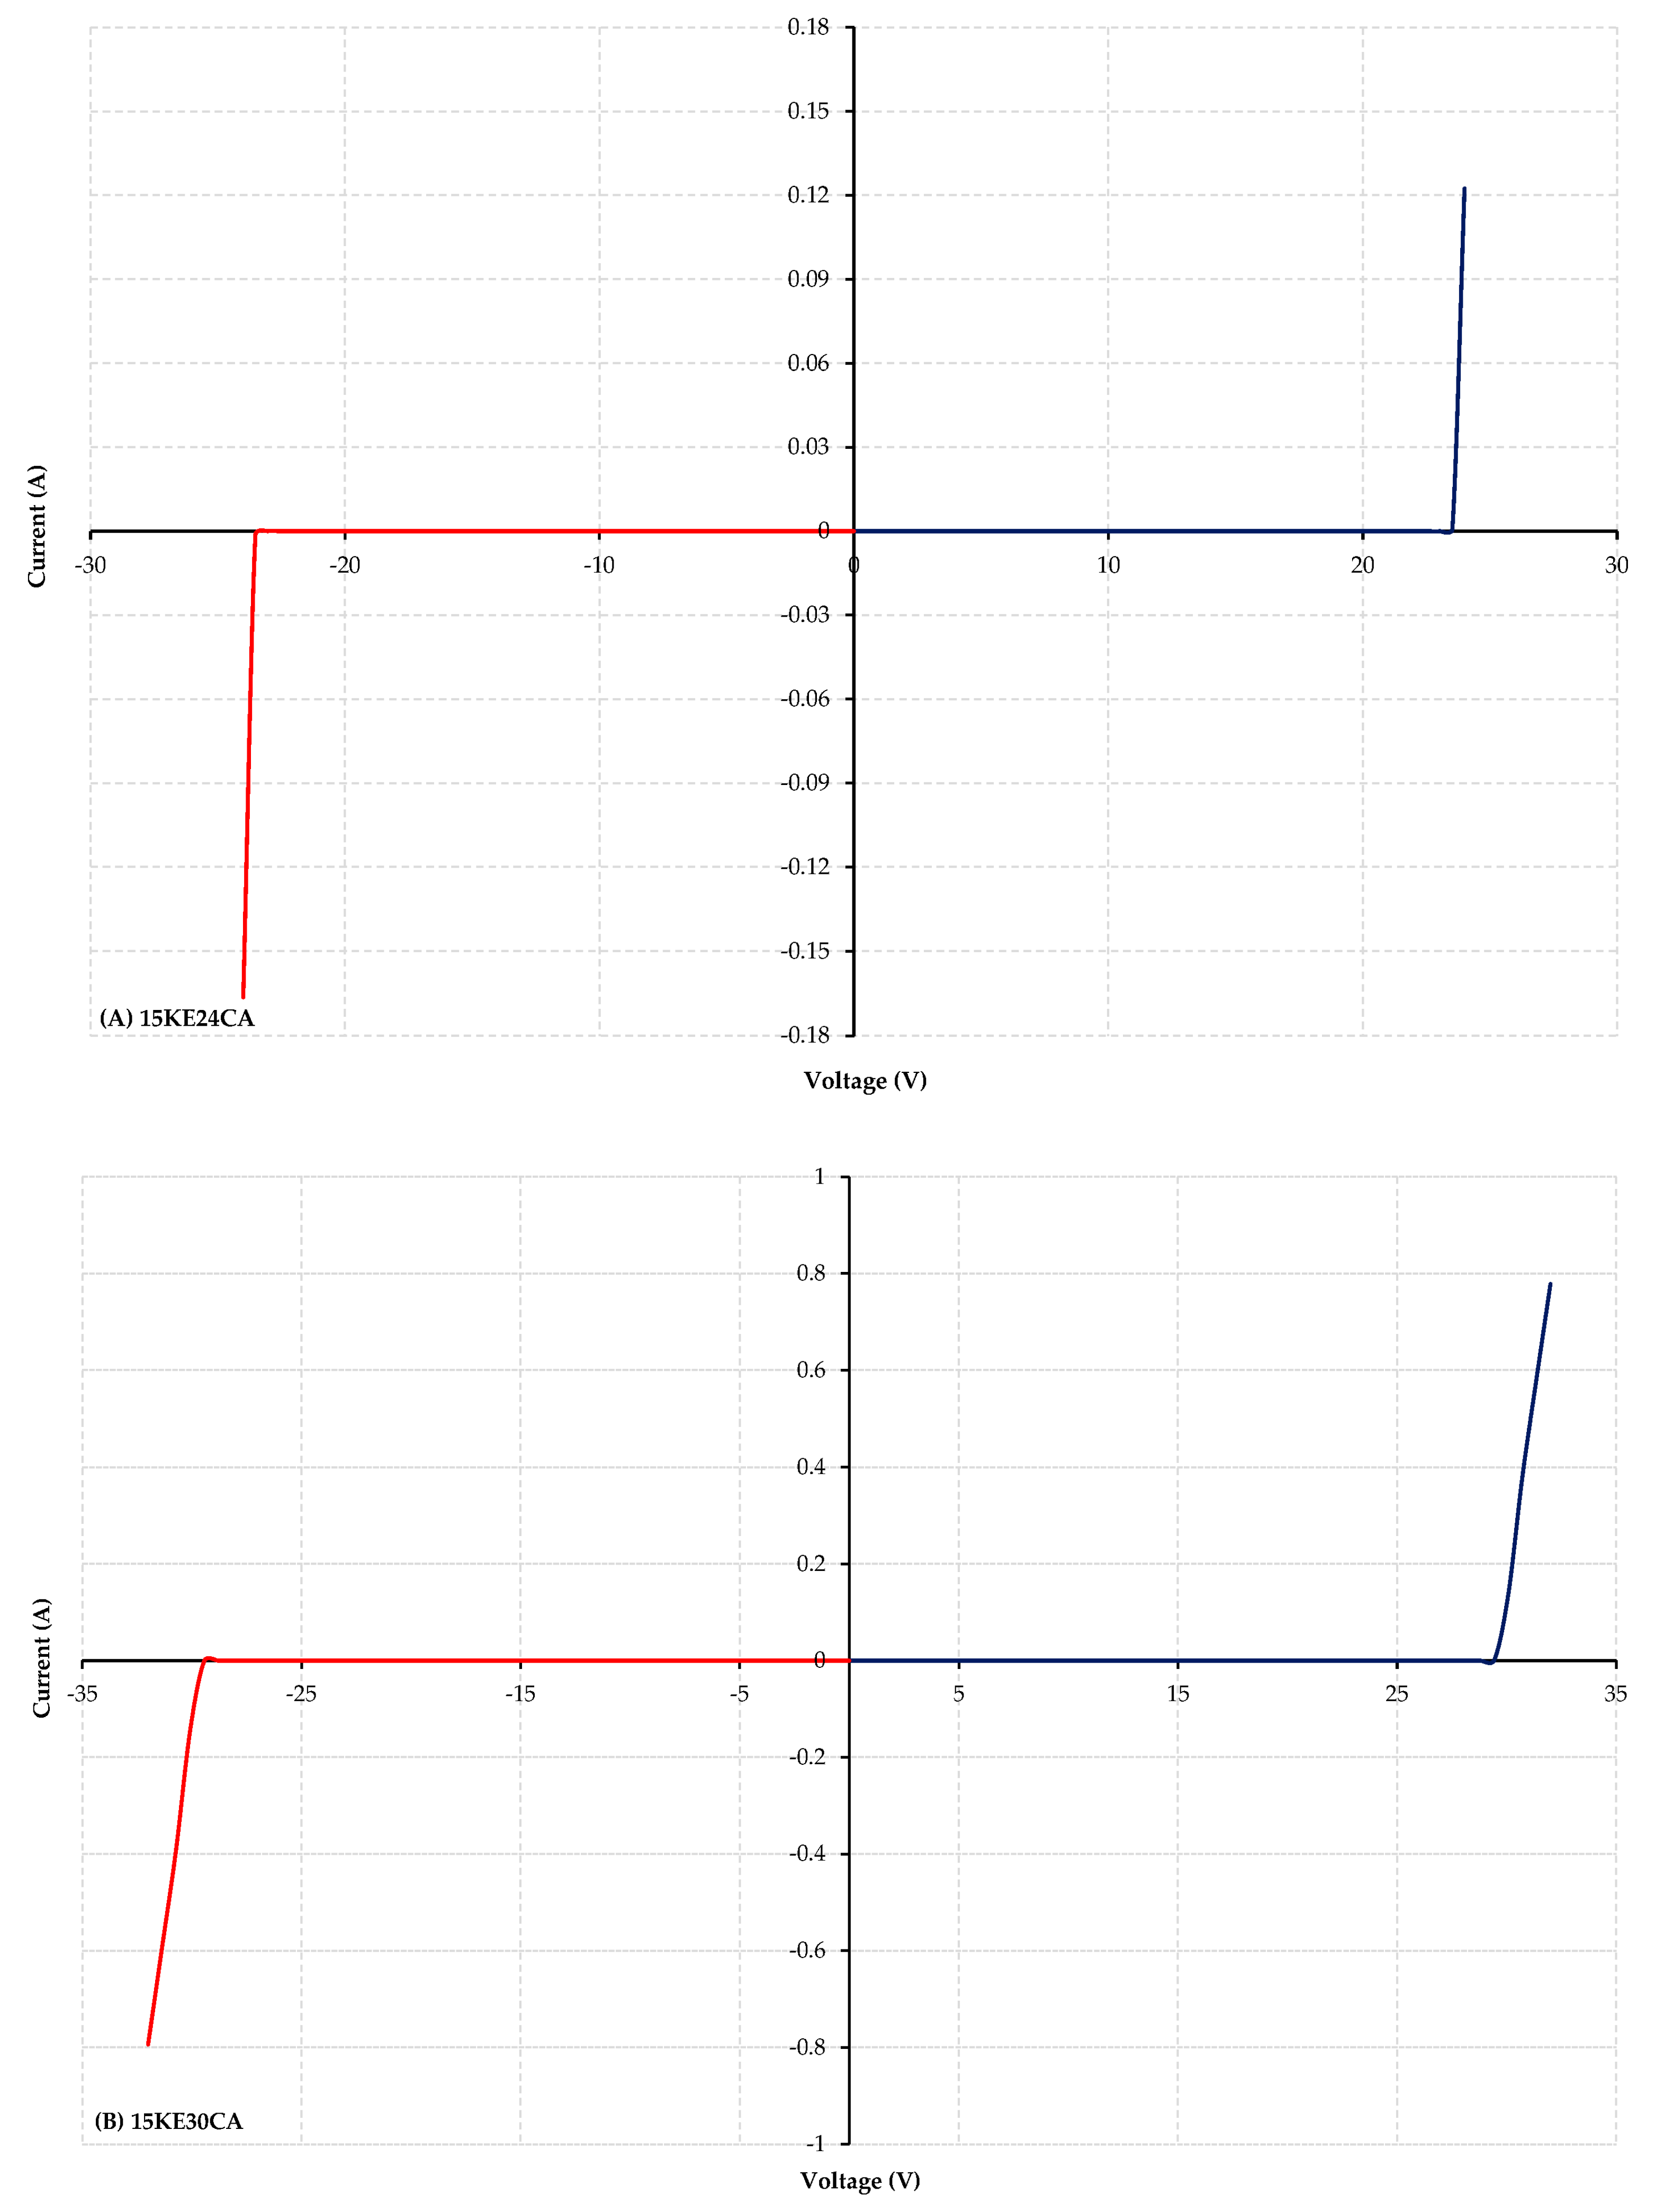
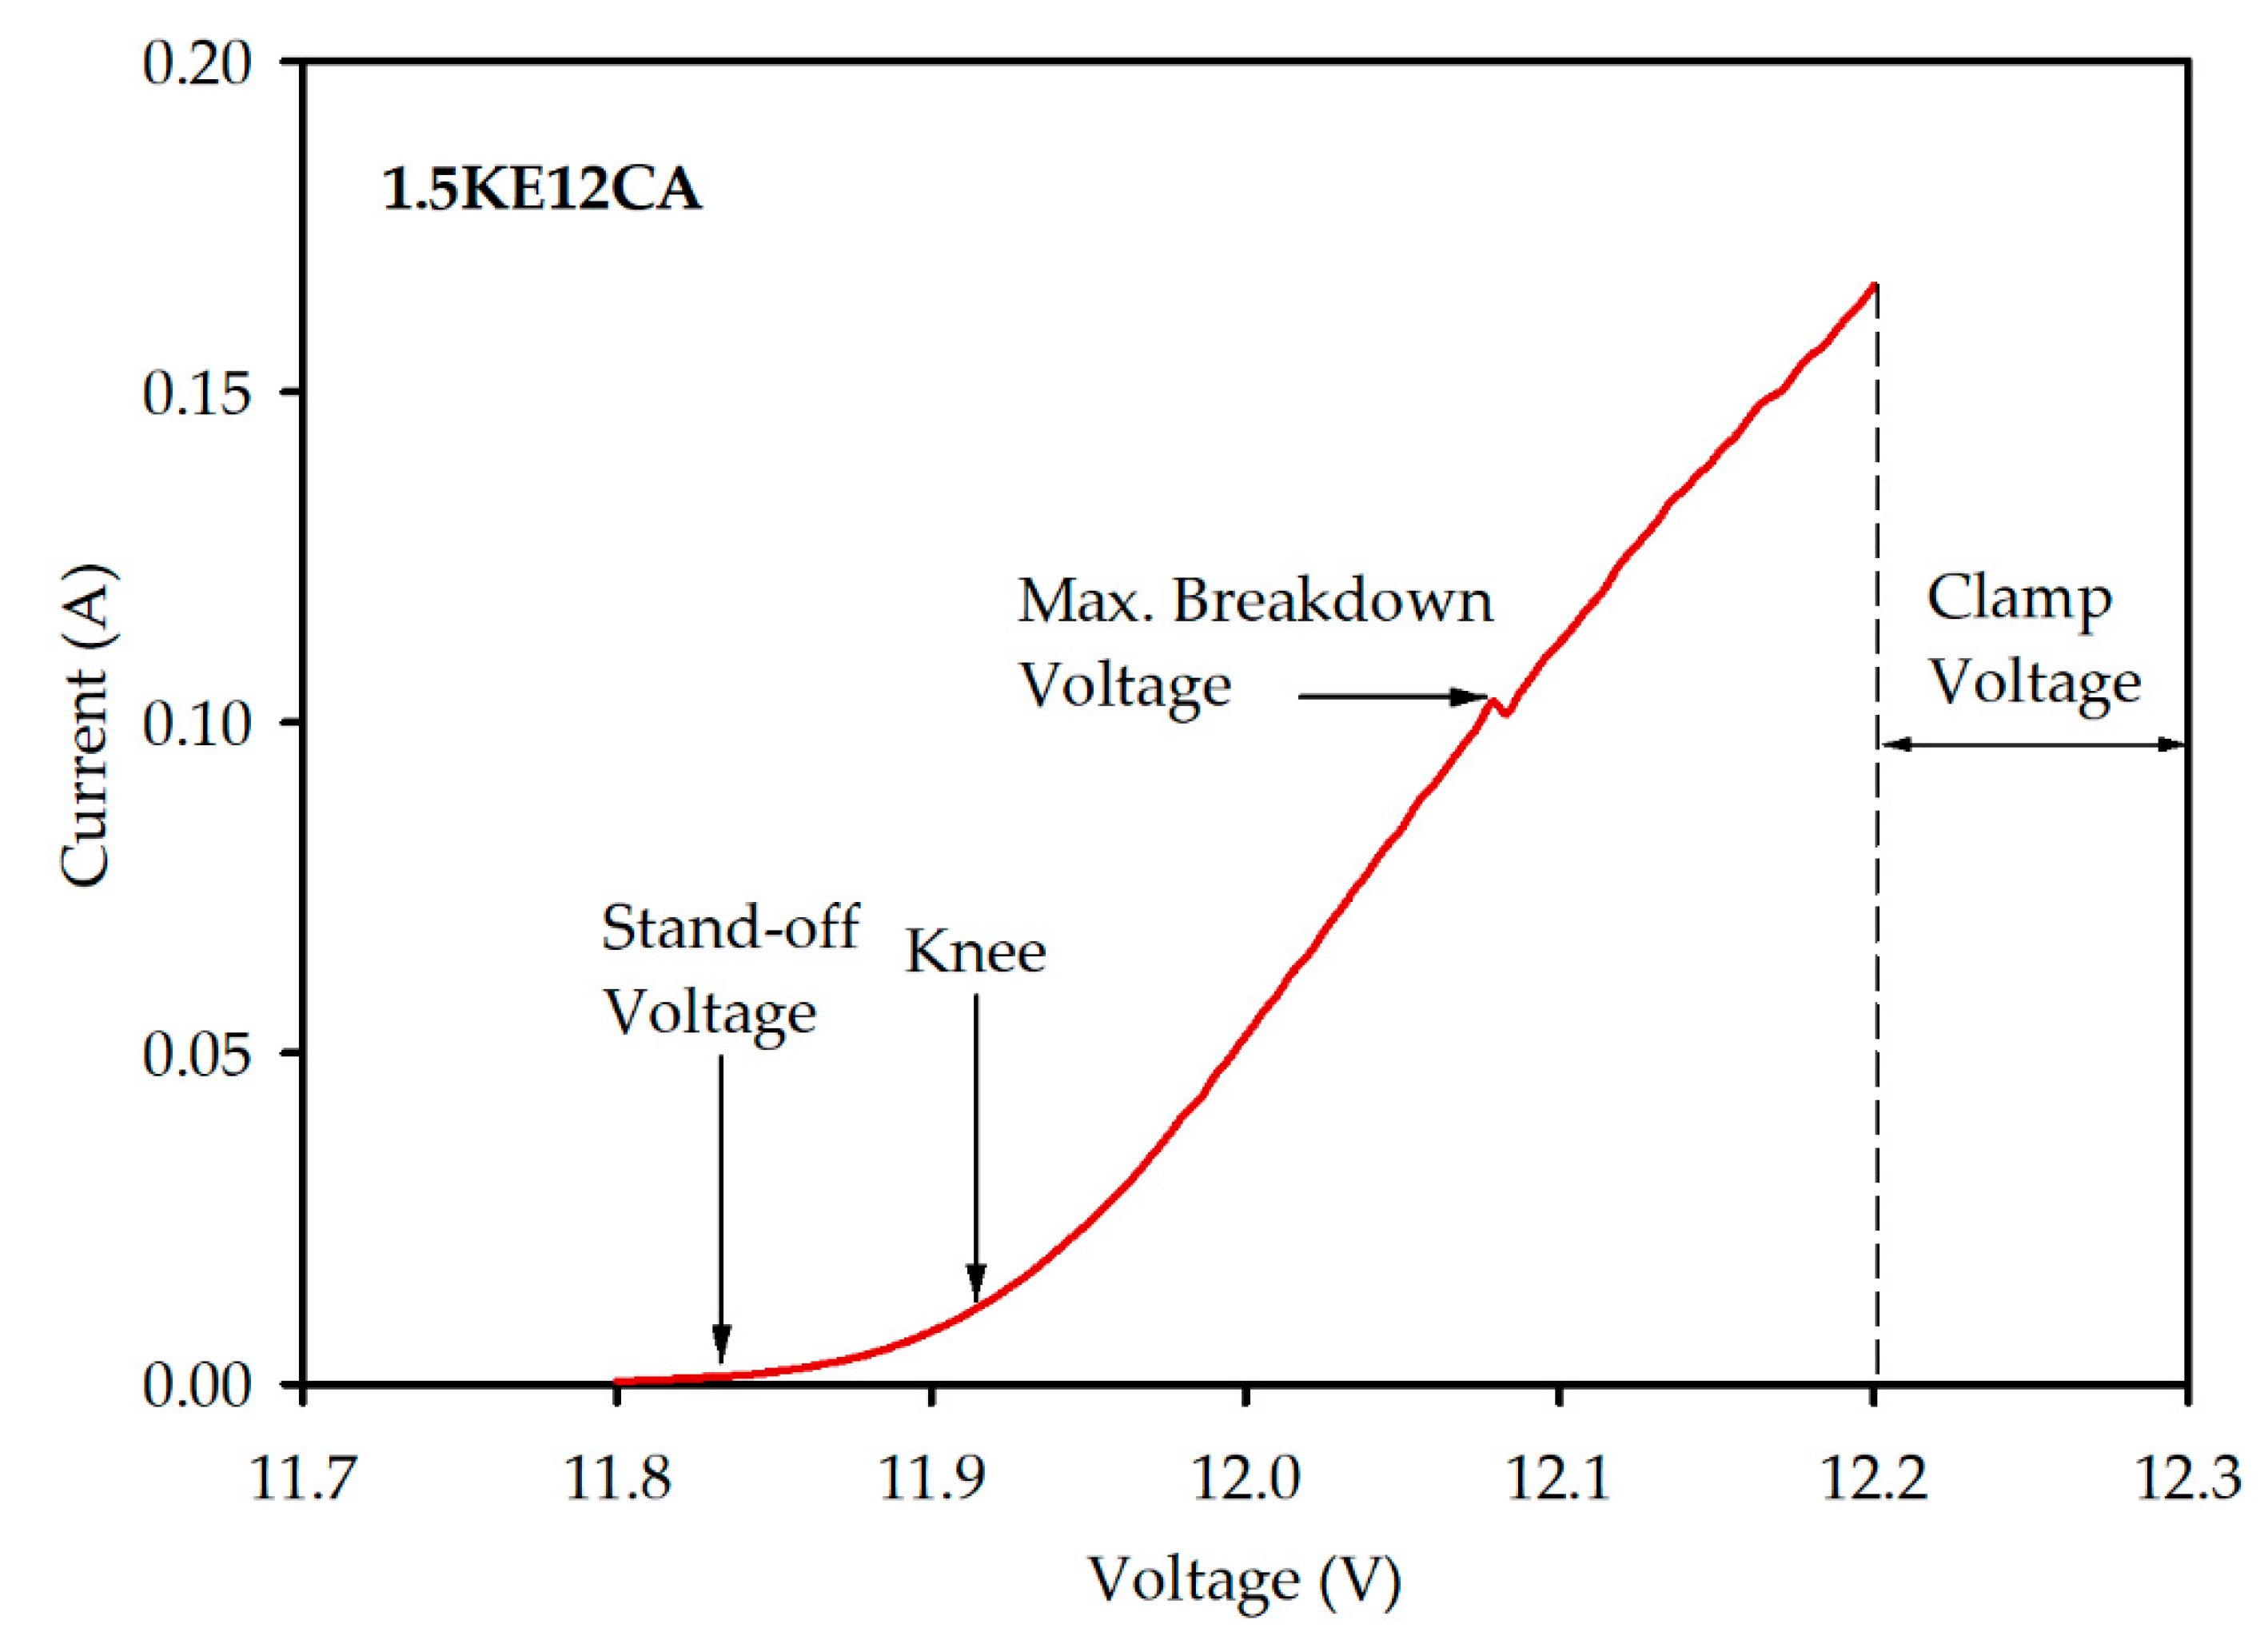
2.2.3. Transient Voltage Suppressors

Transient voltages impose stress on electronic equipment, which can cause permanent damage if the breakdown voltage of the component is exceeded [15]. Since transient voltage suppressors (TVSs) are capable of handling electrical over-stress, as seen in [16,17], bi-directional TVSs from ST Microelectronics were used to protect the PLC from transient voltage when starting the solar simulator. The XBO 5000 W/H OFR Xenon lamp light source in the solar simulator requires about 36 kV from the ignitor to ignite the xenon gas in the lamp. The 1.5KE24CA and 1.5KE30CA TVSs, selected from the datasheet provided by the manufacturer, were used on the 12 V and 24 V DC power supplies, is shown in Figure 2.
A Keithley 2400 source meter made by Tektronix purchased in Johannesburg, South Africa. The source meter linked to a Keithley 4200 semiconductor characterisation system was used to obtain the characteristic current and voltage (I–V) curve of the TVS in Figure 2, and is presented in Figure 3.
The TVS ratings selected for both power supplies were slightly above the stand-off voltage [18]. This is to prevent the TVSs from clamping [19] at the nominal voltage of the power supplies. A close look at the various points of the 1.5KE12CA TVS, used for demonstration purposes in the forward bias, is shown in Figure 4.
Once the maximum breakdown voltage is exceeded, as shown in Figure 4, the selected TVS used in the ADAS clamps the voltage as a way of protecting the electronics.

2.2.4. Programmable Logic Control and Thermocouple Input Modules

The programmable logic control unit (PLC), the digital/analogue input and output module (DAIO), and a PM8TCISO thermocouple input module with eight inputs, which are fully isolated, were used in this design, and offer input and output solutions [20]. The DAIO module is connected to the PLC through a bus. This high-speed communication bus allows the PLC to communicate with the DAIO module. The PLC, besides being able to communicate with the DAIO, also provides power to the input/output (I/O) module. The bus is connected to the Ethernet port of the CPU module as well as an RS232 port on the module. Connecting the PLC to a personal computer can be achieved through the Ethernet or RS232 port on the module. The PM8TCISO module allows the irradiance from the reference cell to be read, through its calibrated sensitivity of 95.7 mV at 1000 Wm−2. The thermocouple input module permits us to read between 0 and 100 mV linear input signal. Furthermore, the 4-wire PT1000 RTD on the reference cell connected to ports 1a, 1b and c, as shown in Figure 1 and Figure 5, reads the irradiance and temperature on the reference cell.

2.2.5. Relays and Transistors

Relays are often linked to electrical lines and equipment [20]. The relays used have a freewheeling diode, while the transistor in the digital/analogue input and output (DAIO) module switches the relay on or off through the PL101. The relay provides electrical isolation between the measuring units and the PC.

2.3. Autonomous Dynamic Adaptability System (ADAS)

The control unit in Figure 5 operates in auto mode only. The logic for running the solar simulator in auto mode is written on the PLC module. This device controls the intensity of the light source via the SCADA. Furthermore, the logic allows the PLC to regulate the irradiance as desired by the user.
In auto mode, the PL101 starts the solar simulator through the relays. The relays also receive a “run” signal from the Xe-lamp’s PSU. The system was protected using a metal oxide varistor (MOV), miniature circuit breaker (MCB) and bi-directional transient voltage suppressors (TVSs), as shown in Figure 5. The power supply units (PSU) power the PL101 and the relays. The starting and stopping of the Xenon lamp solar simulator and the regulation of the irradiance are achieved via the TCP/IP communication port on the PL101. The electrical layout of the ADAS can be found in the Supplementary Materials whilethe flow of the program used for the regulation process is shown in Figure 6.

2.4. Experimental Procedure

To operate the solar simulator at any desired irradiance set point, such set points must be made on the SCADA. The ADAS starts the solar simulator, and achieves and maintains the desired set point supplied by the SCADA, which triggers the logging of the irradiance, cell surface temperature, solar simulator input current and voltage and lamp power. The autonomous dynamic adaptability algorithm, which describes how the PLC achieves and maintains the set point, is presented in Figure 6.
Switching the lamp from the OFF position to auto mode, the lamp remains off until it receives a start signal from the SCADA. Once it gets a start signal, the user has to choose between operating the simulator in either constant current or constant irradiance mode. The simulator cannot be run in both modes at the same time. If the constant current mode selection from the SCADA is chosen, the lamp starts and runs at a constant current. The lamp’s input voltage and current are measured and stored; afterwards, the lamp’s power is calculated and stored. The reference cell’s irradiance and surface temperature are measured and stored. Once these steps have been achieved, the PLC triggers the logging schedule on the SCADA.
If the user decides to run the lamp in constant irradiance mode from the SCADA, the igniter starts the lamp and runs at the constant irradiance set point provided by the user. If the actual irradiance is not within the 20% margin of the irradiance set point, the PLC rapidly increments or decrements the lamp’s current, until the actual irradiance is within 20% of the irradiance set point. If the actual irradiance is within the 20% margin of the irradiance set point, the PLC slowly increments or decrements the lamps current until the actual irradiance is within 1% of the irradiance set point. Afterwards, the lamp’s input voltage and current are measured and stored. The lamp’s power is also calculated and stored. The reference cell’s irradiance and surface temperature are measured and stored. Once these steps have been achieved, the PLC triggers the logging schedule on the SCADA.

3. Results

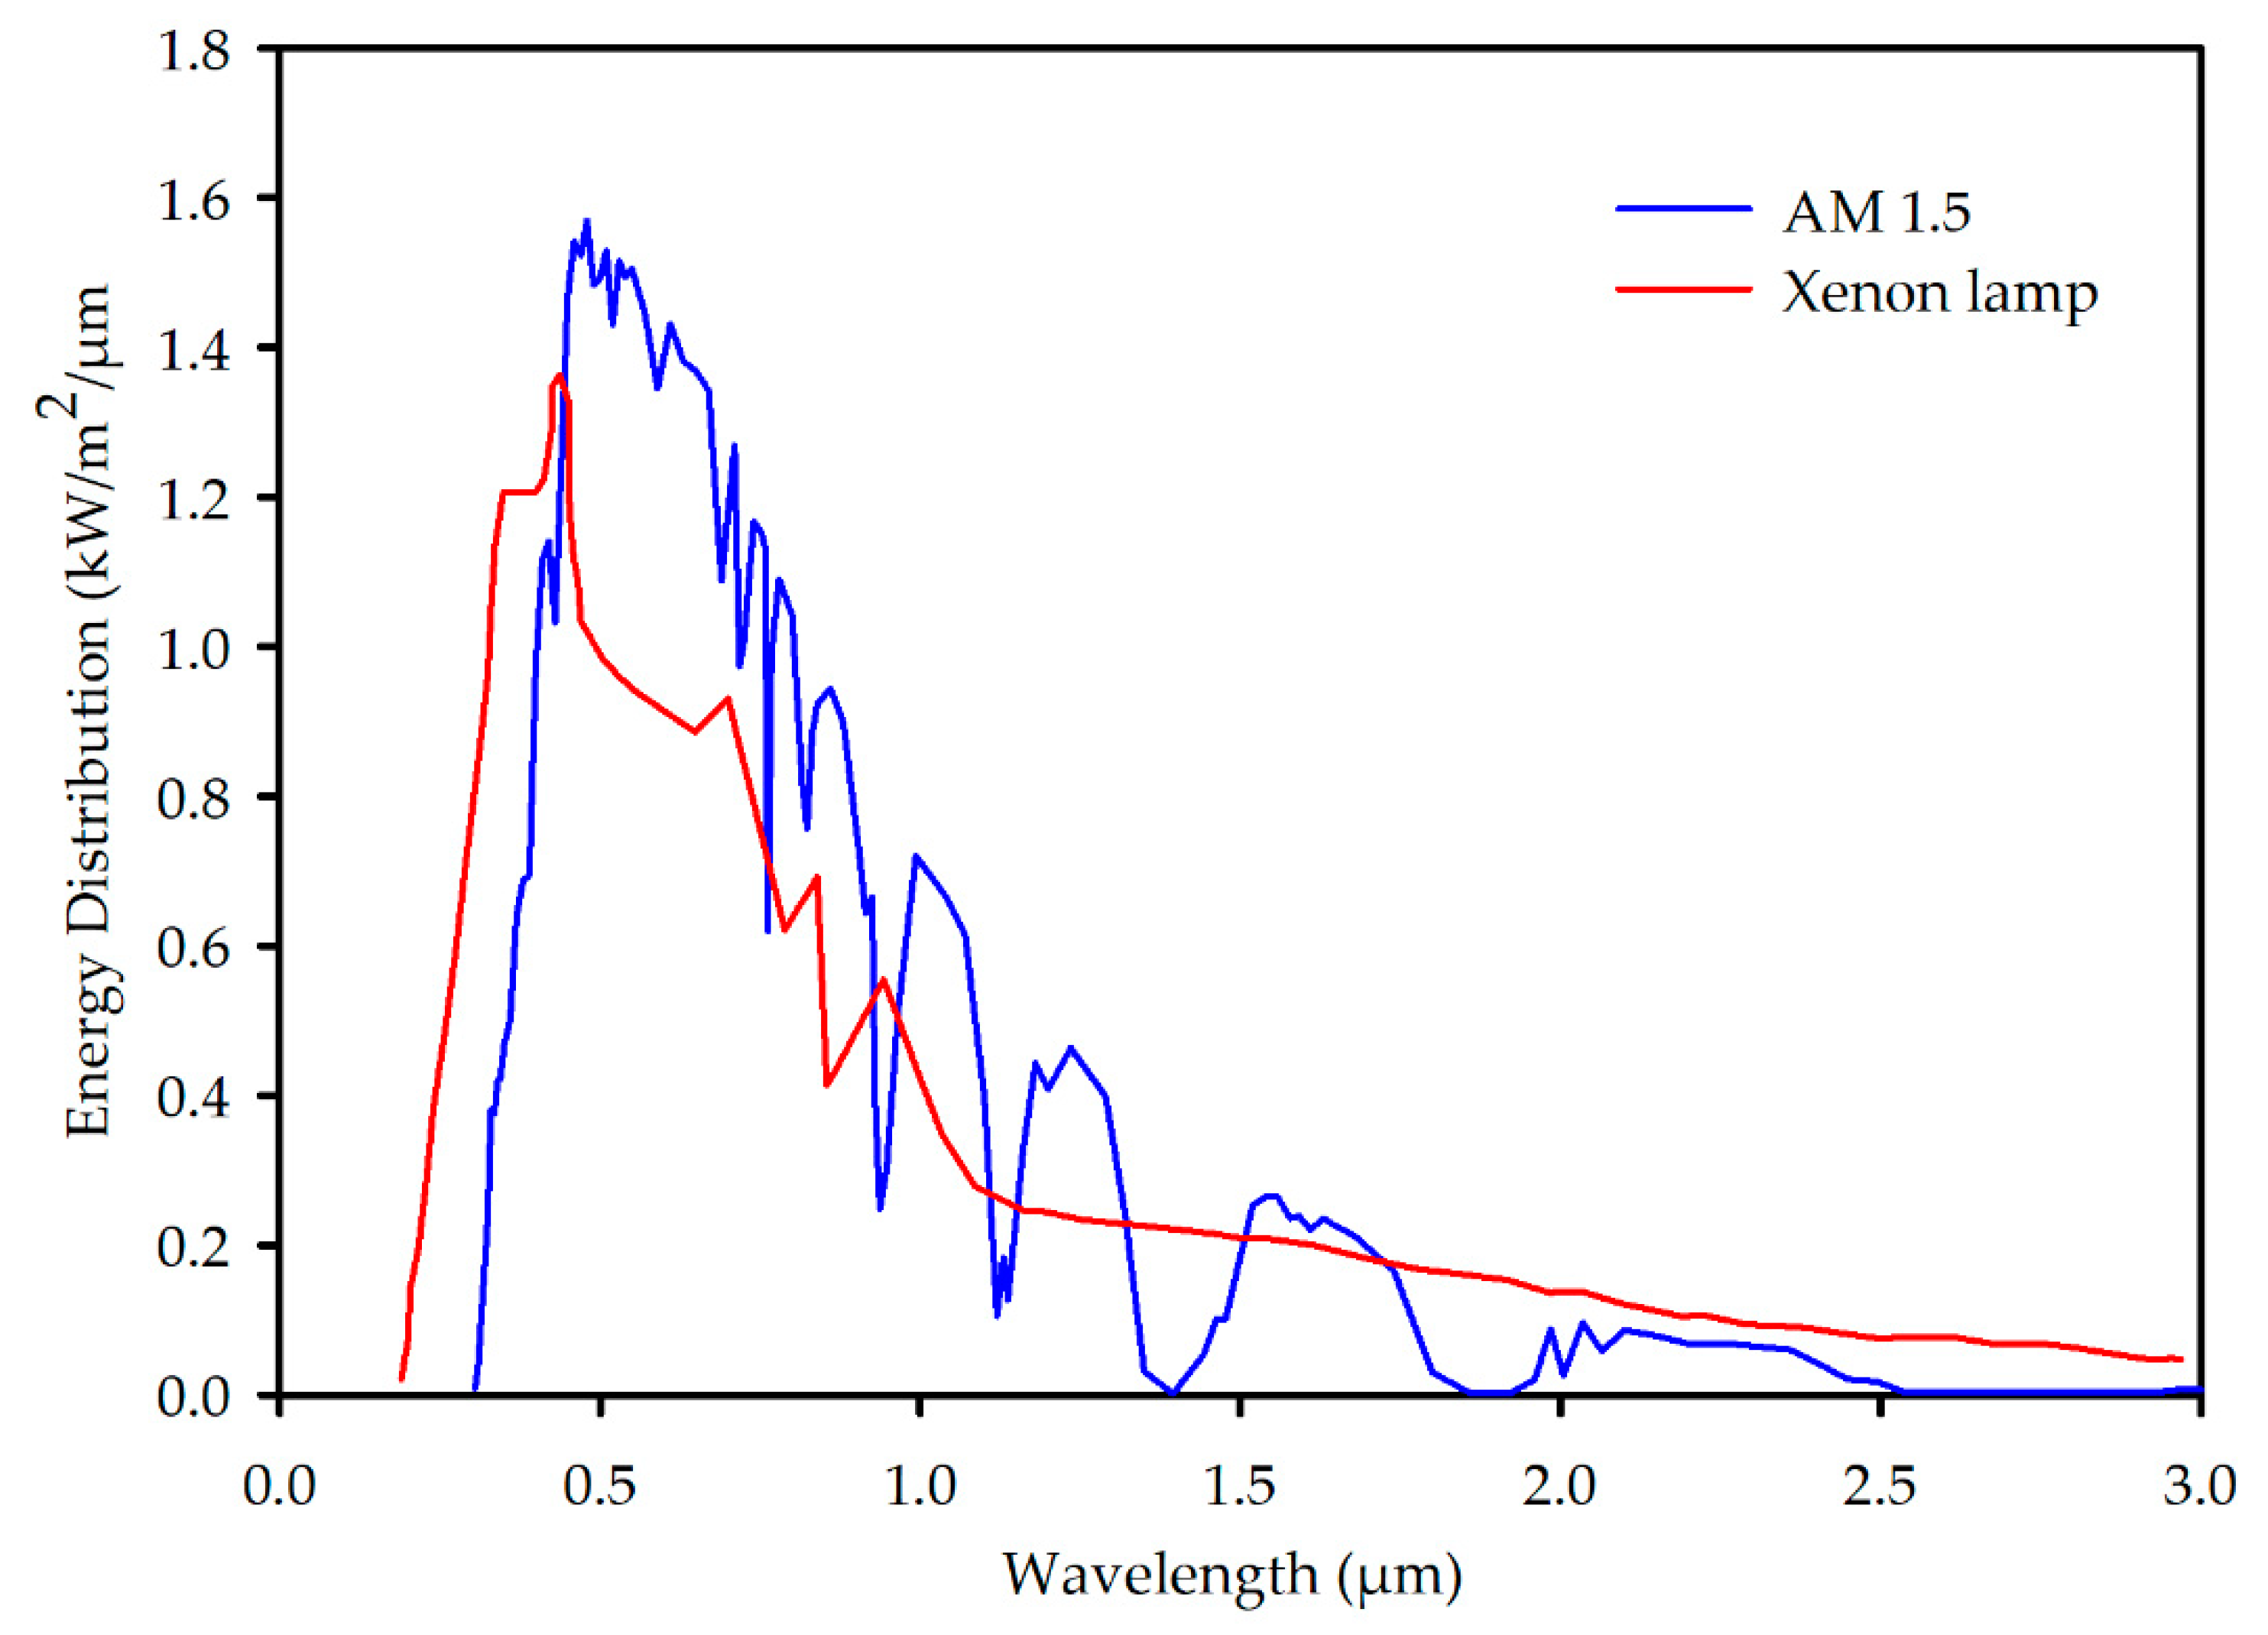
3.1. Solar Simulator Startup and Lamp Spectrum

The igniter uses a very high voltage to ignite the Xenon gas encased in the Xenon arc lamp of the solar simulator. To ensure the ignition of the Xenon gas in the lamp, the simulator runs at 20% of its rated current. The lamp’s irradiance and the input power of the solar simulator is measured by the PLC, and stored in the SCADA. The measurement made for 180 s is shown in Figure 7.
A percentage difference in power of less than ±1% was obtained while running at 20% of the simulator’s rated current. The corresponding irradiance percentage difference is ±1.5%. The light source (xenon arc lamp) used to simulate sunlight was compared with the sun’s spectrum, and is presented in Figure 8.
Figure 8 clearly shows how closely matched the xenon arc lamp is when compared to the sun’s spectrum in the visible light region (400–700 µm). This makes the xenon arc lamp suitable for use as a light source for solar simulators [21]. Studies by [22,23] demonstrate the application of the solar simulator in the indoor characterisation of solar cells.

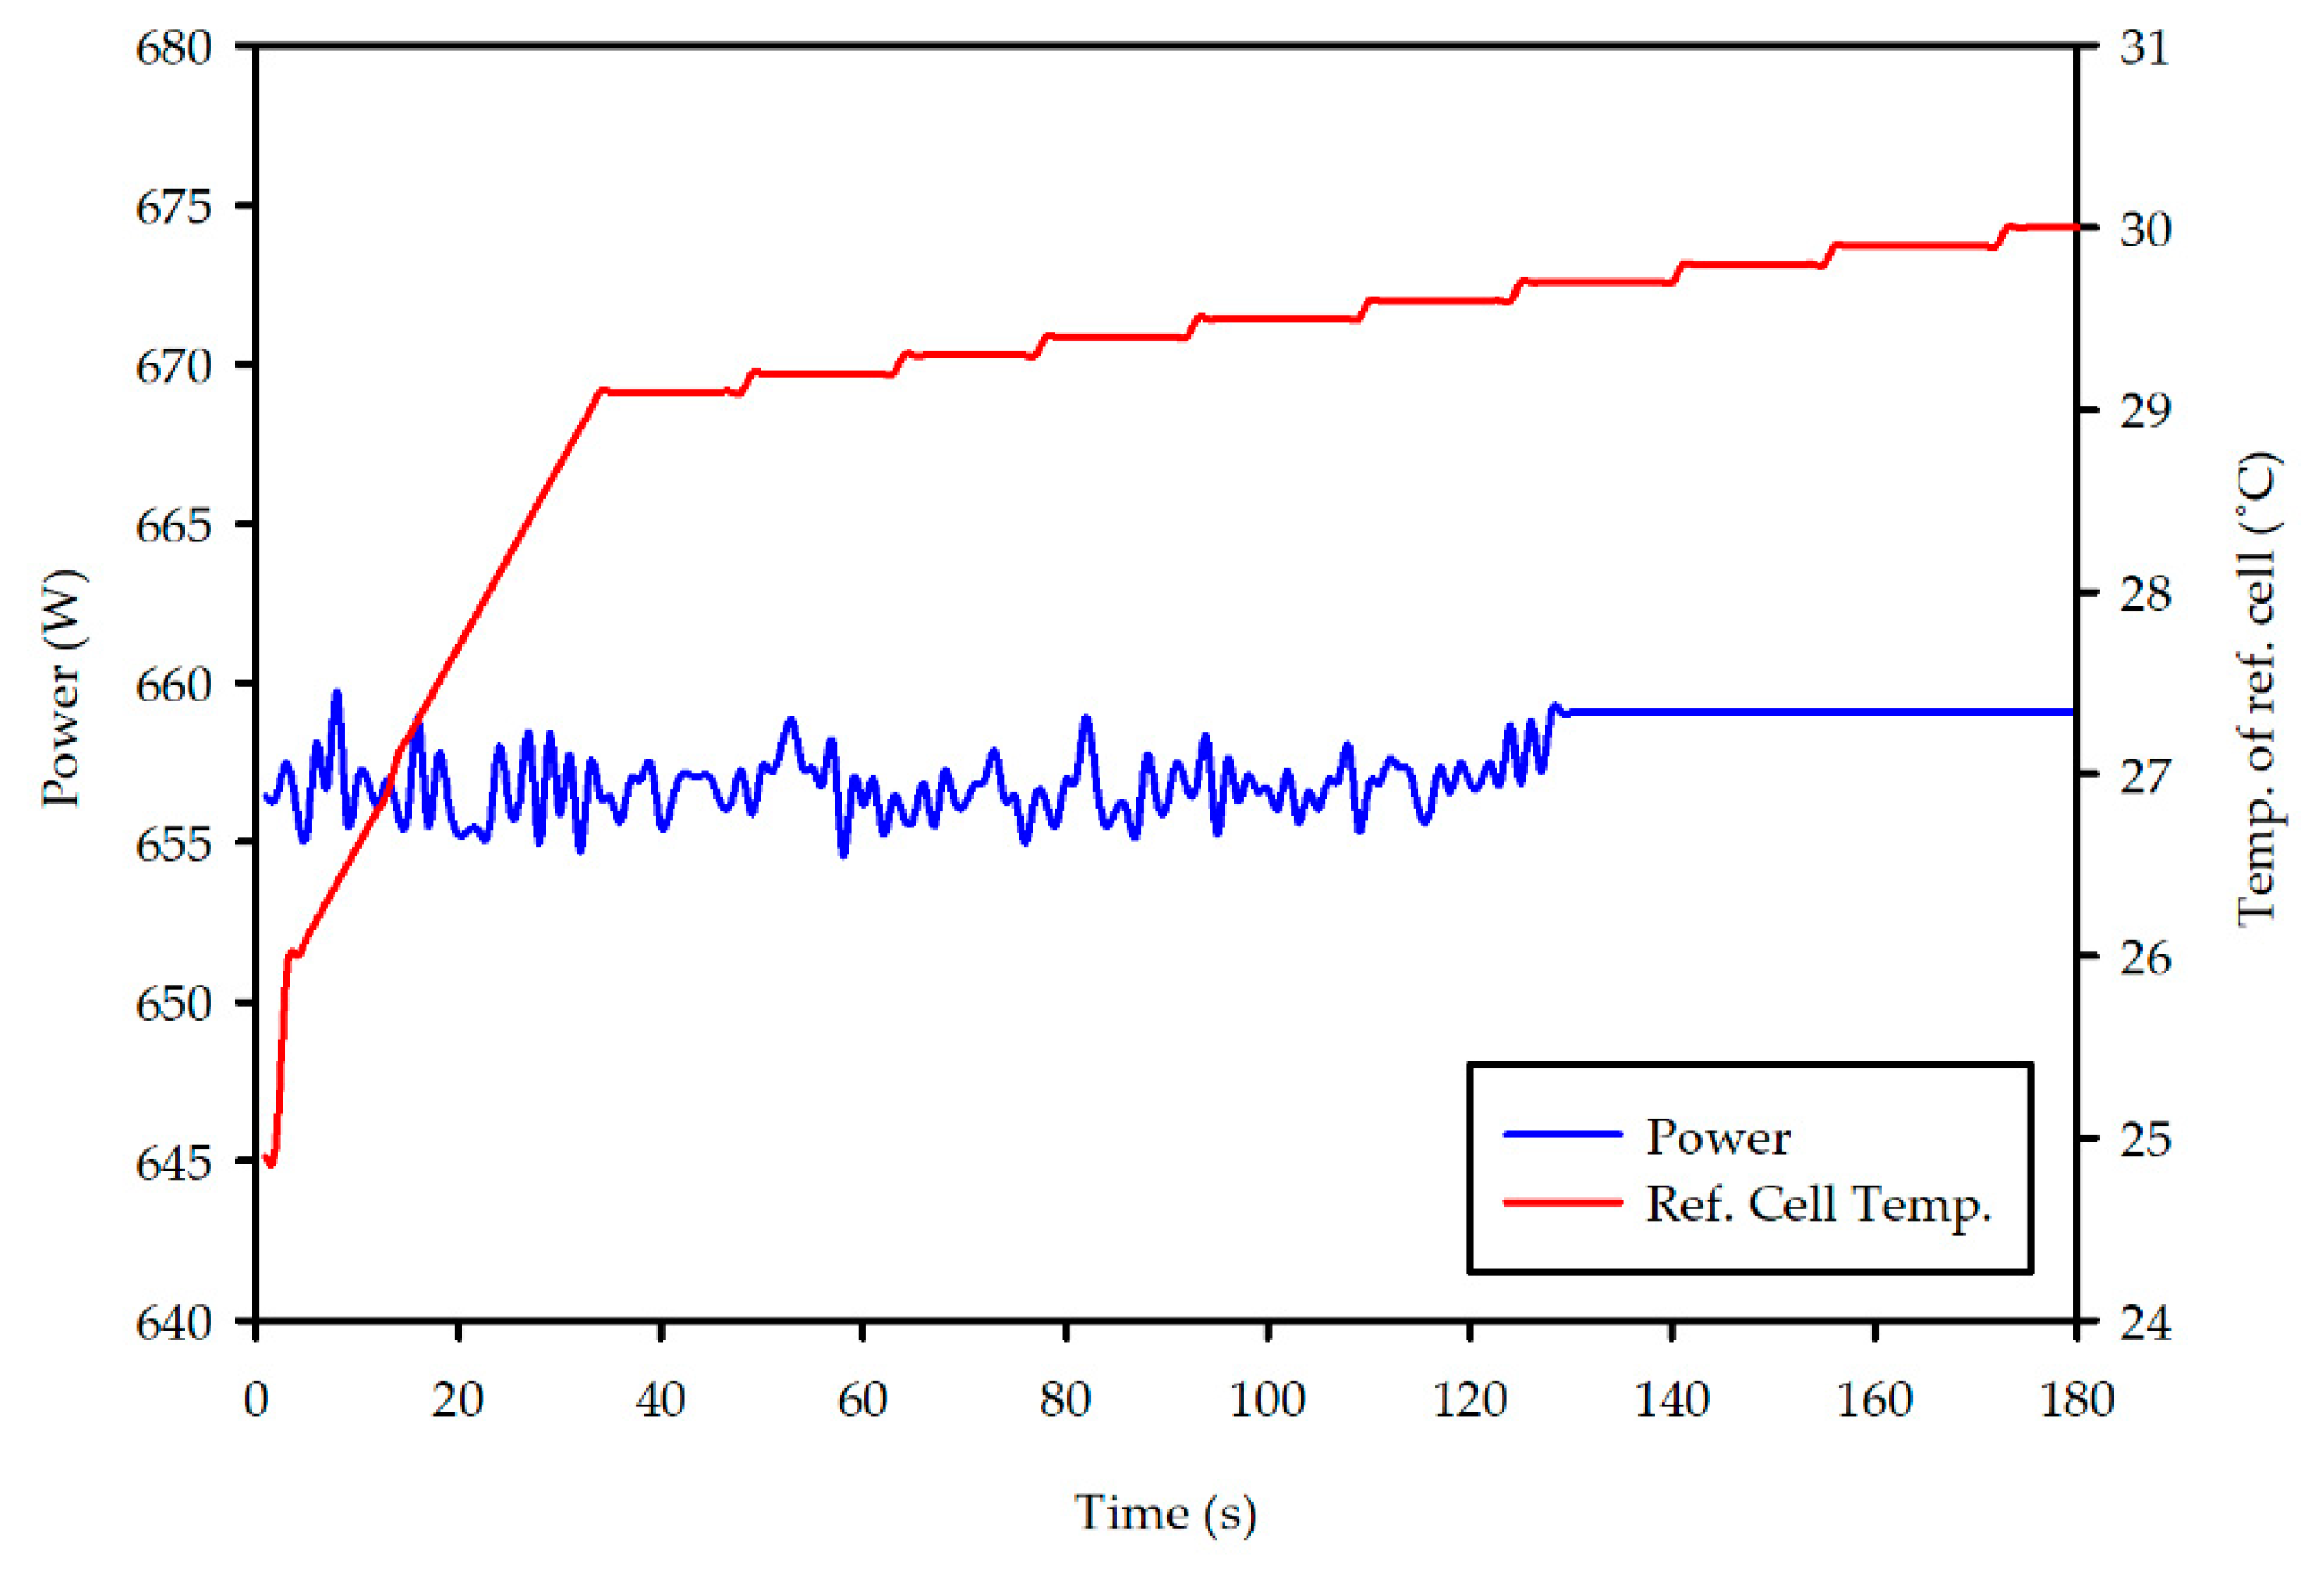
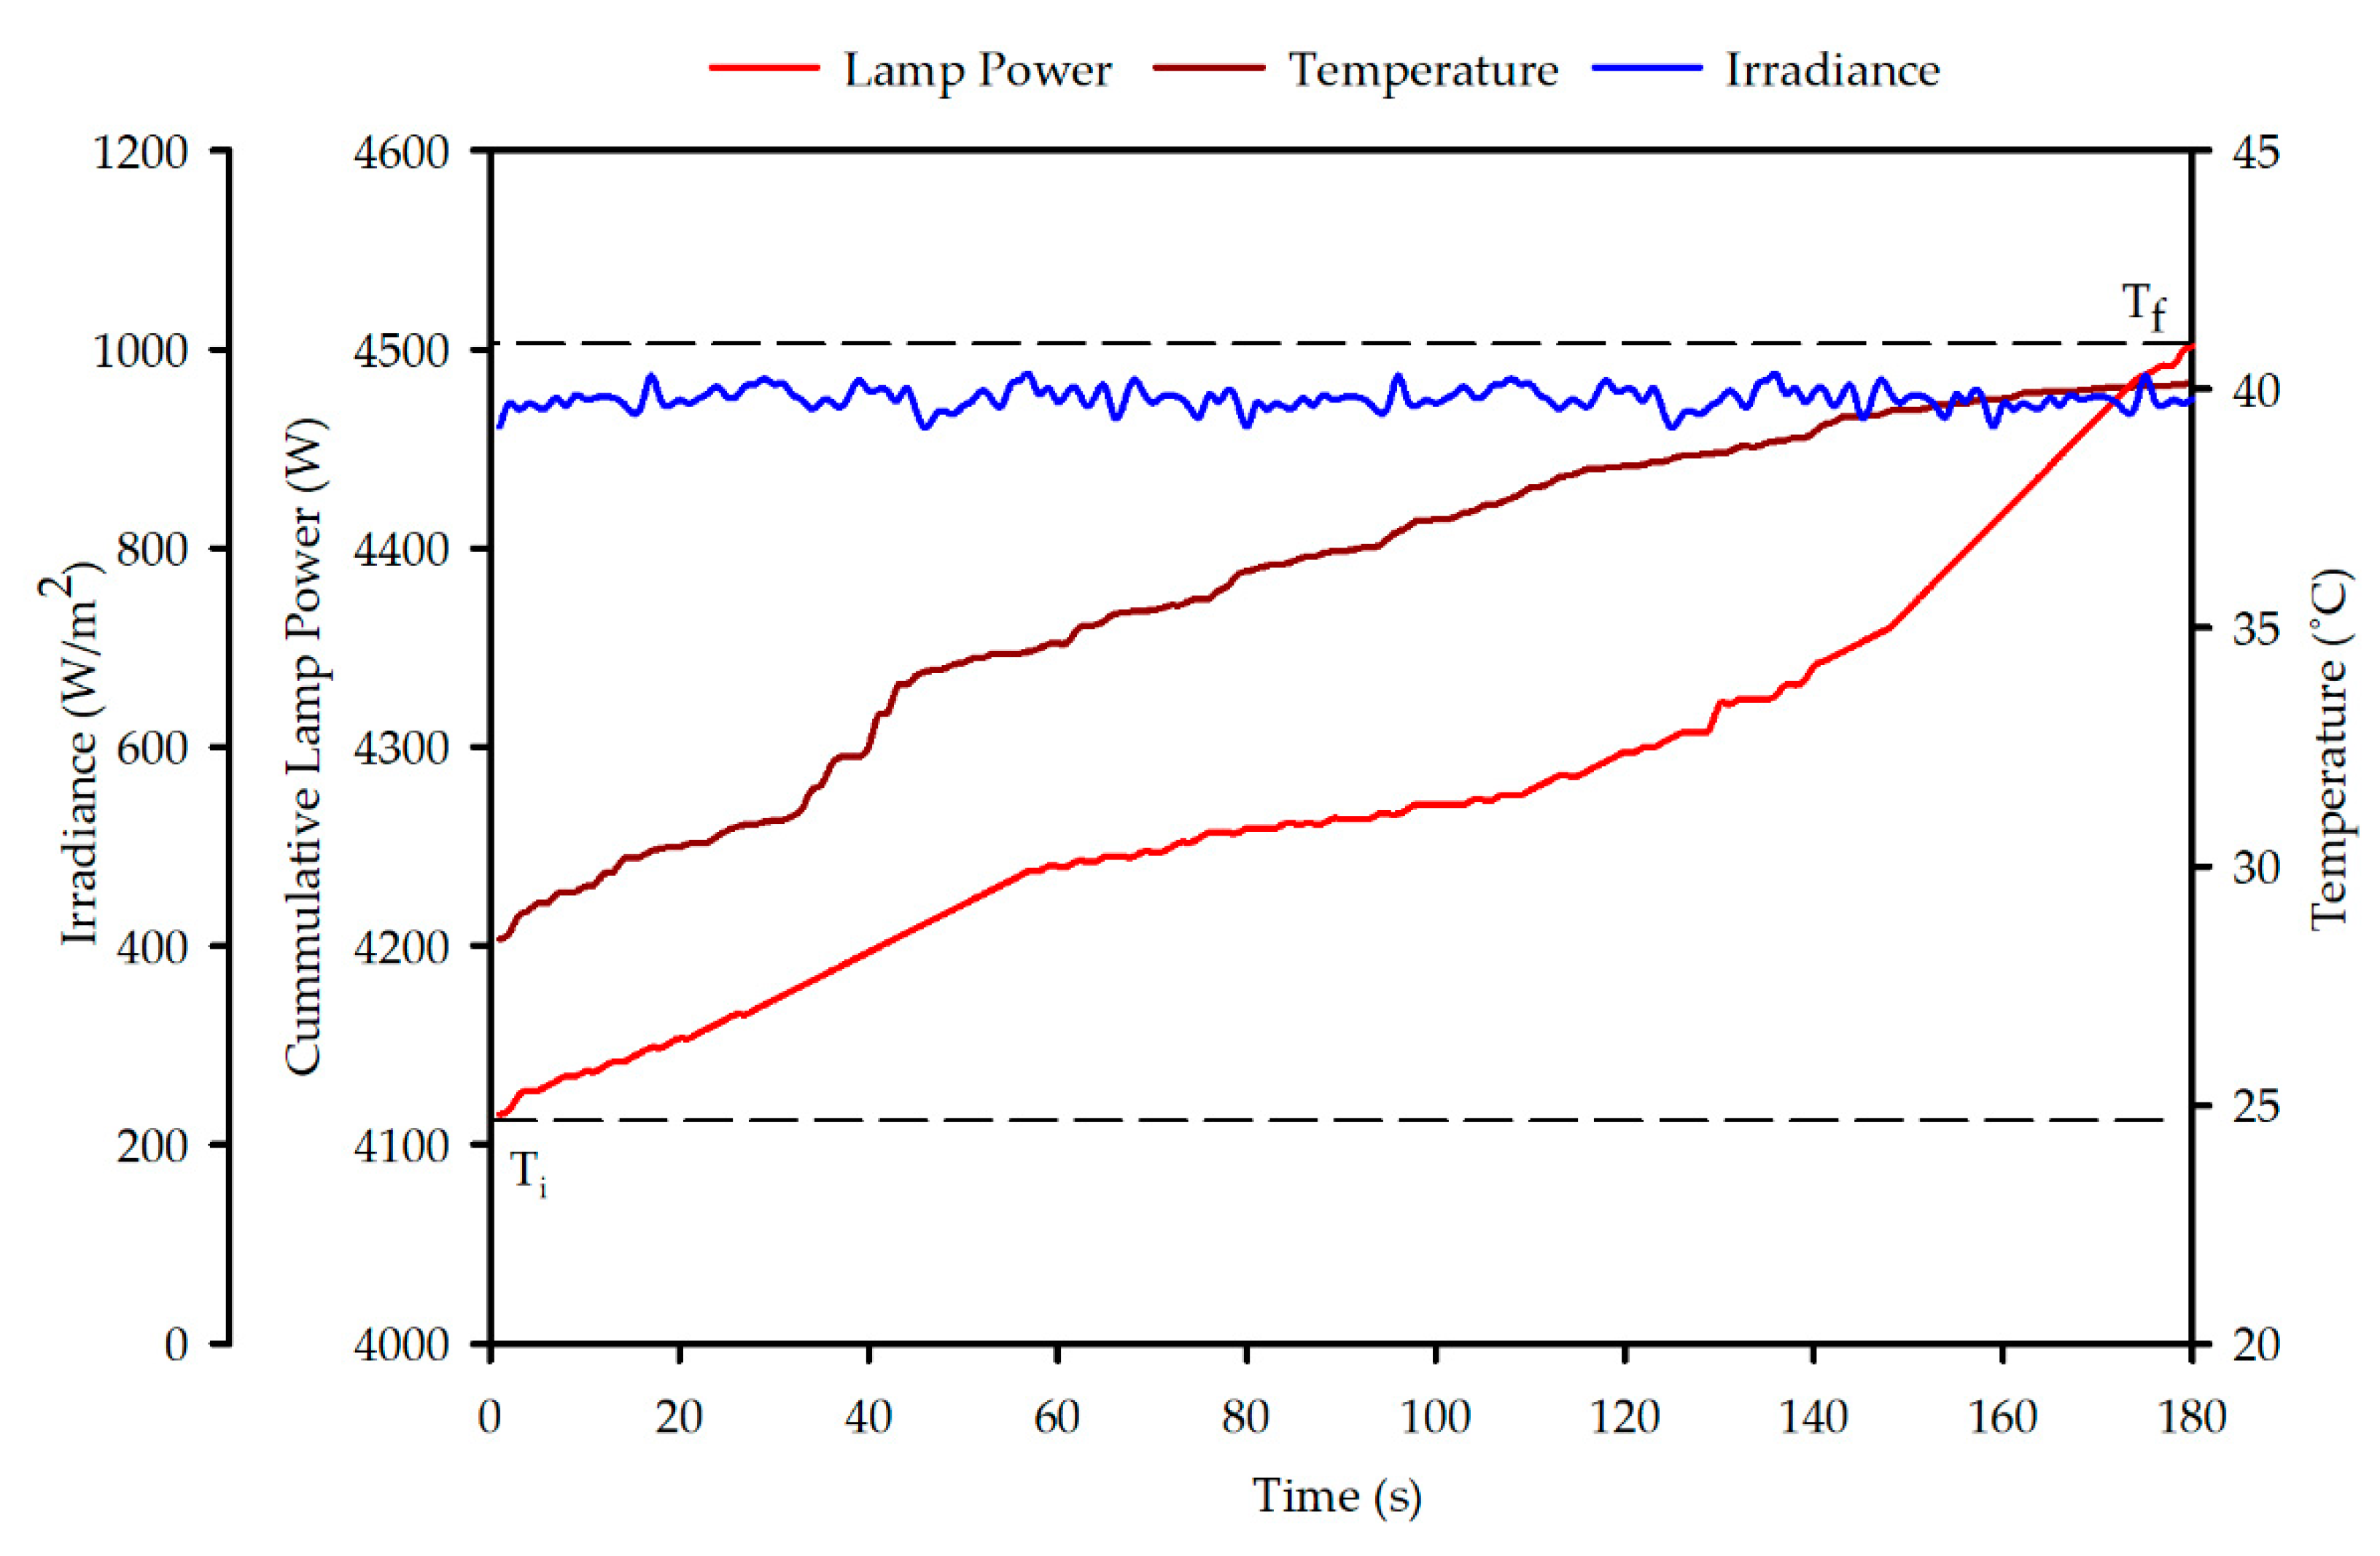
3.2. Varying Lamp Input Power and Temperature

The solar simulator was operated at 20%, 50% and at 90% of its rated current. Running the simulator often results in the generation of heat due to the nature of the light source used. The response of the crystalline silicon (c-Si) reference cell under test for over a minute, with its corresponding irradiance, irradiance percentage difference and cell surface temperature, are shown in Figure 9.
As the solar simulator is kept running for a longer period (180 s) in Figure 9, the silicon reference cell’s temperature increases beyond the recommended 25 °C for conducting experiments under standard test conditions (STC). The slight fluctuations in irradiance, as seen in region C of Figure 9, are higher than region A because the simulator is operating at a higher input power, in order to attain the set point of 1000 Wm−2. There is an increase in the percentage difference of the irradiance in region C, compared to that of areas A and B. The amount of electrical energy transferred as heat from the solar simulator onto the surface of the reference cell is shown in Figure 10.
The lamp’s input power in Figure 10 fluctuates due to a slight change in the lamp’s voltage. However, the lamp’s input power becomes stable after 120 s of operating the solar simulator. This is because the irradiance set point is reasonably maintained at a lower input power. Because temperature control is not part of the setup for the ADAS, the temperature of the reference cell continues to increase gradually until the solar simulator is switched off, or until thermal equilibrium is reached.
To determine the amount of energy required to remove the heat imparted onto the surface of the reference cell in Figure 10, Equation (1) is utilised to keep the cell temperature at 25 °C. It is assumed that the outdoor temperature does not significantly affect the ambient temperature while conducting the experiment.
Q = m c Δ T
where Q is the heat energy transferred (Joules), m is the mass of the silicon reference cell, c is the specific heat capacity of the silicon solar cell (joule per gram degrees Celsius), and ΔT is the change in temperature. The specific heat capacity for the silicon reference cell (710.08 J/kg K), if c is made the subject in Equation (1), is expressed as:
c = Q ( m    Δ T )
In order to determine the total energy imparted on the reference in Figure 11, and what quantity of heat must be expelled in order to maintain the cell temperature of 25 °C at 1000 Wm−2 for carrying out an indoor test on photovoltaic (PV) modules, as recommended by [8]. The total power generated by the solar simulator, total energy exerted by the solar simulator on the reference cell, and the total heat is given by Equations (3)–(5).
P t o t a l = G × A
where P t o t a l is the total power of the simulator (W), G is the irradiance (Wm−2), and A is the area of the reference cell (m2).
Also, the energy exerted on the reference cell by the solar simulator is expressed in Equation (4).
E t o t a l = P t o t a l × t
where E t o t a l is the total energy exerted on the reference cell (kJ), P t o t a l is the total power of the simulator (W), and t is time (s).
The total heat required to maintain a cell temperature of 25 °C at 1000 Wm−2 is represented by Equation (5).
Q = ρ A t c ( T f T i )
where Q is the total heat (kJ), ρ is the density of silicon g cm−3, A is the area of the reference cell (m2), t is the thickness of the reference cell, T f is final temperature (°C) and T i is the initial temperature (°C).

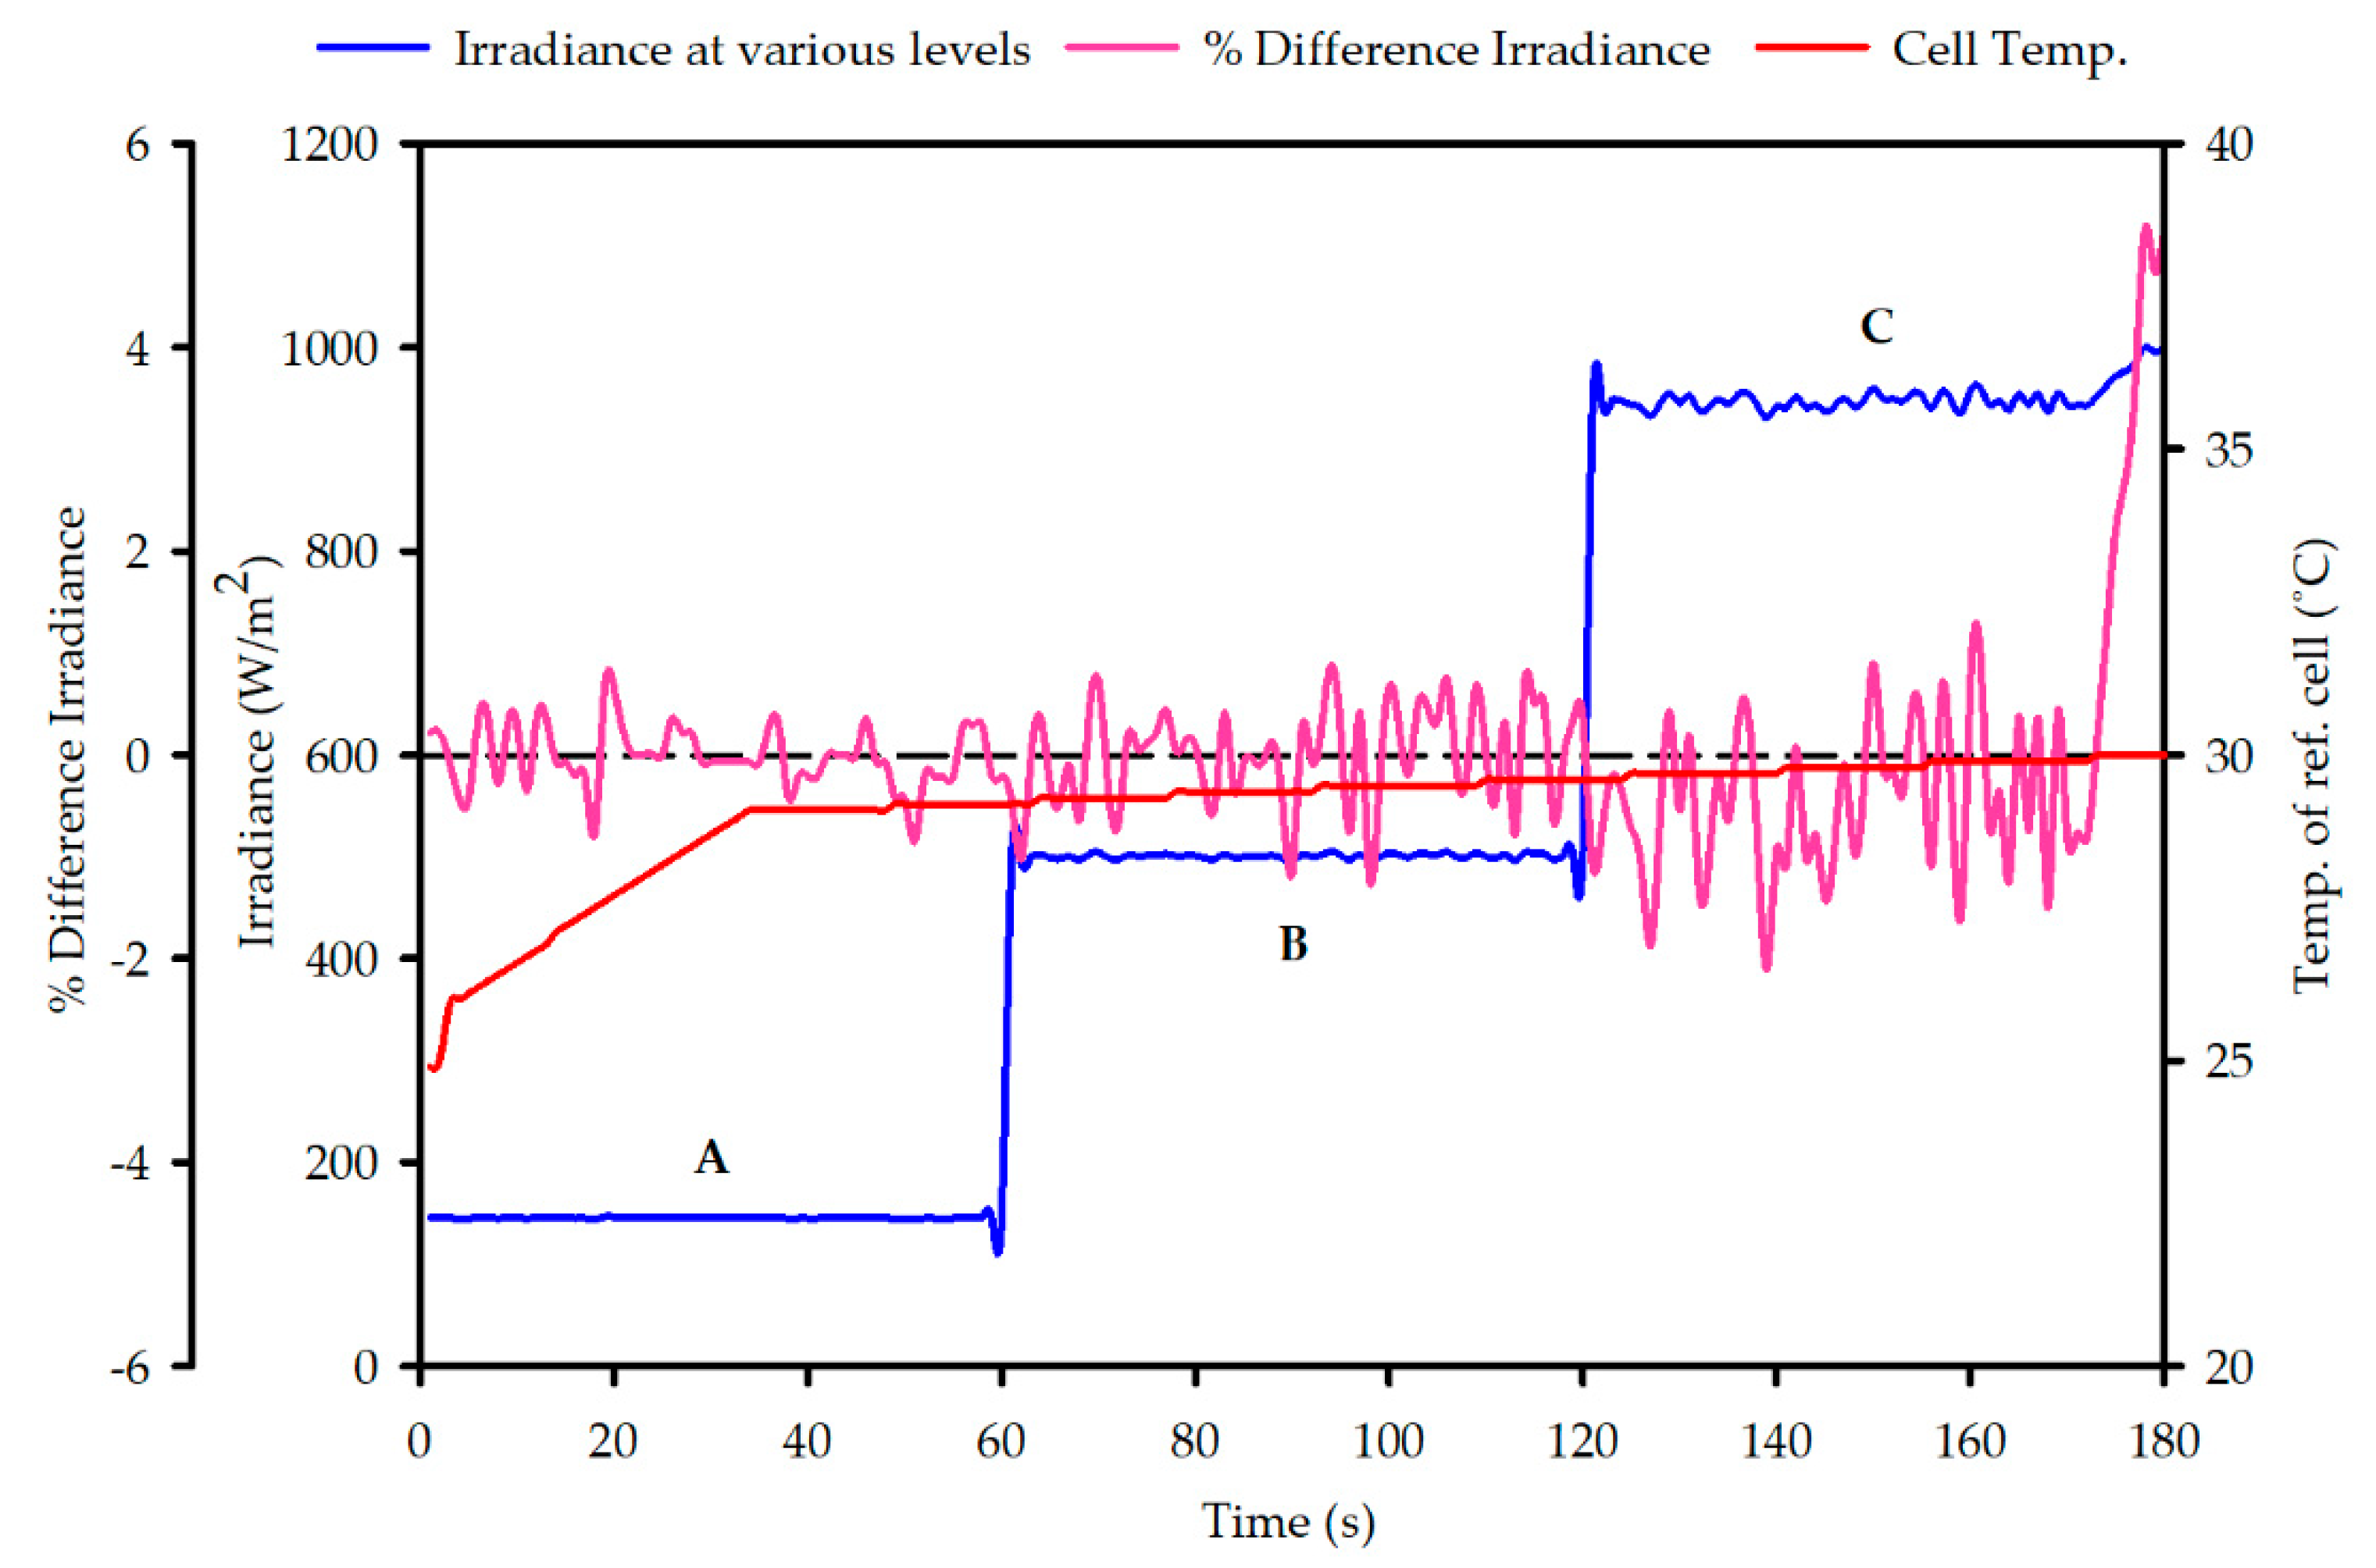
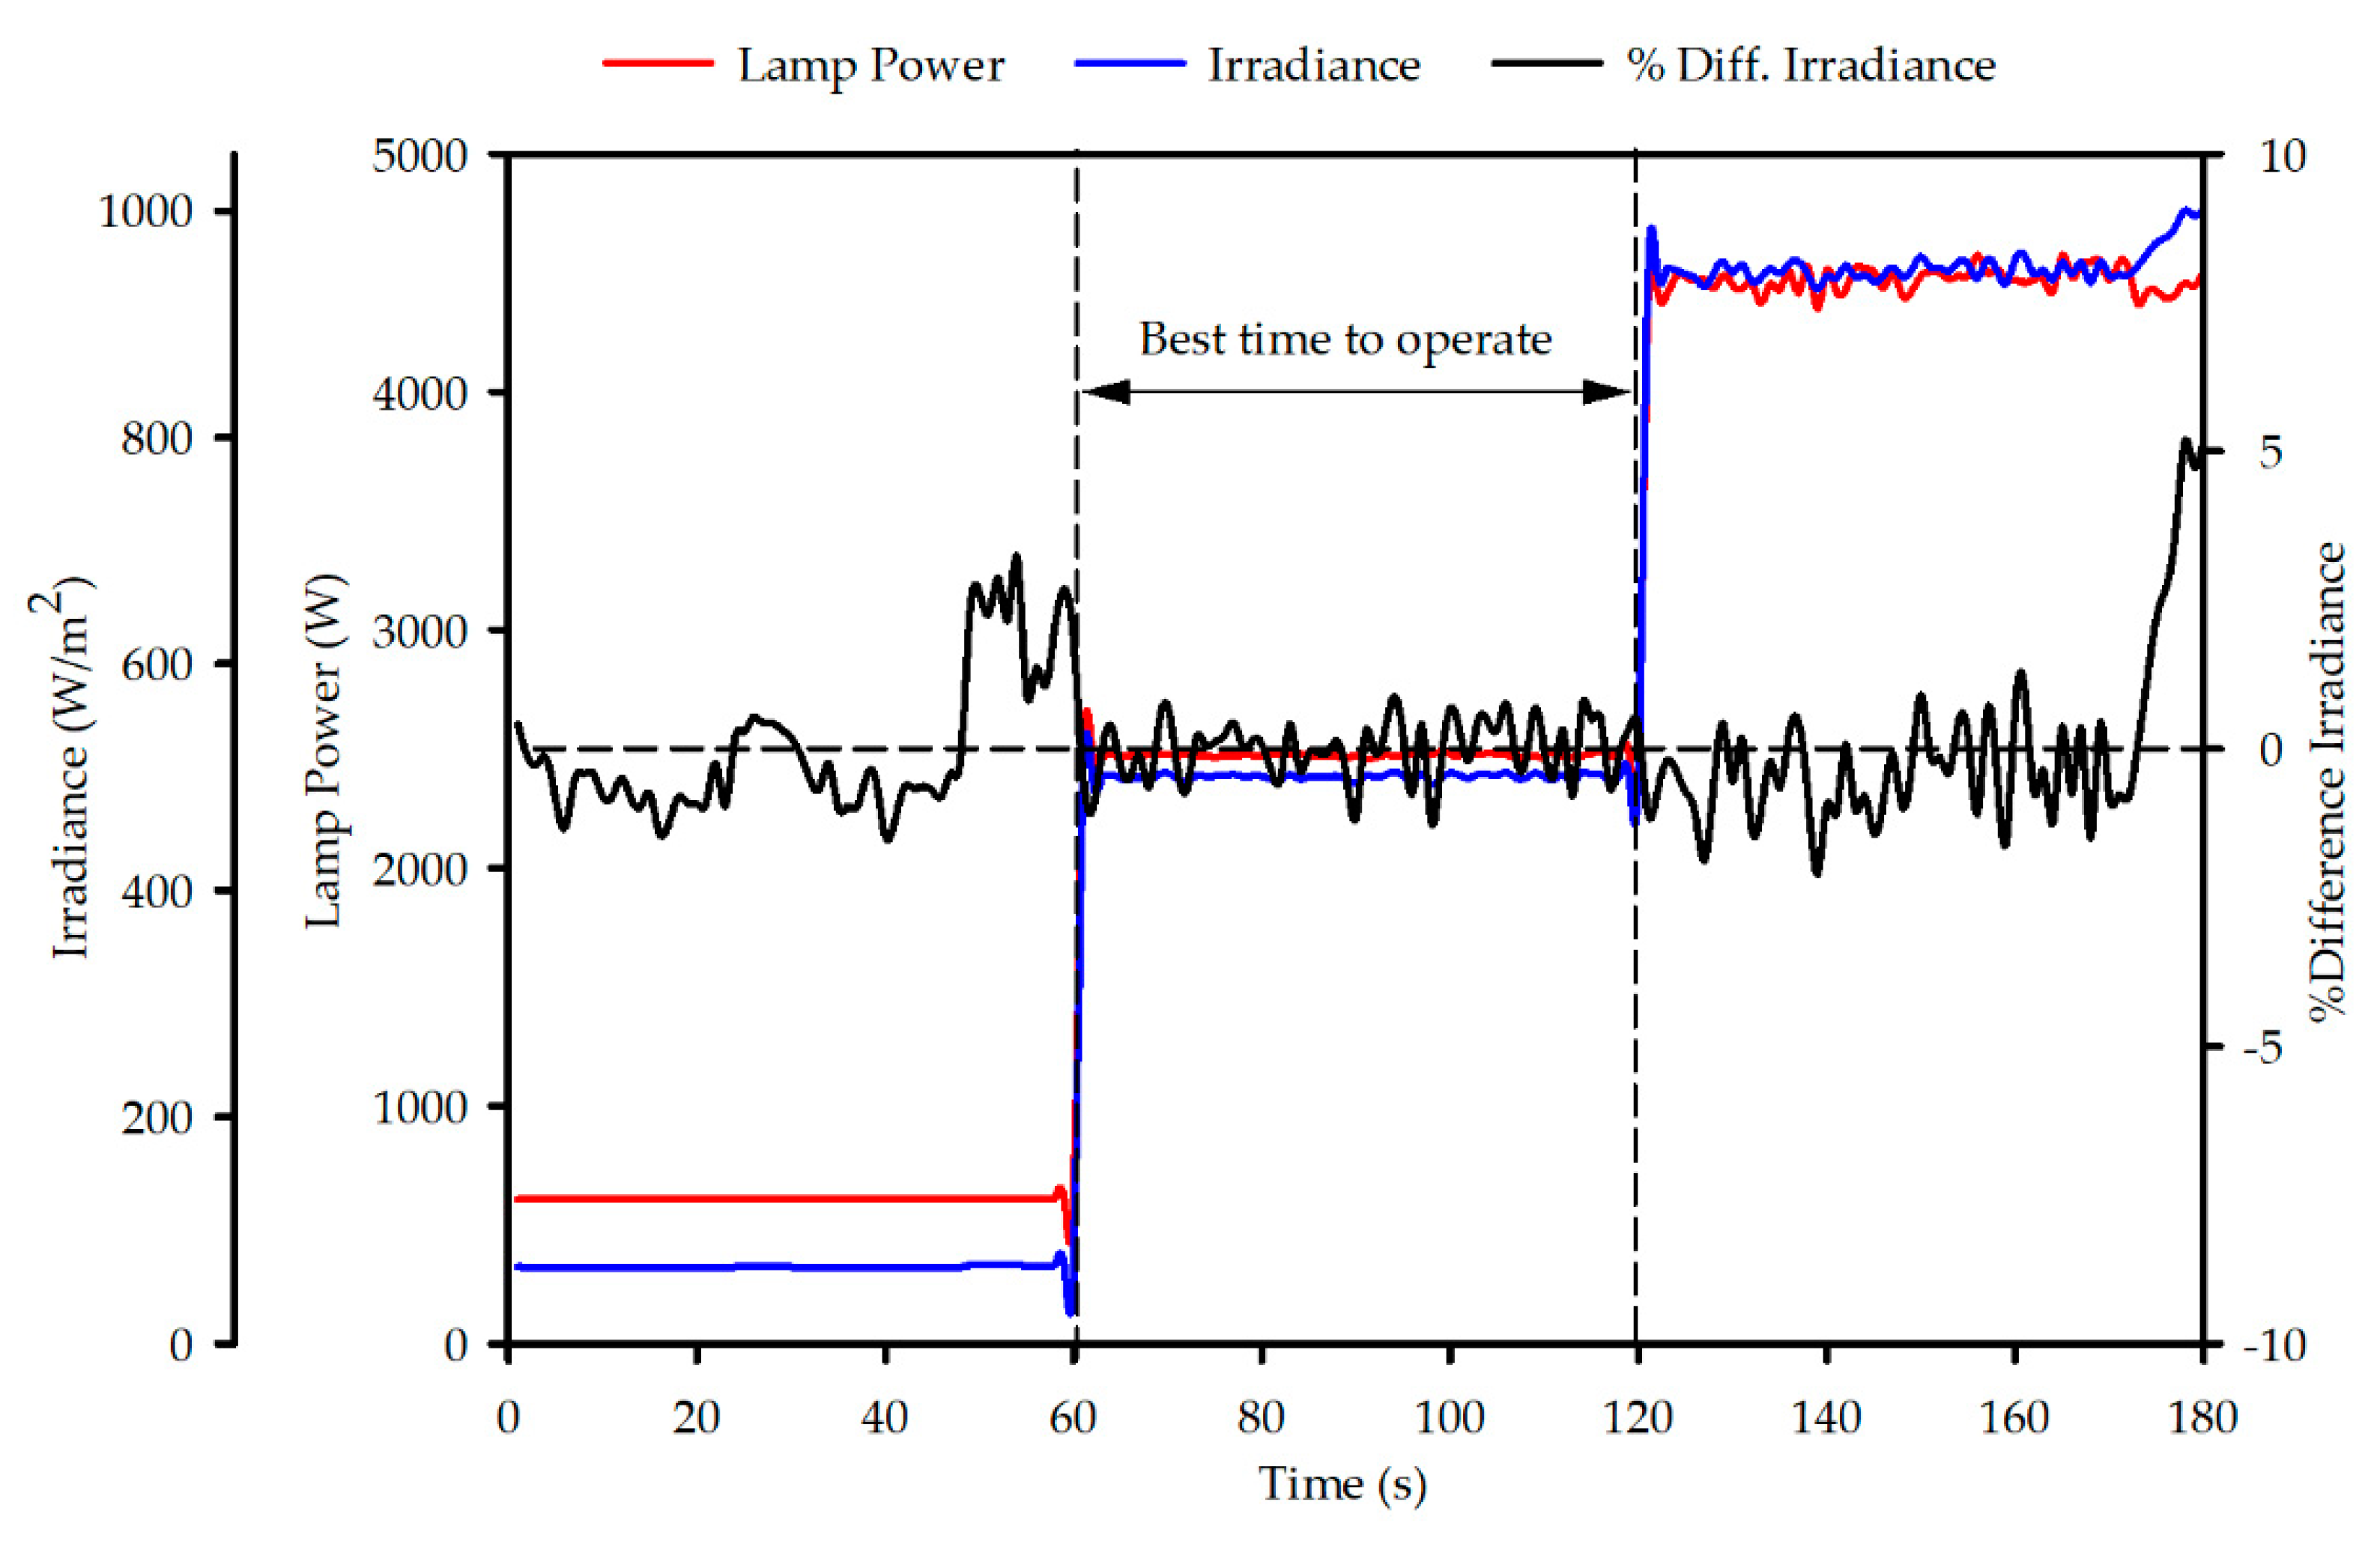
3.3. Investigating the Effectiveness of ADAS in Stop–Start Configuration

The autonomous dynamic adaptability system (ADAS) was further tested for 180 s, in order to obtain the best time to conduct an indoor test on PV cells, as shown in Figure 12.
The high voltage from the igniter produces an arc which ignites the xenon gas encased in the light bulb. This effect causes the rapid fluctuation in irradiance, while the ADAS tries to normalise the drift in irradiance. In Figure 12, the irradiance changes with respect to the solar simulator’s input power. The best time to operate, i.e., carry out an investigation on any PV cell (once the device under test is securely placed on the target area), is between 60 and 120 s after a cold start, as depicted by the percentage difference of the irradiance from the set point in Figure 12.

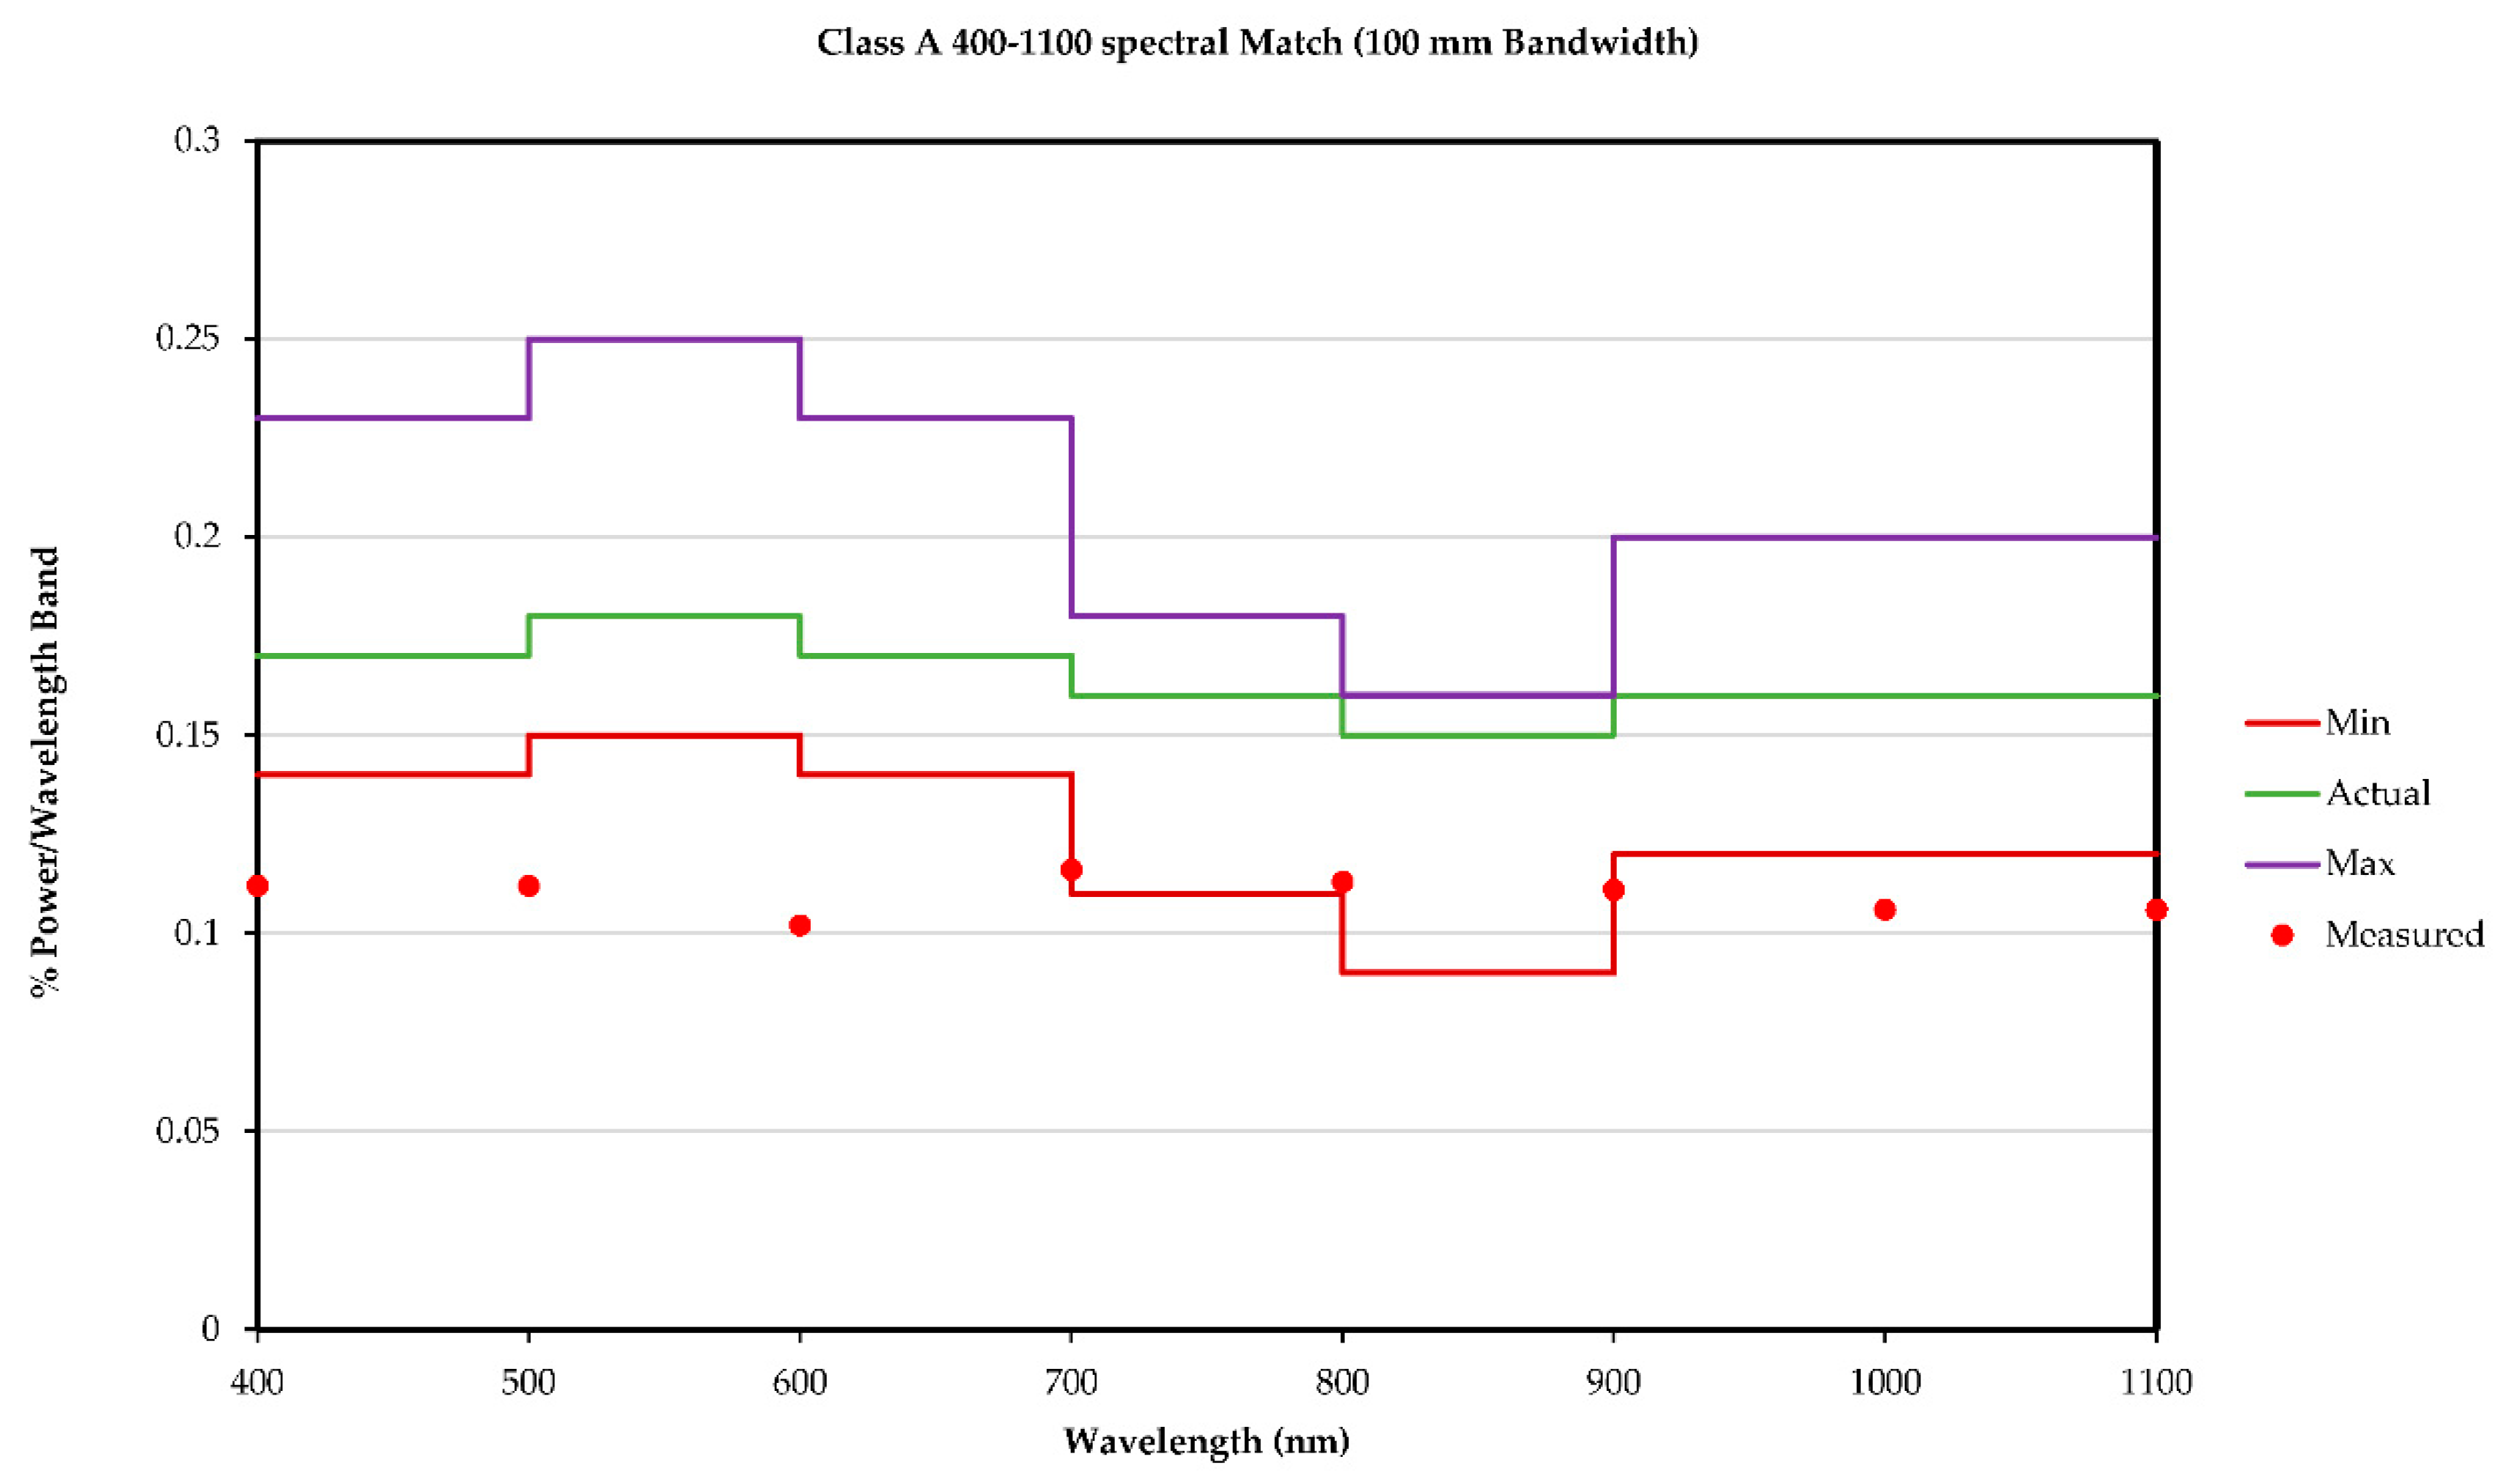
3.4. Solar Simulator Classification and Photovoltaic Module Characterisation

The Xenon arc lamp solar simulator was classified over a 1.1 m × 1.295 m target area, by adopting the ASTM E 927-05 standards [8]. Hence, the solar simulator is only capable of characterizing a PV module the area of which is ≤1.1 m × 1.295 m. The classified solar simulator is presented in Table 1.
A class AAB (spectral match, spatial uniformity, and temporal instability) obtained at the end of the classification process for the xenon arc lamp solar simulator is seen in Table 1. The results show that a class A spectral match, a class A spatial uniformity, and a temporal instability belonging to class B was obtained over a target area of 1.1 m × 129.5 m. A comparison with a standard solar simulator’s spectral match, obtained from [24], is shown in Figure 13.
Figure 13 shows a standard spectral match for a class A solar simulator, which is the most important factor for any solar simulator [25]. The standard spectral match was compared with measured data from the characterised solar simulator. Results in Figure 13 show that the measured data was between the minimum spectral match for any class A solar simulator.

4. Discussion

A control and measurement system for a Xenon arc lamp solar simulator was developed. They allow the user to monitor any device under test, as well as regulate the operating conditions of the solar simulator.
The irradiance of the solar simulator at startup, and the corresponding lamp power, is shown in Figure 4. The lamp power over 180 s shows some stability, when compared to the irradiance over the same time frame. The PLC tries to maintain and keep the irradiance of the solar simulator constant, although slight fluctuations in irradiance can be noticed in Figure 7. The gradual ramping down and up of the solar simulator’s input power, as the PLC tries to keep it constant, has a direct impact on the irradiance of the solar simulator. It can be seen in Figure 7 that the lamp power became stable after 120 s of starting the solar simulator. Although there was a slight fluctuation in the irradiance value after 120 s, it ramped up almost immediately thereafter, and remained relatively stable. This could have been a result of the slight change in the lamp’s input power. The effect of the small fluctuations in the lamp’s input power is seen in the percentage difference of the irradiance from the set point in Figure 4, which is less than ±1%.
To find out what input current would give 1000 Wm−2, the solar simulator was run at 20%, 50% and 90%, respectively. Running the solar simulator at 50% gave an irradiance value of over 500 Wm−2, as shown in Figure 5. The solar simulator was run for over 70 s. The irradiance remained relatively stable at 500 Wm−2 range. The solar simulator was then operated at 90% of its rated current. The resulting irradiance value was 1000 Wm−2, as shown in Figure 9, Figure 11 and Figure 12, as obtained by [26].
The reference cell’s surface temperature over 120 s is shown in Figure 9, Figure 10 and Figure 11. According to [5], it takes pulsed solar simulators approximately 120 ms to carry out a test on PV cells. It took the reference cell between 35 s and 40 s to exceed 25 °C without temperature control. This was ample time to carry out the test on the PV cells after they had been mounted on the target area, as suggested by [5] for steady-state solar simulators. However, the total heat required to maintain 25 °C in the reference cell, while carrying out a test on the PV module, was determined as 1660 Joules.

5. Conclusions

An autonomous dynamic adaptability system (ADAS) for a Xenon arc lamp solar simulator was successfully designed, built and tested. The ADAS allows the user to monitor any device under test, as well as the operating conditions of the solar simulator. The control system allows the solar simulator’s light intensity to be controlled remotely, and also allows one to measure and store the irradiance values obtained from the device under test. The system also monitors the surface temperature of the device under test. Results obtained showed that operating the solar simulator at 90% of its rated current corresponded to an irradiance of 1000 Wm−2, and a cell surface temperature of 25.9 °C. The light source (xenon arc lamp) has a non-uniformity of 3.26%, corresponding to class A. The ADAS also proved that it is indeed capable of operating the solar simulator autonomously, with very minimal human interaction.

Supplementary Materials

The following are available online at https://www.mdpi.com/2076-3417/10/13/4534/s1, Figure S1: Electrical layout of the autonomous dynamic adaptability system (ADAS), Figure S2: Electrical layout of the autonomous dynamic adaptability system (ADAS).

Author Contributions

Conceptualisation, E.L.M. and J.C.N.; methodology, J.C.N.; software, J.C.N.; validation, E.L.M.; formal analysis, J.C.N.; investigation, J.C.N.; resources, E.L.M.; data curation, J.C.N.; writing—original draft preparation, J.C.N.; writing—review and editing, E.L.M.; visualisation, J.C.N.; supervision, E.L.M.; project administration, E.L.M.; funding acquisition, E.L.M. All authors have read and agreed to the published version of the manuscript.

Funding

We are grateful for financial support from our sponsors South African National Research Foundation (NRF), Department of Science & Technology (DST), Eskom tertiary education support (TESP), and Govan Mbeki Research & Development Centre (GMRDC) of the University of Fort Hare.

Acknowledgments

The authors would like to thank Melvin Adonis for his technical support.

Conflicts of Interest

The authors declare no conflict of interest. The funders had no role in the design of the study; in the collection, analyses, or interpretation of data; in the writing of the manuscript, or in the decision to publish the results.

References

  1. Rivola, D.; Dittmann, S.; Pravettoni, M.; Friesen, G.; Chianese, D. High-Speed Multi-Channel System for Solar Simulator Irradiance Non-Uniformity Measurement. In Proceedings of the 2014 IEEE 40th Photovoltaic Specialist Conference (PVSC), Denver, CO, USA, 8–13 June 2014; pp. 2611–2615. [Google Scholar] [CrossRef]
  2. Shinde, U.K.; Kadwane, S.G.; Keshri, R.K.; Gawande, S.P. Dual Mode Controller-Based Solar Photovoltaic Simulator for True PV Characteristics. Can. J. Elec. Comput. Eng. 2017, 40, 237–245. [Google Scholar] [CrossRef]
  3. Leary, G.; Switzer, G.; Kuntz, G.; Kaiser, T. Comparison of Xenon Lamp-Based and LED-Based Solar Simulators. In Proceedings of the 2016 IEEE 43rd Photovoltaic Specialists Conference (PVSC), Portland, OR, USA, 5–10 June 2016; pp. 3062–3067. [Google Scholar] [CrossRef] [Green Version]
  4. Gallo, A.; Marzo, A.; Fuentealba, E.; Alonso, E. High Flux Solar Simulators for Concentrated Solar Thermal Research: A review. Renew. Sust. Energ. Rev. 2017, 77, 1385–1402. [Google Scholar] [CrossRef]
  5. Photoemission Tech, Inc (PET). Available online: http://www.photoemission.com/techpapers/A%20step%20by%20step%20guide%20to%20selecting%20a%20Solar%20Simulator%20Ver.%203.pdf (accessed on 29 March 2018).
  6. Sarwar, J.; Georgakis, G.; LaChance, R.; Ozalp, N. Description and Characterization of an Adjustable Flux Solar Simulator for Solar Thermal, Thermochemical and Photovoltaic Applications. Sol. Energy 2014, 100, 179–194. [Google Scholar] [CrossRef]
  7. Namin, A.; Jivacate, C.; Chenvidhya, D.; Kirtikara, K.; Thongpron, J. Construction of Tungsten Halogen, Pulsed LED, and Combined Tungsten Halogen-LED Solar Simulators for Solar Cell-Characterization and Electrical Parameters Determination. Int. J. Photoenergy 2012, 2012, 9. [Google Scholar] [CrossRef] [Green Version]
  8. ASTM-E927. Standard Specification for Solar Simulation for Terrestrial Photovoltaic Testing; American Society for Testing and Materials International: West Conshohocken, PA, USA, 2005. [Google Scholar]
  9. Aojia, M.; Feng, G.; Yahui, L.; Lei, Z.; Chenlin, W.; Fugui, L. Synergetic Robust Fault Detection and Fault Tolerant Control for Flight Vehicles with Time-Varying Delay. In Proceedings of the 29th Chinese Control and Decision Conference (CCDC), Chongqing, China, 28–30 May 2017; pp. 2594–2599. [Google Scholar] [CrossRef]
  10. Ahmed, S.N. Physics and Engineering of Radiation Detection, 2nd ed.; Elsevier: Amsterdam, The Netherlands, 2015. [Google Scholar]
  11. Petrenci, R.; Frigura-Iliasa, M.; Frigura-Iliasa, F.M.; Mirica, M.; Balcu, F. Experimental Study About the Sintering Temperature of a New Metal Oxide Varistor Material. In Proceedings of the 10th International Conference on Electrical and Electronics Engineering (ELECO), Bursa, Turkey, 30 November–2 December 2017; pp. 398–401. [Google Scholar]
  12. Lončar, B.; Vujisić, M.; Stanković, K.; Osmokrović, P. Stability of Metal-Oxide Varistor Characteristics in Exploitation Conditions. Acta Phys. Pol. A 2009, 116, 1081–1084. [Google Scholar] [CrossRef]
  13. Rao, X.; Guo, J.; Zhou, Y.; Wei, Q.; Liu, X. Research on Leakage Current Characteristic of Metal Oxide Varistor. In Proceedings of the 1st International Conference on Electrical Materials and Power Equipment (ICEMPE), Xi’an, China, 14–17 May 2001; pp. 680–685. [Google Scholar] [CrossRef]
  14. Wenhua, L.; Xiaoyong, W.; Xiaoyan, Z.; Fang, Y. Research on the Reliability Test Control System’s Design of the Miniature Circuit Breaker. In Proceedings of the 2009 IEEE International Symposium on Industrial Electronics, Seoul, South Korea, 5–8 July 2009; pp. 1380–1384. [Google Scholar] [CrossRef]
  15. Frank, M. Design of Transient Voltage Suppressors for Digital Inputs of Avionics Devices in Indirect Lightning Tests According to ED-14/DO-160. In Proceedings of the 2013 International Symposium on Electromagnetic Compatibility, Brugge, Belgium, 2–6 September 2013; pp. 833–836. [Google Scholar]
  16. Dai, S.H.; Lin, C.J.; King, Y.C. Leakage Suppression of Low-Voltage Transient Voltage Suppressor. IEEE Trans. Electron. Devices 2008, 55, 206–210. [Google Scholar] [CrossRef]
  17. Sinica, A.V.; Gluhov, A.V.; Skornjakov, S.P. Engineering Design of the Power Transient Voltage Suppressors for Network Protection Devices. In Proceedings of the 16th International Conference of Young Specialists on Micro/Nanotechnologies and Electron Devices, Erlagol, Russia, 29 June–3 July 2015; pp. 482–485. [Google Scholar] [CrossRef]
  18. Marum, S.; Duvvury, C.; Park, J.; Chadwick, A.; Jahanzeb, A. Protecting Circuits from The Transient Voltage Suppressor’s Residual Pulse During IEC 61000-4-2 Stress. In Proceedings of the 31st EOS/ESD Symposium, Anaheim, CA, USA, 30 August–4 September 2009; pp. 1–10. [Google Scholar]
  19. Kashyap, A.S.; Sandvik, P.; McMahon, J.; Bolotnikov, A.; Erlbaum, J.; Andarawis, E. Silicon Carbide Transient Voltage Suppressor for Next Generation Lightning Protection. In Proceedings of the 2014 IEEE Workshop on Wide Bandgap Power Devices and Applications, Knoxville, TN, USA, 13–15 October 2014; pp. 147–150. [Google Scholar] [CrossRef]
  20. Bustamante, M.; Moreno, G.; Pelaez, A.; Madrigal, C. Design and Implementation of an Automation Didactic Module Focused to Machine Vision and Programmable Logic Control. In Proceedings of the 2014 III International Congress of Engineering Mechatronics and Automation (CIIMA), Cartagena, Colombia, 22–24 October 2014; pp. 1–5. [Google Scholar] [CrossRef]
  21. Meyer, E.L. On the Reliability, Degradation and Failure of Photovoltaic Modules. Ph.D. Thesis, University of Port Elizabeth, Port Elizabeth, South Africa, 2002. [Google Scholar]
  22. Sciuto, G.L.; Napoli, C.; Capizzi, G.; Shikler, R. Organic Solar Cells Defects Detection by Means of an Elliptical Basis Neural Network and A New Feature Extraction Technique. Optik 2019, 194, 163038. [Google Scholar] [CrossRef]
  23. Sciuto, G.L.; Capizzi, G.; Salvatore, C.; Shikler, R. Geometric Shape Optimisation of Organic Solar Cells for Efficiency Enhancement by Neural Networks. In Advances on Mechanics, Design Engineering and Manufacturing; Springer: Cham, Switzerland, 2017; pp. 789–796. [Google Scholar]
  24. Meyer, E.L.; Overen, O.K. Blue Skies and Red Sunsets: Reliability of Performance Parameters of Various Pn Junction Photovoltaic Module Technologies. Cogent Eng. 2019, 6, 1691805. [Google Scholar] [CrossRef]
  25. Beghi, G. Performance of Solar Energy Converters: Thermal Collectors and Photovoltaic Cells: Springer Science & Business Media: Lectures of a Course Held at the Joint Research Centre, Ispra, Italy, November 11–18, 1981; Springer Science & Business Media: London, UK, 2012. [Google Scholar]
  26. Rrushi, J.L. Defending Electrical Substations Against 0-Day Malware Through Decoy I/O in Protective Relays. In Proceedings of the 2017 IEEE 15th International Conference on Dependable, Autonomic and Secure Computing, 15th International Conference on Pervasive Intelligence and Computing, 3rd International Conference on Big Data Intelligence and Computing and Cyber Science and Technology Congress (DASC/PiCom/DataCom/CyberSciTech), Orlando, FL, USA, 6–10 November 2017; pp. 486–493. [Google Scholar] [CrossRef]
Figure 1. Schematic diagram of the autonomous dynamic adaptability system (ADAS).
Applsci 10 04534 g001
Figure 2. 1.5KE30CA bi-directional transient voltage suppressor.
Applsci 10 04534 g002
Figure 3. I–V characteristic curve for (A) 1.5KE24CA and (B) 1.5KE30CA Zener diode.
Applsci 10 04534 g003
Figure 4. Forward bias characteristic curve for a 1.5KE12CA Zener diode.
Applsci 10 04534 g004
Figure 5. Autonomous dynamic adaptability system (ADAS).
Applsci 10 04534 g005
Figure 6. Algorithm for the Xenon arc lamp solar simulator autonomous dynamic adaptability system (ADAS).
Applsci 10 04534 g006
Figure 7. Xenon arc lamp power and irradiance distribution at cold start.
Applsci 10 04534 g007
Figure 8. AM1.5 and Xenon arc lamp spectrum.
Applsci 10 04534 g008
Figure 9. Solar simulator operated at varying set points of its rated current.
Applsci 10 04534 g009
Figure 10. Energy generated by the solar simulator.
Applsci 10 04534 g010
Figure 11. Cumulative power generated by the solar simulator.
Applsci 10 04534 g011
Figure 12. Reference cell response to irradiance from the solar simulator.
Applsci 10 04534 g012
Figure 13. Spectral match of the characterised xenon arc lamp solar simulator.
Applsci 10 04534 g013
Table 1. Xenon arc lamp solar simulator performance classifications.
CharacteristicsSimulator Class (%)
ABC
Spectral Match≤ 2 or ≤ 3≤ 5≤ 10
(1 ± 0.1)
Spatial Non-uniformity≤ 2 or ≤ 3≤ 5≤ 10
(3.26)
Temporal Instability≤ 2≤ 5≤ 10
(3.93)

