1. Introduction
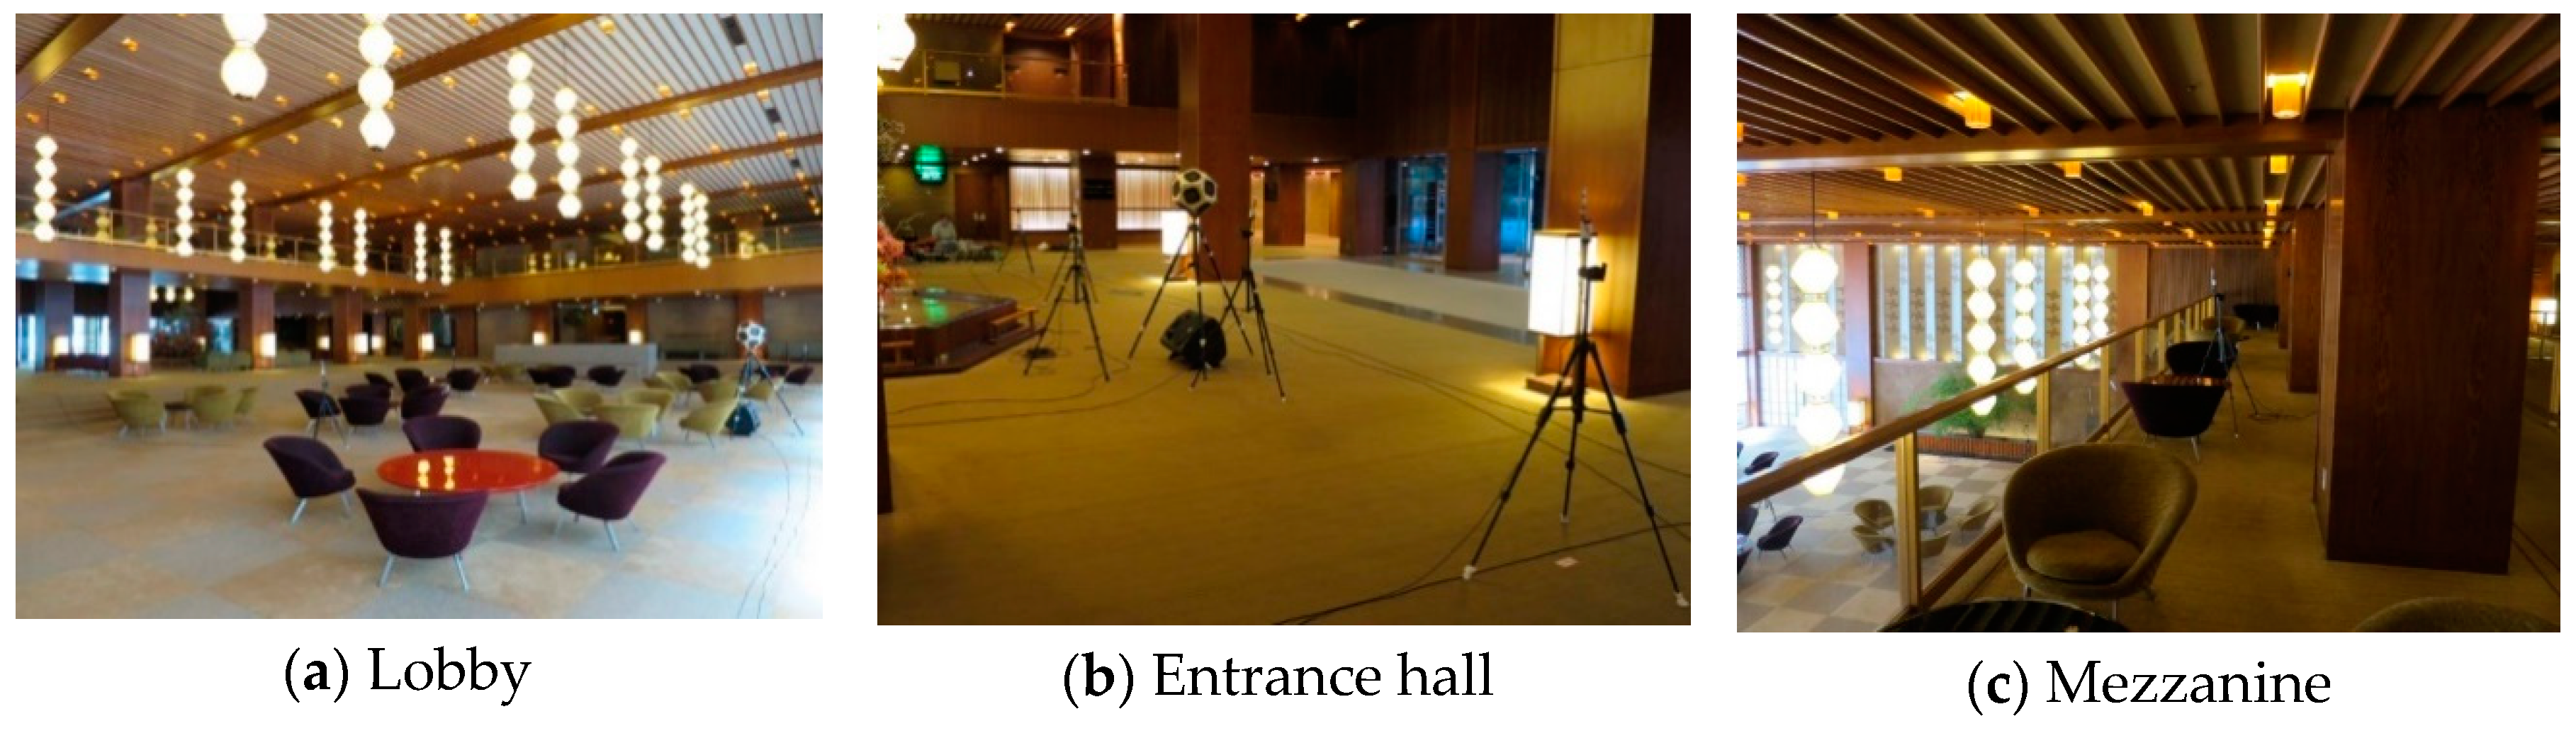
Before the discussion on acoustic performance, we must explain the background of the building that is the research subject of this study. The “Hotel Okura Tokyo”, hereafter referred to as “Okura”, was built 53 years ago in 1962. Within the facility of Okura, there is a “main lobby”, hereafter referred to as the “lobby”, designed by Yoshiro Taniguchi; this is the main lobby of the hotel and a public space that is highly appreciated worldwide. The lobby is regarded as a valuable asset of the hotel Okura that recalls the history of its founding—that is, the history of the hotel launch. A reproduction of the lobby is also being considered; this project is called “The Okura Tokyo” and involves rebuilding Okura. Against this background, various surveys have been conducted with the aim of examining the current state of the lobby, keeping records, and clarifying the situation during construction. The objects of research are surveys of interiors from the viewpoint of architectural design and a confirmation of construction methods by disassembly, as well as a survey of the light environment and sound environment from the viewpoint of the living environment. In this study, in addition to reporting a case study of the sound environment of this legendary hotel lobby, we were able to better understand the good reputation of the sound environment of the lobby based on its objective physical quantities.
Notable comments from lobby users are that the lobby is “easy for conversation” and that “other people’s conversations are not bothersome”; moreover, “the hustle and bustle of the entrance hall is not felt much in the lobby”, even though the lobby is adjacent to the entrance hall, which together comprise one space. These comments were delivered individually from the lobby users to the hotel employees and the authors. Moreover, Muschamp [
1] describes the spatial experience in the lobby as follows: “You glide down four low steps—it’s the ultimate conversation pit—toward a broad expanse of wheat-colored carpet that rolls on and on, seemingly toward the horizon”. When we actually observed how to use the lobby, the users held open discussions without any concealment.
Based on the above, we consider that the good reputation of the lobby’s sound environment is closely related to the speech intelligibility in the room. Since the speech transmission index, STI [
2,
3], and rapid speech transmission index, RASTI [
4], are already widely used as evaluation indices for speech transmission performance with respect to intelligibility, these indices are listed as candidates for the measurement items in this paper. However, since the motivation for this paper is the comments of the lobby users, the most ideal method for evaluating the speech transmission performance in the lobby may be a psychological evaluation. Morimoto et al. [
5] proposed a psychological evaluation method called ‘Listening difficulty’ for evaluating the speech transmission performance and showed that this index is suitable for the evaluation of actual sound fields, such as public spaces. Unfortunately, such a psychological method was not practical for this survey due to time constraints. Therefore, as mentioned above, the authors decided to evaluate the speech transmission performance in the room via RASTI. In addition, we measured the indoor noise, sound pressure distribution, and reverberation time, which are physical quantities closely related to the speech transmission performance.
We would also like to discuss how architectural users judge the quality of a space. This judgment is not limited to the sound environment; it is assumed that users judge the good or bad elements of a space according to whether or not that space meets its original use and also fulfills the potential demands of its users. So et al. [
6] examined the image factors common to users for sound environments in various commercial spaces and reported that ‘liveliness’, ‘size of the space’, and ‘the state of use’ were likely to be potential factors that affected evaluations based on user experience. In this report, ‘quiet’ rather than ‘lively’ for ‘liveliness,’ ‘large’ rather than ‘small’ for ‘size of the space,’ and ‘unusual’ rather than ‘usual’ for ‘the state of use’ were factors that determined the lobbies of urban hotels to be ‘good’. In view of this, it was inferred that ‘liveliness’ was one of the potential demands of users. Chen et al. [
7] also reported that subjective evaluations might be influenced by several factors, including users’ factors of the acoustic conditions at the users’ homes. Considering the results of each paper, the sound pressure level during hotel operations and the indoor noise are considered to affect user evaluations of the lobby based on their potential demand.
From the above, we selected measurement items such as indoor noise, intelligibility (RASTI), sound pressure distribution, reverberation time, and sound during hotel operations. Using these measurements, we were able to better understand the legendary sound environment in the lobby.
3. Results
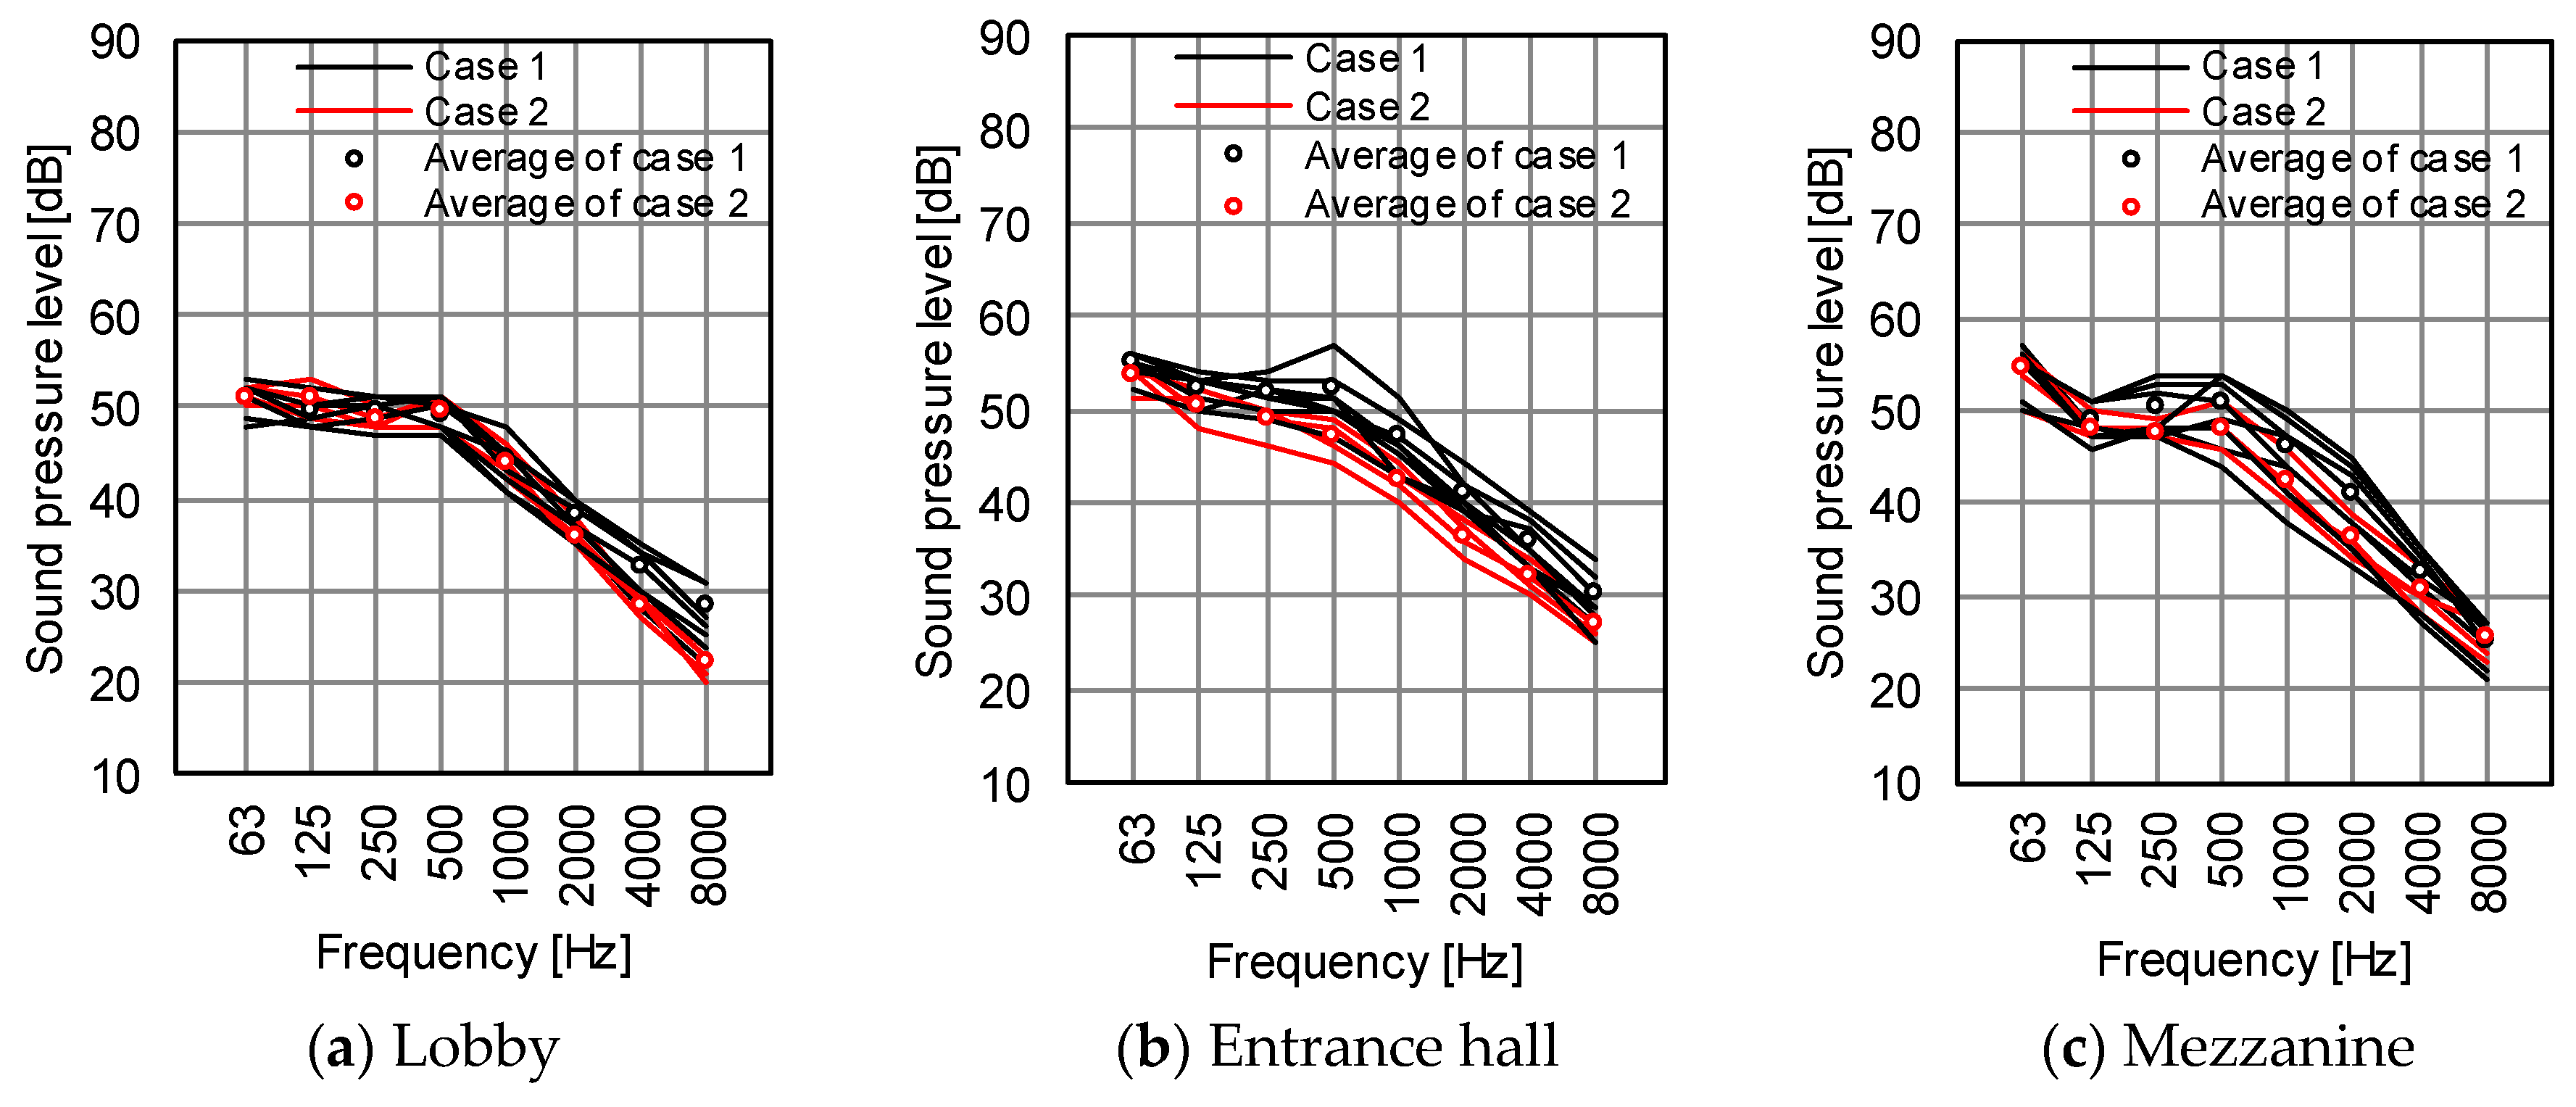
3.1. Sound During Hotel Operations
In the crowded case (case 1), the equivalent continuous A-weighted noise level of sound during usual hotel operations is 47–51 dB in the lobby, 49–56 dB in the entrance hall, and 44–54 dB in the mezzanine. In the less crowded case (case 2), an equivalent level of sound during usual hotel operations is 48–51 dB in the lobby, 45–50 dB in the entrance hall, and 46–51 dB in the mezzanine. The details of each case are shown in
Table 2. Although the level and frequency of the sound generated in each room are affected by the activities of the rooms’ occupants, every room is about 50 dB.
Figure 7 shows all of the results of the 12 measurements of the equivalent continuous sound pressure levels during hotel operations in (a) the lobby, (b) the entrance hall, and (c) the mezzanine. Notably, these data were not simultaneously measured at each measurement point. During hotel operations, the lobby features unique sound characteristics that differ from those of other rooms. No conspicuous difference is seen between case 1 and case 2 for the frequency characteristics of the lower 2000 Hz of the one octave band in the lobby. Thus, the lobby appears less affected by the degree of crowdedness and position in the room and offers a stable space against ambient noise. Moreover, the indoor generated noise of the entrance hall tends to be lower in the case 2 situation than in case 1; the variations in the values according to the positions are large. The mezzanine also has a similar tendency. The entrance hall and mezzanine act as passageways; as a result, the rooms are easily affected by the degree of crowdedness, and the dispersion of their values is large. On the other hand, the lobby is less likely to be a passageway for planning reasons; in the lobby, users tend to stay for a longer period of time, and the user’s activities are imagined to be static and homogeneous. These factors help make the sound environment of the lobby stable. Okura’s plan seems to have been effective in allowing the lobby to become an independent living environment and maintain a comfortable sound environment. The above corresponds to the study of So et al. [
6], which showed that ‘quiet’ is a sound environment factor commonly judged to be best for urban hotels.
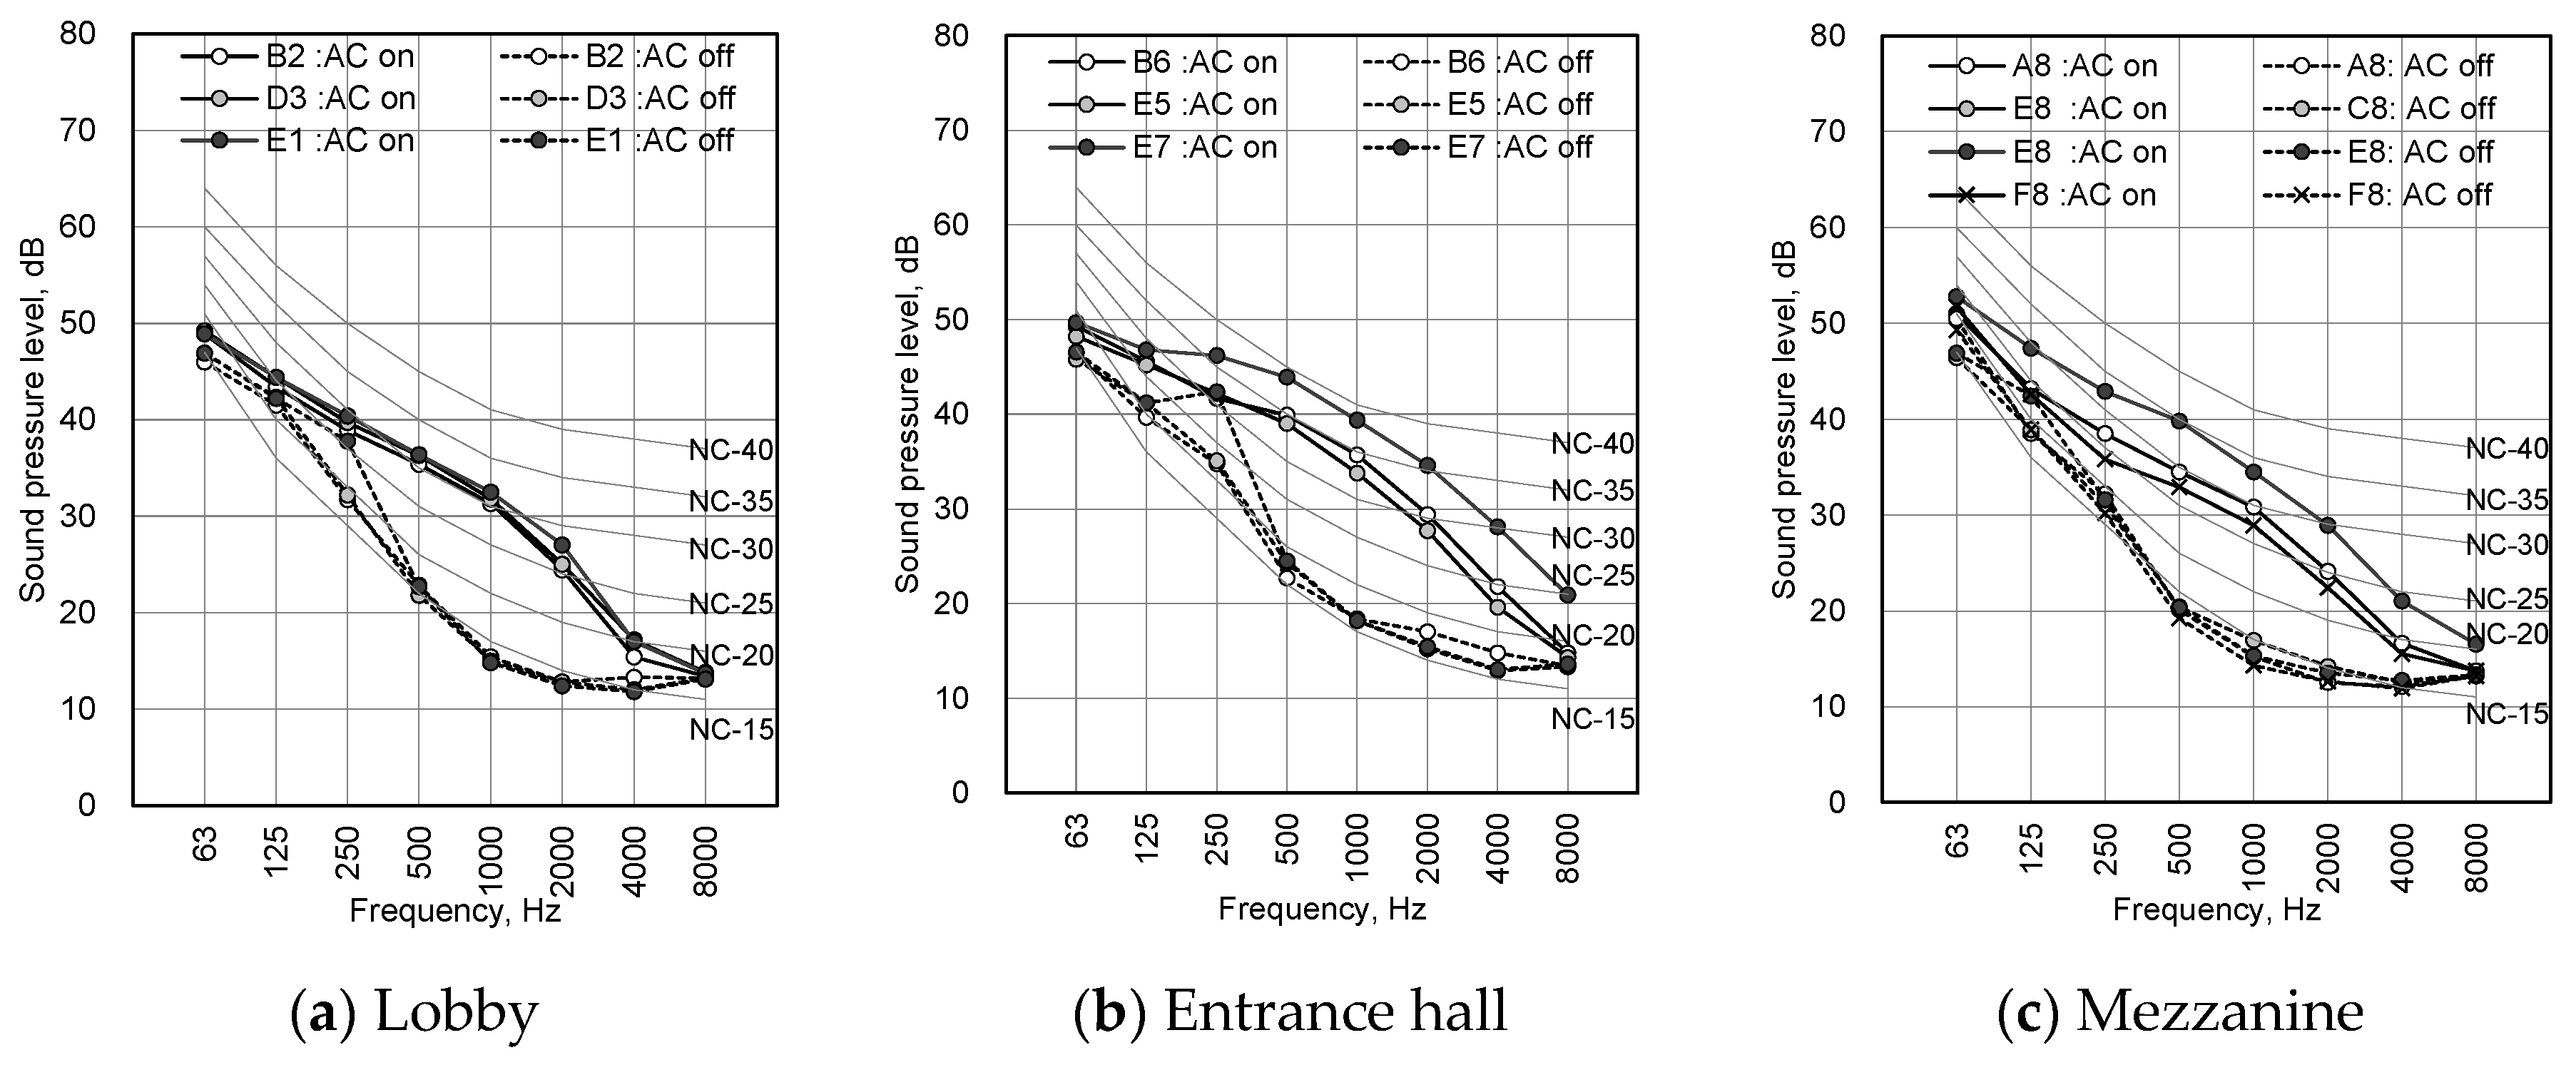
3.2. Indoor Noise
The sound pressure levels of indoor noise are shown in
Figure 8. Each one octave band with air-conditioning on or off is evaluated by the noise criteria, NC curves, which are noise standards proposed by Beranek [
10]. While the air-conditioning is on, the NC values and equivalent continuous A-weighted sound levels are NC-35 and 37 dB to 38 dB in the lobby, NC-35 to NC-40 and 40 dB to 45 dB in the entrance hall, and NC-30 to NC-40 and 35 dB to 43 dB in the mezzanine. While the air-conditioning is off, The NC values and A-weighted sound pressure levels are NC-25 to 30 and 29 dB to 32 dB in the lobby, NC-25 to NC-35 and 29 dB to 34 dB in the entrance hall, and NC-20 to NC-25 and 28 dB to 29 dB in the mezzanine. Although the NC values for hotels vary depending on the room’s use, the recommended NC values of Beranek are within the range of NC-25 to NC-50. Thus, the indoor noises while air-conditioning is on are appropriate for a hotel in all the measurement rooms. This result supports the reputation of the sound environment of the Okura lobby, which features few unnecessary sounds or noises that could impede a conversation.
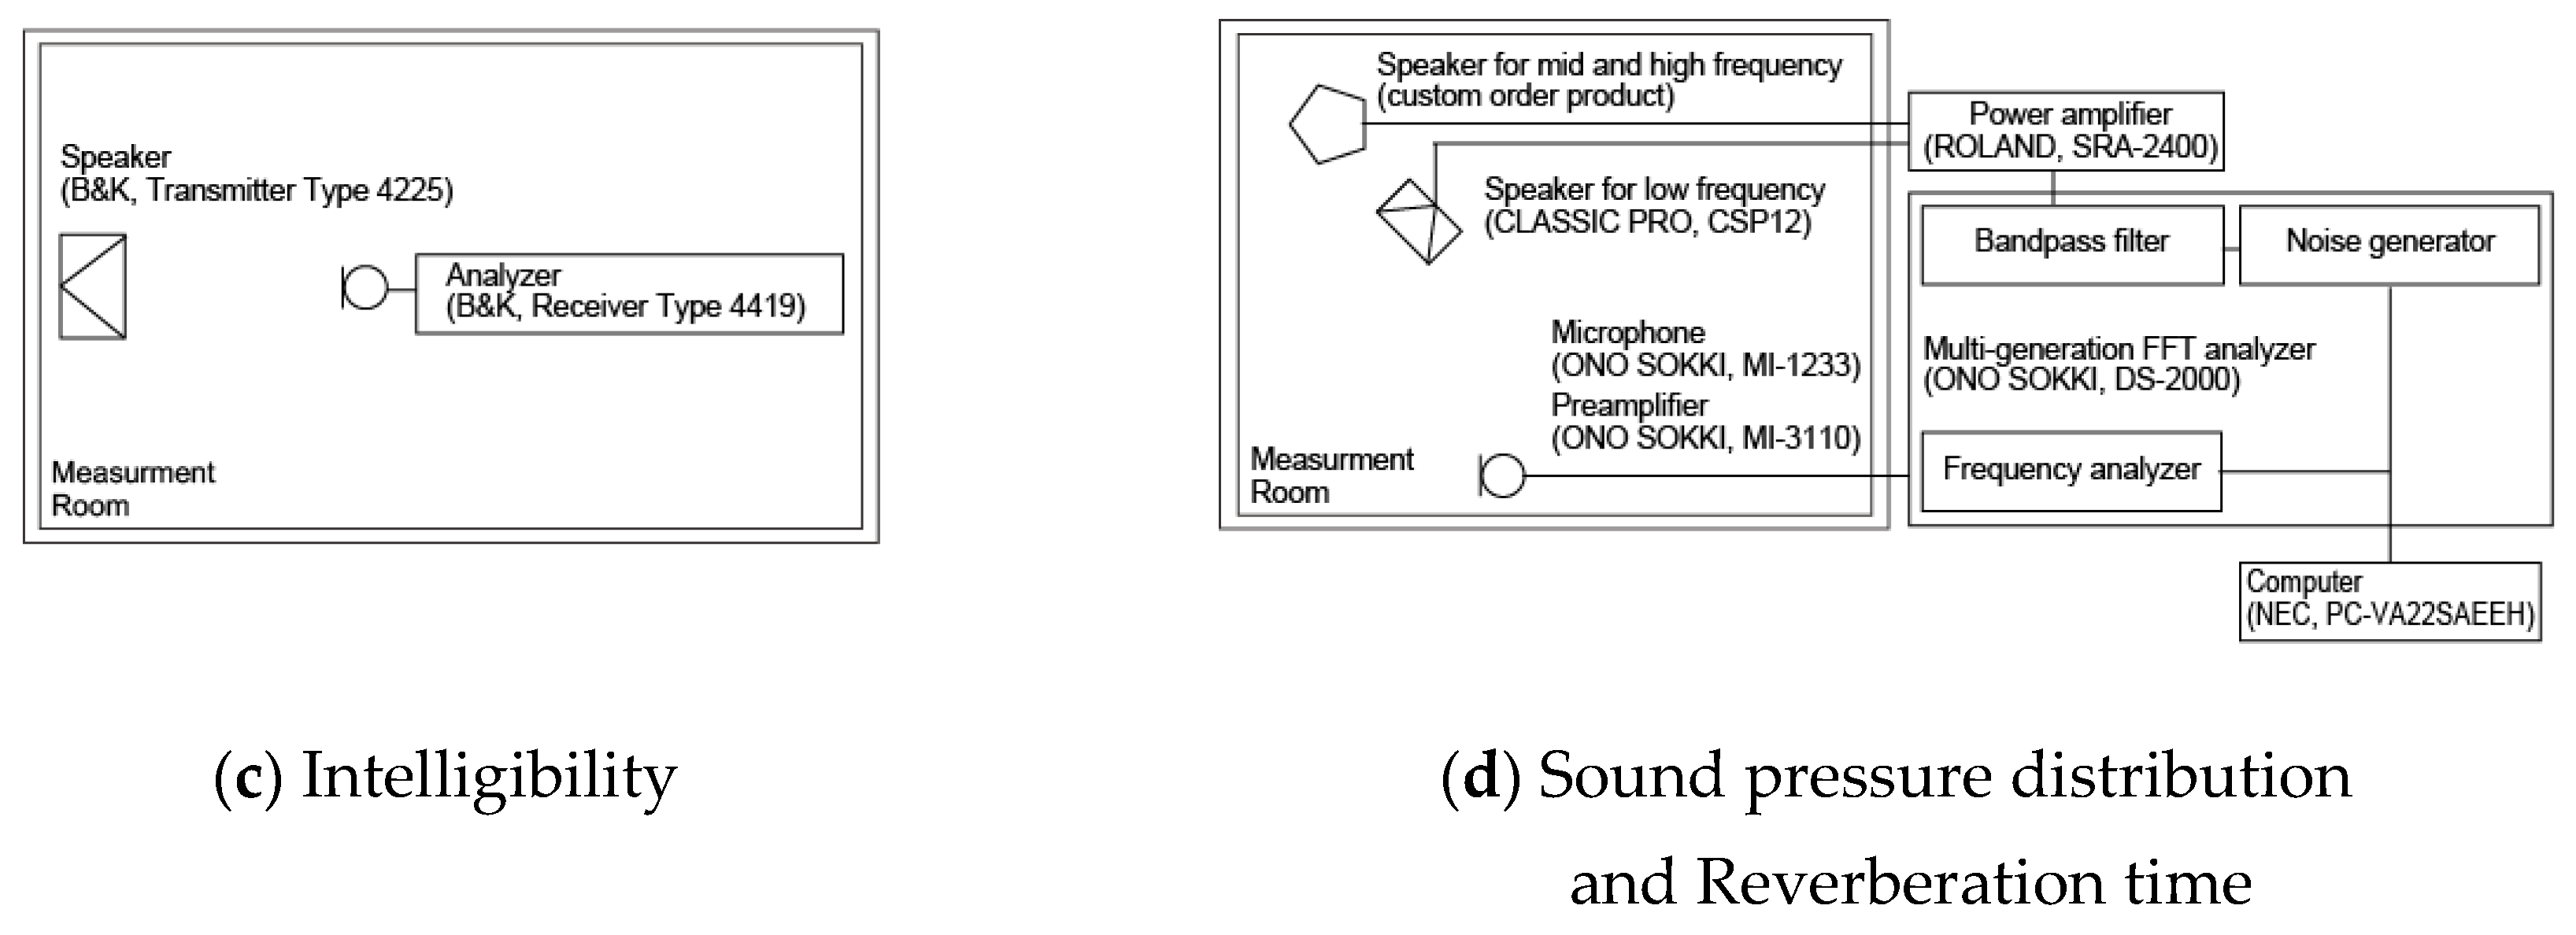
3.3. Intelligibility
For the measurement of intelligibility, indoor noise was the same as the conditions for turning off air-conditioning in
Section 3.2. Usually, the values of STI are evaluated as “bad”, “poor”, “fair”, “good”, or “excellent” using IEC 60268-16 [
8], hereafter referred to as the IEC SCALE. In this study, the IEC SCALE is applied to the measured RASTI to evaluate the speech transmission performance of the room with respect to the intelligibility.
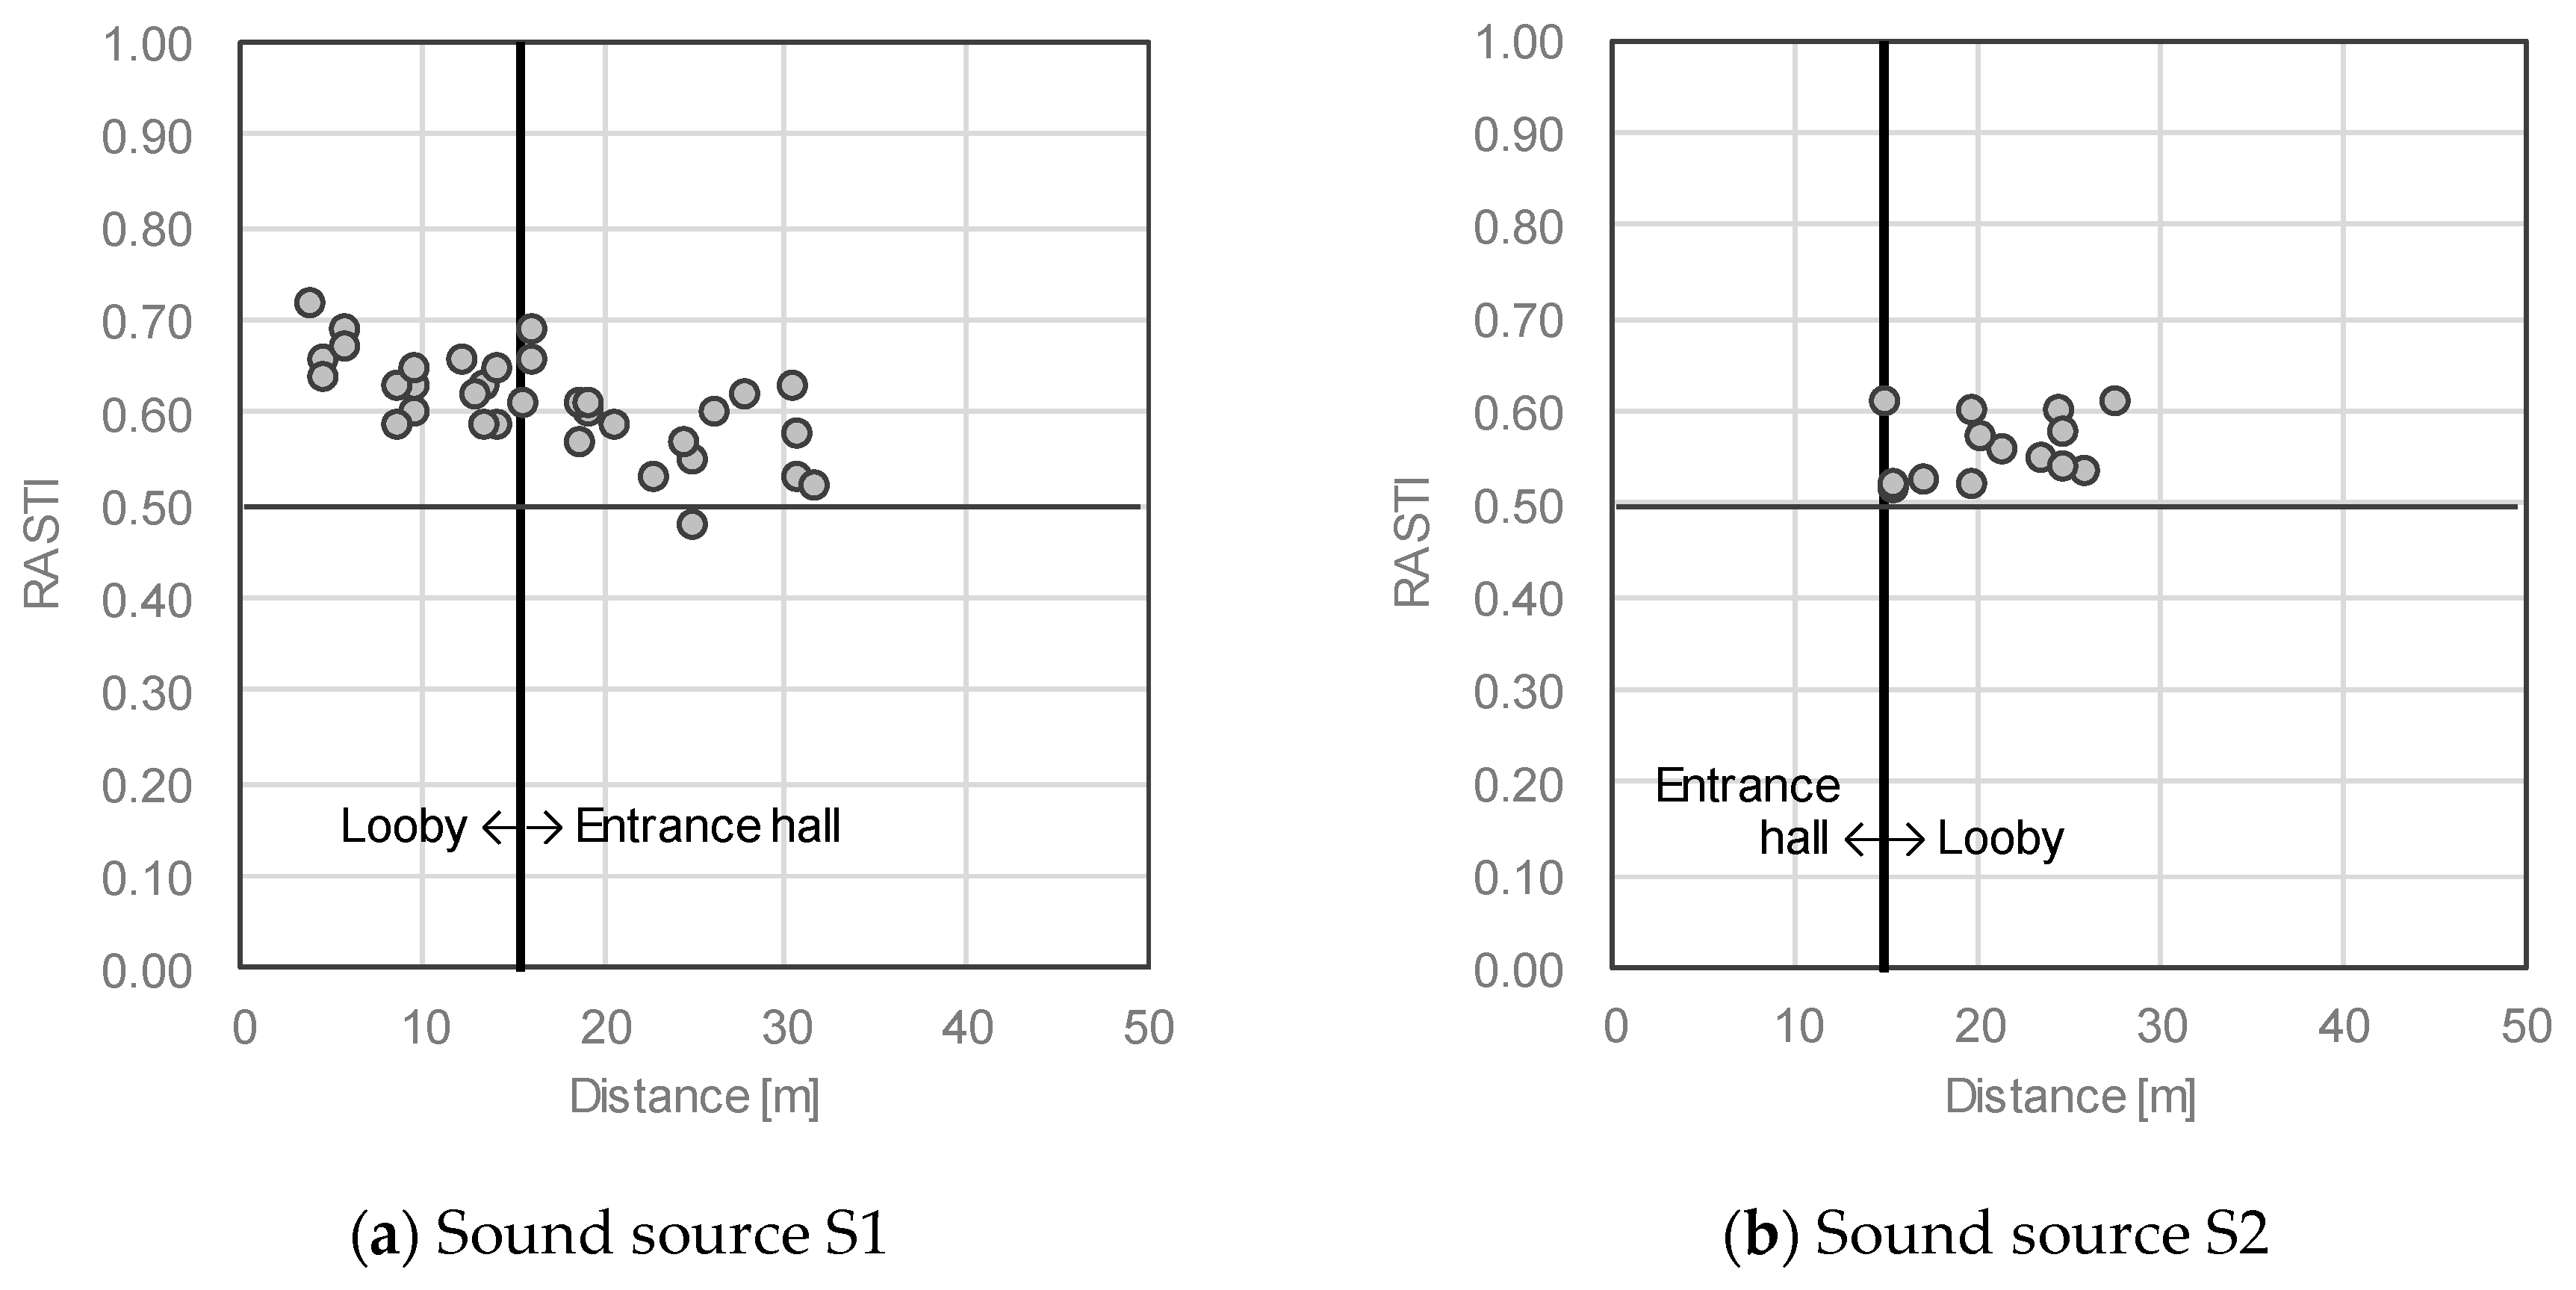
In the case of sound source S1, which assumes listening in the lobby during a conversation, the values of RASTI are 0.59–0.72, and the average is 0.64; thus, the lobby is mostly evaluated as “good” on the IEC SCALE. The values of RASTI of the entrance hall are 0.48–0.66, and the average is 0.59, which is generally evaluated as “fair” on the IEC SCALE, meaning the area’s intelligibility is inferior to that of the lobby. In the mezzanine, although the measuring sample is small, the values of RASTI are 0.59–0.68, which can be evaluated as “good” or “fair”. For sound source S2, which assumes listening in the lobby to speech from the entrance hall, the values of RASTI are 0.52–0.61, and the average is 0.56, which is evaluated to be approximately “fair” using the IEC SCALE. This is similar to the aforementioned results of the entrance hall for lobby speech. The trend of easy conversations in the same room but poor-quality sound between different rooms supports the reputation of the sound environment of the lobby.
Here, we confirm the relationship with the distraction distance r
d [
11], which is an index for an open office where speech transmission performance is important. The relationship between the distance from the sound source and the value of RASTI is shown in
Figure 9. It can be seen that RASTI declines as the distance from the sound source increases for both sound sources. Since r
d is the distance from the speaker when STI < 0.5, all the results in this study are distractions. However, when there is a sound source in one room, the RASTI in the other room is about 0.5–0.6, which is close to the boundary value of r
d. This measurement was performed with the air-conditioning off and no guests present. The indoor noise at the time was 37–38 dB, as shown in
Section 3.2, but the indoor noise during usual hotel operations is about 50 dB, as shown in
Section 3.1. Thus, since the actual background noise is more than 10 dB higher than that at the time of the measurement, the actual values of RASTI may be of poorer quality than these results.
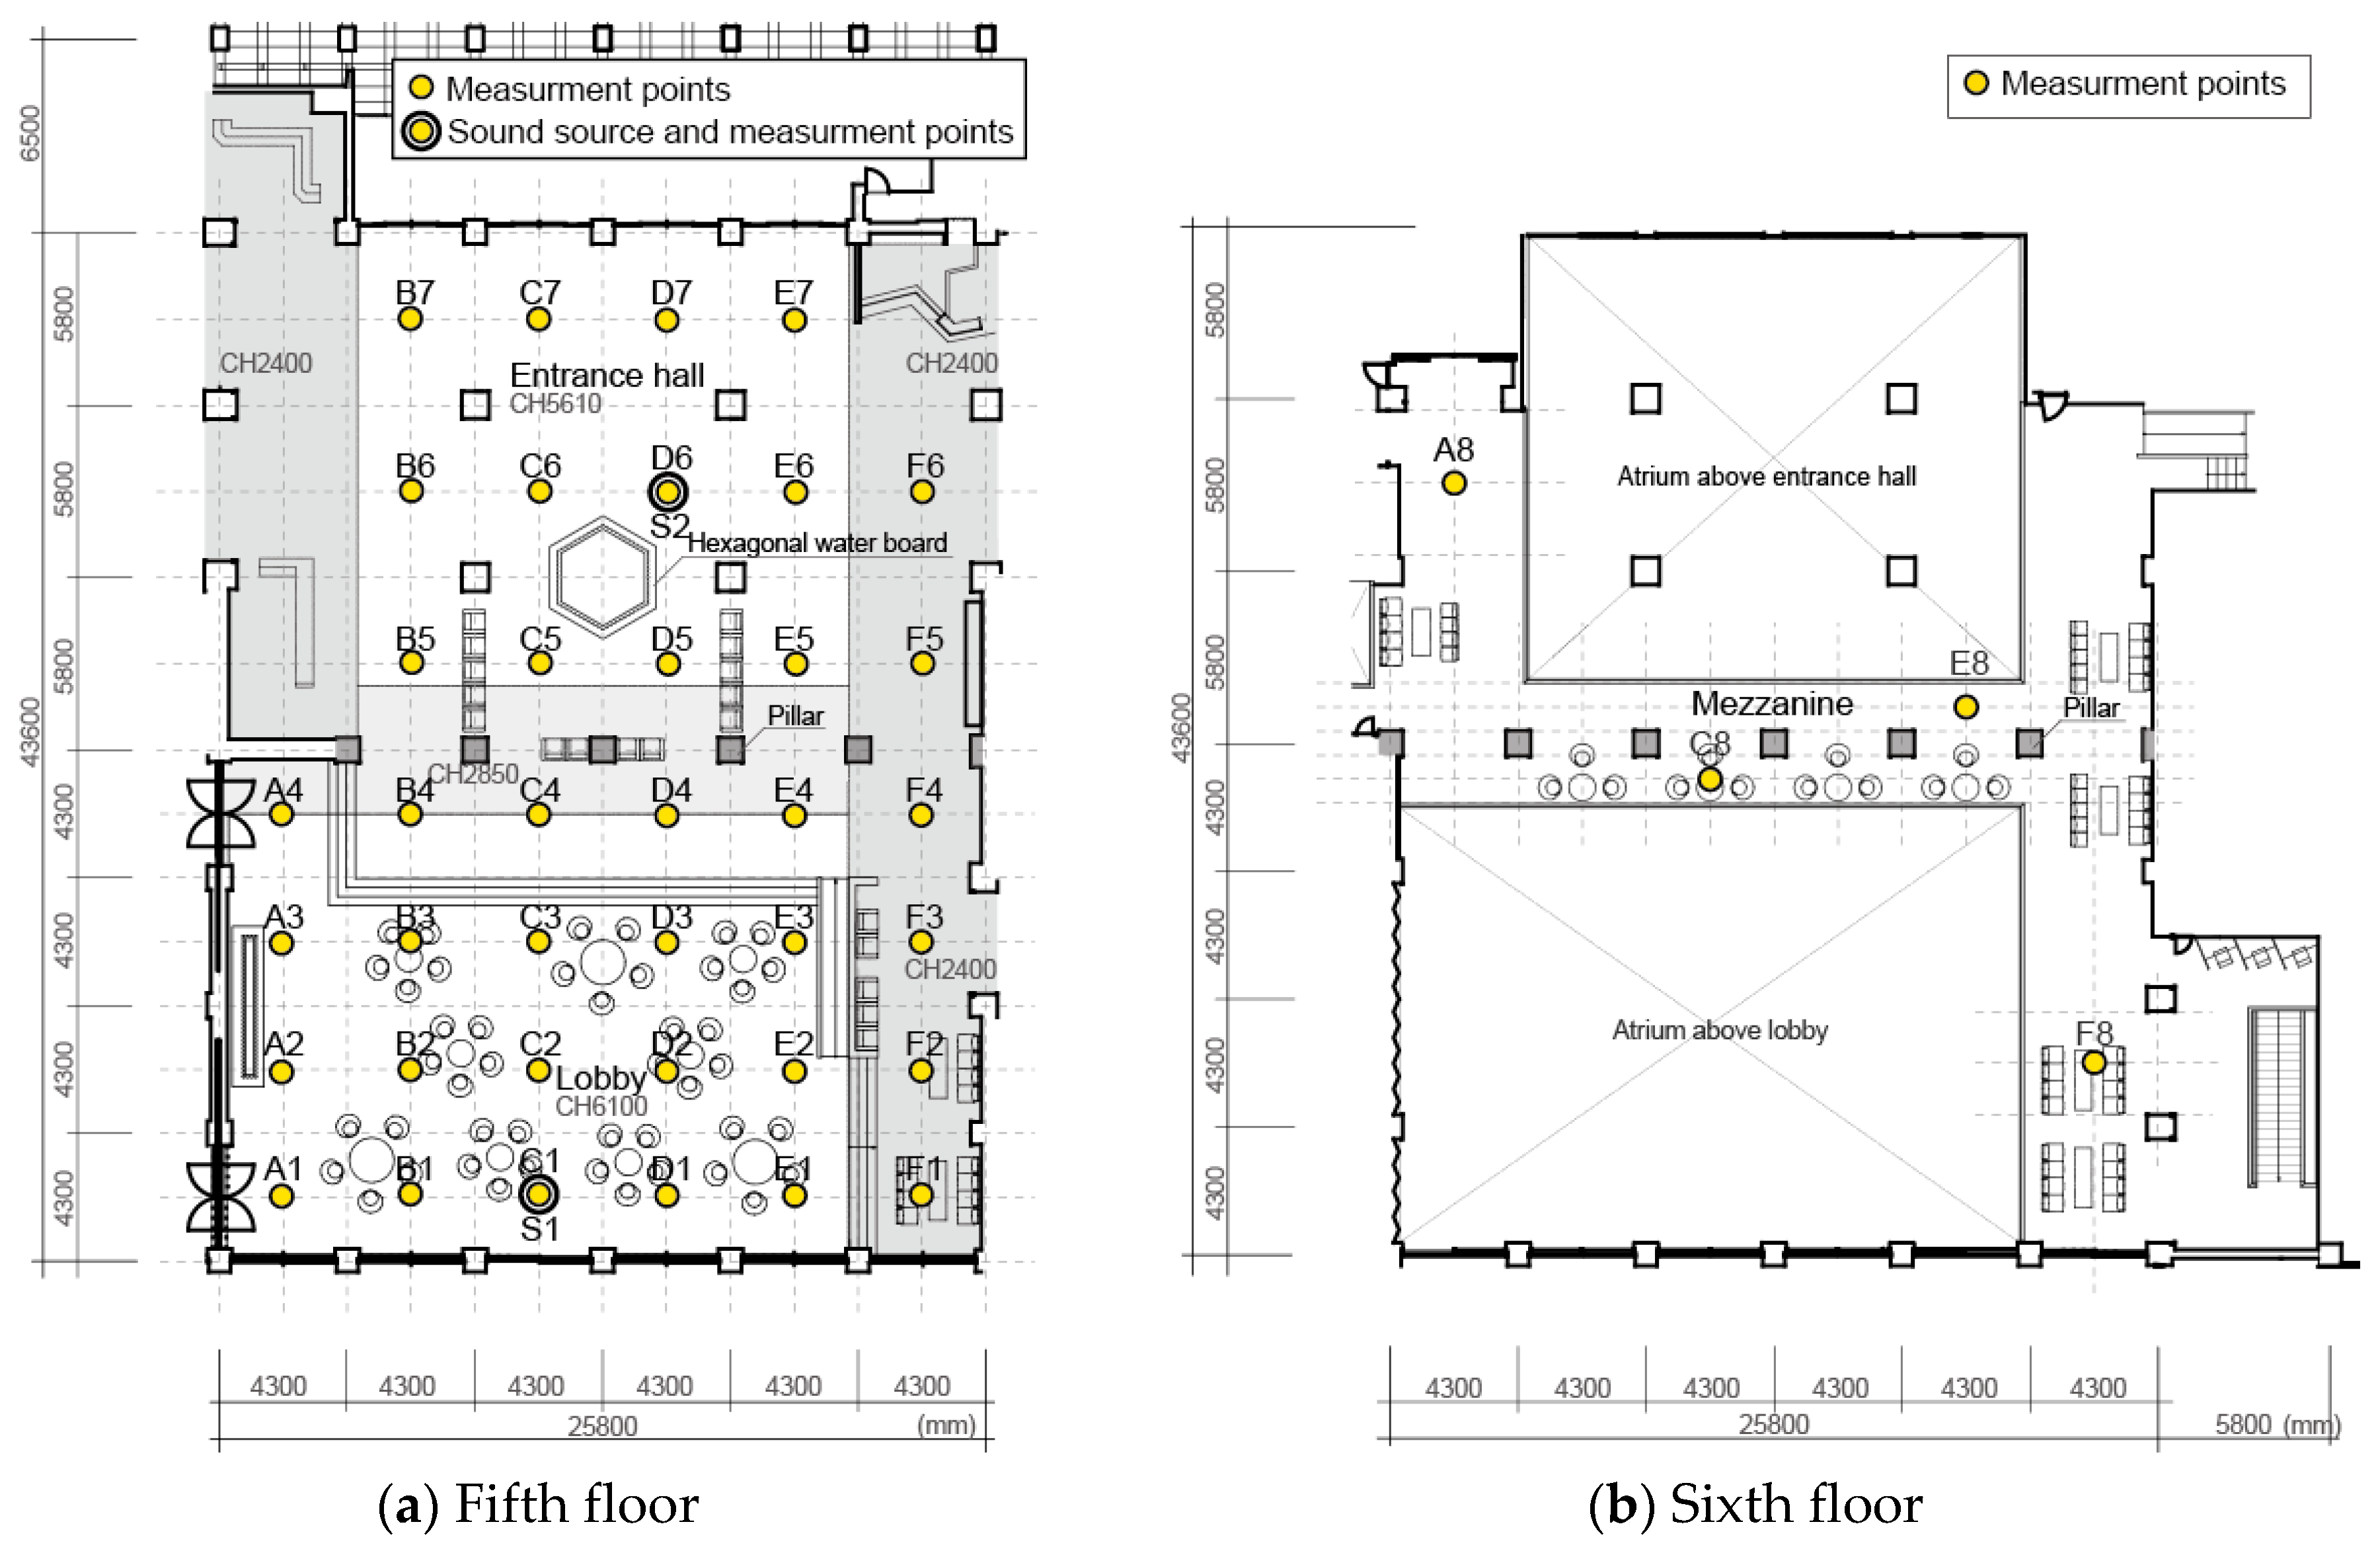
Figure 10 shows the distributions of the values of RASTI. The RASTI at sound source S1 is shown in
Figure 3a, and was assumed from the maximum value of the adjacent measurement point. Focusing on the relationship between sound source S1 and measurement point D6 shows that RASTI has its minimum value here. A hexagonal water board is present in the entrance hall, and a pillar is located between the lobby and the entrance hall, both of which are in a straight line between sound source S1 and measurement point D6. For sound source S2, the rows of pillars have a similar relationship. It is inferred that these architectural objects became acoustic obstacles and produced the notable changes in intelligibility between the lobby and the entrance hall for reasons other than distance.
3.4. Sound Pressure Distribution
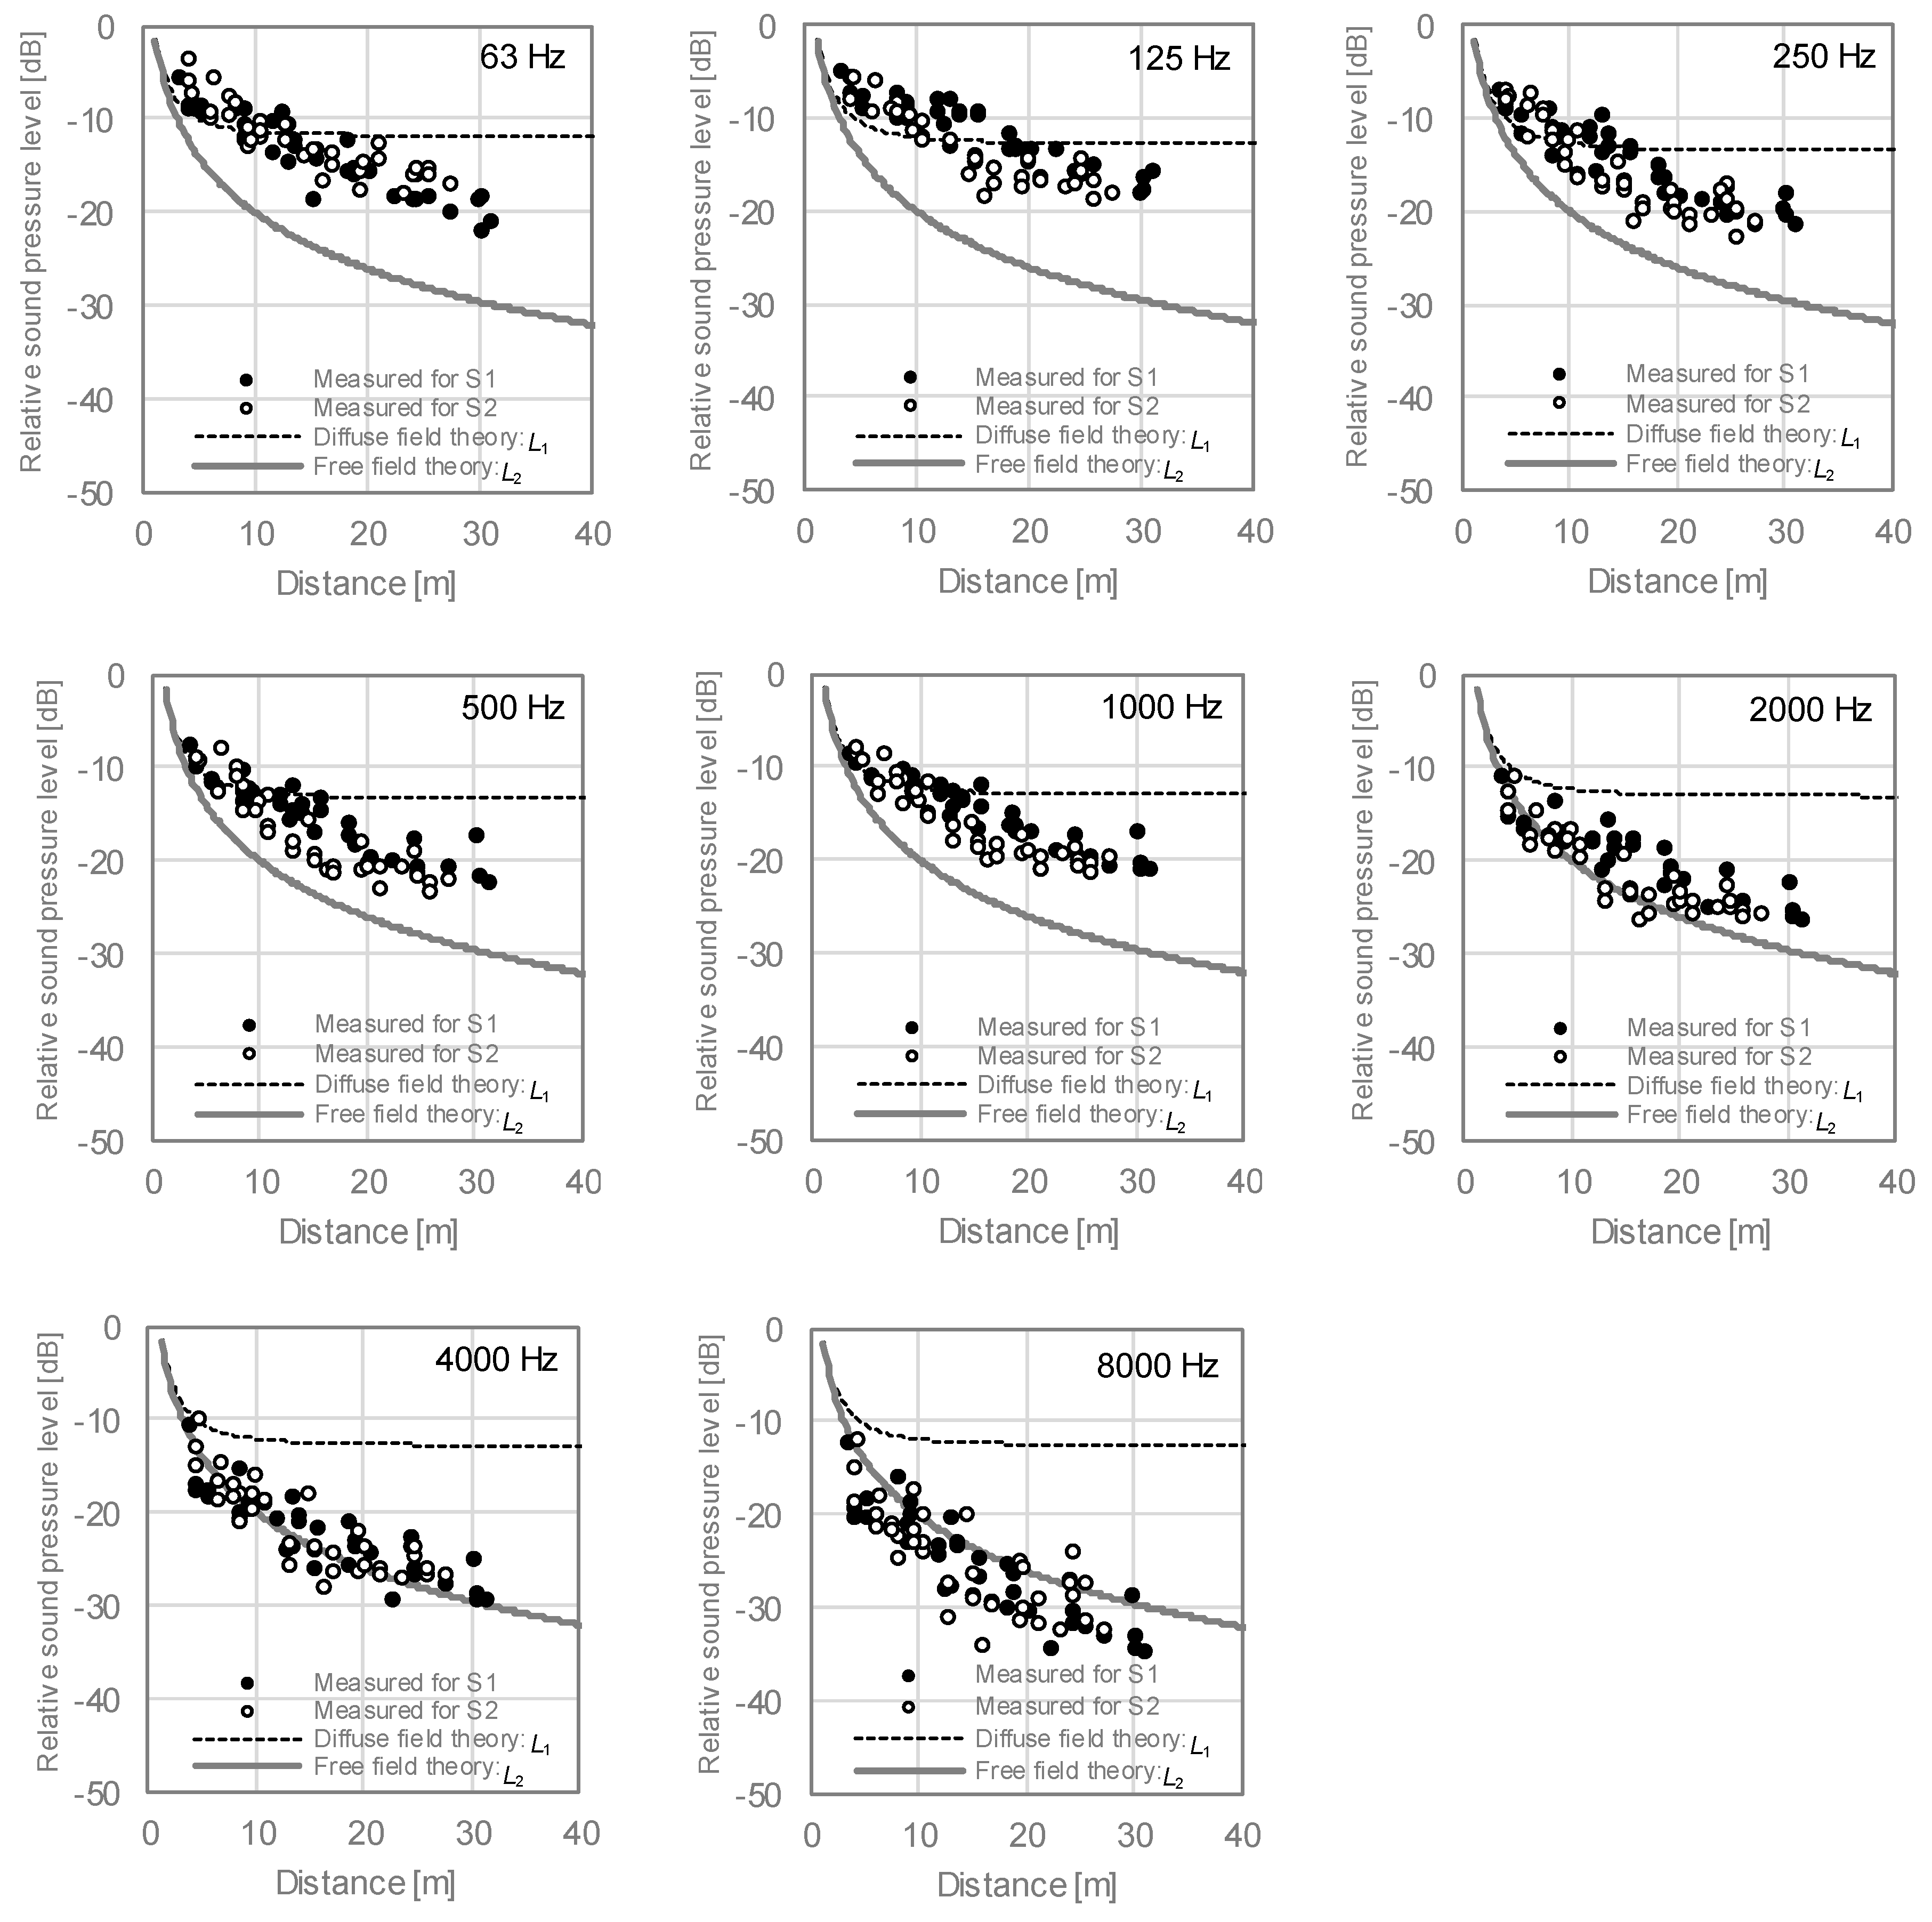
The sound pressure distributions of the lobby and entrance hall are shown in
Figure 11. The sound pressure level of each point is normalized by the value at a 1 m point from the omnidirectional loudspeaker of the sound source. The horizontal axis of
Figure 11 is the distance between each point and the sound source, with the straight-line distance shown in three dimensions. Two theoretical sound pressure levels are considered, as shown in
Figure 11. One of the theoretical values,
L1, is obtained from Equation (1) [
12,
13] of the diffuse field theory:
where the directivity factor Q of the sound source is set to 2 because the floor that the two loudspeakers are installed in is regarded as a reflecting surface, and each room constant R is calculated by the average sound absorption coefficient of the room estimated by the Eyring–Knudsen reverberation equation [
14]. The other theoretical sound pressure level is
L2, obtained from Equation (2) [
12,
13] of the free sound field theory of the point sound source:
and the directivity factor Q of the sound source is the same as that in Equation (1).
In both sound sources, the sound pressure levels at the respective points are smaller as the distance from the sound source increases. However, when the distance becomes 15 m to 20 m or greater from each sound source, the sound pressure levels become smaller than the theoretical value L1, and the attenuating effects become large. This tendency is clearer for sound source S2 than for S1, and the points 15 m to 20 m or more from sound source S2 are equivalent to the points in the lobby space. This suggests that a greater sound attenuation is obtained from the entrance hall to the lobby than the reverse.
Next, we focus on the features of the sound pressure level attenuation in each frequency of the one octave band. However, the band below a 1000 Hz frequency shows a tendency to be close to the theoretical value
L1 within 10 m from the sound source and seems to follow the diffuse field theory. However, it was confirmed that the sound pressure level was more attenuated than the diffuse field theoretical value
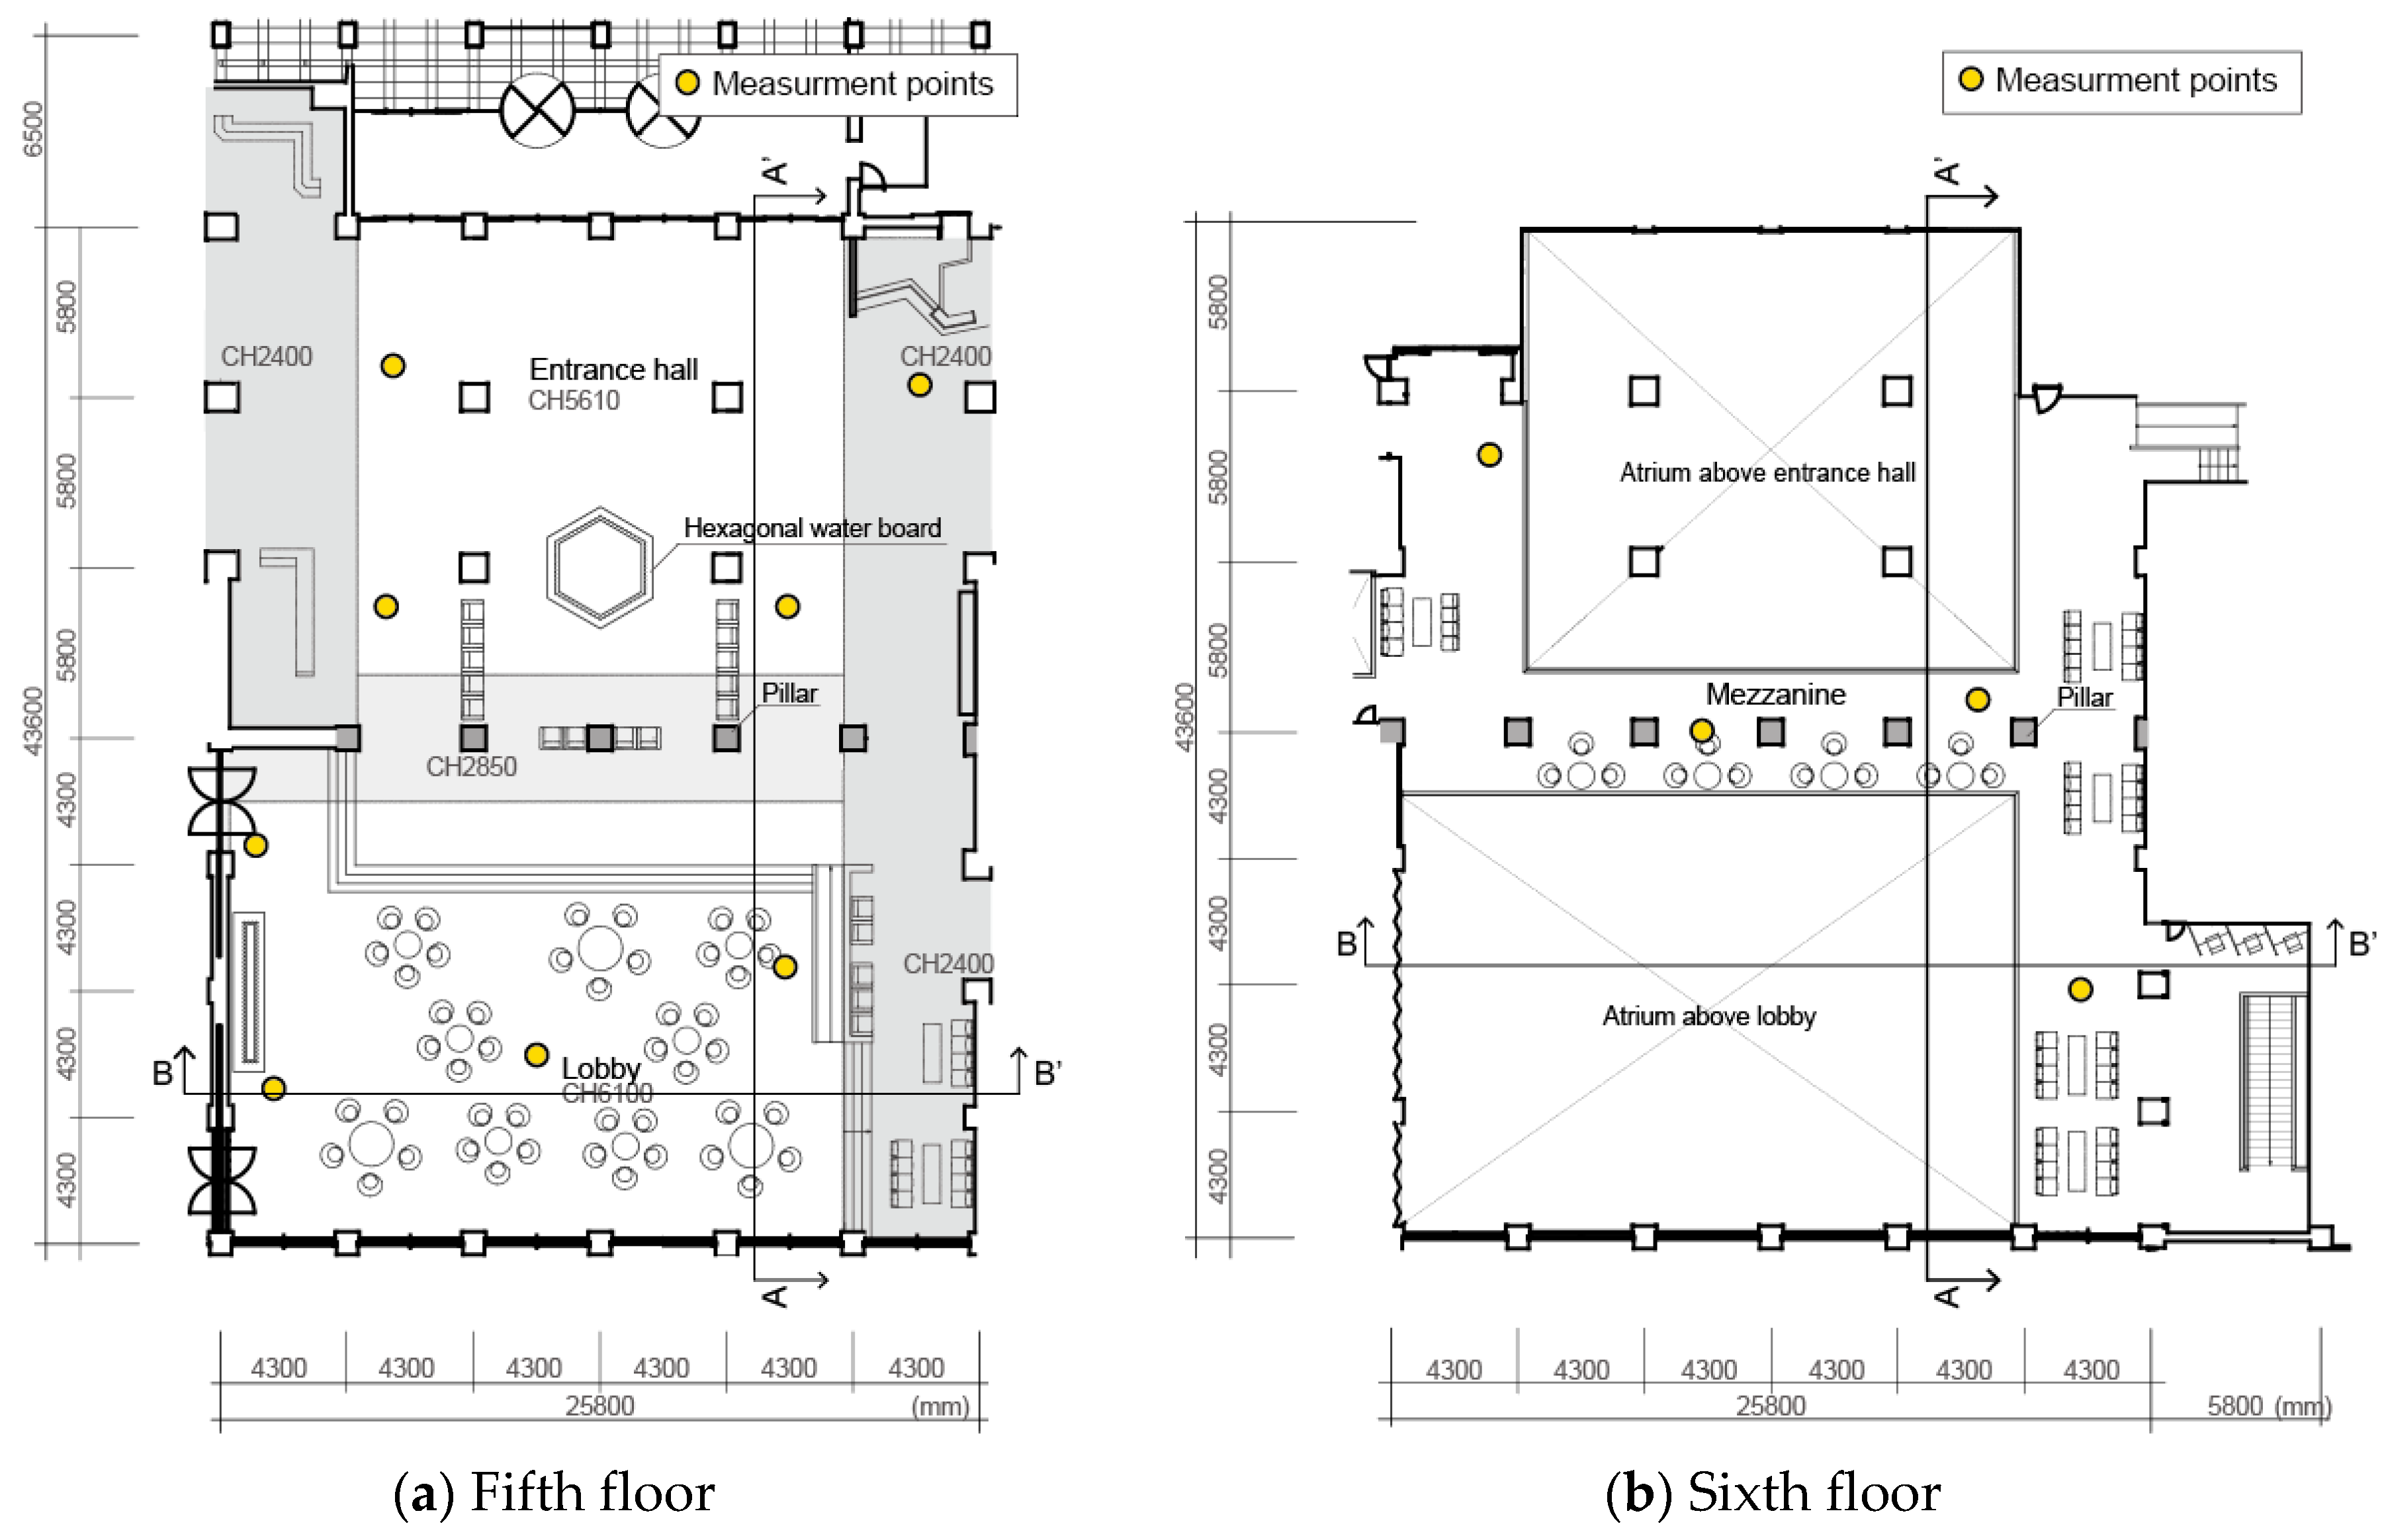
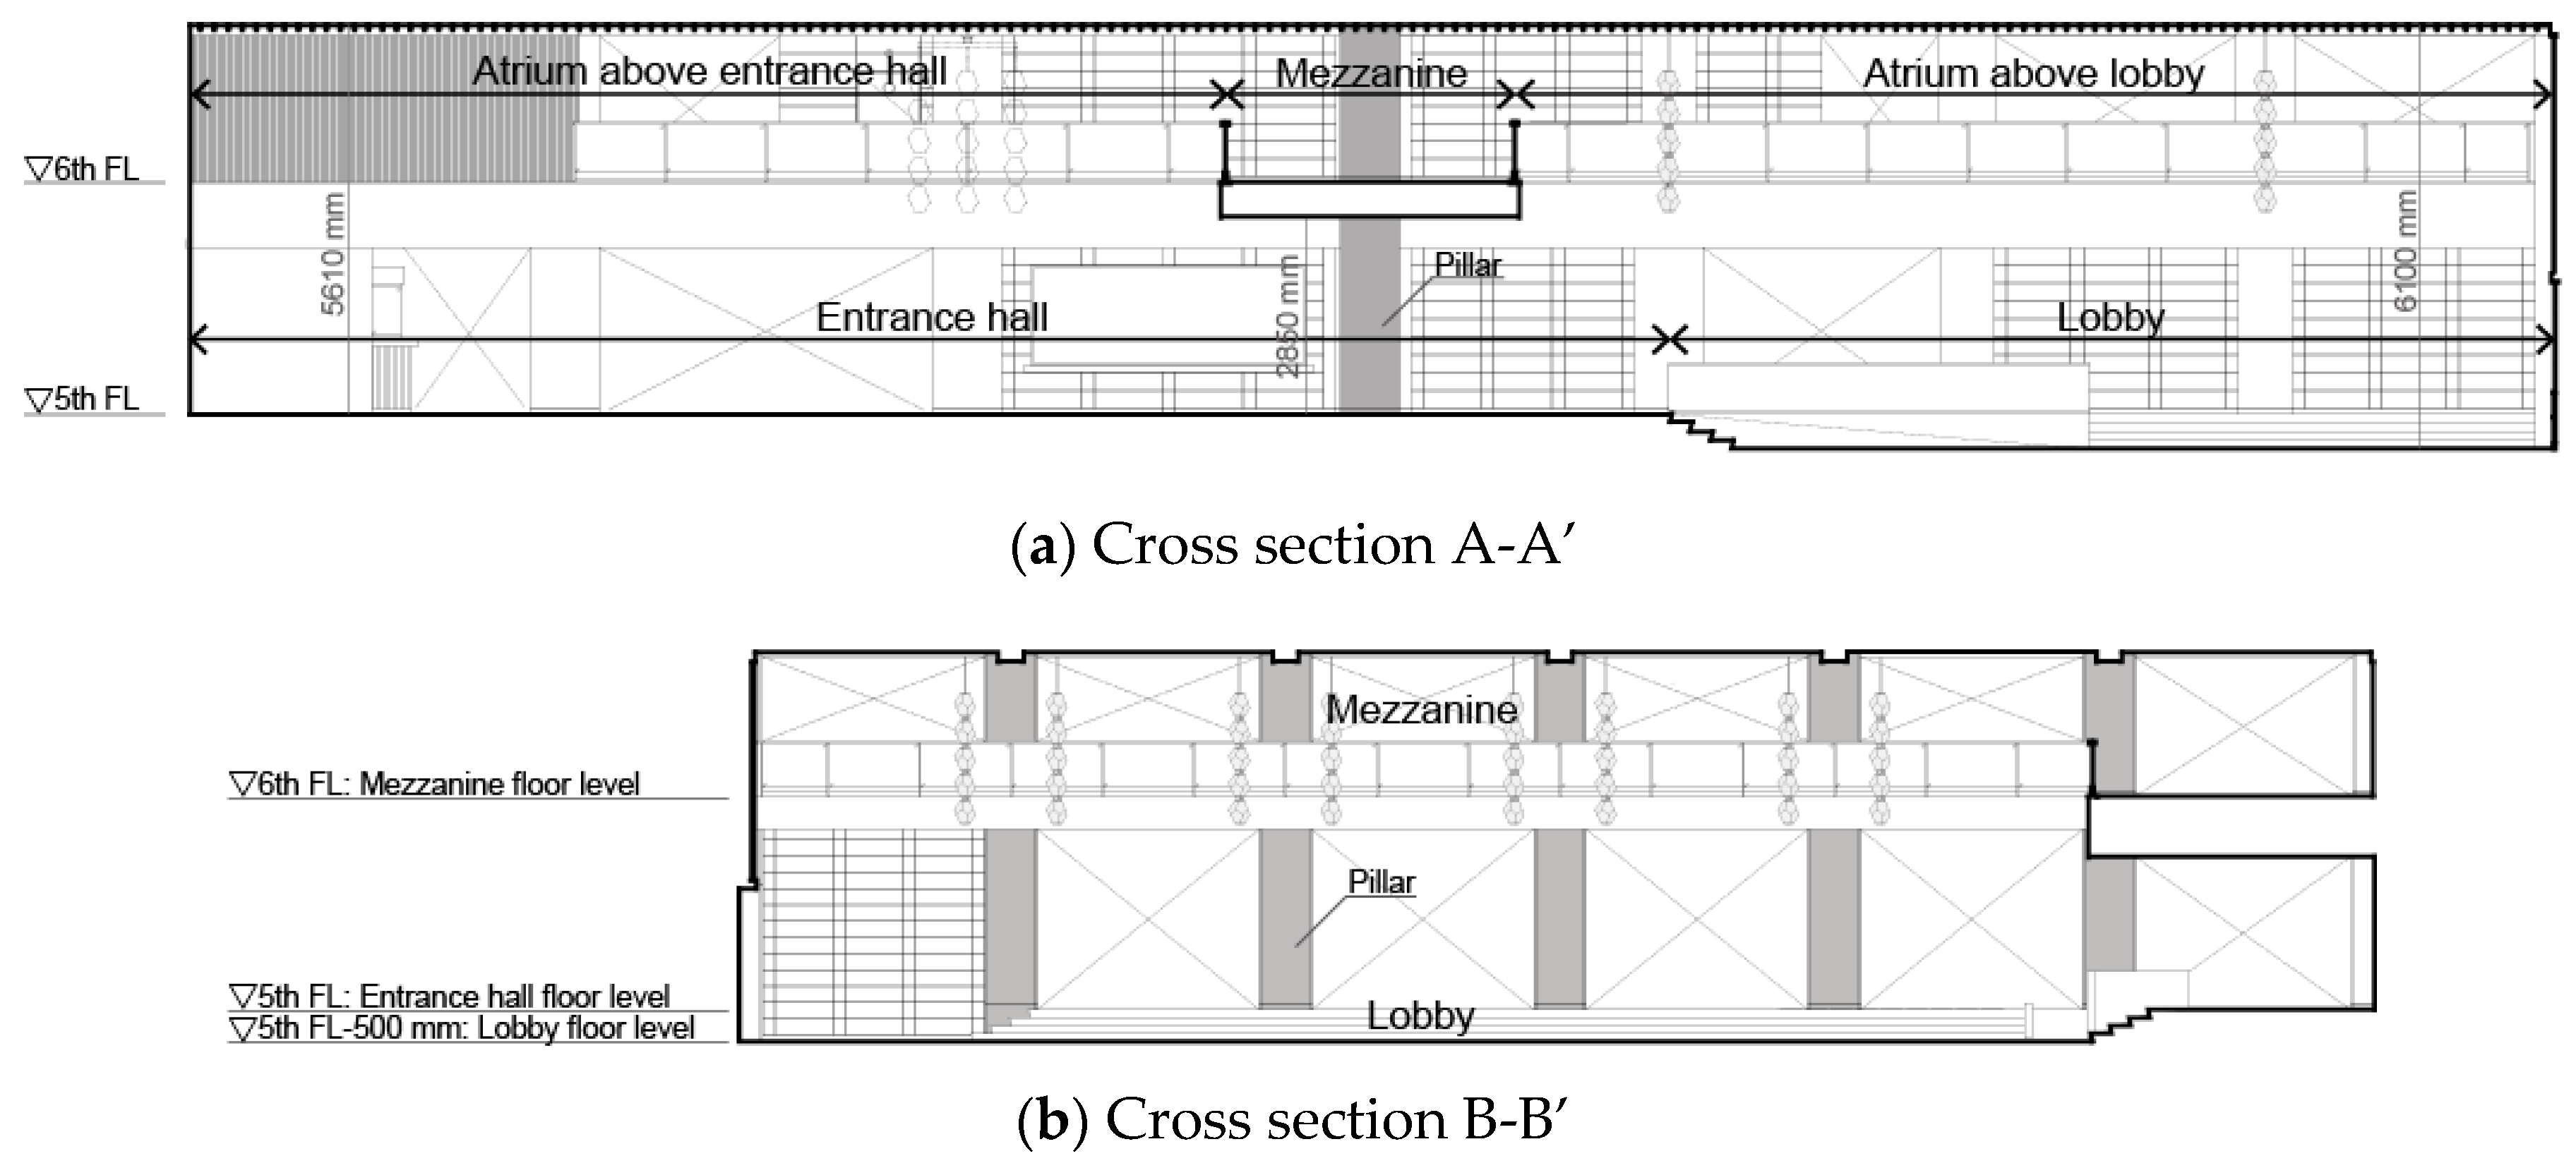
L1 at the points located 15 m to 20 m or more from the sound source. For both sound sources (S1 and S2), the positions 15 m to 20 m from the sound source represent the switching line of the lobby and entrance hall, where the rows of pillars are arranged in a plane, and the mezzanine narrows the cross section of the whole space. These architectural objects likely affect the area’s acoustic characteristic and make the acoustic characteristics of the indoor sound pressure level distribution differ from the attenuation based on the diffuse field theory. The rows of pillars presumably act as acoustic obstacles that produce an acoustic shadow and diffraction effects, as suggested by the above-described intelligibility. As the mezzanine reduces the area where sound propagates through the lobby and entrance hall (shown as
Figure 4b) and because both rooms behave with their own respective characteristics, they possibly have an effect similar to a coupled room [
15], where the exchange and attenuation of acoustic energy is made. At 2000 Hz and 4000 Hz of the one octave band, the value of the sound pressure levels has a large deviation from the diffuse field theoretical value
L1 and behaves close to the free sound field theoretical value
L2.
At 8000 Hz of the one octave band, further attenuation occurs, which is larger than the theoretical value
L2 but is considered to be an effect of air absorption [
14,
16]. The above suggests that the sound moving back and forth between the two rooms reaches one room after being attenuated in the other room. This suggests a correspondence with the reputation of the sound environment of the lobby.
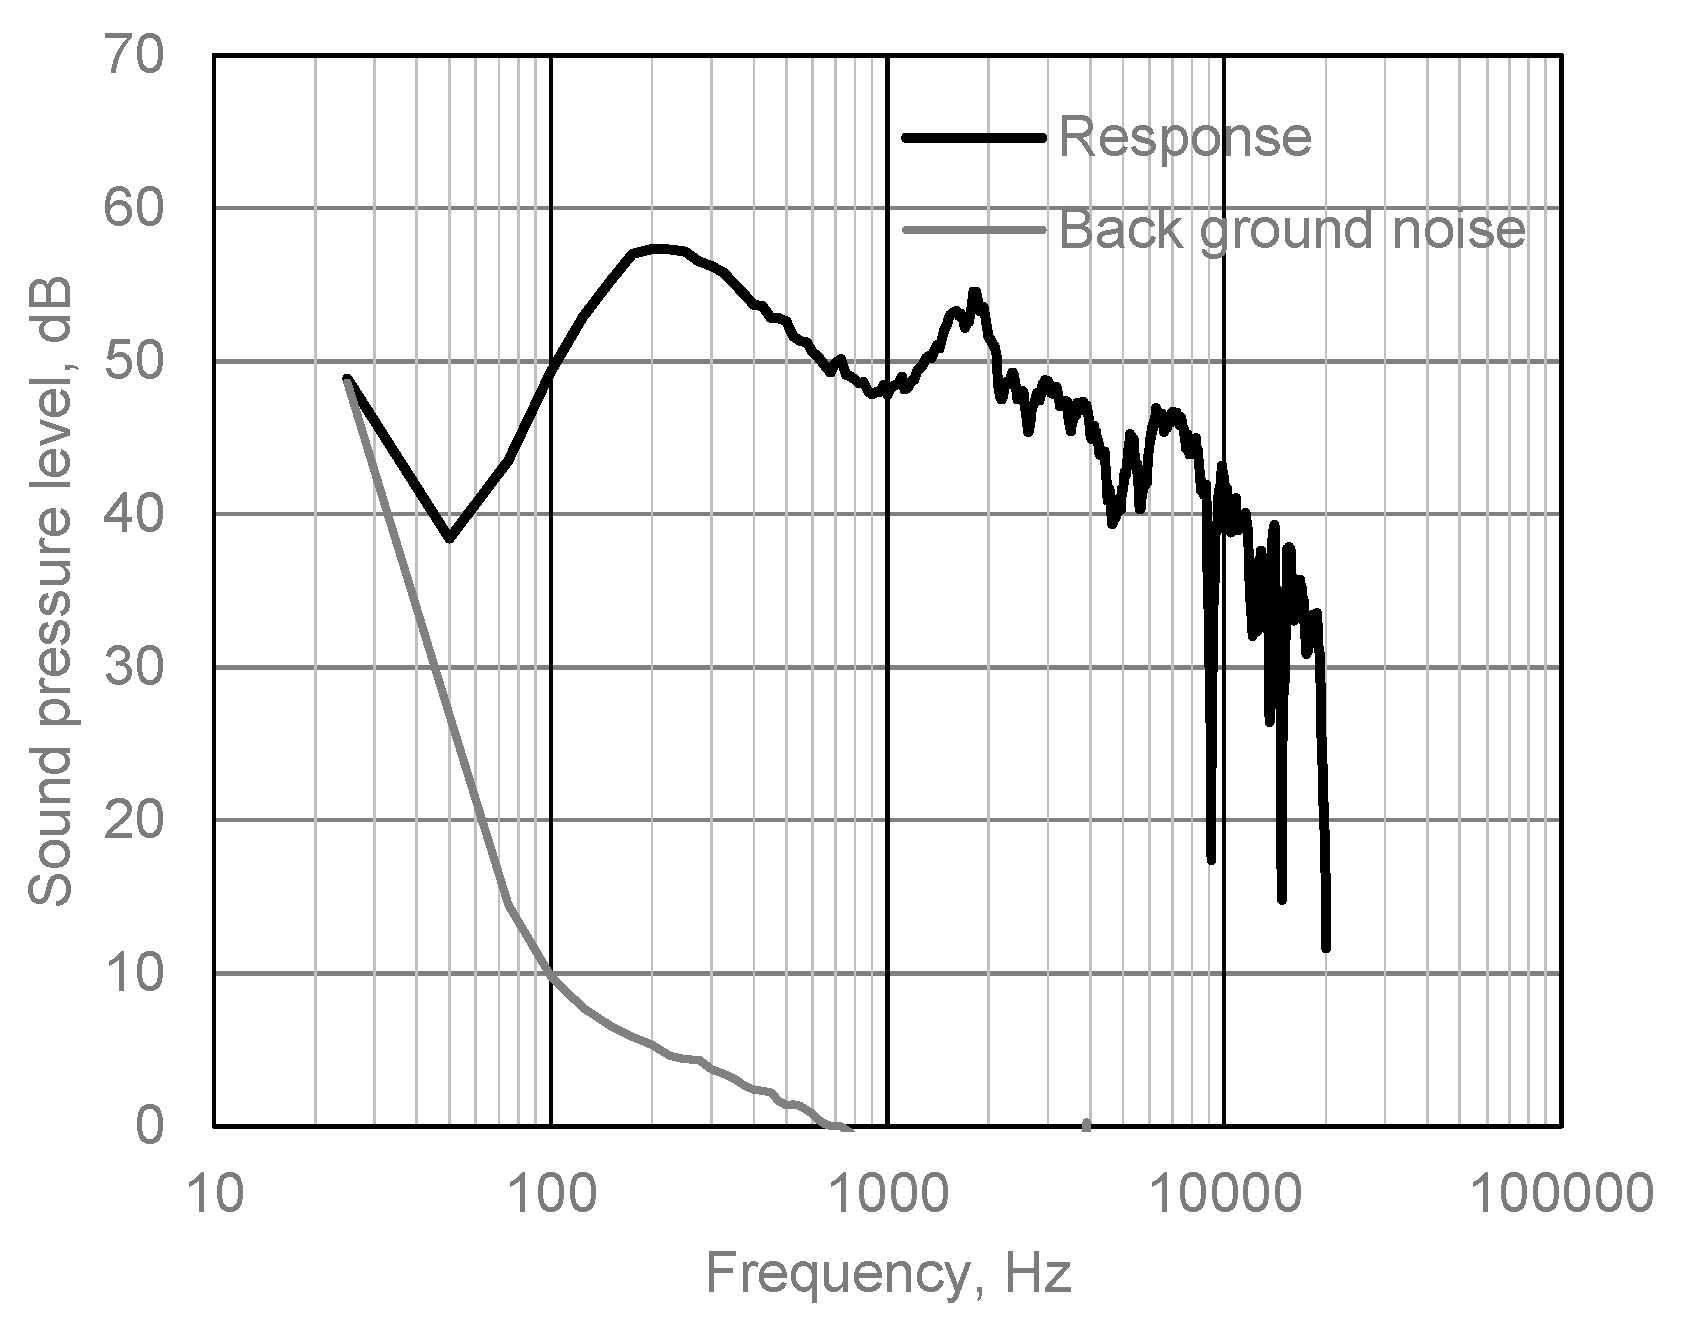
3.5. Reverberation Time
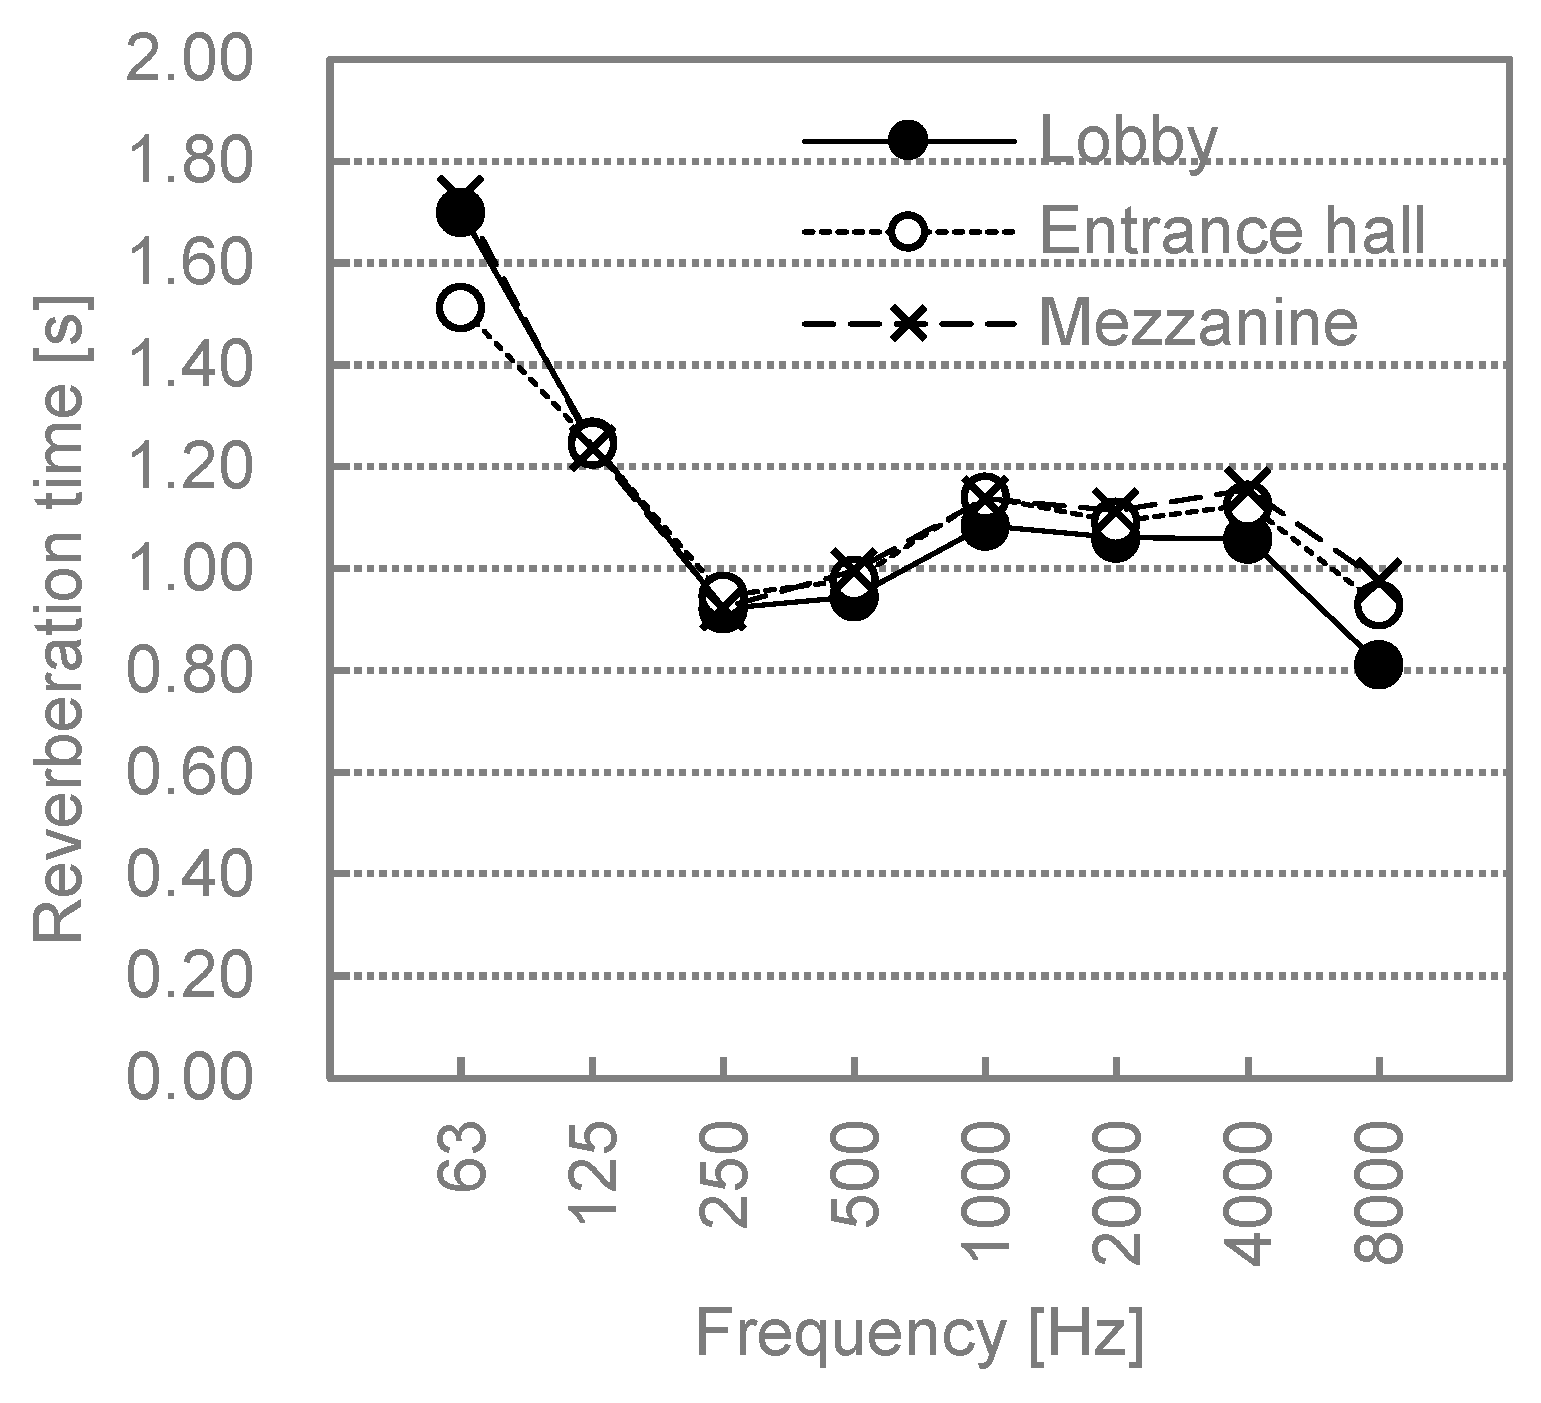
The frequency characteristics of the reverberation time of each one octave band are shown in
Figure 12. The reverberation time in the 500 Hz one octave band is 0.95 s for the lobby, 0.98 s for the entrance hall, and 1.00 s for the mezzanine. The results for each room were obtained by averaging the values of the measurement points in
Table 6, but if two results were obtained for one measurement point, the following values were used: The measurement point of D3 is sound source S1, E5 is sound source S2, and C8 and E8 are sound source S2. Each reverberation time of the measurement point is the average value of seven measurement values. In addition, the signal peak level to background noise level ratios are 30 dB at 63 Hz and more than 45 dB in the other frequency bands.
Next, it was confirmed whether the sound source position was affected by the reverberation time. The reverberation time was compared to measure the points of the lobby (D3), entrance hall (E5), and mezzanine (C8 and E8) with each sound source position. The differences in the reverberation time for 63 Hz to 8000 Hz of the one octave band are 1–15% for the lobby, 1–29% for the entrance hall, and 1–25% for the mezzanine. Though mainly studying music sources, Tahara et al. [
17] suggested that the reverberation time discrimination threshold in an actual indoor sound field is about 10% for 500 Hz–1000 Hz of the one octave band. This study corresponds to the conclusions of Knudsen–Harris [
18]. The differences that exceeded 10% in this measurement were mainly around 63 Hz and 8000 Hz of the one octave band. In these frequency bands, the assumption of a diffuse sound field possibly does not hold because a low frequency range is generally susceptible to the influence of the normal mode of vibration of a room, and the high frequency range obtains much sound absorption due to air absorption. For the other frequencies, the 500 Hz in the lobby and the 2000 Hz in the mezzanine of C8 have a difference greater than 10%. The difference in the lobby is not significant, with the reverberation time of sound source S1 being 12% and that of sound source S2 being 10%. The difference in the mezzanine is also not great, with the reverberation time of sound source S1 being 14% and that of sound source S2 being 13 %. Although the source position may affect the reverberation time, this survey did not determine whether there is an audible difference.
We compared the values of the reverberation time at 500 Hz with the values of the optimum reverberation time [
19], which was proposed both empirically and theoretically by many researchers as a function of the room volume. The values of the reverberation time at 500 Hz are comparable to the values that Beranek recommended for the conference room and those that Knudsen–Harris recommended for lectures and conversations in the main rooms. The reverberation times of the lobby and the entrance hall were found to be suitable for rooms in which conversations are the main purpose. This tendency is seen when the lobby and entrance hall are regarded as separate rooms and also when the rooms are regarded as an integrated room. This result corresponds to the reputation of the sound environment of the lobby. The appropriateness of the reverberation time with respect to the space use is one of the factors evaluated for the sound environment of the lobby.
4. Conclusions
We sought to better understand the legendary sound environment of the main lobby of “Hotel Okura Tokyo”, which has been evaluated worldwide. As a result, the following factors that correspond to the good reputation of the lobby’s sound environment were clarified. Most of the results are important elements that affect speech intelligibility, so we concluded that the good reputation of the lobby’s sound environment may be due to the superb speech intelligibility in the room. In addition, results 1 and 2 seem to have a relationship with the potential demands of the city’s hotel users. We also showed that these results may have been influenced by architectural objects, such as the rows of pillars, the hexagonal water board, and the mezzanine, as well as the floor plan. Based on our results, some conclusions can be drawn:
The sound environment of the lobby is not strongly affected by the degree of crowdedness and the position in the room and remains a stable space against ambient noise.
The indoor noises of the lobby, entrance hall, and mezzanine while air-conditioning is on are appropriate for hotel use, with noise criteria, NC curves of NC-30 to NC-40.
The lobby has good speech intelligibility, and people can easily talk in the same room. However, the intelligibility between different rooms is inferior.
There is a tendency for sound to have more attenuation from the entrance hall to the lobby than vice versa.
The reverberation times of the lobby and the entrance hall were evaluated as being suitable for rooms in which conversations are the main purpose.


