Article

Piezoelectric Electro-Mechanical Impedance (EMI) Based Structural Crack Monitoring

1
Key Laboratory of Metallurgical Equipment and Control Technology, Wuhan University of Science and Technology, Ministry of Education, Wuhan 430081, China
2
Hubei Key Laboratory of Mechanical Transmission and Manufacturing Engineering, Wuhan University of Science and Technology, Wuhan 430081, China
*
Author to whom correspondence should be addressed.
Appl. Sci. 2020, 10(13), 4648; https://doi.org/10.3390/app10134648
Submission received: 19 May 2020 / Revised: 19 June 2020 / Accepted: 2 July 2020 / Published: 5 July 2020
(This article belongs to the Special Issue Novel Approaches for Structural Health Monitoring)

Abstract

:
To detect small cracks in plate like structures, the high frequency characteristics of local dynamics were studied with the piezoelectric electro-mechanical impedance (EMI) method, and damages were monitored by the changes of the EMI. The finite element simulation model of EMI was established, and numerical analysis was conducted. The simulation results indicated that the peak frequency of the piezoelectric admittance signal is a certain order resonance frequency of the structure, and the piezoelectric impedance method could effectively detect the dynamic characteristics of the structure. The piezoelectric admittance simulation and experimental study of aluminum beams with different crack sizes were performed. Simulation and experimental results revealed that the peak admittance frequency decreases with the increase of crack size, and the higher resonance frequency is more sensitive to the small-scale damage. The proposed method has good repeatability and strong signal-to-noise ratio to monitor the occurrence and development of small-scale crack damage, and it has an important application prospect.

1. Introduction

During the life cycle of some engineering structures, cracks will occur due to the effects of dynamic load [1,2], varying temperature, environmental corrosion [3,4,5] and other factors [6]. If the cracks are not detected and restrained after the initial occurrence, the crack growth will accelerate, leading to eventual structural failure with potentially significant losses. To avoid catastrophic consequences caused by cracks in structures, it is of particularly importance to detect initial cracks in these structures. At present, the techniques of structural crack detection include magnetic particle detection, ultrasonic detection and radiographic detection, among others [7,8]. Most of the above methods have their shortcomings, such as limited applicability, low detection efficiency and inability to detect crack growth in real time.
Compared with the traditional detection methods mentioned, structural health monitoring (SHM) [9,10,11] is advancing rapidly because of its real time capacity. In SHM, vibration-based structural damage detection is a widely used technology. Since for any structure, the structural dynamic characteristic is a function of its structural parameters such as stiffness, mass and damping, structural damage means the change of structural parameters, and the change of the structural parameters will inevitably lead to the change of structural dynamic characteristics, such as resonance frequency [12,13] and vibration mode shapes [14,15,16]. Vibration information of structures in different states can be collected by real-time monitoring with sensors, which are installed on the structure. Then, by analyzing the vibrational signal, the dynamic characteristic changes such as resonance frequency, vibration mode, modal curvature and modal stiffness can be extracted and taken as the damage feature in the structural system [17,18,19]. The vibration-based monitoring method has great advantages, such as its low cost and real-time capacity. However, vibration-based damage detection and identification technologies use the low-order dynamic information of the structure and ignore the higher-order dynamic characteristics which are more sensitive to small scaled cracks.
Therefore, with the traditional strain gauge, scholars have conducted research on the early damage detection based on strain mode. Lakshmi et al. [20] used the strain mode to monitor the cracks of beams, and used the change of resonance frequency to locate the damage position. Tondreau [21] utilized strain mode shapes and local mode filters, combined with sensor arrays and statistical control charts to identify damage on the beam automatically. Strain mode is a feasible method to detect the early damage; however, this method needs the sensors installed very close to the crack location, which limits its application.
Since the piezoelectric material has small size, the ability to act as both a sensor and an actuator simultaneously, and can be embedded into the structure to form intelligent structures, piezoelectric sensing technology has been applied in SHM. Piezoelectric sensing technology can be adopted as passive sensing methods such as acoustic emission technique [22], active sensing method such as vibro-acoustic modulation technique [23], and piezoelectric impedance method. Acoustic emission technology was successfully applied to detect rolling contact fatigue damage [24] and crack initiation and propagation of low-speed rotating shaft [25]. However, due to the limitation of environment and application conditions, acoustic emission technology is difficult to apply to real time monitoring of structures in a wide range.
The vibro-acoustic modulation method implements the vibro-modulation technique with an ultrasonic vibration field transmitted through a cracked specimen undergoing an additional low frequency structural vibration. If the specimen is damaged, the amplitude modulation appears; otherwise, the two vibration fields do not interact [26]. In combination with vibro-acoustic modulation, Lee et al. [27] proposed an algorithm that can comprehensively analyze the results by comparison with ambient noise, and cracks are detected correctly in damaged specimens. The method is reported as being sensitive to the initial state of opening and closing of the crack [28,29], and early bolt looseness [23]. Wang et al. [30] extended the original vibro-acoustic modulation method by using piezoceramic transducers and ascertained a quantitative correlation between vibro-acoustic nonlinear distortion and the degree of bolt loosening.
Piezoelectric active sensing technology is also widely used in bolt looseness detection [31,32], self-sensing CFRP (carbon fiber reinforced polymer) fabrics in reinforced concrete structures [33], bond slips between the reinforcing bars and concrete [34], and in damage shape and size detection of alloy materials [35,36,37] among other applications. Piezoceramic-based smart aggregate pairs, such as actuators and sensors for stress wave propagation within concrete structures, can be used for stress wave communication and remain effective under low signal-to-noise ratios [38,39,40]. Parvasi et al. [41] investigated the effect of piezoelectric coefficients on the characteristics of generated waves with actuating and sensing compressive, flexural, and shear wave modes in metallic plates, using compressive and shear piezoelectric transducers. The piezoelectric material is used to excite the ultrasonic signal and receive the ultrasonic signal after the crack and other defects. The crack defect is identified and located by techniques such as signal feature extraction and imaging technology. Many scholars performed extensive research on damage imaging of cracks in metal or composite plate structures, including tomography [42], stress wave based imaging [43] and multi-delay-and-sum imaging algorithms [44,45]. Taylor et al. used piezoelectric guided waves to detect the small damage of composite rotor blades of wind turbines [46]. Dumoulin et al. [47] used a piezoelectric smart aggregate to study the derivation and development of cracks in concrete based on piezoelectric active sensing. With the time reversal technique combined with guided wave, Sohn and Park [48] utilized the piezoelectric arrays to conduct bridge damage detection, and proposed a symmetric index (SYMI) to evaluate the damage degree.
The piezoelectric impedance method is an active sensing method that uses only one transducer and is applied in the bolt looseness detection [49], stress monitoring [50] and structural damage diagnosis [51]. It is sensitive to structural small-scale damage due to its high frequency detection band, and can realize on-line monitoring under certain conditions. Zagrai et al. [52] verified that the electro-mechanical impedance method can identify the presence of damage in a thin plate by theoretical and experimental study. Xu and Giurgiutiu [53] presented a low-cost impedance analyzer for active structural health monitoring, and succeeded detecting a disbonding on a spacecraft panel of aluminum. Bhalla et al. [54] and Yang et al. [55] interrogated the damage condition of the structure by extracting the changes of equivalent mass, stiffness and damping of the structure through the piezoelectric impedance signature before and after damage, establishing a damage interrogation method. Ai et al. [56] applied the piezoelectric impedance technology to monitor the corrosion process of metals, and the mechanical impedance of the host structure was extracted from the electromechanical coupling impedance by the united mechanical impedances (UMI) method. It found that the mechanical impedance damage index extracted by the proposed UMI method was better than that by the traditional method.
In this paper, the piezoelectric electro-mechanical impedance (EMI) was adopted for the detection of the small crack in a beam. By analyzing the piezoelectric admittance formula of the electromechanical coupling system and combining with the harmonic response analysis of the finite element method (FEM), it found that the local dynamic characteristics of the structure would change when cracks occur and propagate in the beam. This dynamic variation is represented by the shift of peak frequency in the imaginary part of the piezoelectric admittance spectrum. The method of piezoelectric admittance peak frequency shift was proposed for the detection of the small-scale crack detection with a relatively higher monitoring frequency band. An experimental device was constructed to measure the admittance signal of a piezoelectric patch installed on the structure by a precision impedance meter. The relationship between the peak frequency in the piezoelectric admittance spectrum and the change of the crack size was analyzed. The finite element simulation and experimental results show that the small crack in the beam can be detected by the proposed method.

2. Principle of Piezoelectric Electro-Mechanical Impedance Method

Because of its strong piezoelectric effect, a PZT (lead–zirconate–titanate) type piezoelectric transducer has been successfully used in SHM and is adopted in this research. For a PZT patch of length la, width ba, and thickness ha is bonded on a structure, based on the assumption of elastic connection (represented by a pair of stiffness springs 2Kstr) between piezoelectric material and host structure, as shown in Figure 1, Giurgiutiu and Zagrai [57] proposed an EMI model and the piezoelectric admittance expression is given as:
Y ( ω ) = i ω C [ 1 κ 31 2 ( 1 1 φ cot ( φ ) + K s t r / K P Z T ) ]
where ω is the angular frequency of excitation signal, ρ is the density of the PZT patch, κ 31 2 is the electromechanical coupling factor, φ = γ l a / 2 , while γ = ω / c is the wave number, c = 1 / ρ s 11 E is the wave speed, s 11 E is the mechanical compliance at zero field, C = l a b a ε ˜ 33 T h a 1 is the conventional capacitance of the PZT patch, Kstr is the stiffness of the host structure, K P Z T = A a / ( s 11 E l a ) is the stiffness of the PZT patch, A a = h a × b a is the cross-sectional area of PZT patch, and ε ˜ 33 T is dielectric constant at zero stress. The expressions in Equations (1) cover the complete frequency spectrum and encompass both structure and sensor dynamics, overcoming low-frequency structure-focused analysis of Liang’s model [58].
Equation (1) reveals that the change of admittance Y of the coupled system is only related on the host structural stiffness Kstr while the parameters of piezoelectric material and host structural material are determined. In order to find out the effect of the stiffness of the host structure on the admittance signal, Equation (1) is derived with ω simultaneously on both sides. Here, we expand the cotangent function by a Taylor series and substitute the first two terms in the Taylor series into Equation (1):
d Y d ω = i C [ 1 κ 31 2 + κ 31 2 1 + K s t r K P Z T + l a 2 12 c 2 ω 2 ( 1 + K s t r K P Z T l a 2 12 c 2 ω 2 ) 2 ]
Some peak values in the admittance signature represent the resonant frequency of the host structure. In this case, the peak frequency is a certain order resonance frequency, ωn, of the coupled system of the host structure and the piezoelectric patch. Thus, in the position of the resonance frequency, ωn, the derivative of piezoelectric admittance signal equals zero, i.e., d Y / d ω n = 0 . In Equation (2), both c and KPZT are complex.
Considering that the imaginary part of c and KPZT depend on the material damping and the effect of material damping is small, the imaginary part is neglected in order to simplify the analysis process. Meanwhile, let κ 31 2 = a + b i in Equation (2). By extracting the imaginary part of Equation (2) and making it equal to zero, the expressions about Kstr and ωn can be obtained as
( l a 2 12 c 2 ) 2 ω n 4 l a 2 12 c 2 ( 3 + K s t r / K P Z T ) ω n 2 + ( 1 + K s t r / K P Z T ) K s t r / K P Z T = 0
Solving Equation (3) results in,
ω n 2 = 6 c 2 3 + 2 K s t r / K P Z T 9 + 8 K s t r / K P Z T l a 2
Equation (4) shows that the peak frequency ωn in the piezoelectric admittance signature depends on the stiffness of the host structure. When a crack occurs and propagates in the host structure, the local stiffness of the host structure will reduce. While the local stiffness of the host structure decreases, the peak frequency in the piezoelectric admittance signature also decreases [59]. The piezoelectric patch bonded near the crack can transform this stiffness variation into peak frequency changes in the piezoelectric admittance signature. By analyzing the peak frequency changes in the piezoelectric admittance signature, the structural crack can be detected and thus it provides a theoretical basis for monitoring the crack status of a host structure with the peak frequency changes of the piezoelectric impedance.

3. Finite Element Analysis of Piezoelectric Impedance

To verify the above proposed method, the finite element analysis (FEA) is adopted to simulate the piezoelectric impedance and to find out the influence of crack and crack size on the peak frequency in the piezoelectric admittance signature, i.e., the local resonance frequency of the coupled system. The host structure is an aluminum alloy beam with a dimension of 250 × 30 × 5 mm. A PZT patch, with a size of 8 × 7 × 1 mm, is bonded on the center of the beam surface with epoxy resin adhesive. The adhesive layer thickness is kept 0.125 mm. The properties of the piezoelectric patch are listed in Table 1 [60], and the material constants of the adhesive layer and the aluminum alloy beam are listed in Table 2.
Cracks are simulated by setting rectangular grooves on a beam. The width of each rectangular groove is 0.5 and the depth is 1 mm. Only the length of groove is changed to simulate the different crack sizes. The length of the groove is set as 0, 6 and 12 mm, respectively. The location of the piezoelectric patch and the crack on the beam is shown in Figure 2. In the numerical analysis, free boundaries are set at both ends of the beam. The system damping ratio is set to 0.005.
The finite element model of the cracked beam with piezoelectric patch is built, as shown in Figure 3a. The model is meshed by a mapping grid with an element size of 2 mm, except where the crack generates and the piezoelectric patch is bonded. For the region where the crack is located, the mapping mesh with the element size of 0.25 mm is used. In the vicinity of the crack, the free mesh is used to gradually transfer the specialized element size of 0.25 mm to the overall model element size of 2 mm. The mesh at the crack is detailed in Figure 3b. The piezoelectric patch is discretized with an element size of 0.5 mm by mapping, and the adhesive layer under the piezoelectric patch is discretized by free mesh with a 1 mm element size gradually changing to a 2 mm element size.
In the simulation, the modal analysis is firstly carried out to obtain the resonance frequency, and then the piezoelectric harmonic analysis is performed. In the piezoelectric harmonic analysis, the top and bottom surface piezoelectric degrees of the piezoelectric patch is coupled, and the voltage of 1 V and 0 V are applied on the top and bottom surfaces of the piezoelectric patch respectively to simulate 1 V AC voltage. The selected frequency range in the harmonic analysis is near the modal resonant frequencies obtained from the modal analysis. The time-varying charge on the piezoelectric surface is obtained, and then the piezoelectric impedance, piezoelectric admittance and other information are calculated. Comparing the results of the modal analysis with the piezoelectric admittance analysis, it is found that the modal resonant frequencies correspond approximately to the peak frequencies in the admittance signature, indicating that some of the peak admittance frequencies are the resonant frequencies of the coupled system. The peak frequencies in the admittance signature can reflect the local dynamic characteristics of the host structure with the piezoelectric patch.
After comparative analysis, the piezoelectric admittance around some resonant frequencies is simulated and analyzed with different crack sizes. The scanning frequency bands are selected around 19, 62 and 174 kHz, which is near the coupled structure resonance frequencies.
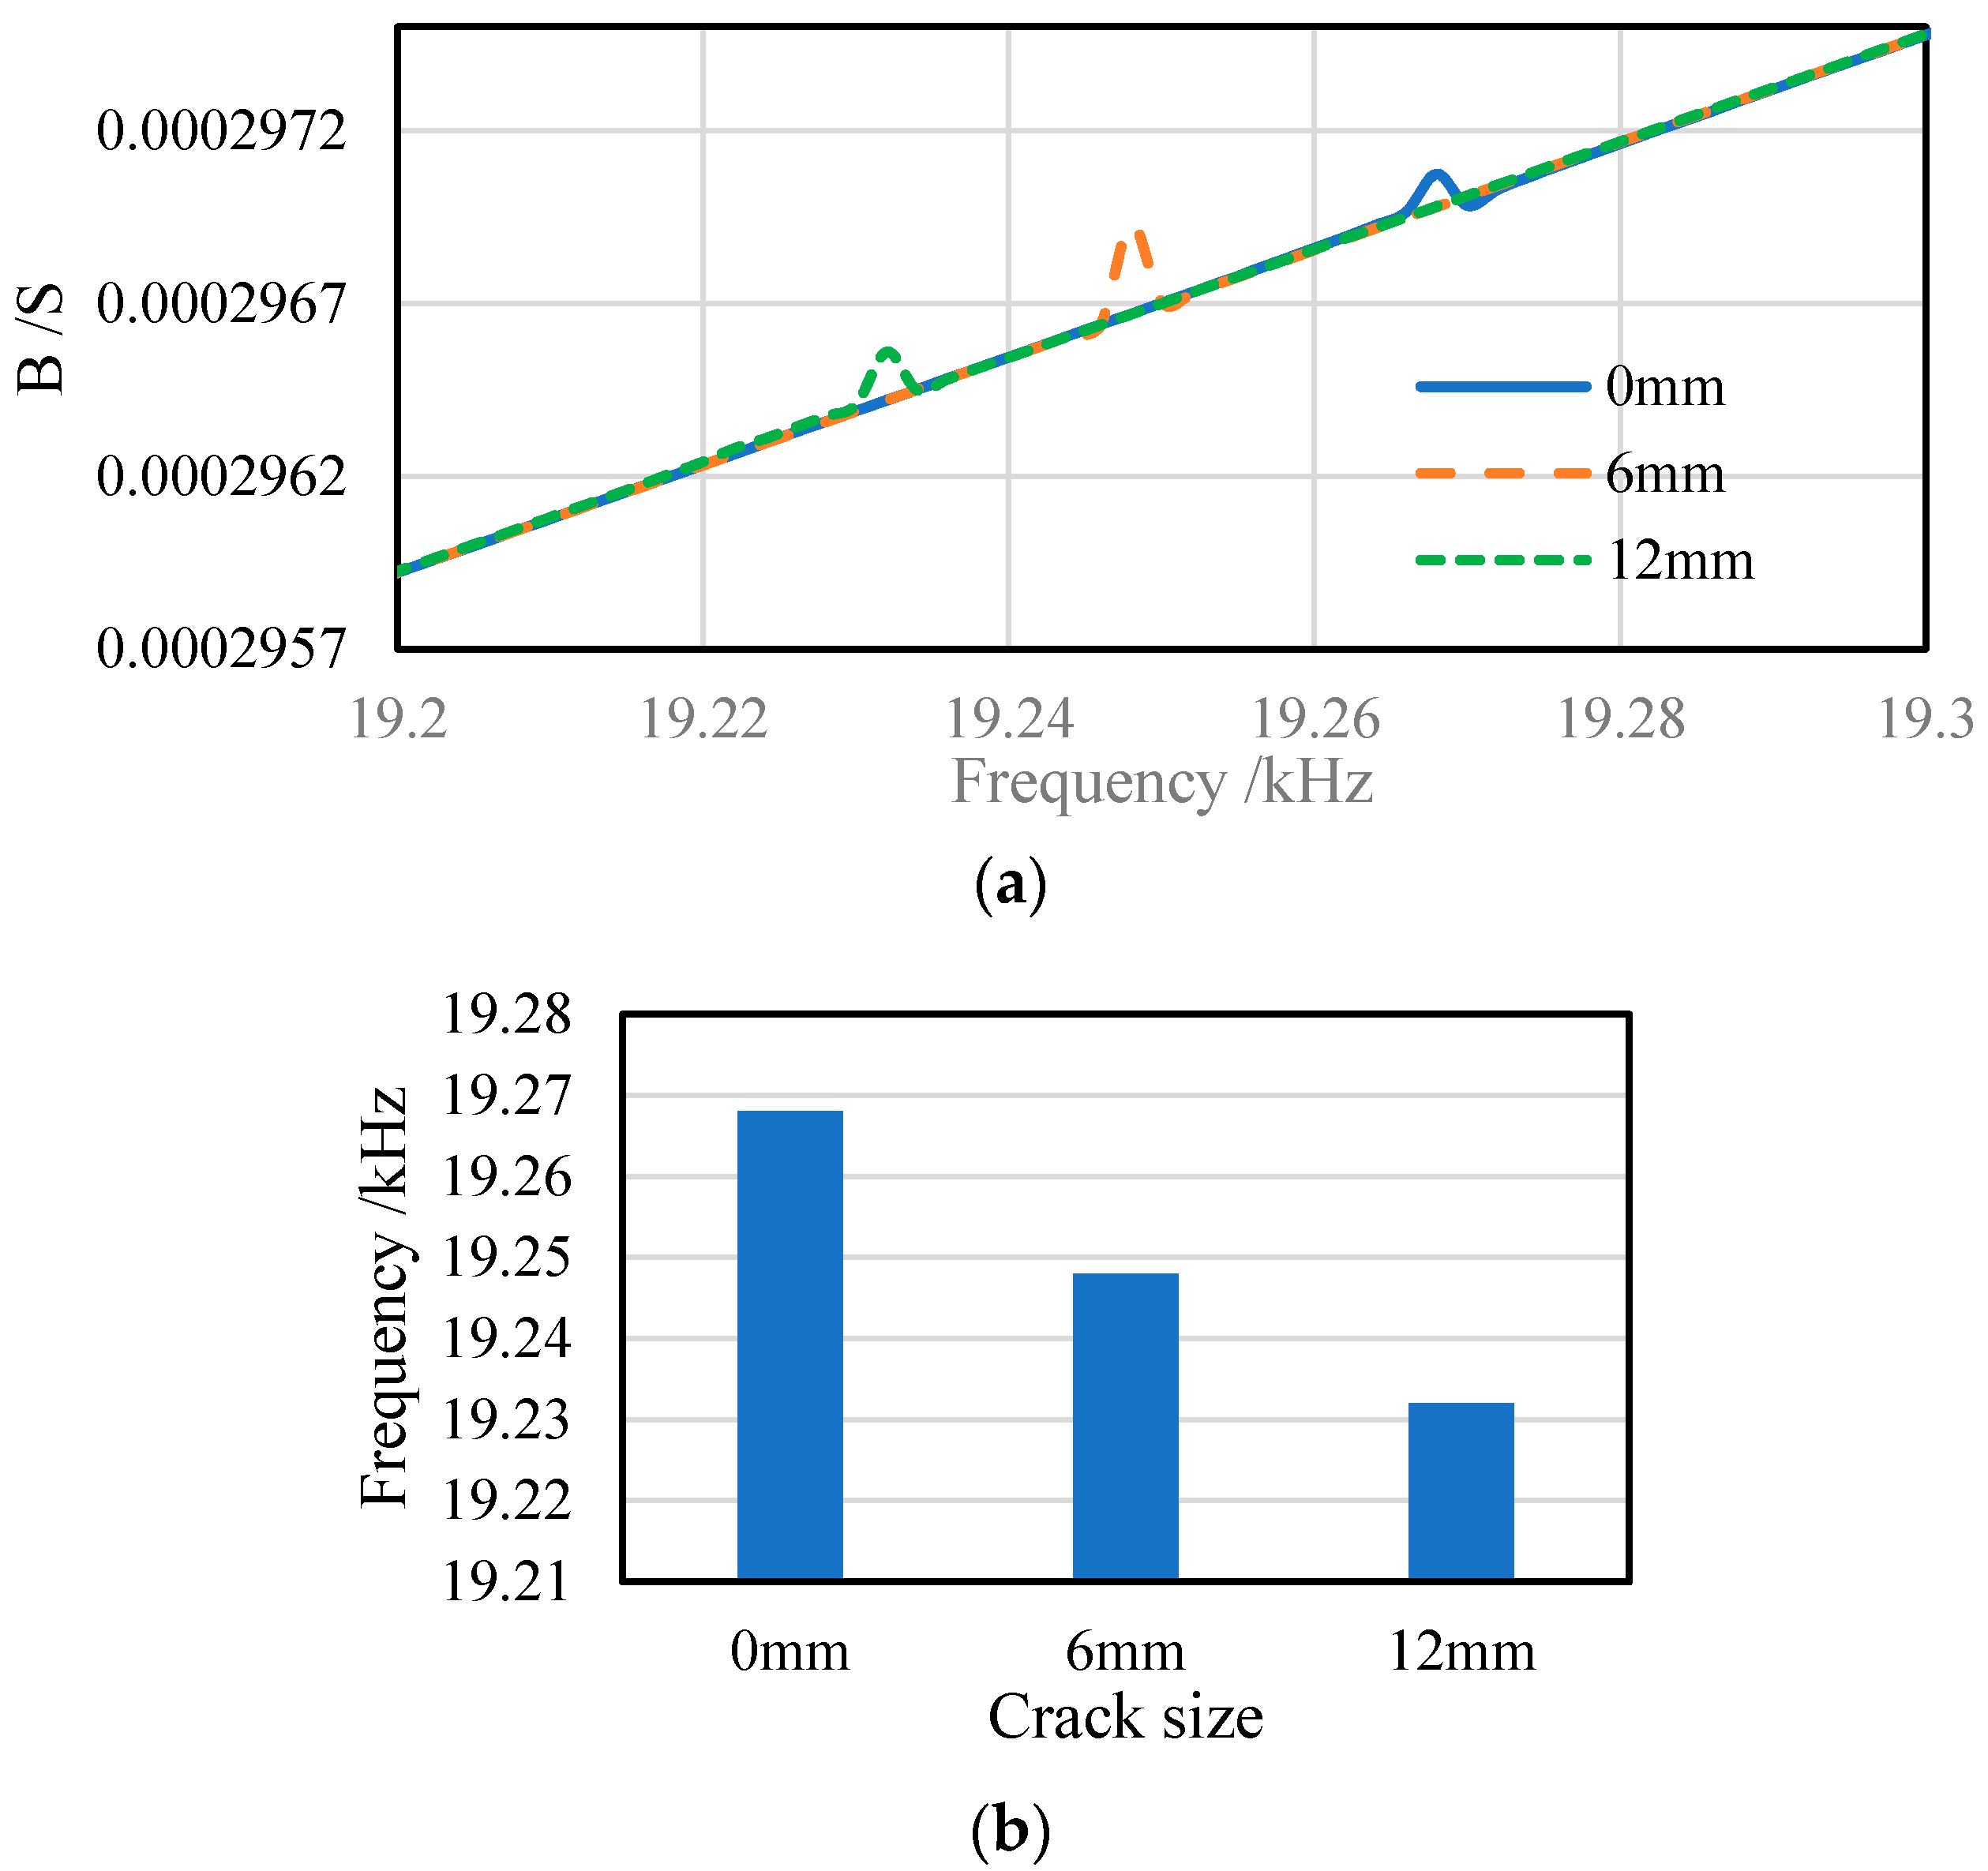
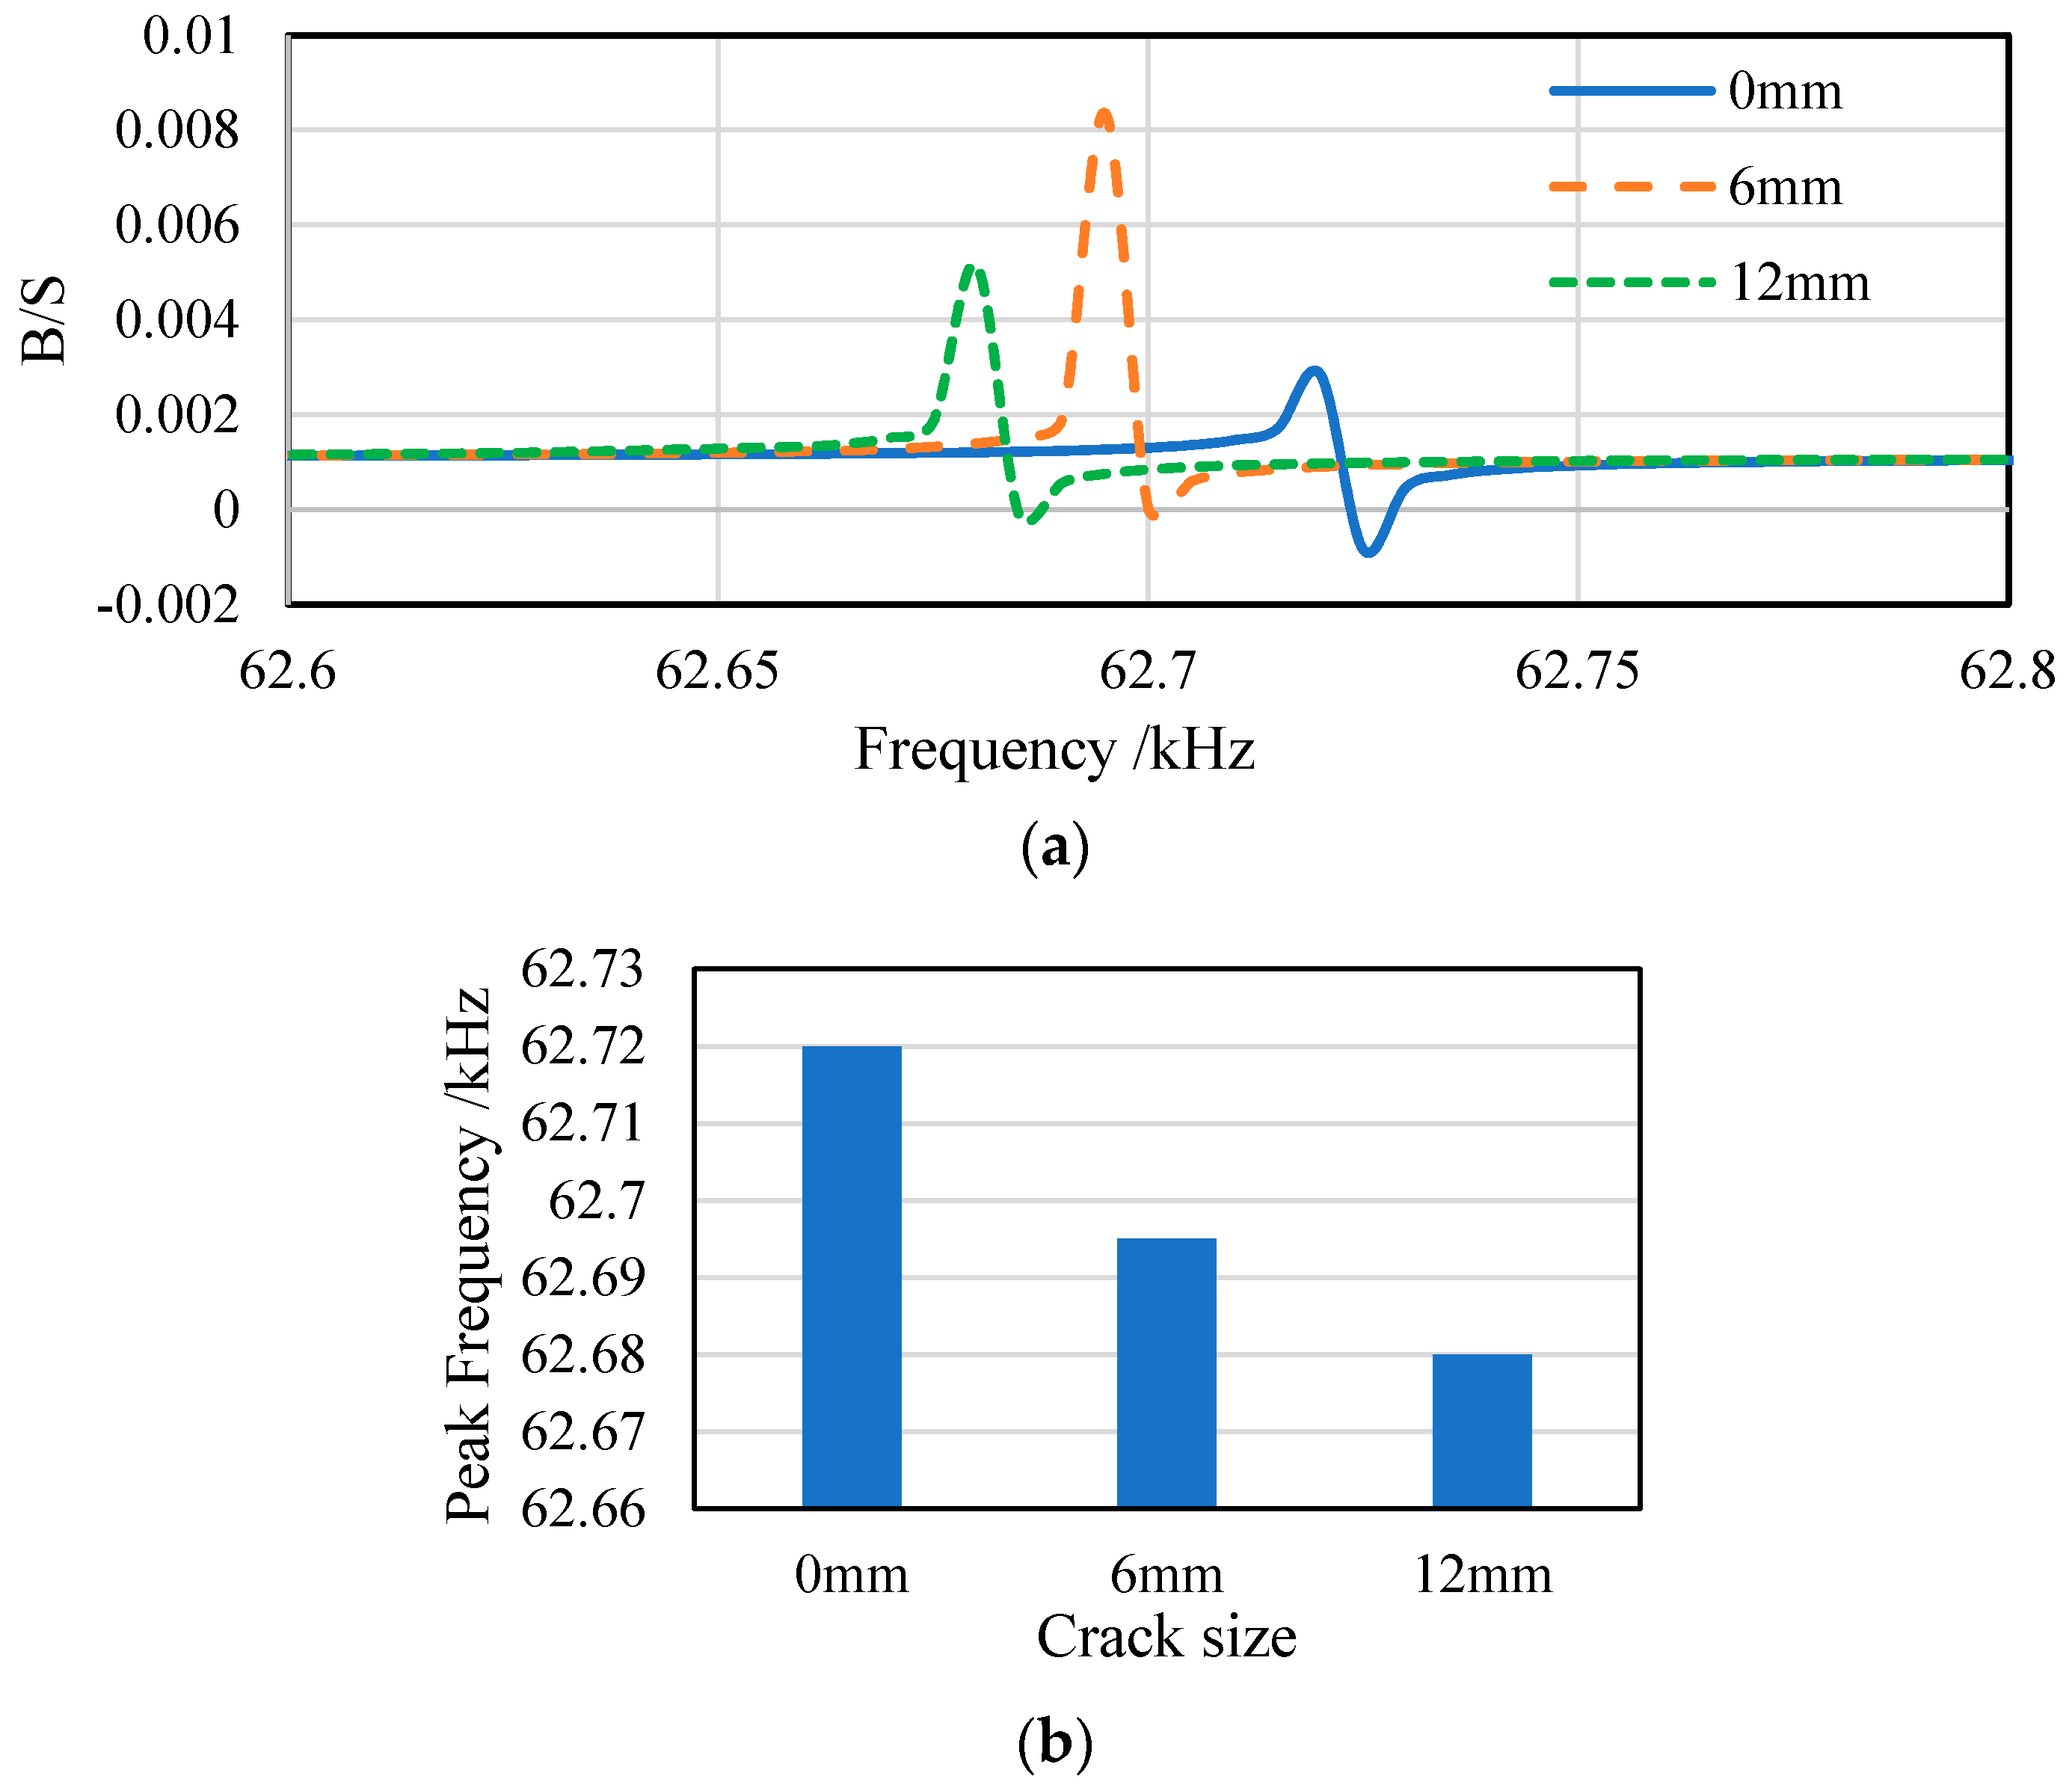
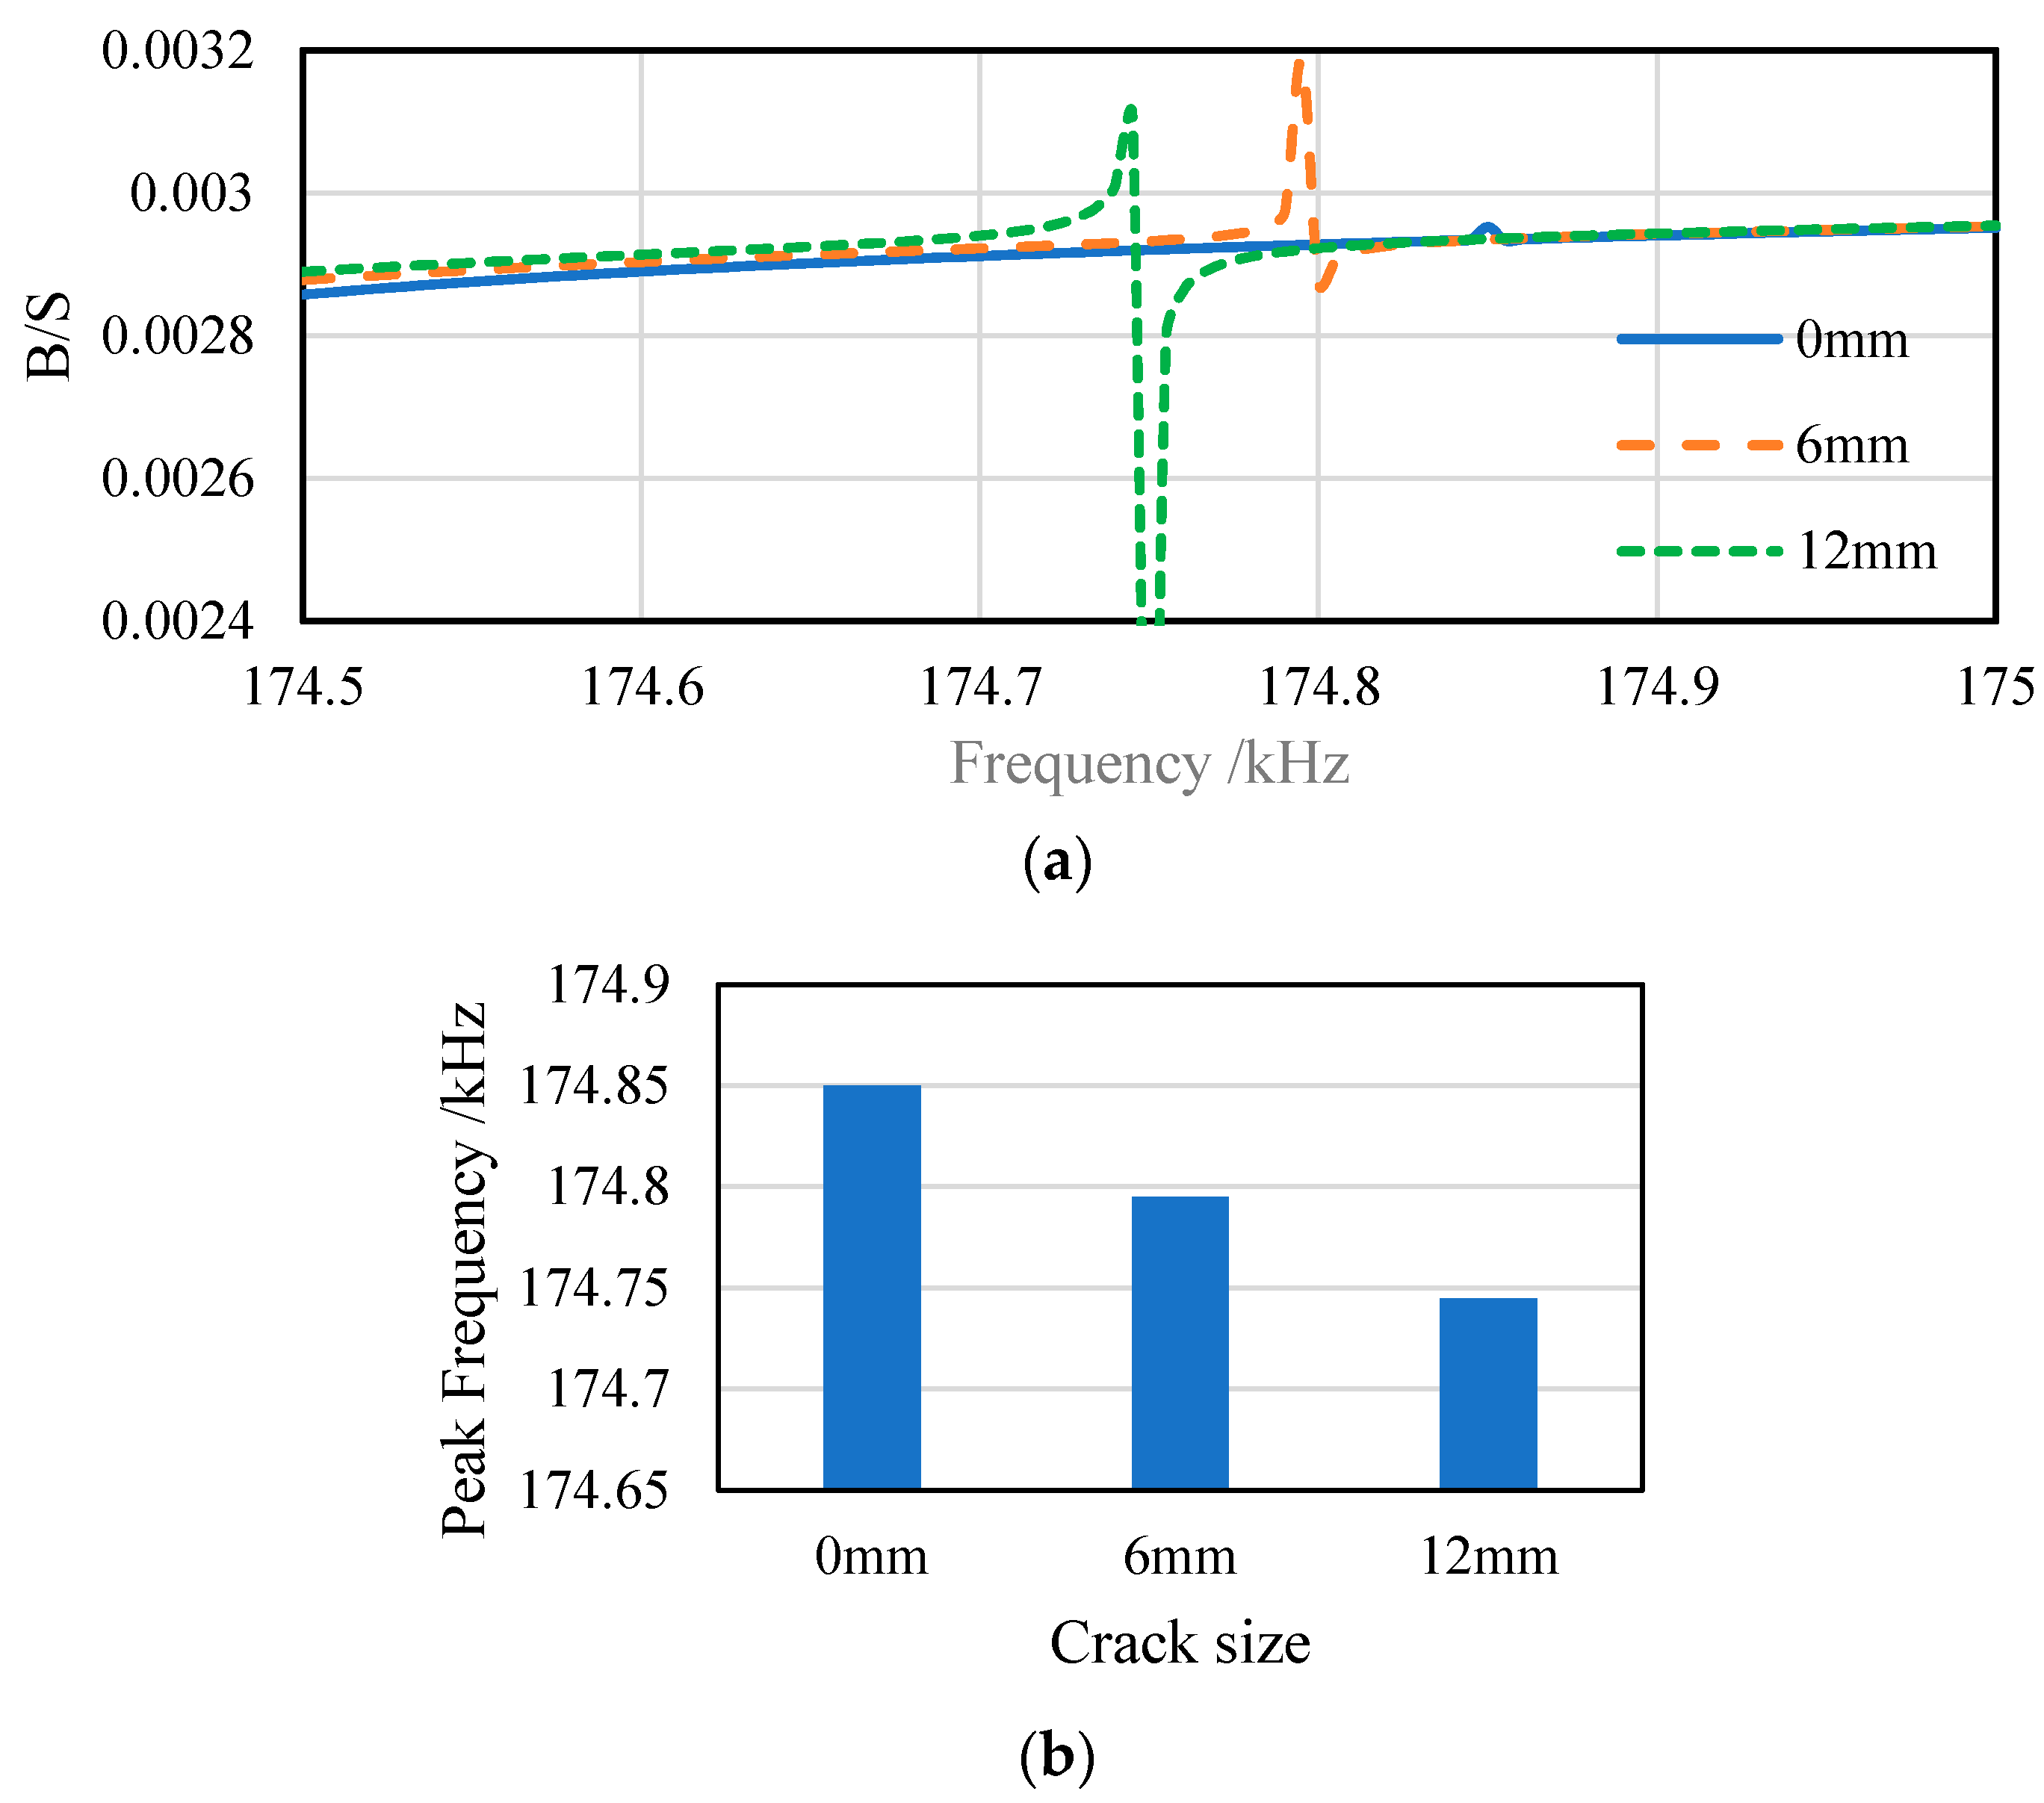
The detailed frequency bands of 19.2–19.3, 62.5–63 and 174.5–175 kHz, covering from relatively low to relatively high frequencies, are chosen as scanning frequency bands for the finite element harmonic response analysis. Then the piezoelectric impedance is computed. The piezoelectric admittance spectra and peak frequencies in the admittance spectrum with different cracks lengths (0 mm crack length means primitive state) on the beam are shown from Figure 4, Figure 5 and Figure 6, the vertical coordinate is an imaginary part of the piezoelectric admittance spectrum, whose unit is siemens (S).
From Figure 4a, Figure 5a and Figure 6a, it is clear that as the crack appears and grows, in both selected frequency bands, the peak frequencies in the piezoelectric admittance spectra shift to the left. It means that the peak frequency decreases when the crack grows, as shown in Figure 4b, Figure 5b and Figure 6b. Based on the above theoretical analysis, the local stiffness of the host structure around the crack decreases when the crack occurs and propagates. Once the local stiffness decreases, the resonant frequency of the host structure will decrease, shifting the peak frequency to left in the piezoelectric admittance spectrum. The numerical simulation results are consistent with the theoretical analysis.
Based on the above findings, the peak frequency in the piezoelectric admittance is chosen as the feature parameter to characterize the crack propagation. The peak frequency shift between crack-free and 6 mm crack is defined as Δf1, while the peak frequency offset between crack-free and 12 mm crack is defined as Δf2. The peak frequency shifts at different frequency bands with different crack sizes are extracted as shown in Table 3. It shows that the higher the scanning frequency band, the greater the peak frequency shift, thus the higher the frequency band, the higher the sensitivity of the proposed method.

4. Experiments and Discussion

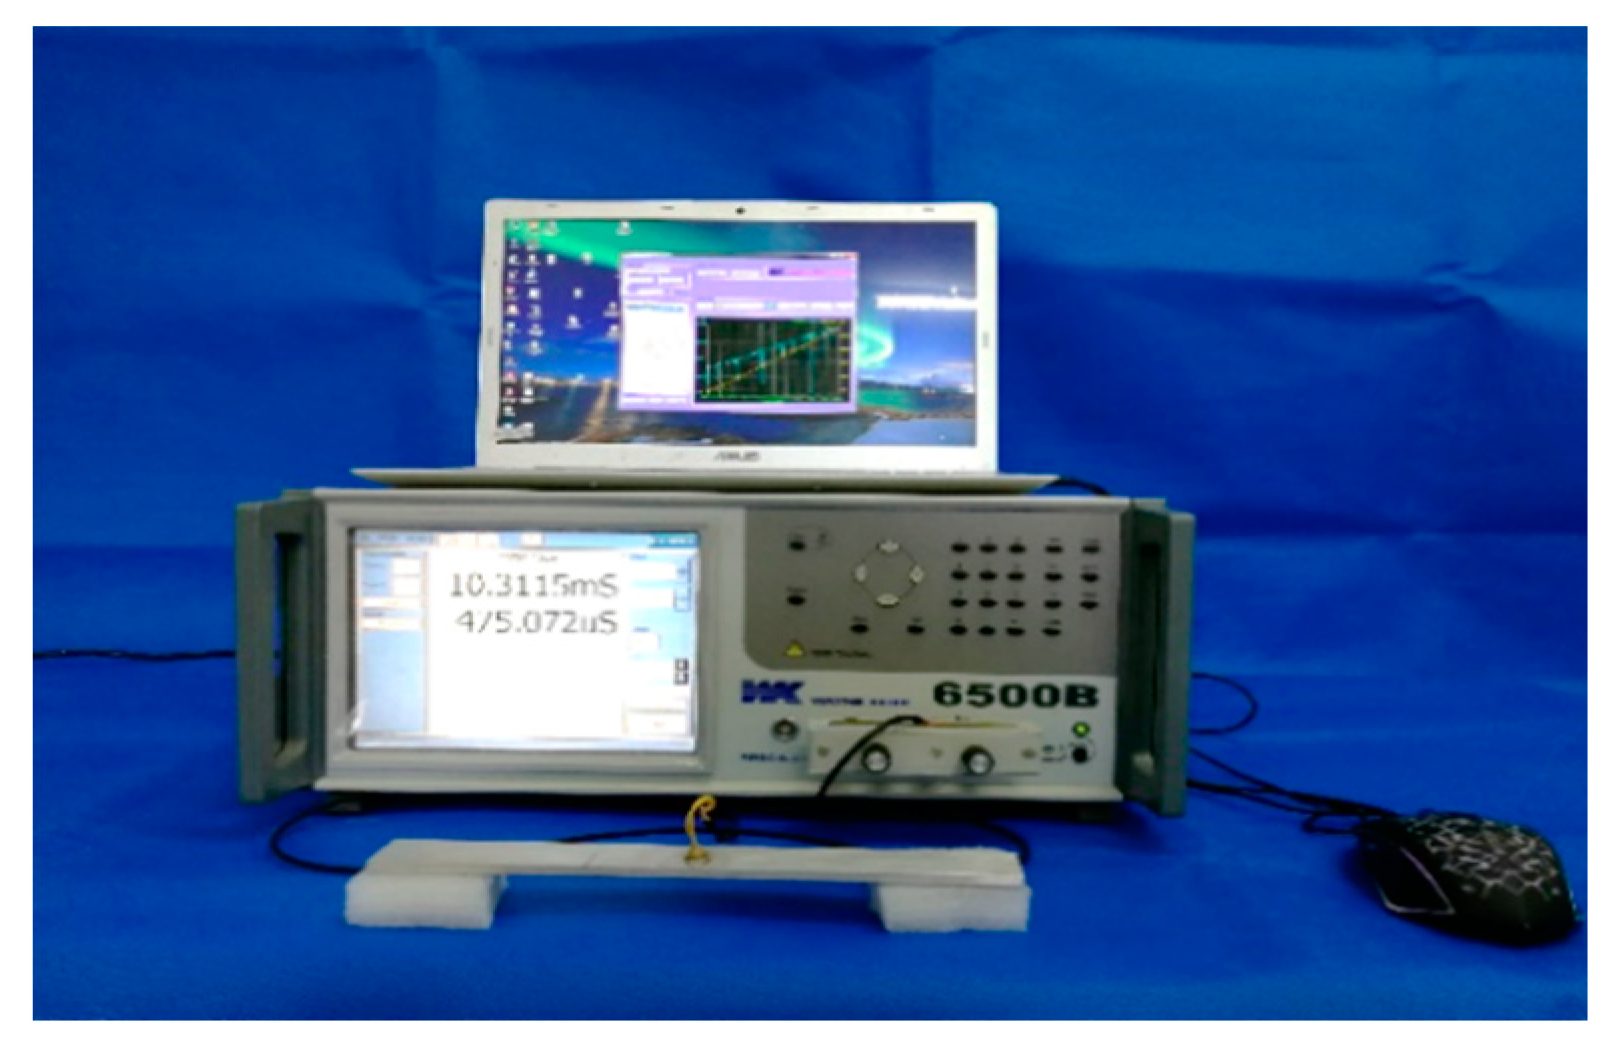
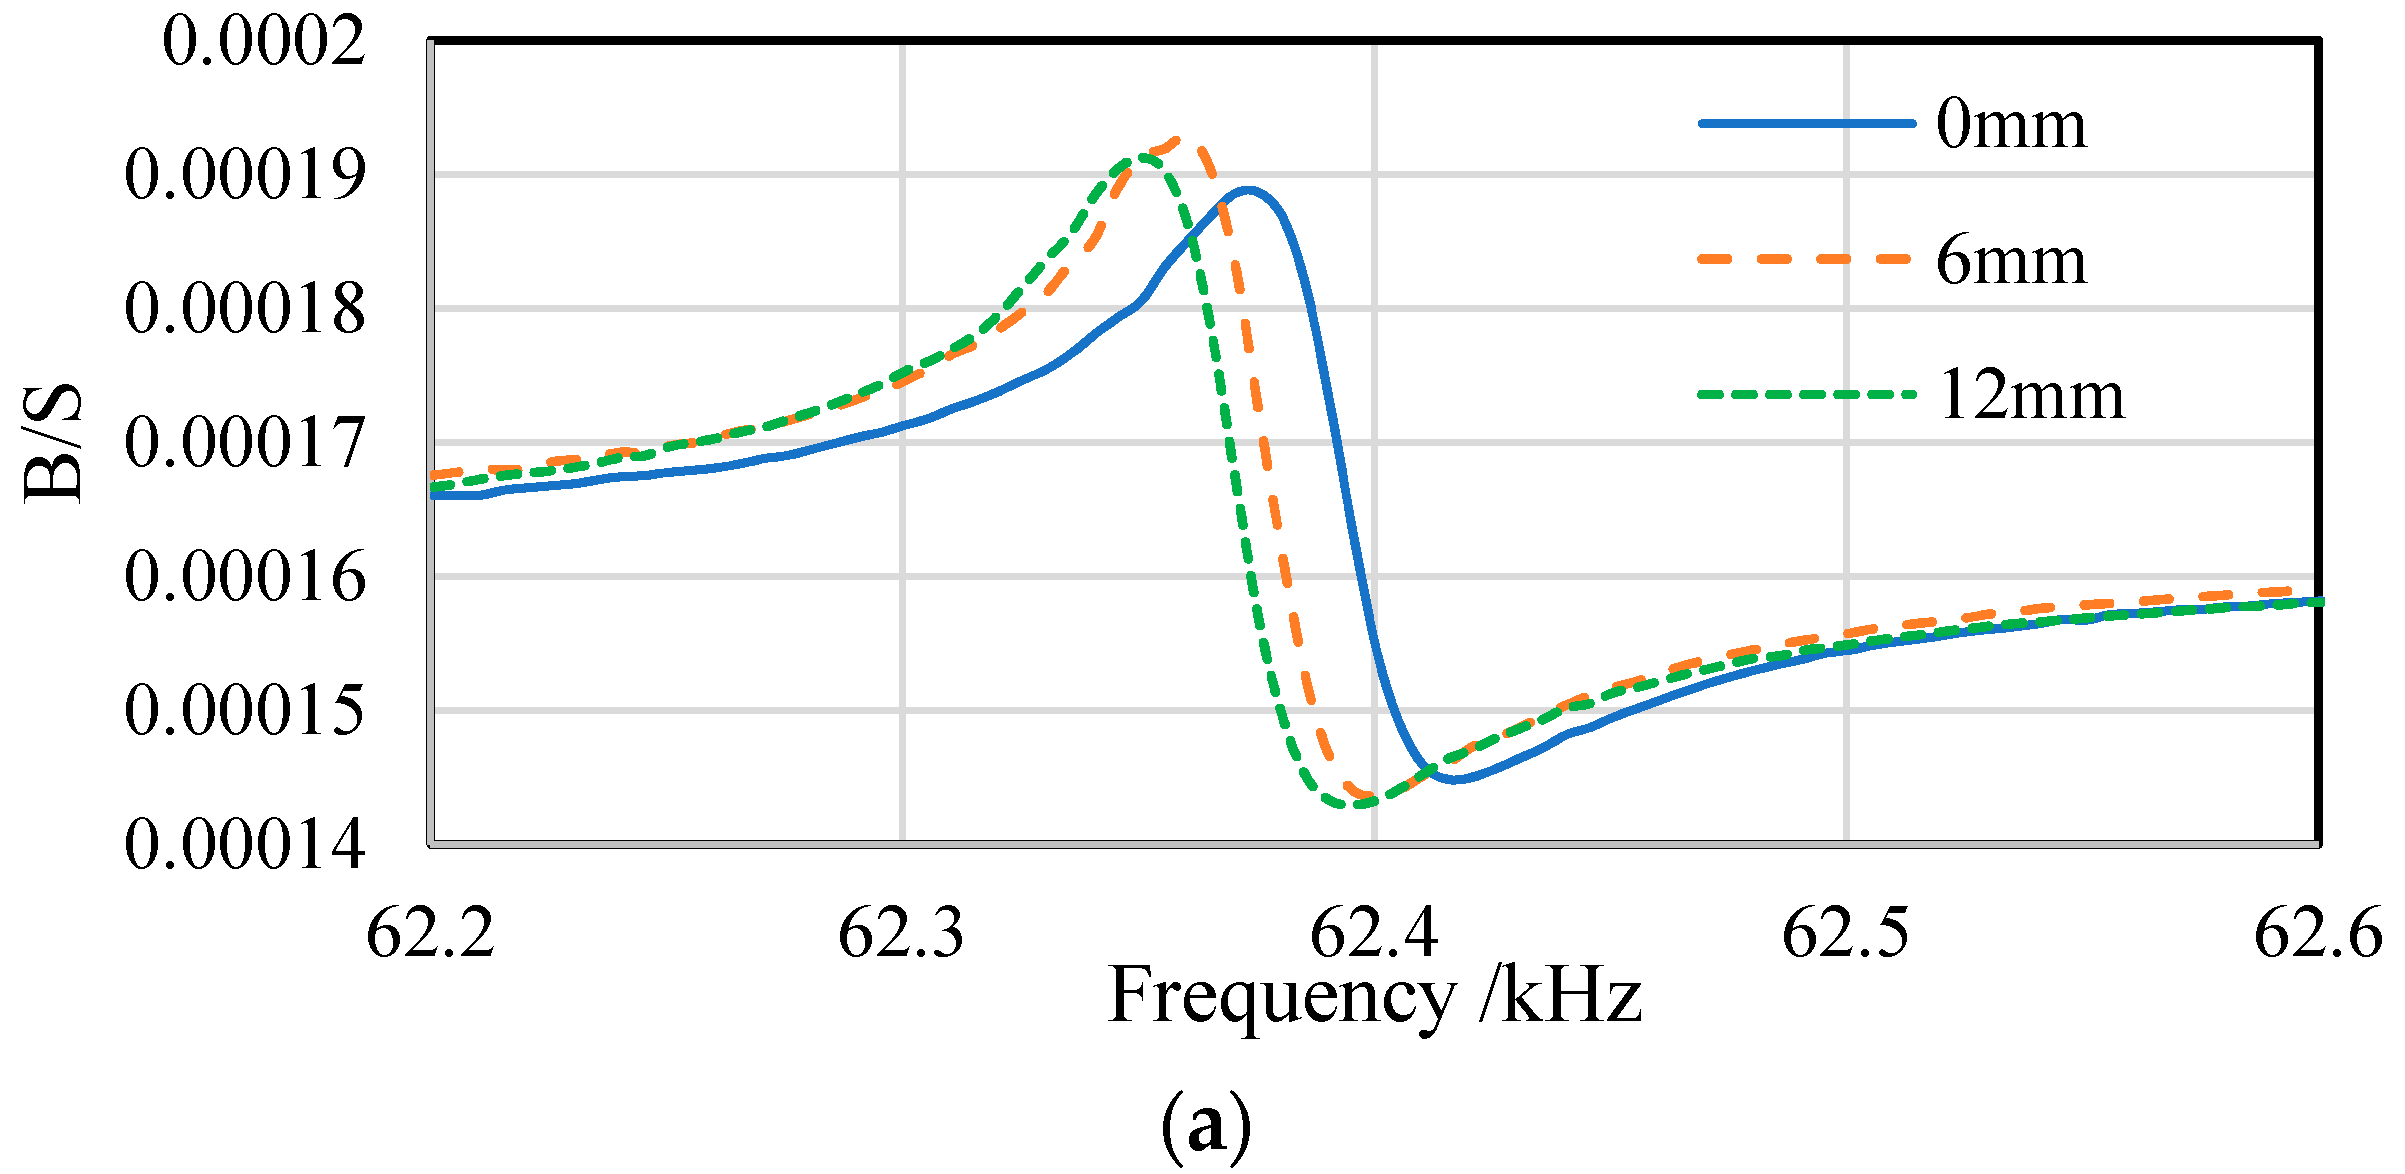
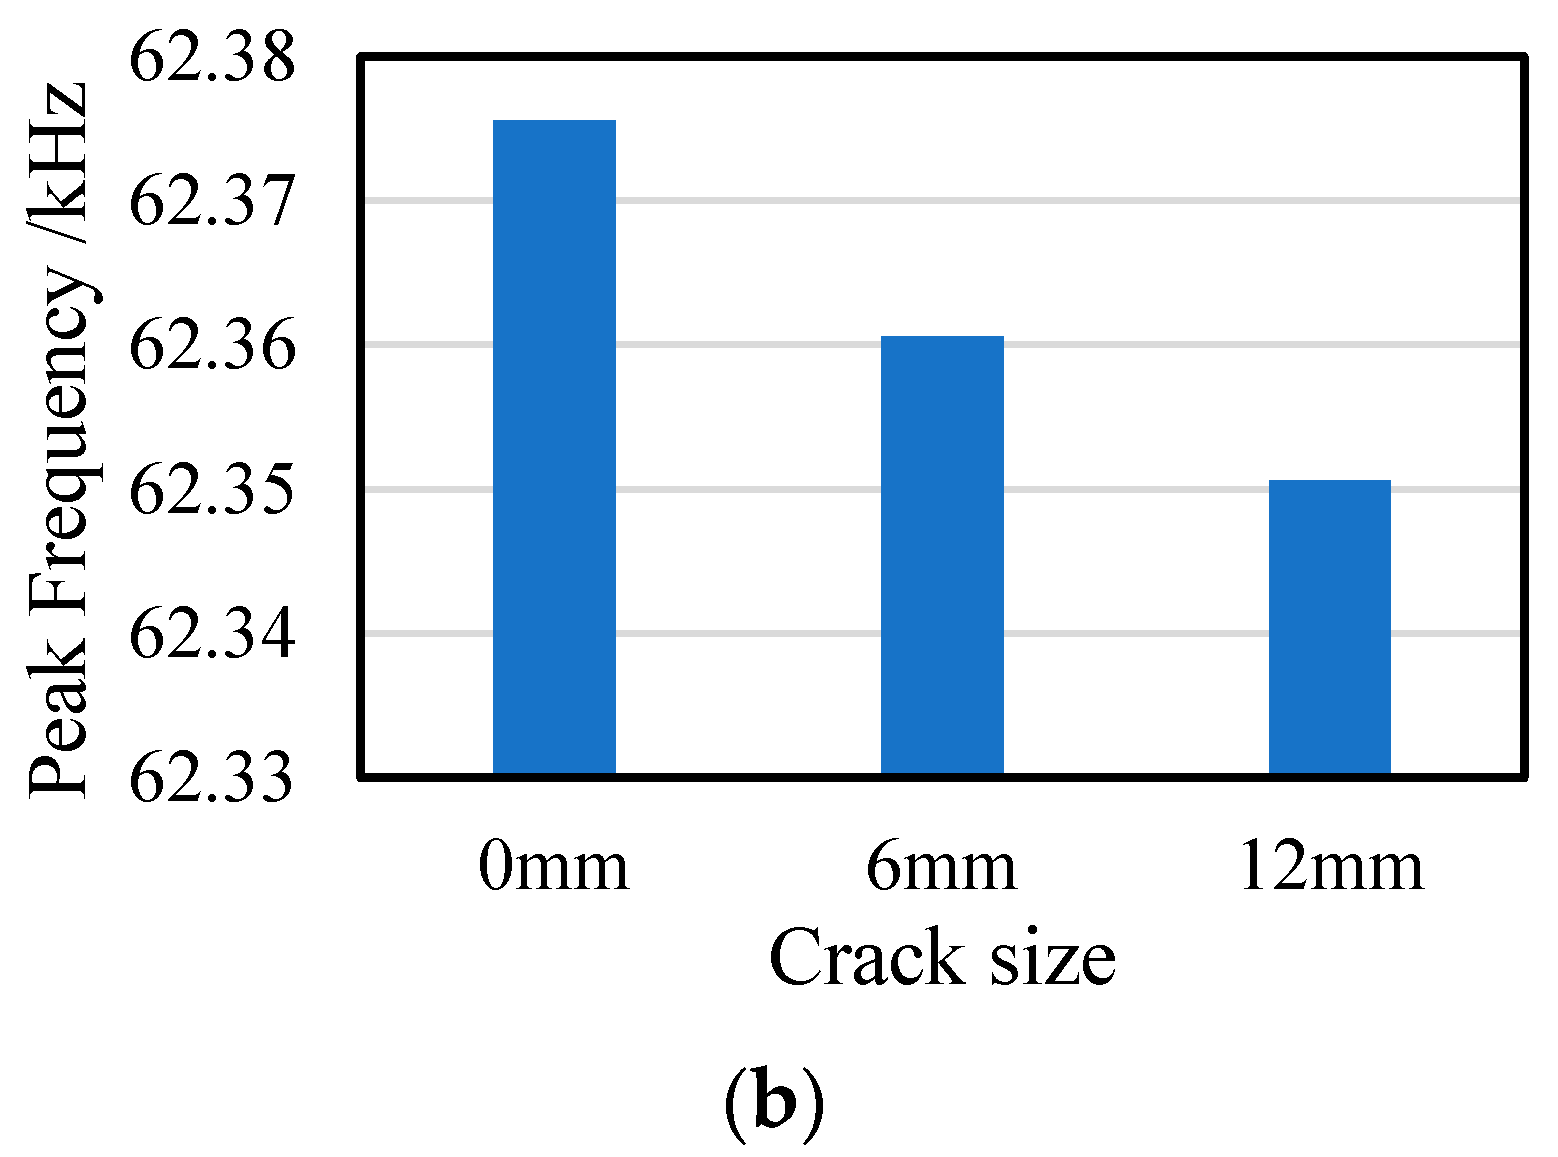
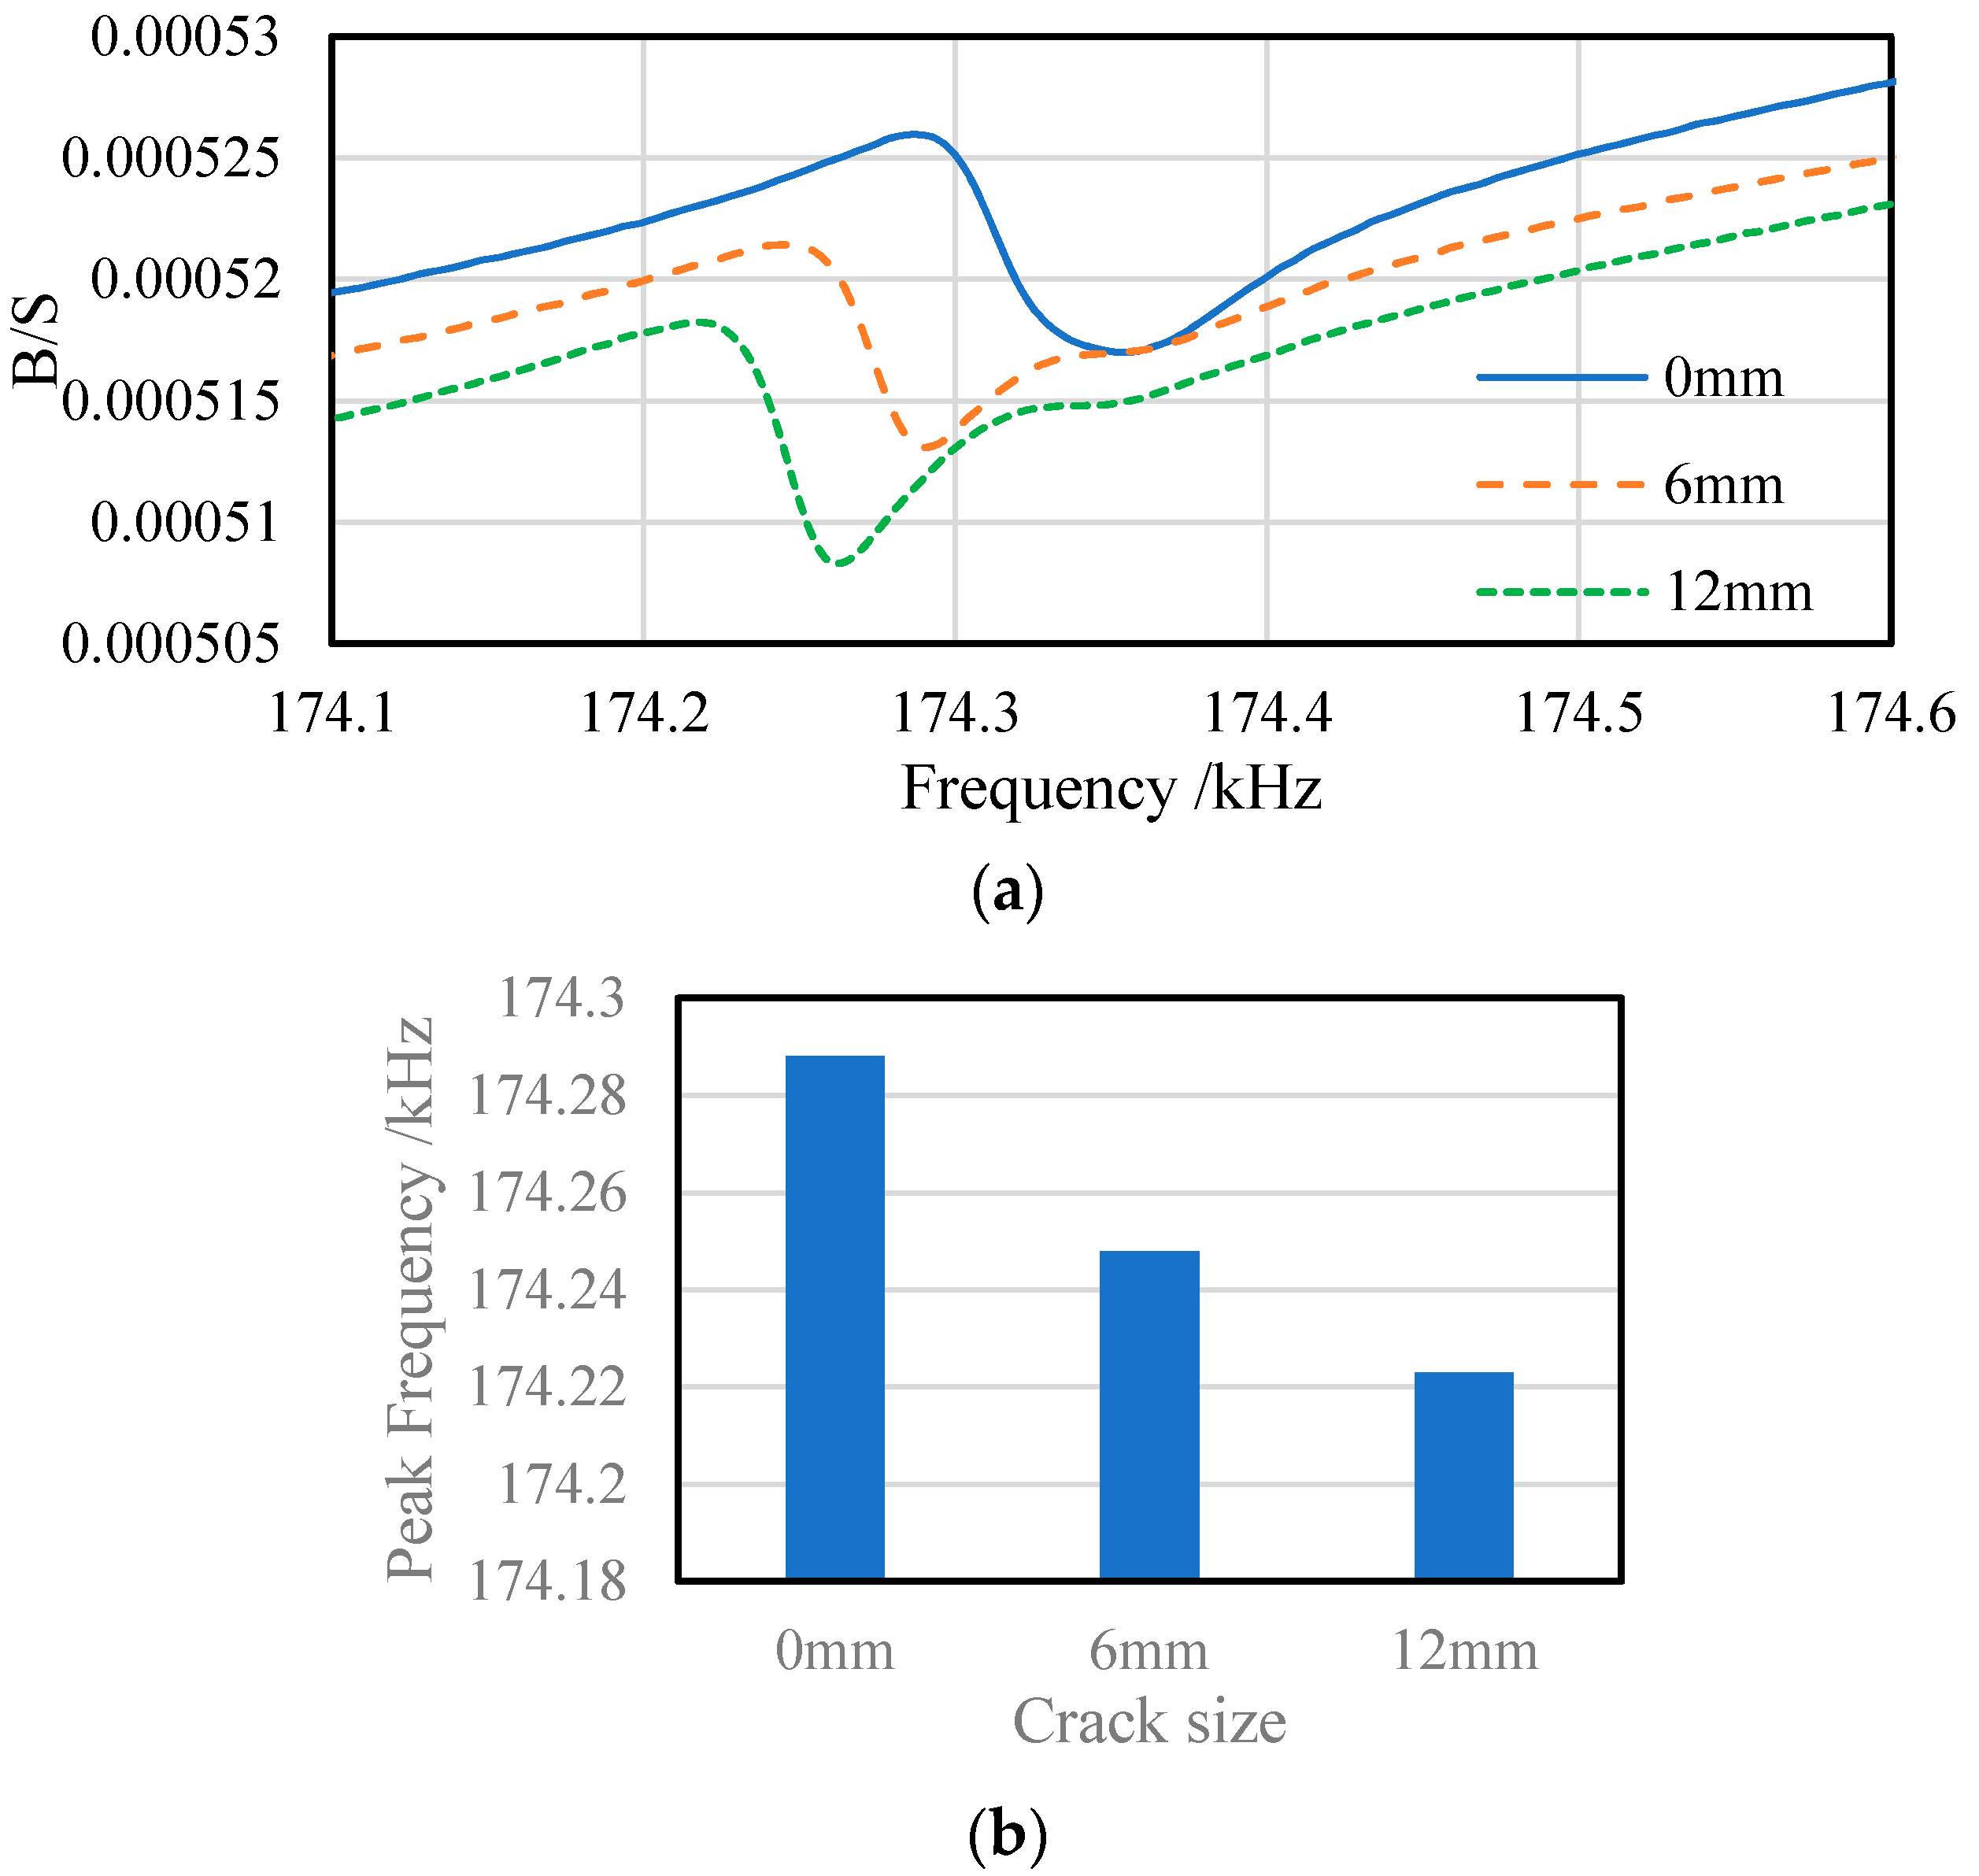
To verify the above theoretical model and finite element analysis, an experimental device was set up, as shown in Figure 7, and experiments were conducted. The dimension of the test specimen was consistent with the simulation model and the piezoelectric patch was bonded on the center of the one surface of the beam, as shown in Figure 8. When the piezoelectric patch was bonded to the host structure with epoxy resin, two optical fibers of 0.125 mm diameter were placed parallel on the surface of the beam with the epoxy resin to ensure the consistent adhesive layer thickness for all test pieces. First, the PZT patch, bonded on the without crack beam, was performed the piezoelectric impedance test by the WK6530B impedance analyzer (Wayne Kerr, West Sussex, UK). Then, a crack with length of 6 mm was machined and the test was performed again. At last, the piezoelectric impedance test was carried out with crack length of 12 mm machined on the beam. The piezoelectric admittance spectra of the beam with different crack lengths (0, 6 and 12 mm) were measured and the peak frequencies in the admittance spectra are extracted, as shown in Figure 9, Figure 10 and Figure 11. As the figures indicate, as the crack grows, the peak frequency, i.e., the resonant frequency of the coupled system shifts to the left. That means the frequency decreases as the crack grows. There may be a slight difference between the simulation and experimental results, which may be resulted from an error between the actual and the designed positions of the damage and PZT. The experimental results have the same trend with the theoretical analysis and finite element simulation results. The tested resonant frequencies are also consistent with the simulation results; therefore, the finite element simulation results can be used to guide the experiment to select an appropriate scanning frequency band of the piezoelectric impedance measurement.
The peak frequency shifts extracted from the piezoelectric admittance spectra at different frequency bands are shown in Table 4. The peak frequencies in the piezoelectric admittance spectra decrease with the increase of crack length in each frequency band. Moreover, at the same crack length, the peak frequency shifts increase with the increase of the scanning frequency band, which means increasing the scanning frequency band can increase the sensitivity of the proposed method. Therefore, the crack occurrence and propagation can be interrogated by the peak frequency shift in the imaginary part of the piezoelectric admittance spectrum. With the increase of the scanning frequency, the higher the frequency band is, and the larger the shift of peak frequency is, i.e., the higher the frequency band is, the more sensitive is the method to damage.
The experimental studies reveal that the peak frequency in the piezoelectric admittance spectrum, i.e., the resonant frequency of the coupled system of the beam and piezoelectric patch, decreases with the increase of crack length, which indicates that the peak frequency shift can well reflect the size of cracks. Therefore, the peak frequency can be used as a feature parameter to characterize the crack length. With the increase of the scanning frequency band, the shift of peak frequency tends to increase. In application, the detection sensitivity can be improved by properly increasing the monitoring frequency band, and small cracks can be detected and crack propagation can be monitored.
At the same time, the experimental results are basically consistent with the finite element numerical analysis results, which shows the accuracy and validity of the finite element model. That indicates the established finite element model can effectively help choosing the sensitive frequency band and the installation location of the piezoelectric patch in practical applications.

5. Conclusions

For small crack detection and crack propagation monitoring in structures, the method based on the peak frequency shift in the piezoelectric admittance spectrum is proposed. The feasibility of the method is analyzed theoretically. The FEA and experimental results verified the effectiveness of the method. The following conclusions are drawn:
(1) The peak frequency in the imaginary part of the piezoelectric admittance spectrum can sensitively detect a crack in a structure, and the peak frequency decreases with the increase of the crack length.
(2) Appropriately increasing the detection frequency band can increase the peak frequency shift at the same crack size and improve the detection sensitivity to the crack, therefore, making the detection of a small crack in a structure possible.
(3) The experimental results are consistent with the FEM simulation results, which show the accuracy and validity of the finite element model. In future research, the resonant frequencies of complex structures can be found by a finite element model firstly, then the scanning frequency bands of piezoelectric admittance can be set to include the resonant frequencies, and finally the damage degree of structures can be judged by the peak frequency shift in the piezoelectric admittance signature.
(4) Since the frequency is selected as a feature parameter for damage monitoring, the proposed method has a better repeatability and signal-to-noise ratio than the root mean square deviation based damage index.
Since the method proposed in this paper is based on the change of local dynamic characteristics to monitor the small crack in a structure, there still needs to be more in-depth study on the local dynamic modeling and analysis. Further research is still needed on how to extract the feature parameter to characterize the crack propagation quantitatively, determine the optimal detection frequency band, and select the sensitive mode frequency bands, etc. Moreover, the influence of the damage size including the width and depth, the damage position, different excitation positions, the structural load and the damage identification of composite materials will be investigated in-depth in our future work.

Author Contributions

T.W., B.T., and Z.Z. conceived and designed the experiments; B.T., Z.Z., M.L. and G.L. performed the experiments; B.T., Z.Z. and M.L. performed the simulation; T.W., Z.Z., B.T. and M.L. analyzed the data; T.W. and G.L. contributed reagents/materials/analysis tools; T.W., B.T., M.L., Z.Z. and G.L. wrote the paper. All authors have read and agreed to the published version of the manuscript.

Funding

This research was funded by the Natural Science Foundation of China under Grant No. 51375354 and 51808417, 61703215.

Acknowledgments

The authors would like to thank for the support by National Natural Science Foundation of China under the Grant 51375354, 51808417, 61703215.

Conflicts of Interest

The authors declare no conflicts of interest.

References

  1. Jiang, T.; Zhang, Y.; Wang, L.; Zhang, L.; Song, G. Monitoring fatigue damage of modular bridge expansion joints using piezoceramic transducers. Sensors 2018, 18, 3973. [Google Scholar] [CrossRef] [PubMed] [Green Version]
  2. Li, N.; Wang, F.; Song, G. New entropy-based vibro-acoustic modulation method for metal fatigue crack detection: An exploratory study. Measurement 2020, 150, 107075. [Google Scholar] [CrossRef]
  3. Peng, J.; Xiao, L.; Zhang, J.; Cai, C.S.; Wang, L. Flexural behavior of corroded HPS beams. Eng. Struct. 2019, 195, 274–287. [Google Scholar] [CrossRef]
  4. Li, W.; Ho, S.C.M.; Song, G. Corrosion detection of steel reinforced concrete using combined carbon fiber and fiber Bragg grating active thermal probe. Smart Mater. Struct. 2016, 25, 045017. [Google Scholar] [CrossRef]
  5. Linsheng, H.; Chuanbo, L.; Tianyong, J.; Hong-Nan, L. Feasibility study of steel bar corrosion monitoring using a piezoceramic transducer enabled time reversal method. Appl. Sci. 2018, 2304. [Google Scholar] [CrossRef] [Green Version]
  6. Ojanomare, C.; Cornetti, P.; Romagnoli, R.; Surace, C. Fatigue crack growth analysis of drill pipes during rotary drilling operations by the multiple reference state weight function approach. Eng. Fail. Anal. 2017, 74, 11–34. [Google Scholar] [CrossRef]
  7. Gholizadeh, S. A review of non-destructive testing methods of composite materials. Procedia Struct. Integr. 2016, 1, 50–57. [Google Scholar] [CrossRef] [Green Version]
  8. Drinkwater, B.W.; Wilcox, P.D. Ultrasonic arrays for non-destructive evaluation: A review. NDT E Int. 2006, 39, 525–541. [Google Scholar] [CrossRef]
  9. Liu, Y.; Zhang, M.; Yin, X.; Huang, Z.; Wang, L. Debonding detection of Reinforced Concrete (RC) beam with Near-Surface Mounted (NSM) Pre-stressed Carbon Fiber Reinforced Polymer (CFRP) Plates using embedded piezoceramic Smart Aggregates (SAs). Appl. Sci. 2019, 10, 50. [Google Scholar] [CrossRef] [Green Version]
  10. Kong, Q.; Robert, R.H.; Silva, P.; Mo, Y.L. Cyclic crack monitoring of a reinforced concrete column under simulated pseudo-dynamic loading using piezoceramic-based smart aggregates. Appl. Sci. 2016, 6, 341. [Google Scholar] [CrossRef] [Green Version]
  11. Lv, Y.; Yuan, R.; Wang, T.; Li, H.; Song, G. Health degradation monitoring and early fault diagnosis of a rolling bearing based on CEEMDAN and improved MMSE. Materials 2018, 11, 1009. [Google Scholar] [CrossRef] [PubMed] [Green Version]
  12. Ruotolo, R.; Surace, C.; Crespo, P.; Storer, D. Harmonic analysis of the vibrations of a cantilevered beam with a closing crack. Comput. Struct. 1996, 61, 1057–1074. [Google Scholar] [CrossRef]
  13. Pugno, N.; Surace, C.; Ruotolo, R. Evaluation of the non-linear dynamic response to harmonic excitation of a beam with several breathing cracks. J. Sound Vib. 2000, 235, 749–762. [Google Scholar] [CrossRef] [Green Version]
  14. Yan, Y.J.; Cheng, L.; Wu, Z.Y.; Yam, L.H. Development in vibration-based structural damage detection technique. Mech. Syst. Signal. Process. 2007, 21, 2198–2211. [Google Scholar] [CrossRef]
  15. Fan, W.; Qiao, P. Vibration-based damage identification methods: A review and comparative study. Struct. Health Monit. 2011, 10, 83–111. [Google Scholar] [CrossRef]
  16. Corrado, N.; Durrande, N.; Gherlone, M.; Hensman, J.; Mattone, M.; Surace, C. Single and multiple crack localization in beam-like structures using a Gaussian process regression approach. J. Vib. Control 2017, 24, 4160–4175. [Google Scholar] [CrossRef]
  17. Koto, Y.; Konishi, T.; Sekiya, H.; Miki, C. Monitoring local damage due to fatigue in plate girder bridge. J. Sound Vib. 2019, 438, 238–250. [Google Scholar] [CrossRef]
  18. Perera, R.; Huerta, C.; Orquı, J.M. Identification of damage in RC beams using indexes based on local modal stiffness. Constr. Build. Mater. 2008, 22, 1656–1667. [Google Scholar] [CrossRef]
  19. Bovsunovsky, A.P.; Surace, C. Considerations regarding superharmonic vibrations of a cracked beam and the variation in damping caused by the presence of the crack. J. Sound Vib. 2005, 288, 865–886. [Google Scholar] [CrossRef]
  20. Lakshmi, N.K.; Jebaraj, C. Sensitivity analysis of local/global modal parameters for identification of a crack in a beam. J. Sound Vib. 1999, 228, 977–994. [Google Scholar] [CrossRef]
  21. Tondreau, G.; Deraemaeker, A. Automated data-based damage localization under ambient vibration using local modal filters and dynamic strain measurements: Experimental applications. J. Sound Vib. 2014, 333, 736–7385. [Google Scholar] [CrossRef] [Green Version]
  22. Caesarendra, W.; Kosasih, B.; Tieu, A.K.; Zhu, H.; Moodie, C.A.S.; Zhu, Q. Acoustic emission-based condition monitoring methods: Review and application for low speed slew bearing. Mech. Syst. Signal. Process. 2016, 72, 134–159. [Google Scholar] [CrossRef]
  23. Wang, F.; Song, G. Bolt early looseness monitoring using modified vibro-acoustic modulation by time-reversal. Mech. Syst. Signal. Process. 2019, 130, 349–360. [Google Scholar] [CrossRef]
  24. Rahman, Z.; Ohba, H.; Yoshioka, T.; Yamamoto, T. Incipient damage detection and its propagation monitoring of rolling contact fatigue by acoustic emission. Tribol. Int. 2009, 42, 807–815. [Google Scholar] [CrossRef]
  25. Elforjani, M.; Mba, D. Detecting natural crack initiation and growth in slow speed shafts with the Acoustic Emission technology. Eng. Fail. Anal. 2009, 16, 2121–2129. [Google Scholar] [CrossRef] [Green Version]
  26. Klepka, A.; Staszewski, W.J.; Jenal, R.B.; Szwedo, M.; Iwaniec, J.; Uhl, T. Nonlinear acoustics for fatigue crack detection—Experimental investigations of vibro-acoustic wave modulations. Struct. Health Monit. 2011, 11, 197–211. [Google Scholar] [CrossRef]
  27. Lee, S.E.; Lim, H.J.; Jin, S.; Sohn, H.; Hong, J.-W. Micro-crack detection with nonlinear wave modulation technique and its application to loaded cracks. NDT E Int. 2019, 107, 102132. [Google Scholar] [CrossRef]
  28. Duffour, P.; Marco, M.; Peter, C. A study of the vibro-acoustic modulation technique for the detection of cracks in metals. J. Acoust. Soc. Am. 2006, 119, 1463–1475. [Google Scholar] [CrossRef]
  29. Bovsunovsky, A.; Surace, C. Non-linearities in the vibrations of elastic structures with a closing crack: A state of the art review. Mech. Syst. Signal. Process. 2015, 62, 129–148. [Google Scholar] [CrossRef]
  30. Wang, T.; Liu, S.; Shao, J.; Li, Y. Health monitoring of bolted joints using the time reversal method and piezoelectric transducers. Smart Mater. Struct. 2016, 25, 025010. [Google Scholar] [CrossRef]
  31. Yin, H.; Wang, T.; Yang, D.; Liu, S.; Shao, J.; Li, Y. A Smart Washer for Bolt Looseness Monitoring Based on Piezoelectric Active Sensing Method. Appl. Sci. 2016, 6, 320. [Google Scholar] [CrossRef]
  32. Tashakori, S.; Baghalian, A.; Unal, M.; Fekrmandi, H.; Senyürek, V.Y.; McDaniel, D.; Tansel, I.N. Contact and non-contact approaches in load monitoring applications using surface response to excitation method. Measurement 2016, 89, 197–203. [Google Scholar] [CrossRef]
  33. Feng, Q.; Ou, J. Self-sensing CFRP fabric for structural strengthening and damage detection of reinforced concrete structures. Sensors 2018, 18, 4137. [Google Scholar] [CrossRef] [Green Version]
  34. Xu, K.; Ren, C.; Deng, Q.; Jin, Q.; Chen, X. Real-time monitoring of bond slip between GFRP bar and concrete structure using piezoceramic transducer-enabled active sensing. Sensors 2018, 18, 2653. [Google Scholar] [CrossRef] [PubMed] [Green Version]
  35. Lu, G.; Wang, T.; Zhou, M.; Li, Y. Characterization of Ultrasonic Energy Diffusion in a Steel Alloy Sample with Tensile Force Using PZT Transducers. Sensors 2019, 19, 2185. [Google Scholar] [CrossRef] [PubMed] [Green Version]
  36. Lu, G.; Li, Y.; Zhou, M.; Feng, Q.; Song, G. Detecting damage size and shape in a plate structure using PZT transducer array. J. Aerosp. Eng. 2018, 31, 04018075. [Google Scholar] [CrossRef]
  37. Tashakori, S.; Baghalian, A.; Cuervo, J.; Senyurek, V.; Tansel, I.N.; Uragun, B. Inspection of the machined features created at the embedded sensor aluminum plates. In Proceedings of the 2017 8th International Conference on Recent Advances in Space Technologies, Istanbul, Turkey, 19–22 June 2017; Volume 6, pp. 517–522. [Google Scholar] [CrossRef]
  38. Ji, Q.; Ho, M.; Zheng, R.; Ding, Z.; Song, G. An exploratory study of stress wave communication in concrete structures. Smart Struct. Syst. 2015, 15, 135–150. [Google Scholar] [CrossRef]
  39. Siu, S.; Ji, Q.; Wu, W.; Song, G.; Zhi, D. Stress wave communication in concrete: I. Characterization of a smart aggregate based concrete channel. Smart Mater. Struct. 2014, 23, 125030. [Google Scholar] [CrossRef]
  40. Siu, S.; Qing, J.; Wang, K.; Song, G.; Ding, Z. Stress wave communication in concrete: II. Evaluation of low voltage concrete stress wave communications utilizing spectrally efficient modulation schemes with PZT transducers. Smart Mater. Struct. 2014, 23, 125031. [Google Scholar] [CrossRef]
  41. Parvasi, S.M.; Ji, Q.; Song, G. Structural health monitoring of Plate-Like structures using Compressive/Shear modes of piezoelectric transducers. Earth Space 2016 2016, 1033–1044. [Google Scholar] [CrossRef]
  42. Hay, T.R.; Royer, R.L.; Gao, H.; Zhao, X.; Rose, J.L. A comparison of embedded sensor Lamb wave ultrasonic tomography approaches for material loss detection. Smart Mater. Struct. 2006, 15, 946–951. [Google Scholar] [CrossRef]
  43. Wang, C.H.; Rose, J.T.; Chang, F.-K. A synthetic time-reversal imaging method for structural health monitoring. Smart Mater. Struct. 2004, 13, 415–423. [Google Scholar] [CrossRef]
  44. Lu, G.; Li, Y.; Wang, T.; Xiao, H.; Huo, L.; Song, G. A multi-delay-and-sum imaging algorithm for damage detection using piezoceramic transducers. J. Intell. Mater. Syst. Struct. 2017, 28, 1150–1159. [Google Scholar] [CrossRef]
  45. Lu, G.; Li, Y.; Song, G. A delay-and-Boolean-ADD imaging algorithm for damage detection with a small number of piezoceramic transducers. Smart Mater. Struct. 2016, 25, 095030. [Google Scholar] [CrossRef]
  46. Taylor, S.G.; Farinholt, K.; Choi, M.; Jeong, H.; Jang, J.; Park, G.; Lee, J.; Todd, M.D. Incipient crack detection in a composite wind turbine rotor blade. J. Intell. Mater. Syst. Struct. 2014, 25, 613–620. [Google Scholar] [CrossRef]
  47. Dumoulin, C.; Karaiskos, G.; Deraemaeker, A. Monitoring of crack propagation in reinforced concrete beams using embedded piezoelectric transducers. Acoust. Emiss. Relat. Non-Destr. Eval. Tech. Fract. Mech. Concr. 2015, 161–175. [Google Scholar] [CrossRef]
  48. Park, H.W.; Kim, S.B.; Sohn, H. Understanding a time reversal process in Lamb wave propagation. Wave Motion 2009, 46, 451–467. [Google Scholar] [CrossRef]
  49. Shao, J.; Wang, T.; Yin, H.; Yang, D.; Li, Y. Bolt Looseness Detection Based on Piezoelectric Impedance Frequency Shift. Appl. Sci. 2016, 6, 298. [Google Scholar] [CrossRef]
  50. Wang, T.; Wei, D.; Shao, J.; Li, Y.; Song, G. Structural stress monitoring based on piezoelectric impedance frequency shift. J. Aerosp. Eng. 2018, 31, 04018092. [Google Scholar] [CrossRef]
  51. Park, G.; Sohn, H.; Farrar, C.R.; Inman, D.J. Overview of piezoelectric impedance-based health monitoring and path forward. Shock Vib. Dig. 2003, 35, 451–464. [Google Scholar] [CrossRef] [Green Version]
  52. Zagrai, A.N.; Giurgiutiu, V. Electro-Mechanical Impedance Method for Crack Detection in Thin Plates. J. Intell. Mater. Syst. Struct. 2016, 12, 709–718. [Google Scholar] [CrossRef]
  53. Xu, B.; Giurgiutiu, V. A Low-Cost and Field Portable Electromechanical (E/M) Impedance Analyzer for Active Structural Health Monitoring. In Proceedings of the 5th International Workshop on Structural Health Monitoring, Stanford University, Stanford, CA, USA, 15–17 September 2005. [Google Scholar]
  54. Dixit, A.; Bhalla, S. Prognosis of fatigue and impact induced damage in concrete using embedded piezo-transducers. Sens. Actuators A Phys. 2018, 274, 116–131. [Google Scholar] [CrossRef]
  55. Yang, Y.; Hu, Y.; Lu, Y. Sensitivity of PZT impedance sensors for damage detection of concrete structures. Sensors 2008, 8, 327–346. [Google Scholar] [CrossRef] [PubMed] [Green Version]
  56. Ai, D.; Zhu, H.; Luo, H.; Yang, J. An effective electromechanical impedance technique for steel structural health monitoring. Constr. Build. Mater. 2014, 73, 97–104. [Google Scholar] [CrossRef]
  57. Giurgiutiu, V.; Zagrai, A.N. Characterization of piezoelectric wafer active sensors. J. Intell. Mater. Syst. Struct. 2000, 11, 959–976. [Google Scholar] [CrossRef]
  58. Liang, C.; Sun, F.P.; Rogers, C.A. Coupled electro-mechanical analysis of adaptive material systems-determination of the actuator power consumption and system energy transfer. J. Intell. Mater. Syst. Struct. 1997, 8, 335–343. [Google Scholar] [CrossRef]
  59. Ruotolo, R.; Surace, C. Natural frequencies of a bar with multiple cracks. J. Sound Vib. 2004, 272, 301–316. [Google Scholar] [CrossRef]
  60. Wuhan Hitrusty Electronice, LTD. Available online: http://www.hi-trusty.com/ (accessed on 12 June 2020).
Figure 1. Simplified piezoelectric electro-mechanical impedance (EMI) Model.
Applsci 10 04648 g001
Figure 2. Schematic diagram of piezoelectric patch and crack location.
Applsci 10 04648 g002
Figure 3. Overall (a) and local (b) finite element model of cracked beam and lead–zirconate–titanate (PZT) patch.
Applsci 10 04648 g003
Figure 4. Numerical simulation results: (a) piezoelectric admittance spectrum and (b) peak frequency tendencies in 19.2 kHz19.3 kHz with different crack sizes.
Applsci 10 04648 g004
Figure 5. Numerical simulation results (a) piezoelectric admittance spectrum and (b) peak frequency tendencies in 62.6 kHz–62.8 kHz with different crack sizes.
Applsci 10 04648 g005
Figure 6. Numerical simulation results (a) piezoelectric admittance spectrum and (b) peak frequency tendencies in 174.5 kHz–175 kHz with different crack sizes.
Applsci 10 04648 g006
Figure 7. Testing device.
Applsci 10 04648 g007
Figure 8. The aluminum plate sample with a crack.
Applsci 10 04648 g008
Figure 9. Experimental results (a) piezoelectric admittance spectrum and (b) peak frequency tendencies in 18.9 kHz–19.2 kHz with different crack sizes.
Applsci 10 04648 g009
Figure 10. Experimental results (a) piezoelectric admittance spectrum and (b) peak frequency tendencies in 62.2 kHz–62.6 Hz with different crack sizes.
Applsci 10 04648 g010aApplsci 10 04648 g010b
Figure 11. Experimental results (a) piezoelectric admittance spectrum and (b) peak frequency tendencies in 174.1 kHz–174.6 kHz with different crack sizes.
Applsci 10 04648 g011
Table 1. Properties of piezoelectric patch.
ParameterSymbolValue
Densityρ7850 kg/m3
Dielectric constant ε 33 T 3.01 × 10⁻⁸ F/m
Piezoelectric constantd31−274 × 10−12 C/N
Table 2. Material coefficients of the beam and the adhesive layer.
ItemDensity /kg·m−3Young’s Modulus /GPa Poisson Ratio
Beam2700700.3
Adhesive layer20000.80.4
Table 3. Peak frequency shifts at different frequency bands.
19.2–19.3 kHz62.6–62.8 kHz174.5–175 kHz
Δf1 (Hz)−10−25−55
Δf2 (Hz)−18−40−105
Table 4. The frequency shifts at different frequencies bands.
18.9–19.2 kHz62.2–62.6 kHz174.1–174.6 kHz
Δf1 (Hz)−8−15−40
Δf2 (Hz)−12−25−65