Article

Bond Strength Assessment of Concrete-Corroded Rebar Interface Using Artificial Neutral Network

1
School of Civil Engineering, Central South University, Changsha 410075, China
2
Institute of Industrial Science, The University of Tokyo, Tokyo 153-8505, Japan
3
Department of Energy IT, Gachon University, Seongnam 13120, Korea
*
Authors to whom correspondence should be addressed.
Appl. Sci. 2020, 10(14), 4724; https://doi.org/10.3390/app10144724
Submission received: 9 June 2020 / Revised: 3 July 2020 / Accepted: 7 July 2020 / Published: 9 July 2020
(This article belongs to the Section Civil Engineering)

Abstract

:
Bond strength assessment is important for reinforced concrete structures with rebar corrosion since the bond degradation can threaten the structural safety. In this study, to assess the bond strength in concrete-corroded rebar interface, one of the machine learning techniques, artificial neutral network (ANN), was utilized for the application. From existing literature, data related to the bond strength of concrete and corroded rebar were collected. The ANN model was applied to understand the factors on bond property degradation. For the input in the ANN model, the following factors were considered the relative bond strength: (1) corrosion level; (2) crack width; (3) cover-to-diameter ratio; and (4) concrete strength. For the cases with confinement (stirrups), (5) the diameter/stirrups spacing ratio was also considered. The assessment was conducted from input with single parameter to multiple parameters. The scaled feed-forward multi-layer perception ANN model with the error back-propagation algorithm of gradient descent and momentum was found to match the experimental and computed results. The correlation of each parameter to the bond strength degradation was clarified. In cases without confinement, the relative importance was (1) > (2) > (4) > (3), while it was (2) > (1) > (3) > (5) > (4) for the cases with confinement.

1. Introduction

Rebar corrosion is a serious durability problem for reinforced concrete (RC) structures, which has been widely studied for decades globally [1,2,3,4,5,6,7]. In harsh environments [8,9], such as in coastal areas and areas exposed to chloride ions, corrosion of rebars could occur when the concentration of chloride ions on the surface of rebar reaches a critical value [10,11]. The rebar corrosion can cause cracking of concrete, and it can result in the concrete cover debonding or spalling [12,13]. Further, as the corrosion level increases, the bond properties between the rebar and the concrete can degrade and finally threaten the safety of RC structures [14] because of the disintegration and drop in the bearing capacity. Therefore, to avoid the collapse of structures and sustain serviceability, deteriorated RC structures need rehabilitation when they are severely damaged. The bond properties between rebar and concrete should be assessed prior to taking appropriate maintenance measures [15].
To evaluate bond strength loss, it is of considerable importance to understand the cause of rebar corrosion and the mechanism of the bond strength loss. From the existing studies, they are basically revealed. Owing to chloride penetration or neutralization such as carbonation in concrete [16,17,18], the alkali environment in concrete is spoiled, the protective layer of ferric oxide at the rebar surface can be decomposed and rebar corrosion can then be initiated. When the rebar is corroded, corrosion products can induce radial expansive stress at the interface between the concrete and the rebar, and the concrete will then crack when the expansive stress exceeds the tensile strength of concrete [19,20]. The bond between the concrete and the rebar is mainly contributed by the friction and mechanical interlocking force. Owing to the increase of friction contributed by a rougher surface after corrosion, a slight corrosion level may enhance bond behavior [1]. However, as the corrosion level increases, internal cracks develop and the mechanical interlocking force reduces gradually, which leads to the crack propagation towards the concrete surface. The crack width on the surface of the concrete increases with the severity of deterioration and the reduction of bond strength [21]. In this case, crack width or corrosion level is considered as the index to evaluate bond property degradation [22,23,24,25].
In addition to the corrosion level, bond behavior is affected by other factors such as concrete strength and cover-to-diameter ratio because they can contribute to the confinement that restricts the development of cracking in concrete. For example, when the concrete strength is higher, with the same corrosion level, the crack width on the surface is considerably smaller [26,27]. When considering the relationship between the corrosion level and the crack width developed based on a lower concrete strength, the calculated results will lead to underestimating the corrosion damage because a smaller crack width is observed. It is not appropriate to assess the bond strength by simply fitting the data with regard to a single factor. Thus, to accurately assess the bond strength of corroded RC member, more information is required for the calculation [28]. Although most existing studies considered specimens without stirrups, in engineering practice, stirrups confinement is commonly used for better structural performance [29,30]. When stirrups are utilized, the diameter and spacing of the stirrups are important to the mechanical performance of the RC structures, especially to the residual bond properties after rebar corrosion because of its confinement effect [31]. There is a distinctive degradation tendency between cases with and without stirrups, and, therefore, the two cases should be considered separately [28]. For bond problems, both analytical and experimental methods have been conducted to evaluate the residual bond performance [32,33,34,35,36,37,38]. However, thus far, a reliable method with high accuracy and efficiency is still required.
In our previous study, a rigid body spring model (RBSM) was developed to simulate the mechanical performance of RC members after rebar corrosion [4,39]. The crack width distribution was used as the input for the calculation. The relationship between the crack width on the surface and the corrosion level of the main reinforcement inside the concrete was proposed for the RBSM model based on the experimental findings. The cracking of concrete is subsequently simulated, as well as the residual mechanical properties of the corroded RC beams. The RBSM model shows considerable potential for structural performance evaluation. However, in reality, the relationship between the crack width on the surface of concrete and corrosion level of rebar is not certain because of complicated confinement. Therefore, the sensitivity and correlation of each parameter to the bond strength loss require further investigation to justify the model.
Soft computing techniques are considered a promising tool to solve problems in civil engineering, which has been widely explored in various fields [40,41,42]. For example, it was used by Naderpour et al. [40] to predict the compressive strength of FRP-confined circular reinforced concrete columns. In terms of performance assessment related to various factors, an artificial neutral network (ANN) is a good alternative because it can provide the optimal solution by minimizing the difference between observed and modeled data. This method was used by Geem and his coworkers for many applications [43,44,45]. A scaled feed-forward multilayer perception ANN model with an error back-propagation algorithm of gradient descent and momentum (FF-BP-ANN) can achieve the most satisfactory prediction, and the results are useful for drawing strategies. It seems that this method could be a good option to solve the problem for bond strength evaluation.
Therefore, in this study, the scaled FF-BP-ANN was first applied to assess the bond strength of concrete with a corroded rebar. Owing to the large differences in the confinement, cases of RC specimens with and without stirrups were considered. For unconfined cases, the relative bond strength was evaluated based on several parameters: corrosion level, crack width, cover-to-diameter ratio and concrete strength. For the cases with stirrups confinement, in addition to these parameters, the stirrups diameter-to-spacing ratio is also considered. In this study, the corrosion level was quantified as the mass loss percentage of rebar after corrosion. The existing test results were collected from literature [1,26,46,47,48,49] for calculation and verification. Finally, a parametric analysis was conducted systematically and the sensitivity of each parameter on the loss of bond strength was examined. The results are expected to be meaningful to the understanding of bond strength loss and the mechanical performance evaluation of corroded RC structures.

2. Summary of the Existing Test Results

Many experimental tests were conducted to investigate the bond strength of corroded reinforced concrete and the indices such as surface crack width and corrosion level were proposed for bond strength evaluation. Owing to the different research purposes, their parameter settings are quite different, and it is therefore difficult to develop a generic model that considers all experimental observations. To better understand the existing studies of bond degradation of concrete structures caused by rebar corrosion and to perform an analytical analysis, Lin et al. [
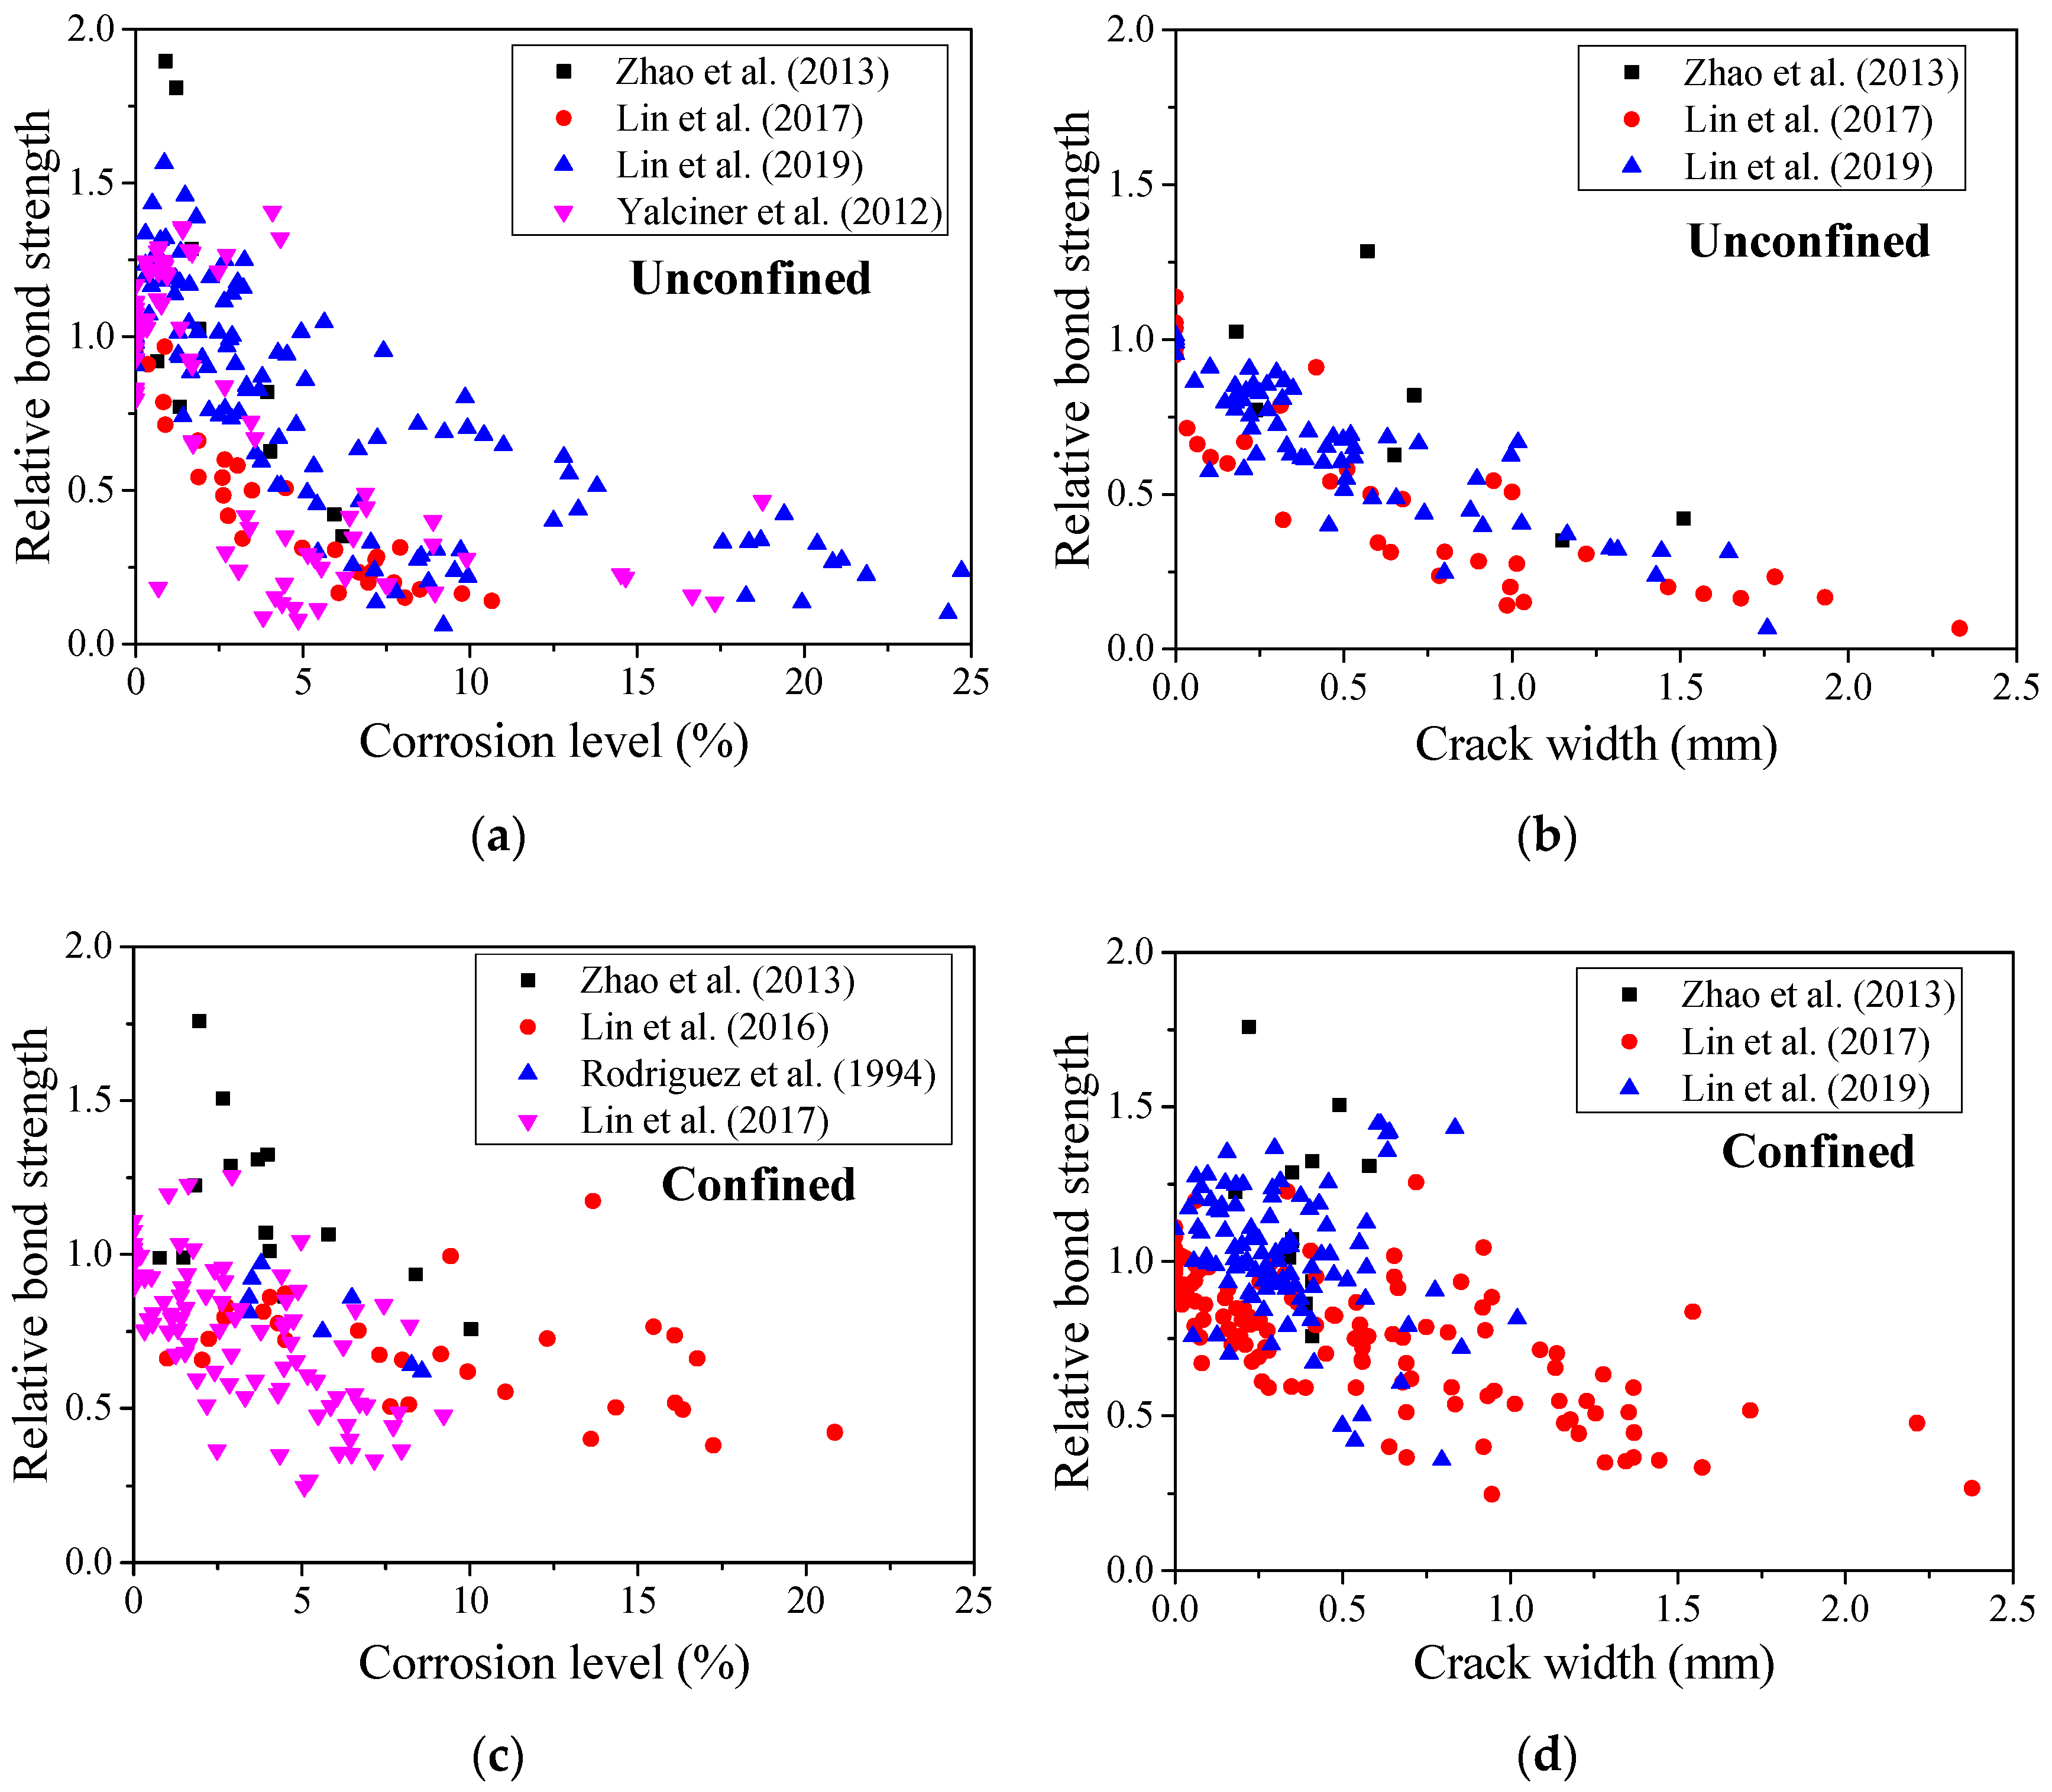
1] conducted a comprehensive review and summarized the known knowledge and the gaps. According to the test results collected by them, the existing data show a scattering trend, especially for cases with stirrups. In this study, data including those collected by Lin et al. and others were used, and the bond strength was normalized with the case without corrosion and plotted with respect to the corrosion level and the maximum crack width on the surface of concrete, respectively, as shown in Figure 1. The results show a consistent tendency for corrosion level in the unconfined case and enhancement is noticed when the corrosion level is low, as presented in Figure 1a. Besides, the crack width seems to show a better agreement with a decrease in relative bond strength, and a linear relationship can be observed. This is the main reason many researchers regard the maximum crack width as a critical parameter. However, for cases with stirrups confinement, a larger scattering is observed, regardless of the corrosion level or crack width. This implies that more parameters should be considered for precise bond strength evaluation. An intelligent method that can include multiple parameters is thus necessary and a soft computing method such ANN has intrinsic advantages for the evaluation.

3. Application of Artificial Neural Network (ANN) Model

3.1. ANN Model

Among soft computing techniques, ANN is usually the best option to study regression-type problems related to various parameters [40]. It is considered as a regression technique that captures higher nonlinearity between independent and dependent variables. In this study, an ANN structure which consists of a feed-forward multilayer perceptron, an error back-propagation technique of gradient descent and momentum and scaled data were utilized. The schematic of the feed-forward multilayer perception model is shown in Figure 2. In the model, the input and hidden layer may have a bias node and there can be one or more hidden layer(s). The calculation procedure for the link weight value can be seen in our previous studies [43,44]. In this study, the input layer contains independent variables (corrosion level, crack width, etc.) and one bias node (used as the intercept of each perceptron). The number of hidden layers is one. The node number of hidden layers is equal to the node number of input layer (including one bias node). The node value in the hidden layer can be calculated as follows
v j = ( 1 + exp ( 1 × i = 1 I x i w i j ) ) 1 ,   j = 1 , ,   J
where vj is node j in the hidden layer; xi is node i in the input layer; and wij is the weight between nodes in the input and hidden layer. For the output layer, the dependent variable is bond strength. The node value in the output layer can be calculated as below
y = ( 1 + exp ( 1 × j = 1 J v j w j 1 ) ) 1
where y is the node in the output layer. Error E between the experimental and calculated data can be considered as below
E = 0.5 ( d y ) 2
where d is the experimental data. Error signals from the output layer and the hidden layer can be calculated by Equations (4) and (5), respectively:
δ y = ( d y ) y ( 1 y )
δ v = v j ( 1 v j ) δ y w j 1 ,     j = 1 , , J
Weights between hidden and output layers and input and hidden layer can be adjusted using the following amounts, respectively:
Δ w j 1 = α δ y v j ,     j = 1 , , J
Δ w i j = α δ v x i ,     i = 1 , , I ;   j = 1 , , J
where α is learning rate, which was 1.0 in this study. Furthermore, to quicken the convergence to the optimal solutions, momentum can be considered as follows:
Δ w j 1 n = α δ y v j + β Δ w j 1 n 1 ,     j = 1 , , J
Δ w i j n = α δ v x i + β Δ w i j n 1 ,     i = 1 , , I ;   j = 1 , , J
where n is iteration number of error back-propagation and β is momentum constant (the value is 0.8 in this study). This momentum technique accelerates the training process (weight adjustment) in flat regions of the error surface and prevents fluctuations in the weights. The values of learning rate and momentum constant were chosen based on typically used ones [50].

3.2. Comparison between ANN and other Statistical Methods

The commonly used regression-type methods are multiple linear regression (MLR), multiple non-linear regression (MNR) and ANN [44,45]. For fair comparison, the proposed ANN model utilizes identical data for training and validation without testing as other statistical techniques do in the engineering field with relatively few data.
To prove that ANN is the most appropriate method among them for the assessment of bond strength, three methods were used for calculation using the same database that has 242 series of data (n = 242). The details of the database are shown in Appendix A. For all methods, the data of corrosion level and cover-to-diameter ratio were used as the inputs, which are generally considered the most important parameters affecting the bond strength degradation, while the relative bond strength is the output.
For bond strength assessment, the MLR model considering the corrosion level and cover-to-diameter ratio is given as
y = c 1 x 1 + c 2 x 2 + c 3 ,
where c1, c2 and c3 are the regression coefficients; x1 is the corrosion level; and x2 is the cover-to-diameter ratio. In this study, based on the fitting, c1 = −0.05299, c2 = 0.05061 and c3 = 0.8371.
For the MNR model, scale factors are needed, and the best fitting equation is given as
y = y max ( c 1 ( x 1 x 1 max ) e 1 + c 2 ( x 2 x 2 max ) e 2 + c 3 ) ,
where c1, c2, c3, e1 and e2 are the regression coefficients; x1 is the corrosion level; x2 is the cover-to-diameter ratio; and x1max, x2max and ymax are the scale factors, which are the maximum values for the corrosion level, the cover-to-diameter ratio and bond strength, respectively. From the fitting, the regression coefficients in this study were c1 = −0.6714, c2 = 0.1956, c3 = 0.565, e1 = 0.5465 and e2 = 1.6756.
As shown in Figure 3, the model-predicted results were compared with experimental results, and only unconfined cases (without stirrups) were considered for calculation. Based on the results, the coefficients of determination (R2) and root mean square error (RMSE) were calculated for comparison because they are two commonly used statistical parameters that show the accuracy of the model. On comparing R2, the results from the ANN method have the best fitting with the experimental results. While R2 is 0.455 for MLR and 0.535 for MNR, it is 0.667 for ANN, which is considerably higher. Further, in terms of RMSE, the results from the ANN method are the smallest, which indicates it has less error. Thus, the ANN method is worthy of further application to bond strength assessment.
Since the ANN method achieves the best evaluation result and epochs are important for accuracy, as identified in previous studies, different epochs were considered for the calculation. Here, epochs in artificial neural network means the number of operations of the entire training dataset. To obtain best training results, we have to properly set the maximum number of epochs (not too many but also not too few). In this study, epochs in the range 100–100,000 were selected. As shown in Figure 4, the calculated results show that the agreement between the predicted and experimental results could be improved by increasing epochs; however, the difference is insignificant. With fewer epochs, the calculated results can be determined quickly, and it is very promising to adopt this approach in the future. Therefore, the default number of epochs was 1000.

3.3. Comparison between ANN and Previous Analytical Models

Researchers have attempted to develop analytical models for evaluating the bond strength. Some models depend on corrosion level, while others include more parameters such as crack width. In this study, existing models used for the calculation were based on the same database as the one used by the ANN method. As shown in Figure 4, Figure 5, Figure 6 and Figure 7, the predicted results were compared with the experimental results and the R2 and RMSE were calculated. In Figure 5, the database has 242 series of data collected from existing studies, as mentioned in Section 2; all cases are for specimens without stirrups. The equations from Cabrera [51] and Chung et al. [52] were adopted for calculation, wherein only the corrosion level is considered as the input. The predicted results from ANN consider the corrosion level as the variable. The ANN shows clear advantages in both R2 and RMSE. In addition, Zhang et al. [53] developed a model which considers the crack width as the only variable. In this study, it was adopted for calculation and compared with the results from the ANN, as shown in Figure 6. There are 107 series of data for calculation, which are available from the existing literature. Although the analytical model developed by Zhang et al. showed a slightly better R2, the ANN method obtained fewer errors as the RMSE was smaller. It seems that the ANN method can achieve better prediction than the existing model considering only the crack width.
If more variables were considered for bond strength prediction, more accurate results would be obtained. To this end, models that include more parameters as inputs have been developed. For example, Yuan et al. [54] considered both the corrosion level and the cover-to-diameter ratio, whereas Wang et al. [55] considered the crack width and cover-to-diameter ratio as variables in their model. Similarly, based on the same database, predictions were obtained using the analytical model and the proposed ANN method, respectively. As shown in Figure 7 and Figure 8, comparisons were made with respect to R2 and RMSE. The results from the ANN method present higher values of both, verifying the advantage of this method.

3.4. Application of ANN Method on the Cases with the Unconfined Condition

As the proposed model is assumed to be a reliable method for assessing the bond strength of the corroded RC member, a parametric analysis was conducted to clarify the relationship between the bond strength loss and each parameter.
For the unconfined condition (without stirrups), the ANN method was used to calculate the bond strength with the same database based on the different parameters, as shown in Figure 9. The increase in the coefficient of determination is observed with an increase in the number of parameters. The input with crack width (Figure 9b) can achieve higher accuracy than that with the corrosion level (Figure 9a); however, the numbers of data are different, and, therefore, the advantage of each parameter is difficult to determine. There is an insignificant increase in the coefficient of determination when using the cover-to-diameter ratio; however, when both the corrosion level and crack width are considered, R2 can be improved to as high as 0.841 and the RMSE can be decreased significantly to as low as 0.127. Further, when more parameters are considered, the predicted results can match the test results perfectly. It shows the advantage of the ANN method that can achieve higher accuracy.

3.5. Application of ANN Method on the Cases with the Confined Condition

In contrast to cases with the unconfined condition, cases with the confined condition (with stirrups) are more complicated and the bond strength loss is influenced by more parameters. The calculated results based on the proposed ANN method are shown in Figure 10. When only a single factor is considered as the input, the coefficient of determination is rather low, and this is not satisfactory. Similarly, the degree of accuracy increases as more parameters are involved. Again, it seems that crack width plays an important role in the bond strength loss, which shows good agreement with the experimental observations. Although the results show scattering, when all important factors are considered, a good agreement between the predicted and the experimental results can be obtained. There is a major difference between the cases with and without confinement. While the bond strength is dominated by corrosion level and crack width in the cases of unconfined condition, other parameters such as concrete strength, cover-to-diameter ratio and stirrups diameter-to-spacing ratio are important in the cases of the confined condition. Since all of these parameters are very important, it is necessary to perform a parametric analysis to correlate the parameters in terms of bond strength degradation.

4. Correlation Analysis of Parameters Affecting Bond Strength

Different numbers of data were used for the calculations presented above, and it is difficult to analyze the correlation of each parameter for bond strength degradation. Therefore, for each comparison, we used the same database for the calculation based on the proposed ANN method. The results of the parametric study are presented in Table 1, Table 2, Table 3 and Table 4. In practice, the exact corrosion level inside a concrete structure is difficult to obtain; the prediction could be more convenient if an accurate prediction could be performed without considering the corrosion level. Therefore, in addition to cases with and without stirrups, cases with and without considering the corrosion level were investigated. The results for cases without stirrups that consider the corrosion level as a variable are presented in Table 1; the number of data for calculation is 39. As shown, when the corrosion level is known, the concrete strength is more important than the cover-to-diameter ratio. The crack width is insignificant in this case, and the accuracy increases as more variables are included, especially when all four parameters are considered.
Excluding the corrosion level as the variable, the parametric results of cases without stirrups are listed in Table 2. When the concrete strength or cover-to-diameter ratio is considered, R2 shows an acceptable value. However, the RMSE is not satisfactory in comparison with the results in Table 1. This implies that corrosion level is essential for accurate bond strength prediction. However, the results in Table 2 appear to be satisfactory because R2 is over 0.8 when two parameters are considered. The results indicate that concrete strength plays a more important role than the cover-to-diameter ratio. It is believed that the relative importance of each parameter is: corrosion level > crack width > concrete strength > cover-to-diameter ratio.
In the case under the confined condition, the results are more complicated. The number of data in this study is 109. As listed in Table 3, if only the corrosion level is considered, R2 is very low (0.317). Unlike the cases under the unconfined condition, the cover-to-diameter ratio becomes more important, which shows better correlation on bond strength than the other parameters. Similar results are also listed in Table 4, which shows the results of cases that do not consider corrosion level. The second important parameter is the stirrups diameter-to-spacing ratio. It is followed by concrete strength and finally by crack width. However, as listed in Table 4, if only one parameter is considered, the crack width can achieve higher accuracy than when using only the corrosion level. For the other three parameters, the importance rank is the same. It is worth noting that, when all four parameters are considered, R2 is greater than 0.8 and the RMSE is approximately 0.1, which means that accuracy is acceptable. Therefore, the results indicate that parameters related to the confinement are more important than those related to the material property in the case with stirrups. The relative importance of the parameter is: crack width > corrosion level > cover-to-diameter ratio > stirrups diameter-to-spacing ratio > concrete strength.
Compared with the cases of unconfined and confined conditions, the relative importance shows a different trend regarding the corrosion level and crack width due to the different importance role of the confinement. In the case of unconfined condition, since the confinement by concrete cover is not very strong, the corrosion level could be a more direct index. However, for the confined condition, the confinement stress from concrete cover and stirrups plays a more important role on the bond behavior, and the crack width shows a better predicted result on bond strength.

5. Conclusions

In this study, to assess the bond strength between concrete and the rebar after corrosion, an ANN was used to examine each parameter correlated to the bond degradation, with respect to the cases with and without confinement. Existing experimental data were collected for calculation and verification. The accuracy of assessment was found to be higher and the method showed more advantages compared to the existing models when more parameters were considered. For the training approach, the error-back-propagation approach using gradient descent and momentum techniques was adopted. Based on the results and discussions, the following conclusions can be drawn:
(1)
The proposed scaled FF-BP-ANN method shows higher accuracy than those based on multiple linear regression and multiple nonlinear regression. By inputting the corrosion level, crack width, concrete strength and cover-to-diameter ratio, the ANN method can achieve satisfactory results of bond strength when the rebar is corroded. Besides, the method was validated by comparing with results calculated based on the existing analytical models. The proposed method can be employed for evaluating structural performance in the future.
(2)
Different epochs were employed for the calculation, and there was an insignificant difference between cases with 1000 and 100,000 epochs. The proposed method was found to be effective in calculating with few epochs, such as 1000, which can help achieve reliable results and ensure efficient and fast calculations.
(3)
For the unconfined cases, the bond strengths were dominated by the corrosion level and crack width. For cases with a confined condition, in addition to the corrosion level and crack width, other parameters such as concrete strength, cover-to-diameter ratio and stirrups diameter/spacing ratio were also important. The accuracy of the predicted results was not satisfactory without these parameters. It seems that parameters related to confinement such as cover-to-diameter ratio are more important than the materials properties in cases under the confined condition, while the opposite trend is observed in the cases under the unconfined condition.
(4)
For both cases with and without confinement, if the prediction did not consider the corrosion level, the accuracy would be much lower. However, the results seem acceptable if all other parameters were considered as inputs. This means that it is feasible to predict the bond strength based on the crack width on the surface of concrete, the known configuration information and materials properties.
(5)
In the parametric analysis, the relative importance of each parameter was preliminarily examined. As indicated by the results, in cases under the unconfined condition, the relative importance was found to be: corrosion level > crack width > concrete strength > cover-to-diameter ratio. While for cases under the confined condition, the relative importance was: crack width > corrosion level > cover-to-diameter ratio > stirrups diameter-to-spacing ratio > concrete strength. Due to limited available data, these results require further verification.
With respect to the ANN model, to overcome the drawbacks of vanishing gradient of the Sigmoid function and local optima, we also plan a future study which improves this part by utilizing a harmony search meta-heuristic algorithm, one of the gradient-free global optimization algorithms, which can directly adopt the original step function representing threshold instead of Sigmoid or ReLU (Rectified Linear Unit).

Author Contributions

Analysis and writing—original draft preparation, Y.W.; methodology and supervision Z.W.G. and K.N.; Conceptualization and writing—review and editing, Z.W.G. and K.N.; and funding, Y.W. and Z.W.G. All authors have read and agreed to the published version of the manuscript.

Funding

The first author would like to express his sincere thanks to the Japan Society for the Promotion of Science (JSPS) for providing fellowship (P18348) for his study. The second author was supported by the Energy Cloud R&D Program through the National Research Foundation of Korea (NRF) funded by the Ministry of Science, ICT (2019M3F2A1073164).

Conflicts of Interest

The authors declare no conflict of interest.

Appendix A

Table A1. Dataset for cases without stirrups and variable with only cover to diameter ratio and corrosion level (n = 242).
ReferencesSpecimen No.Cover to Diameter RatioCorrosion Level (%)Relative Bond Strength
Zhao et al. (2013) [45]00-N-03.670.0001.000
00-N-13.670.6500.919
00-N-23.671.2101.810
00-N-33.671.8901.025
00-N-43.673.9300.819
00-N-53.675.9500.421
50-N-03.670.0001.000
50-N-13.670.9001.896
50-N-23.671.3200.772
50-N-33.671.6801.285
50-N-43.674.0200.626
50-N-53.676.1800.350
Lin et al. (2017) [47]LA01.50.0000.950
LA01.50.0001.054
LA01.52.5980.541
LA01.53.0470.581
LA01.54.4880.507
LA01.57.1810.275
LA01.58.0550.151
SA01.51.8660.661
SA01.52.7640.416
SA01.54.9840.312
SA01.510.6540.141
SA01.58.5040.178
SA01.59.7560.165
LB020.8910.713
LB020.8300.787
LB023.4820.500
LB022.6320.483
LB027.0650.237
LB025.9720.307
LB026.9640.200
LC030.3640.910
LC031.8820.543
LC037.9120.313
LC037.7300.200
LC036.0710.167
SC030.8700.967
SC032.6710.600
SC033.1970.343
SC037.2240.283
SC036.6780.233
Lin et al. (2019) [1] 70.2911.335
70.4931.434
70.8511.564
71.4781.459
71.8141.387
72.6661.248
73.2261.158
74.2560.947
74.5250.941
74.7940.714
76.6530.634
76.6980.465
77.1460.240
77.7950.168
78.7580.202
4.860.0000.952
4.860.2911.196
4.860.7391.314
4.860.8961.320
4.861.3441.276
4.861.1871.189
4.861.6131.168
4.862.8901.002
4.862.7330.968
4.862.9790.912
4.863.3150.840
4.863.3150.825
4.864.2780.669
4.865.1300.493
4.865.4430.299
4.866.4960.257
3.250.2911.234
3.250.4931.253
3.250.6271.274
3.250.7621.181
3.251.1651.137
3.251.8591.015
3.251.9940.931
3.251.6580.884
3.252.6660.766
3.252.8670.733
3.253.0690.752
3.253.0910.754
3.253.5840.619
3.254.2340.516
3.254.3460.516
5.133.6960.825
5.133.7860.869
5.139.9230.703
5.1310.9980.646
5.1312.8130.608
5.1312.9700.554
5.1313.7980.514
5.1319.3980.423
5.1320.3840.326
5.1321.1230.274
5.1324.7070.238
3.852.2401.194
3.852.6431.114
3.854.9501.015
3.858.4450.716
3.859.2290.688
3.859.8560.802
3.8510.4160.680
3.8518.3460.333
3.8518.7040.339
3.8520.8540.267
3.8521.8620.225
3.8524.3040.101
2.560.0000.907
2.561.2771.013
2.561.5901.044
2.562.4861.013
2.562.8220.992
2.565.0850.859
2.567.2350.669
2.5612.4990.402
2.5613.2380.438
2.5617.5620.331
2.5618.2560.156
2.5619.9360.135
1.280.0000.979
1.280.0001.025
1.280.4031.072
1.280.4701.164
1.281.2770.941
1.282.1500.901
1.282.1950.760
1.282.5090.743
1.283.7630.594
1.288.5340.286
1.289.5420.238
1.289.7220.305
1.289.9460.219
5.751.3220.935
5.752.8901.139
5.755.6451.046
5.757.4140.954
5.759.0050.307
4.191.4110.741
4.193.2481.248
4.195.3310.579
4.197.0340.331
4.198.4450.274
3.250.0001.000
3.251.3221.177
3.253.0461.177
3.255.4210.455
3.257.1900.135
3.259.2060.061
Yalciner et al. (2012) [26]R1SP11.070.0000.986
R1SP21.070.0001.018
R1SP31.070.0000.996
R2SP12.140.0001.055
R2SP22.140.0000.927
R2SP32.140.0001.018
R3SP13.210.0000.818
R3SP23.210.0001.169
R3SP33.210.0001.014
R4SP11.078.9000.401
R4SP21.074.1001.408
R4SP31.072.4701.213
R4SP41.072.7201.267
R4SP51.074.3201.321
R4SP61.074.3301.321
R4SP71.074.0901.408
R4SP81.076.5100.347
R4SP91.0714.5200.227
R5SP12.141.3701.357
R5SP22.143.4500.724
R5SP32.145.5600.249
R5SP42.141.4001.349
R5SP52.141.6901.274
R5SP62.141.6001.281
R5SP72.143.5700.671
R5SP82.145.3600.279
R5SP92.1416.6500.158
R6SP13.210.6901.291
R6SP23.211.6900.905
R6SP33.212.6600.838
R6SP43.210.6801.209
R6SP53.210.6601.277
R6SP63.210.8401.236
R6SP73.210.8801.230
R6SP83.211.6000.926
R6SP93.213.8100.088
R7SP11.0718.7500.466
R7SP21.078.9000.325
R7SP31.0714.6600.217
R8SP12.146.8700.490
R8SP22.1417.3300.136
R8SP32.146.4000.415
R9SP13.216.2700.216
R9SP23.210.6801.216
R9SP33.213.8100.088
R10SP11.070.0001.091
R10SP21.070.0000.796
R10SP31.070.0001.113
R11SP12.140.0000.986
R11SP22.140.0001.024
R11SP32.140.0000.991
R12SP13.210.0000.832
R12SP23.210.0001.076
R12SP33.210.0001.092
R13SP11.071.3301.030
R13SP21.077.4800.195
R13SP31.074.4700.351
R13SP41.070.7701.241
R13SP51.070.8001.247
R13SP61.070.9001.208
R13SP71.070.9401.197
R13SP81.077.5600.195
R13SP91.073.3000.417
R14SP12.140.0000.962
R14SP22.145.1400.292
R14SP32.145.4600.113
R14SP42.140.6501.123
R14SP52.140.6800.184
R14SP62.140.7701.108
R14SP72.140.7701.104
R14SP82.141.7000.660
R14SP92.144.4500.198
R15SP13.210.0001.111
R15SP23.212.6900.298
R15SP33.210.3401.029
R15SP43.210.3101.241
R15SP53.210.4001.217
R15SP63.210.4101.209
R15SP73.214.7300.118
R15SP83.214.3800.134
R15SP93.214.1700.153
R16SP11.078.9500.167
R16SP21.076.9000.445
R16SP31.073.4100.378
R17SP12.149.9000.278
R17SP22.144.8600.080
R17SP32.141.7200.651
R18SP13.210.3401.056
R18SP23.210.3401.245
R18SP33.213.0800.240
Table A2. Dataset for cases with stirrups and variable with only stirrups diameter to spacing ratio and corrosion level (n = 157).
ReferencesSpecimen No.Stirrups Diameter/SpacingCorrosion Level (%)Relative Bond Strength
Zhao et al. (2013) [45]00-S-08/1000.0001.000
00-S-18/1001.8301.223
00-S-28/1002.6601.505
00-S-38/1003.6901.308
50-S-08/1000.0001.000
50-S-18/1001.9601.759
50-S-28/1002.8901.287
50-S-38/1003.9901.324
00-B-08/1000.0001.000
00-B-18/1000.7800.988
00-B-28/1003.9301.070
00-B-38/1004.4800.862
00-B-48/10010.0400.756
50-B-08/1000.0001.000
50-B-18/1001.4800.989
50-B-28/1004.0501.011
50-B-38/1005.8001.064
50-B-48/1008.3900.934
Lin et al. (2017) [47]I-L-06/1500.0001.000
I-R-06/1500.0001.000
I-L-36/1504.5200.722
I-R-36/1508.0000.657
I-L-66/1507.6400.505
I-R-66/1504.3000.777
I-L-96/15013.6000.402
I-R-96/15012.3100.726
I-L-126/15017.2400.381
I-R-126/15011.0600.552
I-L-156/15016.1100.518
I-R-156/15020.8600.423
II-L-06/1000.0001.000
II-R-06/1000.0001.000
II-L-36/1002.0400.657
II-R-36/1002.7500.831
II-L-66/1004.5200.872
II-R-66/1002.7100.796
II-L-96/1006.6900.752
II-R-96/1008.1900.512
II-L-126/10016.7700.661
II-R-126/10013.6701.173
II-L-156/10016.1000.737
II-R-156/10015.4700.765
III-L-06/700.0001.000
III-R-06/700.0001.000
III-L-36/701.0100.662
III-R-36/702.2400.725
III-L-66/703.8600.814
III-R-66/704.0600.861
III-L-96/709.4300.994
III-R-96/707.3100.674
III-L-126/709.1400.676
III-R-126/709.9400.619
III-L-156/7016.3300.496
III-R-156/7014.3500.502
Rodriguez et al. (1994) [44]Type I8/700.0001.000
Type I8/703.7900.970
Type I8/706.4900.860
Type I8/700.0001.000
Type I8/703.5200.920
Type I8/705.6200.750
Type II6/1000.0001.000
Type II6/1003.4400.860
Type II6/1008.2700.640
Type II6/1000.0001.000
Type II6/1003.4400.810
Type II6/1008.5800.620
Lin et al. (2016) [46]LA18/2000.8980.846
LA18/2000.5670.776
LA18/2001.2520.675
LA18/2002.9060.675
LA18/2003.6140.591
LA18/2007.8900.487
LA18/2005.8580.507
LA18/2007.7240.443
LA28/1002.1500.866
LA28/1001.7721.017
LA28/1002.7170.913
LA28/1006.0470.537
LA28/1006.2360.702
LA28/1007.4410.836
LA48/500.0000.927
LA48/500.0001.078
LA48/501.0391.195
LA48/501.6301.225
LA48/501.3701.034
LA48/502.9291.256
LA48/502.4090.950
LA48/504.9841.044
LA48/504.8900.883
LA48/508.2200.769
SA28/501.4410.893
SA28/500.0000.970
SA28/500.0001.004
SA28/500.0001.034
SA28/502.6220.846
SA28/501.1340.792
SA28/503.7800.752
SA28/505.1730.608
SA28/504.8430.655
SA28/506.3540.447
LB18/2000.5260.927
LB18/2000.2020.997
LB18/2002.4090.620
LB18/2002.1860.510
LB18/2002.8540.580
LB18/2006.4780.353
LB18/2006.1130.357
LB18/2007.1660.333
LB28/1000.0001.020
LB28/1000.0001.017
LB28/1000.0000.980
LB28/1001.1130.807
LB28/1004.4740.763
LB28/1006.5790.547
LB28/1009.2310.477
LB28/1006.7210.517
LB48/500.0001.000
LB48/500.3240.923
LB48/500.3240.933
LB48/501.5590.827
LB48/501.3970.867
LB48/504.7570.787
LB48/504.3930.933
LB48/504.5340.850
LB48/504.3720.563
LC18/2000.3240.753
LC18/2006.5970.820
LC18/2003.3190.537
LC18/2002.4890.367
LC18/2005.0790.247
LC18/2004.3510.350
LC18/2005.2210.267
LC28/1000.0001.110
LC28/1000.0000.893
LC28/1000.5870.810
LC28/1001.4170.793
LC28/1001.6390.710
LC28/1006.4350.400
LC28/1004.4720.633
LC28/1006.9410.510
LC28/1007.9730.367
LC48/500.4450.790
LC48/501.0320.750
LC48/502.5500.757
LC48/501.5380.680
LC48/504.5130.777
LC48/504.6750.713
LC48/505.4440.590
SC28/500.0001.000
SC28/501.5990.937
SC28/502.6710.957
SC28/501.3150.757
SC28/501.8820.593
SC28/503.1770.823
SC28/503.0150.793
SC28/504.2900.547
SC28/505.4840.477
Table A3. Dataset for cases without stirrups and variables including corrosion level (n = 39).
ReferenceSpecimen No.Concrete Strength (MPa)Cover to Diameter RatioCrack Width (mm)Corrosion Level (%)Relative Bond Strength
Zhao et al. (2013) [45]00-N-341.93.670.1801.8901.025
00-N-441.93.670.7103.9300.819
00-N-541.93.671.5105.9500.421
50-N-238.43.670.2401.3200.772
50-N-338.43.670.5701.6801.285
50-N-438.43.670.6504.0200.626
50-N-538.43.671.1506.1800.350
Lin et al. (2017) [47]LA0331.50.0000.0000.950
LA0331.50.0000.0001.054
LA0331.50.4602.5980.541
LA0331.50.5103.0470.581
LA0331.51.0004.4880.507
LA0331.51.0157.1810.275
LA0331.51.0358.0550.151
SA0331.50.0651.8660.661
SA0331.50.3202.7640.416
SA0331.50.6404.9840.312
SA0331.50.98510.6540.141
SA0331.51.5708.5040.178
SA0331.51.6809.7560.165
LB03320.0350.8910.713
LB03320.3130.8300.787
LB03320.5813.4820.500
LB03320.6752.6320.483
LB03320.7847.0650.237
LB03321.2215.9720.307
LB03321.4646.9640.200
LC03330.4180.3640.910
LC03330.9451.8820.543
LC03330.8017.9120.313
LC03330.9957.7300.200
LC03331.9306.0710.167
SC03330.0000.0001.137
SC03330.0000.0001.037
SC03330.0000.8700.967
SC03330.1542.6710.600
SC03330.6023.1970.343
SC03330.9007.2240.283
SC03331.7816.6780.233
Table A4. Dataset for cases with stirrups and variables including corrosion level (n = 109).
ReferencesSpecimen No.Concrete Strength (MPa)Stirrups Diameter/SpacingCover to Diameter RatioCrack Width (mm)Corrosion LevelRelative Bond Strength
Zhao et al. (2013) [45]00-S-041.98/1003.670.0000.0001.000
00-S-141.98/1003.670.1801.8301.223
00-S-241.98/1003.670.4902.6601.505
00-S-341.98/1003.670.5803.6901.308
50-S-038.48/1003.670.0000.0001.000
50-S-138.48/1003.670.2201.9601.759
50-S-238.48/1003.670.3502.8901.287
50-S-338.48/1003.670.4103.9901.324
00-B-042.58/1001.670.0000.0001.000
00-B-142.58/1001.670.0000.7800.988
00-B-242.58/1001.670.3503.9301.070
00-B-342.58/1001.670.3904.4800.862
00-B-442.58/1001.670.41010.0400.756
50-B-035.38/1001.670.0000.0001.000
50-B-135.38/1001.670.0001.4800.989
50-B-235.38/1001.670.3404.0501.011
50-B-335.38/1001.670.3505.8001.064
50-B-435.38/1001.670.4108.3900.934
Lin et al. (2017) [47]LA1338/2001.50.2050.8980.846
LA1338/2001.50.2750.5670.776
LA1338/2001.50.2301.2520.675
LA1338/2001.50.5602.9060.675
LA1338/2001.50.8253.6140.591
LA1338/2001.51.1807.8900.487
LA1338/2001.51.2555.8580.507
LA1338/2001.51.2057.7240.443
LA2338/1001.50.3652.1500.866
LA2338/1001.50.6551.7721.017
LA2338/1001.50.6652.7170.913
LA2338/1001.51.0156.0470.537
LA2338/1001.51.1406.2360.702
LA2338/1001.51.5457.4410.836
LA4338/501.50.0000.0000.927
LA4338/501.50.0000.0001.078
LA4338/501.50.0601.0391.195
LA4338/501.50.3351.6301.225
LA4338/501.50.4051.3701.034
LA4338/501.50.7202.9291.256
LA4338/501.50.6552.4090.950
LA4338/501.50.9204.9841.044
LA4338/501.50.9454.8900.883
LA4338/501.50.8158.2200.769
SA2338/501.50.0351.4410.893
SA2338/501.50.0000.0000.970
SA2338/501.50.0000.0001.004
SA2338/501.50.0000.0001.034
SA2338/501.50.1852.6220.846
SA2338/501.50.4201.1340.792
SA2338/501.50.6803.7800.752
SA2338/501.50.6805.1730.608
SA2338/501.51.1354.8430.655
SA2338/501.51.3706.3540.447
LB1338/20020.0500.5260.927
LB1338/20020.2880.2020.997
LB1338/20020.7052.4090.620
LB1338/20020.6902.1860.510
LB1338/20020.9532.8540.580
LB1338/20021.3456.4780.353
LB1338/20021.4446.1130.357
LB1338/20021.5737.1660.333
LB2338/10020.0000.0001.020
LB2338/10020.020-1.017
LB2338/10020.0000.0000.980
LB2338/10020.2531.1130.807
LB2338/10020.6504.4740.763
LB2338/10021.1466.5790.547
LB2338/10021.1619.2310.477
LB2338/10021.7176.7210.517
LB4338/5020.0000.0001.000
LB4338/5020.0250.3240.923
LB4338/5020.2530.3240.933
LB4338/5020.4711.5590.827
LB4338/5020.5411.3970.867
LB4338/5020.7494.7570.787
LB4338/5020.8544.3930.933
LB4338/5020.9184.5340.850
LB4338/5020.9334.3720.563
LC1338/20030.0750.3240.753
LC1338/20030.1446.5970.820
LC1338/20030.8363.3190.537
LC1338/20030.6922.4890.367
LC1338/20030.9455.0790.247
LC1338/20031.2844.3510.350
LC1338/20032.3785.2210.267
LC2338/10030.0000.0001.110
LC2338/10030.0000.0000.893
LC2338/10030.0850.5870.810
LC2338/10030.2241.4170.793
LC2338/10030.2791.6390.710
LC2338/10030.9206.4350.400
LC2338/10031.2794.4720.633
LC2338/10031.3536.9410.510
LC2338/10031.3687.9730.367
LC4338/5030.0600.4450.790
LC4338/5030.5371.0320.750
LC4338/5030.5772.5500.757
LC4338/5030.5571.5380.680
LC4338/5030.9254.5130.777
LC4338/5031.0904.6750.713
LC4338/5031.3685.4440.590
SC2338/5030.0000.0001.000
SC2338/5030.0601.5990.937
SC2338/5030.3282.6710.957
SC2338/5030.1941.3150.757
SC2338/5030.3481.8820.593
SC2338/5030.4783.1770.823
SC2338/5030.5523.0150.793
SC2338/5031.2294.2900.547
SC2338/5032.2145.4840.477

References

  1. Lin, H.; Zhao, Y.; Feng, P.; Ye, H.; Ozbolt, J.; Jiang, C.; Yang, J.-Q. State-of-the-art review on the bond properties of corroded reinforcing steel bar. Constr. Build. Mater. 2019, 213, 216–233. [Google Scholar] [CrossRef]
  2. Almusallam, A.A.; Al-Gahtani, A.S.; Aziz, A.R. Effect of reinforcement corrosion on bond strength. Constr. Build. Mater. 1996, 10, 123–129. [Google Scholar] [CrossRef]
  3. Bagheri, M.; Hosseini, S.A.; Keshtegar, B.; Correia, J.A.; Trung, N.-T. Uncertain time-dependent reliability analysis of corroded RC structures applying three-term conjugate method. Eng. Fail. Anal. 2020, 115, 104599. [Google Scholar] [CrossRef]
  4. Jiradilok, P.; Wang, Y.; Nagai, K.; Matsumoto, K. Development of discrete meso-scale bond model for corrosion damage at steel-concrete interface based on tests with/without concrete damage. Constr. Build. Mater. 2020, 236, 117615. [Google Scholar] [CrossRef]
  5. Stroński, P.; Błażejewski, W.; Socha, T.; Denisiewicz, A.; Kula, K.; Lesiuk, G.; Correia, J.A. Influence of reinforcement Type on Flexural Behaviour of Reinforced Concrete Beams. Proc. Inst. Civ. Eng. Forensic Eng. 2020, 1–9. [Google Scholar] [CrossRef]
  6. Zhu, W.; François, R. Corrosion of the reinforcement and its influence on the residual structural performance of a 26-year-old corroded RC beam. Constr. Build. Mater. 2014, 51, 461–472. [Google Scholar] [CrossRef]
  7. Toongoenthong, K.; Maekawa, K. Simulation of Coupled Corrosive Product Formation, Migration into Crack and Propagation in Reinforced Concrete Sections. J. Adv. Concr. Technol. 2005, 3, 253–265. [Google Scholar] [CrossRef] [Green Version]
  8. Zhang, T.; Lyu, X.; Yu, Y. Prediction and Analysis of the Residual Capacity of Concrete-Filled Steel Tube Stub Columns under Axial Compression Subjected to Combined Freeze—Thaw Cycles and Acid Rain Corrosion. Materials 2019, 12, 3070. [Google Scholar] [CrossRef] [Green Version]
  9. Lyu, X.; Xu, Y.; Xu, Q.; Yu, Y. Axial compression performance of square thin walled concrete-Filled steel tube stub columns with reinforcement stiffener under constant high-Temperature. Materials 2019, 12, 1098. [Google Scholar] [CrossRef] [Green Version]
  10. Takewaka, K.; Yamaguchi, T.; Maeda, S. Simulation model for deterioration of concrete structures due to chloride attack. J. Adv. Concr. Technol. 2003, 1, 139–146. [Google Scholar] [CrossRef] [Green Version]
  11. Angst, U.M. Predicting the time to corrosion initiation in reinforced concrete structures exposed to chlorides. Cem. Concr. Res. 2019, 115, 559–567. [Google Scholar] [CrossRef]
  12. Cui, Z.; Alipour, A. Concrete cover cracking and service life prediction of reinforced concrete structures in corrosive environments. Constr. Build. Mater. 2018, 159, 652–671. [Google Scholar] [CrossRef]
  13. Andrade, C.; Alonso, C.; Molina, F.J. Cover cracking as a function of bar corrosion: Part I-Experimental test. Mater. Struct. 1993, 26, 453–464. [Google Scholar] [CrossRef]
  14. Beushausen, H.; Torrent, R.; Alexander, M.G. Performance-based approaches for concrete durability: State of the art and future research needs. Cem. Concr. Res. 2019, 119, 11–20. [Google Scholar] [CrossRef]
  15. Zhang, D.; Zhao, Y.; Ueda, T.; Li, X.; Xu, Q. CFRP strengthened RC beams with pre-strengthening non-uniform reinforcement corrosion subjected to post-strengthening wetting/drying cycles. Eng. Struct. 2016, 127, 331–343. [Google Scholar] [CrossRef]
  16. Liu, Q.; Feng, G.; Xia, J.; Yang, J.; Li, L. Ionic transport features in concrete composites containing various shaped aggregates: A numerical study. Compos. Struct. 2018, 183, 371–380. [Google Scholar] [CrossRef] [Green Version]
  17. Shen, X.; Jiang, W.; Hou, D.; Hu, Z.; Yang, J.; Liu, Q. Numerical study of carbonation and its effect on chloride binding in concrete. Cem. Concr. Compos. 2019, 104, 103402. [Google Scholar] [CrossRef]
  18. Liu, Q.; Hu, Z.; Lu, X.; Yang, J.; Azim, I.; Sun, W. Prediction of Chloride Distribution for Offshore Concrete Based on Statistical Analysis. Materials 2020, 13, 174. [Google Scholar] [CrossRef] [Green Version]
  19. Zhao, Y.; Dong, J.; Wu, Y.; Jin, W. Corrosion-induced concrete cracking model considering corrosion product-filled paste at the concrete/steel interface. Constr. Build. Mater. 2016, 116, 273–280. [Google Scholar] [CrossRef]
  20. Cheng, X.; Su, Q.; Ma, F.; Liu, X.; Liang, X. Investigation on crack propagation of concrete cover induced by non-uniform corrosion of multiple rebars. Eng. Fract. Mech. 2018, 201, 366–384. [Google Scholar] [CrossRef]
  21. Zhu, W.; François, R.; Zhang, C.; Zhang, D. Propagation of corrosion-induced cracks of the RC beam exposed to marine environment under sustained load for a period of 26years. Cem. Concr. Res. 2018, 103, 66–76. [Google Scholar] [CrossRef]
  22. Yang, S.T.; Li, K.F.; Li, C.Q. Numerical determination of concrete crack width for corrosion-affected concrete structures. Comput. Struct. 2018, 207, 75–82. [Google Scholar] [CrossRef] [Green Version]
  23. Demis, S.; Pilakoutas, K.; Apostolopoulos, C.A. Effect of corrosion on bond strength of steel and non-metallic reinforcement. Mater. Corros. 2010, 61, 328–331. [Google Scholar] [CrossRef]
  24. Cairns, J.; Pregartner, T.; Ožbolt, J. Modelling effect of corrosion on bond strength of plain bar reinforcement. Struct. Concr. 2004, 5, 113–120. [Google Scholar]
  25. Fu, X.; Chung, D.D.L. Effect of corrosion on the bond between concrete and steel rebar. Cem. Concr. Res. 1997, 27, 1811–1815. [Google Scholar] [CrossRef]
  26. Yalciner, H.; Eren, O.; Sensoy, S. An experimental study on the bond strength between reinforcement bars and concrete as a function of concrete cover, strength and corrosion level. Cem. Concr. Res. 2012, 42, 643–655. [Google Scholar] [CrossRef]
  27. Abosrra, L.; Ashour, A.F.; Youseffi, M. Corrosion of steel reinforcement in concrete of different compressive strengths. Constr. Build. Mater. 2011, 25, 3915–3925. [Google Scholar] [CrossRef]
  28. Lee, H.-S.; Noguchi, T.; Tomosawa, F. Evaluation of the bond properties between concrete and reinforcement as a function of the degree of reinforcement corrosion. Cem. Concr. Res. 2002, 32, 1313–1318. [Google Scholar] [CrossRef]
  29. Sánchez, P.J.; Huespe, A.E.; Oliver, J.; Toro, S. Mesoscopic model to simulate the mechanical behavior of reinforced concrete members affected by corrosion. Int. J. Solids Struct. 2010, 47, 559–570. [Google Scholar] [CrossRef] [Green Version]
  30. Zandi Hanjari, K.; Coronelli, D.; Lundgren, K. Bond capacity of severely corroded bars with corroded stirrups. Mag. Concr. Res. 2011, 63, 953–968. [Google Scholar] [CrossRef] [Green Version]
  31. Zhou, H.J.; Liang, X.B.; Zhang, X.L.; Lu, J.L.; Xing, F.; Mei, L. Variation and degradation of steel and concrete bond performance with corroded stirrups. Constr. Build. Mater. 2017, 138, 56–68. [Google Scholar] [CrossRef]
  32. Lin, H.; Zhao, Y.; Ozbolt, J.; Feng, P.; Jiang, C.; Eligehausen, R. Analytical model for the bond stress-slip relationship of deformed bars in normal strength concrete. Constr. Build. Mater. 2019, 198, 570–586. [Google Scholar] [CrossRef]
  33. Jiang, C.; Wu, Y.-F.; Dai, M.-J. Degradation of steel-to-concrete bond due to corrosion. Constr. Build. Mater. 2018, 158, 1073–1080. [Google Scholar] [CrossRef]
  34. Wu, Y.-Z.; Lv, H.-L.; Zhou, S.-C.; Fang, Z.-N. Degradation model of bond performance between deteriorated concrete and corroded deformed steel bars. Constr. Build. Mater. 2016, 119, 89–95. [Google Scholar] [CrossRef]
  35. Lim, S.; Akiyama, M.; Frangopol, D.M. Assessment of the structural performance of corrosion-affected RC members based on experimental study and probabilistic modeling. Eng. Struct. 2016, 127, 189–205. [Google Scholar] [CrossRef]
  36. Chiriatti, L.; Mercado-Mendoza, H.; Apedo, K.L.; Fond, C.; Feugeas, F. A study of bond between steel rebar and concrete under a friction-based approach. Cem. Concr. Res. 2019, 120, 132–141. [Google Scholar] [CrossRef]
  37. Van Steen, C.; Verstrynge, E.; Wevers, M.; Vandewalle, L. Assessing the bond behaviour of corroded smooth and ribbed rebars with acoustic emission monitoring. Cem. Concr. Res. 2019, 120, 176–186. [Google Scholar] [CrossRef]
  38. Xi, X.; Yang, S.; Li, C.-Q. A non-uniform corrosion model and meso-scale fracture modelling of concrete. Cem. Concr. Res. 2018, 108, 87–102. [Google Scholar] [CrossRef] [Green Version]
  39. Jiradilok, P.; Nagai, K.; Matsumoto, K. Meso-scale modeling of non-uniformly corroded reinforced concrete using 3D discrete analysis. Eng. Struct. 2019, 197, 109378. [Google Scholar] [CrossRef]
  40. Naderpour, H.; Nagai, K.; Fakharian, P.; Haji, M. Innovative models for prediction of compressive strength of FRP-confined circular reinforced concrete columns using soft computing methods. Compos. Struct. 2019, 215, 69–84. [Google Scholar] [CrossRef]
  41. Seghier, M.E.A.B.; Keshtegar, B.; Correia, J.A.; Lesiuk, G.; De Jesus, A.M. Reliability analysis based on hybrid algorithm of M5 model tree and Monte Carlo simulation for corroded pipelines: Case of study X60 Steel grade pipes. Eng. Fail. Anal. 2019, 97, 793–803. [Google Scholar] [CrossRef]
  42. Liu, Z.; Liu, X.; Wang, K.; Liang, Z.; Correia, J.A.; De Jesus, A.M. GA-BP Neural Network-Based Strain Prediction in Full-Scale Static Testing of Wind Turbine Blades. Energies 2019, 12, 1026. [Google Scholar] [CrossRef] [Green Version]
  43. Geem, Z.W.; Tseng, C.-L.; Kim, J.; Bae, C. Trenchless water pipe condition assessment using artificial neural network. In Proceedings of the ASCE International Conference on Pipeline Engineering and Construction, Boston, MA, USA, 8–11 July 2007; pp. 1–9. [Google Scholar]
  44. Geem, Z.W.; Roper, W.E. Energy demand estimation of South Korea using artificial neural network. Energy Policy 2009, 37, 4049–4054. [Google Scholar] [CrossRef]
  45. Geem, Z.W.; Kim, J.-H. Application of computational intelligence techniques to an environmental flow formula. Int. J. Fuzzy Log. Intell. Syst. 2018, 18, 237–244. [Google Scholar] [CrossRef] [Green Version]
  46. Rodriguez, J.; Ortega, L.; Casal, J. Corrosion of reinforcing bars and service life of reinforced concrete structures: Corrosion and bond deterioration. In Proceedings of the International Conference on Concrete across Borders, Odense, Denmark, 22–25 June 1994; pp. 315–326. [Google Scholar]
  47. Zhao, Y.; Lin, H.; Wu, K.; Jin, W. Bond behaviour of normal/recycled concrete and corroded steel bars. Constr. Build. Mater. 2013, 48, 348–359. [Google Scholar] [CrossRef]
  48. Lin, H.; Zhao, Y. Effects of confinements on the bond strength between concrete and corroded steel bars. Constr. Build. Mater. 2016, 118, 127–138. [Google Scholar] [CrossRef]
  49. Lin, H.; Zhao, Y.; Ožbolt, J.; Hans-Wolf, R. The bond behavior between concrete and corroded steel bar under repeated loading. Eng. Struct. 2017, 140, 390–405. [Google Scholar] [CrossRef]
  50. Oh, C.S. Introduction to the Neurocomputer; Naeha Publishing: Seoul, Korea, 2000. [Google Scholar]
  51. Cabrera, J. Deterioration of concrete due to reinforcement steel corrosion. Cem. Concr. Compos. 1996, 18, 47–59. [Google Scholar] [CrossRef]
  52. Chung, L.; Kim, J.-H.J.; Yi, S.-T. Bond strength prediction for reinforced concrete members with highly corroded reinforcing bars. Cem. Concr. Compos. 2008, 30, 603–611. [Google Scholar] [CrossRef]
  53. Zhang, Y.; Jiang, L.; Zhang, W. Durability of Concrete Structures; Shanghai Scientific Technology Press: Shanghai, China, 2003. (In Chinese) [Google Scholar]
  54. Yuan, Y.; Yu, S.; Jia, F. Deterioration of bond behavior of corroded reinforced concrete. Ind. Constr. 1999, 11, 47–50. (In Chinese) [Google Scholar]
  55. Wang, L.; Tao, F.; Wang, Q. Experimental study on bond anchorage of corroded reinforcement in concrete. Ind. Constr. 1996, 26, 14–16. (In Chinese) [Google Scholar]
Figure 1. Experimental database for bond strength degradation with corrosion level and crack width: (a) bond strength versus corrosion level in unconfined case; (b) bond strength versus crack width in unconfined case; (c) bond strength versus corrosion level in confined case; and (d) bond strength versus crack width in confined case; [1,26,46,47,48,49].
Applsci 10 04724 g001
Figure 2. Schematic of feed-forward multilayer perception model.
Applsci 10 04724 g002
Figure 3. Comparison of the predicted results using: (a) multiple linear regression (MLR); (b) multiple non-linear regression (MNR); and (c) artificial neutral network (ANN).
Applsci 10 04724 g003
Figure 4. Comparison of the results predicted by ANN using different epochs: (a) 100; (b) 1000; (c) 10,000; and (d) 100,000.
Applsci 10 04724 g004
Figure 5. Comparison between the existing analytical models and ANN method considering only corrosion level as an input for specimens without stirrups (unconfined) (note: τu(η) is the bond strength of specimen with corrosion level of η, τu(0) is the bond strength of the specimen without corrosion damage and η is the corrosion level): (a) Cabrera (1996) [51]; (b) Chung et al. (2008) [52]; (c) ANN.
Applsci 10 04724 g005
Figure 6. Comparison between the existing analytical models and ANN method considering only crack width as input for specimens without stirrups (unconfined) (note: τu(w) is the bond strength of specimen with crack width w, τu(0) is the bond strength of specimen without corrosion damage and w is the crack width on the surface of specimen): (a) Zhang et al. (2003) [53]; (b) ANN.
Applsci 10 04724 g006
Figure 7. Comparison between the existing analytical models and ANN method considering both corrosion level and cover-to-diameter ratio as inputs for specimens without stirrups (unconfined) (note τu(η) is the bond strength of specimen with corrosion level of η, τu(0) is the bond strength of specimen without corrosion damage and η is the corrosion level and c/d is the cover-to-diameter ratio): (a) Yuan et al. (1999) [54]; (b) ANN.
Applsci 10 04724 g007
Figure 8. Comparison between the existing analytical models and ANN method considering both crack width and cover-to-diameter ratio as inputs for specimens without stirrups (unconfined) (note τu(w) is the bond strength of specimen with crack width w, τu(0) is the bond strength of specimen without corrosion damage, w is the crack width on the surface of specimen and c/d is the cover-to-diameter ratio): (a) Wang et al. (1996) [55]; (b) ANN.
Applsci 10 04724 g008
Figure 9. Comparison of the results calculated by ANN method considering different parameters for the unconfined cases: (a) corrosion level; (b) crack width; (c) corrosion level and cover to diameter ratio; (d) corrosion level and crack width; (e) corrosion level, crack width, cover to diameter ratio and concrete strength.
Applsci 10 04724 g009
Figure 10. Comparison of the results calculated by ANN method considering different parameters for the confined cases: (a) corrosion level; (b) crack width; (c) crack width and corrosion level; (d) corrosion level and stirrups diameter/spacing ratio; (e) crack width and stirrups diameter/spacing ratio; (f) crack width, corrosion level and stirrups diameter/spacing ratio; (g) crack width, corrosion level, concrete strength, cover to diameter ratio and stirrups diameter/spacing ratio.
Applsci 10 04724 g010aApplsci 10 04724 g010b
Table 1. Results of cases without stirrups and variables including corrosion level (n = 39).
CasesCLCL+CDCL+CSCL+CWCL+CS+CDCL+CS+CWCL+CD+CWCL+CS+CD+CW
R20.820.910.9230.8410.950.9420.9620.986
RMSE0.1360.0960.0880.1270.0720.0770.0620.039
Note: CL, corrosion level; CW, crack width; CD, cover-to-diameter ratio; CS, concrete strength.
Table 2. Results of cases without stirrups and variables without including corrosion level (n = 39).
CasesCWCW+CDCW+CSCW+CD+CS
R20.6710.8170.8290.867
RMSE0.1830.1370.1320.116
Note: CW, crack width; CD, cover-to-diameter ratio; CS, concrete strength.
Table 3. Results of cases with stirrups and variables including corrosion level (n = 109).
CasesCLCL+CDCL+CSCL+CWCL+DSSCL+CW+CDCL+CS+CD
R20.3170.5950.5460.4690.5070.730.676
RMSE0.230.1710.1830.1960.2040.140.154
CasesCL+CS+CWCL+CS+DSSCL+CD+DSSCL+CW+DSSCL+CS+CD+DSSCL+CS+CW+DSSCL+CS+CD+CW+DSS
R20.6740.6560.7770.630.8110.6660.857
RMSE0.1620.1630.1280.1690.1160.1850.101
Note: CL, corrosion level; CW, crack width; CD, cover-to-diameter ratio; CS, concrete strength; DSS, stirrups diameter-to-spacing ratio.
Table 4. Results of cases with stirrups and variables without including corrosion level (n = 109).
CasesCWCW+CDCW+CSCW+DSSCW+CD+CSCW+CS+DSSCW+CD+DSSCW+CS+CD+DSS
R20.470.7120.580.6120.7270.6780.780.845
RMSE0.1960.1470.1760.1720.1410.1550.1260.106
Note: CW, crack width; CD, cover-to-diameter ratio; CS, concrete strength; DSS, stirrups diameter-to-spacing ratio.

