Featured Application
Digital holographic cytometry applied to EMT.
Abstract
Cells in complex organisms can transition between epithelial and mesenchymal phenotypes during both normal and malignant physiological events. These two phenotypes are not binary, but rather describe a spectrum of cell states along an axis. Mammalian cells can undergo dynamic and heterogenous bidirectional interconversions along the epithelial–mesenchymal phenotypic (EMP) spectrum, and such transitions are marked by morphological change. Here, we exploit digital holographic cytometry (DHC) to develop a tractable method for monitoring the degree, kinetics, and heterogeneity of epithelial and mesenchymal phenotypes in adherent mammalian cell populations. First, we demonstrate that the epithelial and mesenchymal states of the same cell line present distinct DHC-derived morphological features. Second, we identify quantitative changes in these features that occur hours after induction of the epithelial to mesenchymal transition (EMT). We apply this approach to achieve label-free tracking of the degree and the rate of EMP transitions. We conclude that DHC is an efficient method to investigate morphological changes during transitions between epithelial and mesenchymal states.
1. Introduction
During tumour progression, cancer cells interconvert between epithelial and mesenchymal states with a high degree of plasticity based upon environmental signals [1]. These bidirectional transitions are known as epithelial to mesenchymal transitions (EMT) and mesenchymal to epithelial transitions (MET). Both transitions are required for the complex series of processes that result in metastatic dissemination [2,3,4,5,6]. For example, EMT is involved in both tumour cell migration and the transformation of cancer cells into a cancer stem cell (CSC) phenotype, each of which promotes growth of new tumours at distant locations [7,8]. However, the repression of EMT and induction of MET is also essential for metastatic colonization [3,4]. Since metastases cause most cancer-related deaths [9] it is of vital importance to understand the EMT/MET processes. Efforts to identify candidate therapeutics that interfere with the process are underway [10,11]. However, dependent on the stage and identity of each cancer cell within a tumour or a patient, inhibition of either EMT or MET could be beneficial or harmful. Given the complexity of the transitions and their relationship to metastatic dissemination, more comprehensive characterization of the effect of candidate therapeutics on EMT and MET are needed.
Characterization of EMT and MET is challenging due to several types of substantial heterogeneity. First, the processes of EMT/MET do not describe a binary toggling between two discrete states, but rather transitions along an “epithelial-mesenchymal phenotypic (EMP) spectrum” from more epithelial-like states to more mesenchymal-like states [1,5]. Second, cells are heterogenous in the ease with which they can transverse this spectrum, often referred to as plasticity. Each cell line and individual cells within a cell line population can occupy distinct locations along the EMP spectrum and possess varying degrees of plasticity dependent on contextual signals. Third, the intracellular gene circuits and morphological changes that define the EMP spectrum differ from cell line to cell line [8,9]. Finally, the EMP spectrum is only one of many transcriptional programs that define a cell. Some cancers, such as melanoma, are not derived from epithelial cells but, nevertheless, undergo an “EMT-like” transition during metastasis [10,11]. Thus, simply defining the EMP spectrum for any specific cellular context is non-trivial and it cannot be assumed that parameters that accurately define EMP in one cell line apply to another.
To further develop the candidate therapeutics for clinical application, it is first essential to develop assays capable of capturing and quantifying the degree, kinetics, heterogeneity and cell-line specificities of transitions along the EMP axis. Defined changes in morphology, specifically the acquisition of a spindle-like shape, constitute one hallmark of EMT that could serve as an informative feature. EMT has been monitored in real time by fluorescence imaging of vimentin by Maier et al [12]. Both EMT and MET have been monitored by time-lapse imaging [13,14] giving insights into the ongoing process. Digital holographic cytometry (DHC) has emerged as a complementary technique to obtain time-lapsed imaging for label free long-term cell analysis [15,16]. The quantitative 3D images acquired can be used to follow morphological changes or changes in cell movement induced by therapeutic treatment [17,18,19,20,21,22,23,24,25,26]. It has also been presented as a technique suitable for classifying distinct cell phenotypes [17,23]. We have previously suggested that DHC can be used as a tool for identifying and monitoring EMT or MET [24] by characterizing the change in cell movements. Recently, it has been suggested that the application of machine learning techniques to DHC-derived features can detect epithelial and mesenchymal characteristics in cell lines of unknown EMP status [25]. However, due to substantial morphological heterogeneity between cell lines, cell types, and species, it is not obvious whether a single model that classifies EMP status based solely on DHC-derived morphological features can be universally applied.
In this study, we evaluated the use of DHC to track the rate, degree, and heterogeneity of transitions within the EMP spectrum based on morphological features. Importantly, we aimed to create an accessible approach for assessing EMP status that could be easily adjusted for different cell systems and was not at risk of over-training as introduced by machine learning approaches. First, we monitored mouse mammary epithelial cells undergoing EMT. Next, we trained a model to classify the degree of EMT using DHC-derived features and applied our model to live-imaged cultures undergoing EMT. Finally, we applied the model to five human and mouse cell lines of known EMP state and observed substantial line-to-line variability. Our data show that DHC-derived morphological parameters can be used to monitor the degree, rate, and heterogeneity of EMP transitions, while highlighting the necessity for developing cell-line specific classifiers.
2. Materials and Methods
2.1. Cell Culturing
Adult human dermal fibroblasts (HDFs) (106-05a) were purchased from Sigma-Aldrich (Stockholm, Sweden). The human renal proximal tubule epithelial (RPTE) cells (PCS-400-010), the mouse fibroblast cell line L929 (ATCC® CCL-1™), and the mouse mammary gland NMuMG cells (CRL-1636) were purchased from the American Type Culture Collection (Manassas, VA, USA). The human breast cancer cell line JIMT-1 (ACC-589) was purchased from the German Collection of Microorganisms and Cell Cultures (Braunschweig, Germany).
The JIMT-1 cells, the HDFs, the RPTE cells, and the L929 cells were routinely cultured in Dulbecco’s modified Eagle’s medium (DMEM)/Ham’s F-12 nutrient mixture (1:1) supplemented with 5% heat-inactivated donor horse serum (HI-DHS) (Sigma-Aldrich, Stockholm, Sweden), 1 mM non-essential amino acids (VWR, Lund, Sweden), 2 mM L-glutamine (VWR) and 10 µg/mL insulin (Sigma-Aldrich), 1 mM sodium pyruvate (VWR), 50 µg/mL transferrin (Sigma-Aldrich), 0.25 µg/mL hydrocortisone (Sigma-Aldrich), 20 µg/mL epidermal growth factor (Sigma-Aldrich), 100 U/mL penicillin (VWR), and 100 µg/mL streptomycin (VWR). The NMuMG cells were routinely cultured in DMEM/Ham’s F-12 nutrient mixture (1:1) supplemented with 10% fetal bovine serum (FBS) (VWR, Lund, Sweden), 2 mM L-glutamine, and 100 U/mL penicillin (VWR), and 100 µg/mL streptomycin (VWR). All cells were sub-cultured twice a week. The cells were kept in a humidified incubator with 5% CO2 at 37 °C. The HDF and RPTE cells were used between passages 2 and 7.
For imaging, cells were detached using AccutaseTM (Sigma) or trypsin/EDTA (0.05%/0.5 mM) and then counted in a hemocytometer. Cells were cultured in 3 mL medium in 35 mm Petri dishes (Nalge Nunc International, Penfield, New York, USA). The seeding densities were 5000 cells/cm2 for HDFs, 12,000 cells/cm2 for RPTEs, 7300 cells/cm2 for L929 cells, and 7300 cells/cm2 for JIMT-1 cells. The NMuMG cells were seeded in 6-well plates (Nalge Nunc International) at a density of 7500 cells/cm2 in 3 mL of regular growth medium.
2.2. Treatment
Transforming growth factor β (TGFβ) (240-B-002) (R&D systems, Minneapolis, MN, USA) was kept at −20 °C as a stock solution of 4 mg/mL in 4 mM HCl and 1 mg/mL bovine serum albumin (Sigma). The TGFβ type-1 receptor inhibitor SB431542 (TGFβRI) (Selleckchem, Munich, Germany) was kept at −20 °C as a 20 mM stock solution in 100% DMSO. After seeding, the NMuMG cells were allowed to attach for 24 h before addition of these compounds. The cells were treated with 0.2 or 0.5 ng/mL TGFβ, 0.5 or 1 µM TGFβRI, or 0.5 ng/mL TGFβ + 0.5 µM TGFβRI for 72 h.
2.3. Digital Holographic Imaging and Analysis
The cells were allowed to attach for 24 h prior to start of the experiment. For NMuMG cells, compounds were added as described above immediately before imaging. The standard lid of the Petri dish was replaced with a HoloLid™ 71,110 for Petri dishes with 35 mm diameter (Phase Holographic Imaging AB (PHI), Lund, Sweden) or HoloLid™ 71,120 for 6-well plates (PHI). The cells were then imaged using the HoloMonitor® M4 with a motorized stage (PHI). The HoloMonitor® M4 is a quantitative imaging system based on digital holographic microscopy [24,26]. For imaging, the software Hstudio™ (PHI) was used. Images were acquired at three to five locations (image frames) per well, at time-intervals ranging from every hour to every 24 h, for a total time of 48–72 h.
The images were analyzed using Hstudio™ as follows. First, each image was segmented using thresholding that identified each individual cell in that image. Second, based upon this segmentation, morphological parameters for each cell in each image frame were computationally calculated. In the Hstudio™ analysis tool, values for the 27 morphological parameters considered here are presented for each individual cell. To develop the EMP score, we used the average values for each image frame at each timepoint. Data were analyzed for correlations using the free software R (R Core Team, 2015). To generate the score, we first selected four features that positively correlated with mesenchymal conditions in the dataset obtained from a 72-hour time-lapse imaging of NMuMG cells with and without exposure to 0.5 ng/mL TGFβ: average cell eccentricity, average cell hull convexity, average cell roughness skewness, and average cell optical thickness max. We centered each feature set by dividing each value within that set by the mean feature value in control conditions. We then performed standard min max feature scaling (Equation (1)) to restrict all values to the range 0–1 that were then summed to generate a score in the range 0–4 with increasing values correlating with a more mesenchymal phenotype.
2.4. Statistics
The computer language R was used to draw figures and for statistical analysis. p-values were calculated using either one-way ANOVA and Tukey’s honest significant differences or two-sample equal variance two tailed t-test using Prism 8 (version 8.4.2).
3. Results
3.1. Monitoring of Epithelial to Mesenchymal Transition Using DHC
Digital holography is a non-invasive imaging technique that provides three-dimensional morphological data of cells in a monolayer culture. Since the technique is non-invasive and label free, it is suitable for long term live imaging. We routinely use this technique to image adherent mammalian cells at regular intervals for 24–72 h. The individual images from each timepoint are then segmented and DHC-derived morphological features are calculated, so that changes in these features over time can be monitored. To first determine whether DHC can distinguish between extreme epithelial and mesenchymal states of the same line in a well-defined system, we cultured the mouse mammary epithelial cell line (NMuMG) in the presence or absence of TGFβ, an established potent inducer of EMT in this context [27,28,29]. This EMT can be inhibited by co-treatment with TGFβ type-1 receptor blocker [27,28,29]. The cells were treated with 0.2 or 0.5 ng/mL of TGFβ for a total time of 72 h to induce the transition of the epithelial NMuMG cells to mesenchymal cells. Figure 1e,f show that the morphology of cells treated with TGFβ is different compared to control (Figure 1a). Specifically, control cells present typical epithelial morphology defined by uniform round cells growing in tight clusters often described as having a “cobblestone” appearance. In contrast, the TGFβ-treated cells were elongated, and clusters were less compact with individual cells migrating away, which are characteristics associated with the mesenchymal state. Cells treated with the TGFβ type-1 receptor inhibitor SB431542 [28] added together with TGFβ (Figure 1d) are similar to control (Figure 1a). Treatment with the inhibitor alone at either 0.5 µM or 1 µM concentration had no effect on cell morphology (Figure 1b,c), however the higher concentration reduced the cell number.
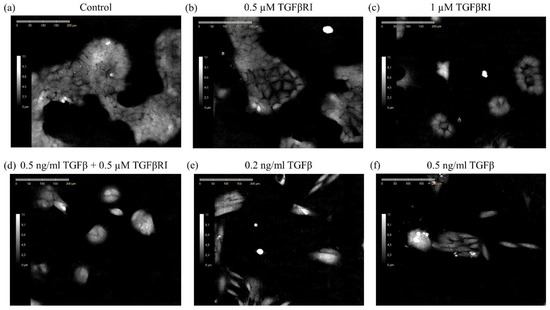
Figure 1.
Treatment of NMuMG cells with TGFβ induces EMT which is inhibited by the TGFβ type-1 receptor inhibitor SB431542. Representative digital holographic images of NMuMG cells cultured in the absence (a) or presence of 0.5 (b) or 1 µM (c) TGFβRI, the combination of 0.5 ng/mL TGFβ and 0.5µM TGFβRI (d), or 0.2 (e), or 0.5 ng/mL (f) TGFβ for 24 h.
Cells were identified in DHC images generated at 0, 24, 48, and 72 h and 27 DHC-derived features were presented by Hstudio as output parameters. To determine which parameters demonstrated a significant correlation with the EMP spectrum, the treatments were ordered and assigned a numerical value in relation to increased mesenchymal features according to our own observations and published results [27,28,29]. The non-treated control was set as 1; treatment with 0.5 µM TGFβRI was set as 2; treatment with 1 µM TGFβRI was set as 3; treatment with the combination of 0.5 ng/mL TGFβ and 0.5 µM TGFβRI was set as 4; treatment with 0.2 ng/mL TGFβ was as 5; and treatment with 0.5 ng/mL TGFβ was set as 6. We then calculated the correlation coefficient between each parameter and the EMP numerical assignment (Figure 2a). At time-point 0, no correlations were observed, indicating that immediately after treatment the cells were morphologically identical regardless of the condition. However, as the treatment time increased, increasing correlations between several features and treatment condition were identified, suggesting a consistent morphological change over time. To determine which features provided redundant information in this context, we calculated the correlation coefficient between each pair of features (Figure 2b). We identified four groups of features with near perfect correlation. In order to restrict further analyses to independent parameters, one feature from each group that was correlated to the conditions was selected (Figure 2a, green boxes). These features were cell eccentricity (a measure of cell roundness), hull convexity (a measure of how dome-shaped the cell is), optical thickness max (a measure of cell thickness or optical density), and roughness skewness (a measure of cell texture).
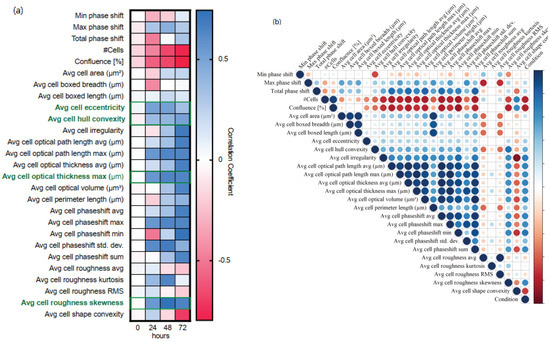
Figure 2.
Correlation matrices show the Pearson correlation coefficient for multiple morphological parameters obtained by digital holographic microscopy for NMuMG cells cultured under different conditions. The morphological parameters were obtained from digital holographic images acquired at 0, 24, 48, and 72 h after initiation of the time-lapse. (a) The conditions were ranked based upon location in the EMP spectrum. Heatmap depicts correlation between morphological parameters and EMP rank at each timepoint. The parameters listed in bold green were selected for further analyses. (b) Matrix depicts correlation between all morphological features at 72 h. Both the size of the circle and the colour intensity represent the strength of the correlation (blue = positive correlation; red = negative correlation). Three different samples were analyzed per condition using 15 images each.
3.2. Generation of an EMP Classifer for NMuMG Cells
We next generated a simple linear classifier to combine each of the selected four morphological feature values into a single EMP score. Features were normalized to NMuMG cells grown overnight in standard conditions, scaled so that each provided a value between 0 and 1, and summed. As designed, the EMP score would be lower for more epithelial cells and higher for more mesenchymal cells. We first applied the classifier to time-lapsed DHC images of NMuMG cells grown in normal conditions and in the presence of 0.5 ng/mL TGFβ for 72 h (Figure 3a). We observed that immediately after addition of TGFβ, the EMP score rapidly increased then peaked around 16 hours after exposure. After this initial declination, the EMP score remained significantly different (p < 0.00005) in the TGFβ-treated conditions as compared to control. In contrast, control NMuMG cells presented a peak EMP score directly after plating, which then gradually declined over the first two days in culture, indicating that the act of passaging these epithelial cells induces a temporary mesenchymal-like morphology. Notably, we observed substantial variation in the EMP score in all conditions, consistent with the expected heterogeneity of EMP within a single culture. To further validate the EMP score, we applied the classifier to DHC images of NMuMG cells grown with different concentrations and combinations of TGFβ and TGFβRI for 24 h (Figure 3b). Exposure to less TGFβ (0.2 ng/mL) increased the EMP score, but to a lesser degree. Also, as expected, the score was attenuated by the combination of TGFβ with 0.5 µM TGFβRI, whereas exposure to the inhibitor alone presented more epithelial scores similar to control conditions.
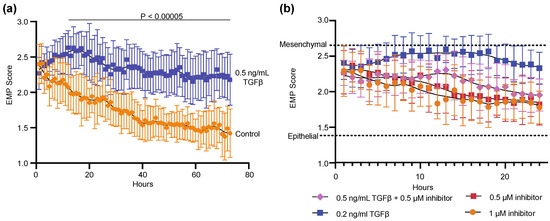
Figure 3.
An “EMP score” generated from four morphological features chosen from correlation matrixes (Figure 2) distinguishes between epithelial and mesenchymal NMuMG cells. The treatments were initiated at time 0 at the start of time-lapse imaging using a digital holographic microscope. (a) Images of cells treated with 0.5 mg/mL TGFβ or control were captured every hour for 72 h. The control and treated conditions in each time-point were compared using the two-sample equal variance t-test. At all time-points after 11 hours (horizontal bar) p values generated from this comparison were less than 0.00005. (b) Images of cells treated with indicated conditions were captured every hour for 24 h. inhibitor, TGFβRI. Data from 15 images over 3 experiments and bars show ±SD.
3.3. Application of NMuMG EMP Classifer to Other Lines
The above analyses demonstrate how DHC can be applied to monitor both the kinetics and degree of morphological changes associated with EMP within a single transitioning cell line. We next sought to determine whether the “EMP classifier” trained on NMuMG DHC-derived features generated a useful metric when analyzing other cell lines. To challenge the classifier, we obtained four additional human and mouse cell lines of established EMP. We used the human renal proximal tubule epithelial cells (RPTE), mouse fibroblasts (L929, mesenchymal), adult human dermal fibroblasts (HDF, mesenchymal), and highly malignant HER2 overexpressing human breast cancer cells (JIMT-1, mixed epithelial and mesenchymal). The five cell lines differed substantially in their morphologies (Figure 4). The application of the four DHC-derived morphological features from images of these cell lines to the NMuMG-trained EMP classifier yielded mixed results (Figure 5). The NMuMG cells scored as highly epithelial, as expected. Similarly, HDF and JIMT-1 scored as highly mesenchymal and intermediate, respectively, as would be expected. However, epithelial RPTE cells scored as highly mesenchymal, whereas L929 mouse fibroblasts scored as highly epithelial, affirming that a single morphology-based EMP classifier cannot be universally applied across lines.
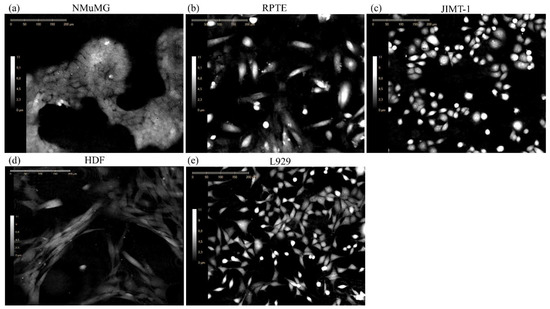
Figure 4.
Representative digital holographic images show the five cell lines used in the NMuMG trained EMP classifier. The cells were seeded one day prior to start of the time-lapse imaging. Images were acquired at time-point: (a) 48 h, (b) 24 h, (c) 24 h, (d) 24 h, and (e) 48 h of the respective time-lapses. The scale bars are 200 μm.
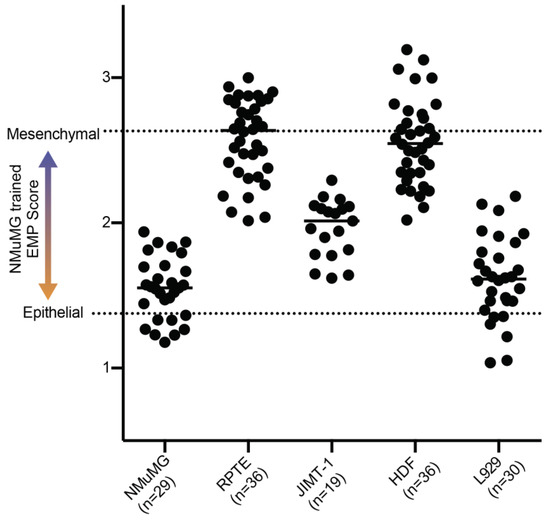
Figure 5.
EMP scores of established cell lines using the NMuMG-trained classifier. Each dot represents the EMP score calculated from the average of all cells in an image. Fields were taken over 3 experiments.
4. Discussion
The hallmarks of transitions along the EMP spectrum include changes in the expression of specific extracellular matrix components, cell surface markers, cytoskeleton components, and transcription factors. However, the identity and uniformity of these molecular changes, as well as the rate in which these changes occur, vary dependent on cell line and condition. In addition, several canonical EMP regulating transcription factors (i.e., Twist1/2, Zeb1/2, Snail, and Slug) frequently undergo nuclear translocation instead of a change in expression. Therefore, assays that monitor either a single time-point, average a population of cells, or provide qualitative metrics, each miss critical information regarding EMP transitions. Another hallmark of EMP transitions is a change in morphology. Here we have exploited this hallmark to establish a label-free and non-invasive assay to quantify the kinetics, heterogeneity, and degree of the transition.
Morphological parameters as determined using quantitative phase imaging (QPI) techniques such as DHC have previously been used to distinguish between normal cells and cancer cells as well as to distinguish cancer in situ from metastatic cancer cells [30] with high sensitivity and specificity. Further, DHC has proven to be a powerful method to evaluate toxicity using morphological data [31]. Since the DHC platform used here can be used inside a cell incubator, it is a powerful method to monitor individual cells throughout a morphological transition [24]. In this study, we have used DHC to investigate morphological differences between different cell states over time.
To apply DHC-derived feature classification to a cell state transition, we used the well-established model of treating epithelial NMuMG cells with TGFβ to induce EMT [29]. We show that morphological parameters could clearly distinguish between epithelial and mesenchymal NMuMG cells (Figure 1 and Figure 2). One useful aspect of the approach presented here is the ability to follow changes in morphology over time using time-lapse imaging. Changes in morphology compared to untreated cells were observed within five hours after TGFβ addition (Figure 3). This observation is consistent with a previous report noting changes in micromotility within 5–7 h of treating NMuMG cells with TGFβ [32]. We further observed the difference in morphology between non-treated cells and TGFβ-treated cells to peak at approximately 16 h after addition of TGFβ (Figure 3). This ability to monitor both when the transition initiates and peaks permits more refined selection of time-points for molecular assays.
A previous report has demonstrated that DHC-derived classifiers trained on established, but unrelated, epithelial and mesenchymal cell lines can be used to infer the EMP status of independent uncharacterized lines [25]. Our presented work further advances the application of DHC feature-based classification of EMP in four important aspects. The first, as discussed above, is the addition of kinetics. Through utilizing a well-defined system of EMT, we demonstrate distinct DHC-derived features in the epithelial and mesenchymal states of precisely the same cells, proving the differences are the consequence of cell state, not genetic differences between cell lines (Figure 1, Figure 2 and Figure 3). The second is the inclusion of both degree and heterogeneity of EMP (Figure 3). Each cell within a culture can occupy a different state in the EMP spectrum—a phenomena that can be captured by the EMP score generated here, but may be lost with application of binary “E or M” classifiers. An important third advancement is the demonstration that EMP classifiers trained on one cell line are not universally applicable across cell types and species (Figure 4 and Figure 5). This result is fully expected based upon known molecular and morphological diversity across lines. Indeed, the substantial morphological heterogeneity between cell lines, cell types, and species renders the universal “blind” application of trained DHC-derived cell state classifiers to other systems a dubitable effort. Our data suggest that interpretation of EMP status of unknown lines using a DHC feature-trained classifier trained on independent cell lines must be considered carefully and orthogonally validated. Ideally, when possible, each EMP classifier should be trained on the cell line of interest. As morphological changes are but one hallmark of EMP status, molecular methods should be used as validation.
Training a new EMP classifier for each cell line of interest is non-trivial. To aid in this endeavor, the fourth advancement we report here, is the use of a simple linear score for assessing EMP status. We, and others, have previously applied machine-learning techniques to develop cell state classifiers from DHC-derived parameters [17,25,33]. However, such approaches have limitations. First, the broad spectrum of parameters measured by DHC, not only changes in morphology, such as area or volume changes, but also internal changes that affect the phase shift of light, such as cytoskeleton changes [34]—results in a feature set that can be far greater than the number of classification categories, risking over-training of the model [35]. Second, the generation of advanced machine learning classifiers requires specialized expertise that is not ubiquitous among cell biology research groups and is difficult to implement in automated analysis software such as HStudio. We demonstrate here that through rationale consideration, a simple classifier can be generated from DHC-derived features for classifying EMP status using a linear combination of just four features. This approach should be easily accessible to any cell biology research group.
5. Conclusions
We conclude that DHC can be applied to the study of EMP transitions. Specifically, consideration of DHC-derived morphological features permits efficient monitoring of the rate, degree, and heterogeneity of the transition in a label-free manner. We further provide evidence that the morphological changes associated with EMP status are not universal across lines, emphasizing the need to optimize and validate DHC-derived classifiers for each cell system.
Author Contributions
Conceptualization, B.J., K.A., R.L.J.-T., S.K., and S.O.; methodology, B.J., K.A., R.L.J.-T., S.K., and S.O.; validation, S.K. and S.O.; formal analysis, S.K. and R.L.J.-T.; investigation, S.K. and S.O.; resources, B.J., K.A., and S.O.; data curation, S.K. and S.O.; writing—original draft preparation, S.K., S.O., and R.L.J.-T.; writing—review and editing, B.J., K.A., R.L.J.-T., S.K., and S.O.; visualization, S.K. and R.L.J.-T.; supervision, B.J., K.A., and S.O.; project administration, K.A. and S.O.; funding acquisition, K.A. and S.O. All authors have read and agreed to the published version of the manuscript.
Funding
This work was supported by funding from the Swedish Research Council (VR), Forska Utan Djurförsök, by a donation from Carolina LePrince with the "Kalenderflickorna" and associated sponsors, and by donations to Stina Oredsson´s research group at Lund University (http://biology.lu.se/cancer-stem-cells).
Acknowledgments
We thank Helena Fritz for expert technical help.
Conflicts of Interest
K.A. and B.J. are employed at Phase Holographic Imaging. S.K. is an industrial PhD student at PHI financed by V.R.
References
- Nieto, M.A.; Huang, R.Y.Y.J.; Jackson, R.A.A.; Thiery, J.P.P. Emt: 2016. Cell 2016, 166, 21–45. [Google Scholar] [CrossRef]
- Yang, J.; Weinberg, R.A. Epithelial-Mesenchymal Transition: At the Crossroads of Development and Tumor Metastasis. Dev. Cell 2008, 14, 818–829. [Google Scholar] [CrossRef]
- Ocaña, O.; Córcoles, H.R.; Fabra, A.; Moreno-Bueno, G.; Acloque, H.; Vega, S.; Barrallo-Gimeno, A.; Cano, A.; Nieto, M.A. Metastatic Colonization Requires the Repression of the Epithelial-Mesenchymal Transition Inducer Prrx1. Cancer Cell 2012, 22, 709–724. [Google Scholar] [CrossRef]
- Tsai, J.; Donaher, J.; Murphy, D.; Chau, S.; Yang, J. Spatiotemporal regulation of epithelial-mesenchymal transition is essential for squamous cell carcinoma metastasis. Cancer Cell 2012, 22, 725–736. [Google Scholar] [CrossRef] [PubMed]
- Zhang, Y.; Weinberg, R.A. Epithelial-to-mesenchymal transition in cancer: Complexity and opportunities. Front. Med. 2018, 12, 361–373. [Google Scholar] [CrossRef] [PubMed]
- Hodorogea, A.; Calinescu, A.; Antohe, M.; Balaban, M.; Nedelcu, R.I.; Turcu, G.; Ion, D.A.; Badarau, I.A.; Popescu, C.M.; Popescu, R.; et al. Epithelial-Mesenchymal Transition in Skin Cancers: A Review. Anal. Cell. Pathol. 2019, 2019. [Google Scholar] [CrossRef] [PubMed]
- Mani, S.A.; Guo, W.; Liao, M.; Eaton, E.N.; Ayyanan, A.; Zhou, A.Y.; Brooks, M.; Reinhard, F.; Zhang, C.C.; Shipitsin, M.; et al. The epithelial-mesenchymal transition generates cells with properties of stem cells. Cell 2008, 133, 704–715. [Google Scholar] [CrossRef]
- Morel, A.; Lièvre, M.; Thomas, C.; Hinkal, G.; Ansieau, S.A.; Puisieux, A. Generation of breast cancer stem cells through epithelial-mesenchymal transition. PLoS ONE 2008, 3, e2888. [Google Scholar] [CrossRef]
- Nguyen, D.X.; Bos, P.D.; Massagué, J. Metastasis: From dissemination to organ-specific colonization. Nat. Rev. Cancer. 2009, 9, 274–284. [Google Scholar] [CrossRef] [PubMed]
- Davis, F.M.; Stewart, T.A.; Thompson, E.W.; Monteith, G.R. Targeting EMT in cancer: Opportunities for pharmacological intervention. Trends Pharmacol. Sci. 2014, 35, 479–488. [Google Scholar] [CrossRef] [PubMed]
- Elaskalani, O.; Razak, N.B.A.; Falasca, M.; Metharom, P. Epithelial-mesenchymal transition as a therapeutic target for overcoming chemoresistance in pancreatic cancer. World J. Gastrointest. Oncol. 2017, 9, 37–41. [Google Scholar] [CrossRef]
- Maier, J.; Traenkle, B.; Rothbauer, U. Real-time analysis of epithelial-mesenchymal transition using fluorescent single-domain antibodies. Sci. Rep. 2015, 5, 1–13. [Google Scholar] [CrossRef] [PubMed]
- Maier, J.; Traenkle, B.; Rothbauer, U. Visualizing epithelial-mesenchymal transition using the chromobody technology. Cancer Res. 2016, 76, 5592–5596. [Google Scholar] [CrossRef]
- Tyagi, A.; Yeganeh, O.; Levin, Y.; Hooker, J.C.; Hamilton, G.C.; Wolfson, T.; Gamst, A.; Zand, A.K.; Heba, E.; Loomba, R.; et al. In vivo visualization and characterization of epithelial-mesenchymal transition in breast tumors. Cancer Res. 2016, 76, 2094–2104. [Google Scholar] [CrossRef]
- Shaked, T.N.; Satterwhite, L.L.; Rinehart, T.M.; Wax, A. Quantitative analysis of biological cells using digital holographic microscopy. In Holography, Research and Technologies; Rosen, J., Ed.; InTechOpen: London, UK, 2011. [Google Scholar] [CrossRef]
- Alm, K.; El-Schich, Z.; Miniotis, M.F.; Wingren, A.G.; Janicke, B.; Oredsson, S. Cells and holograms—holograms and digital holographic microscopy as a tool to study the morphology of living cells. In Holography—Basic Principles and Contemporary Applications; InTechOpen: London, UK, 2013. [Google Scholar] [CrossRef]
- Hejna, M.; Jorapur, A.; Song, J.S.; Judson, R.L. High accuracy label-free classification of kinetic cell states from holographic cytometry. Sci. Rep. 2017, 7. [Google Scholar] [CrossRef]
- Kaiser, M.; Pohl, L.; Ketelhut, S.; Kastl, L.; Gorzelanny, C.; Götte, M.; Schnekenburger, J.; Goycoolea, F.M.; Kemper, B. Nanoencapsulated capsaicin changes migration behavior and morphology of madin darby canine kidney cell monolayers. PLoS ONE 2017, 12, e0187497. [Google Scholar] [CrossRef]
- Kemper, B.; Bauwens, A.; Vollmer, A.; Ketelhut, S.; Lengehanenberg, P.; Müthig, J.; Karch, H.; Von Bally, G. Label-free quantitative cell division monitoring of endothelial cells by digital holographic microscopy. J. Biomed. Opt. 2010, 15, 1–6. [Google Scholar] [CrossRef] [PubMed]
- Luther, E.; Mendes, L.P.; Pan, J.; Costa, D.F.; Torchilin, V.P. Applications of label-free, quantitative phase holographic imaging cytometry to the development of multi-specific nanoscale pharmaceutical formulations. Cytom. Part A 2017. [Google Scholar] [CrossRef] [PubMed]
- Pavillon, N.; Kühn, J.; Moratal, C.; Jourdain, P.; Depeursinge, C.; Magistretti, P.J.; Marquet, P. Early cell death detection with digital holographic microscopy. PLoS ONE 2012, 7, e30912. [Google Scholar] [CrossRef]
- Sriraman, S.K.; Pan, J.; Sarisozen, C.; Luther, E.; Torchilin, V. Enhanced Cytotoxicity of Folic Acid-Targeted Liposomes Co-Loaded with C6 Ceramide and Doxorubicin: In Vitro Evaluation on HeLa, A2780-ADR, and H69-AR Cells. Mol. Pharm. 2016, 13, 428–437. [Google Scholar] [CrossRef] [PubMed]
- Rappaz, B.; Breton, B.; Shaffer, E.; Turcatti, G. Digital holographic microscopy: A quantitative label-free microscopy technique for phenotypic screening. Comb. Chem. High Throughput Screen. 2014, 17, 80–88. [Google Scholar] [CrossRef] [PubMed]
- Kamlund, S.; Strand, D.; Janicke, B.; Alm, K.; Oredsson, S. Influence of salinomycin treatment on division and movement of individual cancer cells cultured in normoxia or hypoxia evaluated with time-lapse digital holographic microscopy. Cell Cycle 2017, 4101, 1–11. [Google Scholar] [CrossRef]
- Lam, V.; Nguyen, T.; Bui, V.; Chung, B.M.; Chang, L.-C.; Nehmetallah, G.; Raub, C. Quantitative scoring of epithelial and mesenchymal qualities of cancer cells using machine learning and quantitative phase imaging. J. Biomed. Opt. 2020, 25, 1–17. [Google Scholar] [CrossRef] [PubMed]
- Cuche, E.; Bevilacqua, F.; Depeursinge, C. Digital holography for quantitative phase-contrast imaging. Opt. Lett. 1999, 24, 291–293. [Google Scholar] [CrossRef]
- Theocharis, A.D.; Heldin, C.; Heldin, P. Efficient TGF b-induced epithelial–mesenchymal transition depends on hyaluronan synthase HAS2. Oncogene 2013, 4355–4365. [Google Scholar] [CrossRef]
- Halder, S.K.; Beauchamp, R.D.; Datta, P.K. A Specific Inhibitor of TGF-β Receptor Kinase, SB-431542, as a Potent Antitumor Agent for Human Cancers. Neoplasia 2005, 7, 509–521. [Google Scholar] [CrossRef] [PubMed]
- Xie, L.; Law, B.K.; Aakre, M.E.; Edgerton, M.; Shyr, Y.; Bhowmick, N.A.; Moses, H.L. Transforming growth factor beta-regulated gene expression in a mouse mammary gland epithelial cell line. Breast Cancer Res. 2003, 187–198. [Google Scholar] [CrossRef] [PubMed]
- Roitshtain, D.; Wolbromsky, L.; Bal, E.; Greenspan, H.; Satterwhite, L.L.; Shaked, N.T. Quantitative phase microscopy spatial signatures of cancer cells. Cytom. Part A 2017, 91, 482–493. [Google Scholar] [CrossRef] [PubMed]
- Makdasi, E.; Laskar, O.; Milrot, E.; Schuster, O.; Shmaya, S.; Yitzhaki, S. Whole-Cell Multiparameter Assay for Ricin and Abrin Activity-Based Digital Holographic Microscopy. Toxins 2019, 11, 174. [Google Scholar] [CrossRef]
- Schneider, D.; Tarantola, M.; Janshoff, A. Dynamics of TGF-β induced epithelial-to-mesenchymal transition monitored by Electric Cell-Substrate Impedance Sensing, BBA-Mol. Cell Res. 2011, 1813, 2099–2107. [Google Scholar] [CrossRef]
- Judson, R.; Hejna, M.; Jorapur, A.; Song, J.S.; Zhang, Y. Quantification of mammalian tumor cell state plasticity with digital holographic cytometry. Quant. Phase Imaging IV 2018, 1050312, 36. [Google Scholar] [CrossRef]
- Lam, V.K.; Nguyen, T.C.; Chung, B.M.; Nehmetallah, G.; Raub, C.B. Quantitative assessment of cancer cell morphology and motility using telecentric digital holographic microscopy and machine learning. Cytom. Part A 2018, 93, 334–345. [Google Scholar] [CrossRef] [PubMed]
- Torres, R.; Judson-Torres, R.L. Research Techniques Made Simple: Feature Selection for Biomarker Discovery. J. Investig. Dermatol. 2019, 139, 2068–2074. [Google Scholar] [CrossRef] [PubMed]


© 2020 by the authors. Licensee MDPI, Basel, Switzerland. This article is an open access article distributed under the terms and conditions of the Creative Commons Attribution (CC BY) license (http://creativecommons.org/licenses/by/4.0/).