Article

Salinomycin Treatment Specifically Inhibits Cell Proliferation of Cancer Stem Cells Revealed by Longitudinal Single Cell Tracking in Combination with Fluorescence Microscopy

1
Department of Biology, Lund University, 223 62 Lund, Sweden
2
Phase Holographic Imaging AB, 221 04 Lund, Sweden
*
Author to whom correspondence should be addressed.
Appl. Sci. 2020, 10(14), 4732; https://doi.org/10.3390/app10144732
Submission received: 1 June 2020 / Revised: 26 June 2020 / Accepted: 6 July 2020 / Published: 9 July 2020
(This article belongs to the Special Issue Applications of Digital Holography in Biomedical Engineering)

Abstract

:

Featured Application

Combination of digital holographic and fluorescence microscopy.

Abstract

A cell line derived from a tumor is a heterogeneous mixture of phenotypically different cells. Such cancer cell lines are used extensively in the search for new anticancer drugs and for investigating their mechanisms of action. Most studies today are population-based, implying that small subpopulations of cells, reacting differently to the potential drug go undetected. This is a problem specifically related to the most aggressive single cancer cells in a tumor as they appear to be insensitive to the drugs used today. These cells are not detected in population-based studies when developing new anticancer drugs. Thus, to get a deeper understanding of how all individual cancer cells react to chemotherapeutic drugs, longitudinal tracking of individual cells is needed. Here we have used digital holography for long time imaging and longitudinal tracking of individual JIMT-1 breast cancer cells. To gain further knowledge about the tracked cells, we combined digital holography with fluorescence microscopy. We grouped the JIMT-1 cells into different subpopulations based on expression of CD24 and E-cadherin and analyzed cell proliferation and cell migration for 72 h. We investigated how the cancer stem cell (CSC) targeting drug salinomycin affected the different subpopulations. By uniquely combining digital holography with fluorescence microscopy we show that salinomycin specifically targeted the CD24 subpopulation, i.e., the CSCs, by inhibiting cell proliferation, which was evident already after 24 h of drug treatment. We further found that after salinomycin treatment, the surviving cells were more epithelial-like due to the selection of the CD24+ cells.

1. Introduction

The importance of cancer stem cells (CSCs) in the development and recurrence of cancer has gained increased attention in cancer research during the last decade [1,2]. A tumor contains a mixture of phenotypically heterogeneous cancer cells. Only a few cells in a tumor belong to the CSC population, but it appears that for many tumors of different origin it is mainly the CSCs that can give rise to new tumors with similar phenotypic composition as the original tumor [3]. Since the CSCs are drug resistant and favor cancer metastasis there is an increased need for new drugs and therapeutic strategies that reduce the CSCs specifically [4]. In breast cancer, a high expression of the cell surface marker CD44 in combination with a low expression of the cell surface marker CD24 have been used to identify CSCs [2,5,6].
The cationic ionophore salinomycin was found to target CSCs, in a high throughput screening study aimed to find drugs that target this subpopulation in breast cancer [7]. Subsequently, salinomycin has been found to target CSCs in many other human cancer types including leukemia [8], gastric cancer [9], colorectal cancer [10], osteosarcoma [11], pancreatic cancer [12,13], prostate cancer [14,15], head and neck squamous cell carcinoma [16], and lung cancer [17]. Many different mechanisms of action have been ascribed to salinomycin, such as disruption of actin stress fibers [18], downregulation of mRNAs and proteins related to stemness [19], impaired mitochondrial function, induction of autophagy, decreased ATP levels and increased reactive oxygen species production [20,21,22,23], sequestration of iron in lysosomes [24], and induction of reactive oxygen species [23], with outcomes like decreased cell viability, proliferation, and migration, as well as stimulation of mesenchymal-to-epithelial-transition [25,26,27,28,29]. Salinomycin has also been shown to increase the expression of E-cadherin [30,31], a calcium-dependent cell adhesion glycoprotein molecule [32] found on the surface of epithelial cells [33]. The expression level of E-cadherin was inversely correlated with the tumorigenicity of different cell lines, where a high expression of E-cadherin correlated to low tumorigenicity and vice versa [34]. However, for clinical outcomes the role and correlation of E-cadherin is unclear [35] and the level of expression has been found to vary between tumors of different classification [35,36].
We have previously found evidence for the molecular initiating event that explains most down-stream effects observed after salinomycin treatment [37]. Salinomycin was shown to almost immediately after addition to the cell culture medium localize to the endoplasmic reticulum (ER) of breast cancer cells [37], leading to increased cytosolic Ca2+ levels followed by ER stress. This effect was down-stream linked to inhibition of the Wnt signaling pathway, which has previously been reported as an effect of salinomycin treatment [38]. These findings are deduced from population-based studies, but to increase our understanding of CSCs as well as how they can be targeted, more studies of single cell sensitivity are required.
Digital holography is a quantitative phase imaging technique, which can be used to generate large amounts of information about individual cells based on the phase shift of light [39]. The method is label free, thus eliminating possible chemical toxicity, and no phototoxicity has been found. Therefore, the technique allows for long time imaging and when images are acquired with high time resolution they can be used for longitudinal tracking of individual cells, which is a powerful tool to investigate how individual cells in a population react to treatment over time. It can also be used to detect and over time trace subpopulations that react differently than the bulk of cells to drugs, e.g., that are drug insensitive and may therefore be the cause of metastasis [40,41]. Using digital holography, we have previously shown that JIMT-1 breast cancer cells contain a subpopulation of cells with a decreased response to salinomycin compared to the other subpopulations [41], an effect that was hidden among the total population data.
Much work is ongoing trying to find holography-derived parameters, such as morphological for cell behavior features, or combinations thereof that can be used to characterize subpopulations among the bulk of cells [42]. It has been shown that a number of empirically-derived parameters obtained by digital holographic microscopy, actually can be applied to computational machine learning to identify effects of drug treatment on individual cells [42]. However, still more work is needed to elucidate if digital holography alone can be used to truly identify different cell populations and subpopulations.
The aim of the present study is to use longitudinal tracking of cells in images acquired using digital holographic microscopy in a unique combination with fluorescence microscopy to identify the expression of CD24 and E-cadherin on the tracked cells. This was used to investigate differences in cell cycle length and migratory behavior between subpopulations of JIMT-1 cells, as well as the effect of salinomycin on those parameters in the different subpopulations. We have used the JIMT-1 breast cancer cell line in studies of the effect of different compounds including salinomycin and salinomycin analogues on CSCs as well in studies using digital holographic microscopy [30,37,41,43]. The cell line contains a high proportion of CSCs that are sensitive to different treatments. Here we deepen our insight into dynamics of how the salinomycin treatment decreases the CSC subpopulation of JIMT-1 cells. Altogether the data show that the main difference between subpopulations of JIMT-1 cells is related to cell proliferation and that the initial effect of salinomycin treatment was a decrease in the proliferation of CD24 cells.

2. Materials and Methods

2.1. Cell Culturing

The human breast cancer cell line JIMT-1 (ACC-589) was purchased from the German Collection of Microorganisms and Cell Cultures (Braunschweig, Germany). The cells were routinely cultured in Dulbecco’s modified Eagle’s medium/Ham’s F-12 nutrient mixture (1:1) supplemented with 5% heat-inactivated donor horse serum (HI-DHS; Sigma-Aldrich AB, Stockholm, Sweden), 1 mM non-essential amino acids (VWR, Lund, Sweden), 100 U/mL penicillin (VWR), 100 µg/mL streptomycin (VWR), 2 mM L-glutamine (VWR) and 10 µg/mL insulin (Sigma-Aldrich), 1 mM sodium pyruvate (VWR), 50 µg/mL transferrin (Sigma-Aldrich), 0.5 µg/mL hydrocortisone (Sigma-Aldrich), and 20 ng/mL epidermal growth factor (Sigma-Aldrich). They were routinely subcultured twice a week. The cells were kept in a humidified incubator with 5% CO2 at 37 °C.

2.2. Cell Seeding

JIMT-1 cells were seeded in µ-dishes (35 mm diameter, IBIDI, Martinsried, Germany) at a density of 7300 cells/cm2 in 3 mL of regular growth medium. The cultures were incubated for 24 h to allow attachment prior to the start of time-lapse imaging. Before seeding a small square of 2 mm × 2 mm was marked on the outside of the bottom part of each µ-dish. The square was used for localization of cells as described below.

2.3. Treatment

Cells were treated with 0.5 µM salinomycin giving a final DMSO concentration of 0.2%. Control cells were exposed to 0.2% DMSO. The salinomycin stock solution was 10 mM in 100% DMSO. The treatment started immediately before time lapse-imaging, i.e., 24 h after seeding. Salinomycin was obtained from purification of technical grade (12%) material and used as its sodium salt as described previously [30].

2.4. Digital Holographic Time-Lapse Imaging in Combination with Fluorescence and Tracking

For digital holographic microscopy (DHM), the HoloMonitor® M4 (Phase Holographic Imaging AB (PHI), Lund, Sweden), with a motorized stage was used for time-lapse imaging. Images were acquired using the software Hstudio™ (PHI). To increase image quality, the standard lid of the Petri dish was replaced with HoloLid™ 71 110 (PHI) prior to the start of imaging.
The imaging was done using two different time setups. First, the method for combining digital holographic microscopy with fluorescence was evaluated using 24 h-time-lapses as illustrated in the upper part of Figure 1A. Cells were seeded in a number of Petri dishes, of which some were used in time-lapse imaging 24–48 h after seeding (i.e., time-lapse/treatment time 0–24 h) and some in time-lapse imaging 48–72 h after seeding (i.e., time-lapse/treatment time 24–48 h). Thus, a 48-h time-span was divided into two consecutive 24-h time-lapses where parallel samples were imaged for the different time-spans. For the other set-up, samples were imaged uninterrupted for 48 h, i.e., from 24–72 h after seeding (i.e., time-lapse/treatment time 0–48), as illustrated in the lower part of Figure 1A.
The time-lapse images were captured within the marked square using a stitching pattern as shown in Figure 1A. Sixteen images were captured for each square to cover the entire area. Images were captured every 15 min. Thus, for each square, 16 time-lapses were captured with images every 15 min. The experiment was repeated three times with two time-lapses analyzed for each dish, i.e., each figure includes six time-lapses per treatment and time interval.
At the end of the time-lapses, the cells were fixed in 4% formaldehyde and labeled as described below to allow identification based on CD24, CD44, and E-cadherin expression.

2.5. Fluorescence Labeling

The cells found in the last images of the digital holographic time-lapses were matched with cells in the fluorescence images. In the evaluation of the method, using the 24-h time-lapses (Figure 1A, Time-lapse 1 and 2), we used the two membrane receptors CD44 and CD24 to label cells for fluorescent detection of CSCs. We proceeded by using E-cadherin in combination with CD24 for the uninterrupted 48-h time-lapses to also evaluate for both CSCs and epithelial expression of the cells.
Cells were fixed in 4% formaldehyde in phosphate-buffered saline (PBS) for 15 min at 4 °C and rinsed three times with PBS. After fixation, the samples were incubated at room temperature (RT) with a blocking buffer (0.5% (w/v) DHS in PBS) for 60 min.
After blocking, the samples were labeled for CD44 or CD24 as follows: they were incubated with antibodies against CD44 conjugated to FITC (diluted 1:100 in blocking buffer; clone G44-26; BD Biosciences, Franklin Lakes, New Jersey, USA) and antibodies against CD24 conjugated to PE (diluted 1:50 in blocking buffer; clone ML5; BD Biosciences) for 120 min at RT. Alternatively, samples were labeled for E-cadherin and CD24 as follows: after blocking, the samples were incubated with primary antibodies against E-cadherin (diluted 1:100 in blocking buffer; ab1416; Abcam, Cambridge, Great Britain) for 60 min. After washing, the secondary antibody Alexa Flour 488 goat anti mouse (diluted 1:300 in blocking buffer; Invitrogen, Carlsbad, CA, USA) was added and incubated for 60 min before washing. Then, the antibodies against CD24 were added as already described. The samples were rinsed three times with PBS and then mounted in Mowiol (Sigma-Aldrich AB). The samples were stored at 4 °C in the dark overnight before they were viewed in a fluorescence microscope (Olympus AX70, Tokyo, Japan).

2.6. Fluorescence Quantification

For the CD24-PE fluorescence, cells were visually quantified as completely non-fluorescent (CD24) or fluorescent (CD24+). For E-cadherin expression, the cells were visually quantified as E-cadherin low (E-cadlow) with a weak expression over the surface, E-cadherin mid (E-cadmid) with a stronger expression over the surface but weak edges, or E-cadherin high (E-cadhigh) with a strong expression on the cell edges as well as expression over the entire surface (Supplementary Figure S3). The E-cadherin expressions are represented as red (low), blue (mid), and green (high; Figure 2).

2.7. Longitudinal Tracking of Cells Using Time-Lapses and Matching with Fluorescence Images

Longitudinal tracking of cells in the time-lapses was performed in Hstudio™ (Figure 1B). The program is semi-automatic, based on a frame-by-frame algorithm, where the user has to manually correct for misinterpretations introduced by the program. Sometimes the program does not segment cells correctly or tracked cells move out of the time-lapse frame before the entire time-lapse has ended. The tracking must sometimes be abrupted due to cell clumping if the boarders of the individual cells cannot be distinguished.
After tracking, the last image of the time-lapse was matched with the fluorescence image showing the same field of view and the expressions of CD44, CD24, and E-cadherin of the tracked cells were detected (Figure 1C).

2.8. Statistics

The computer language R was used for drawing figures and statistical analysis (R Core Team, 2015).

3. Results

3.1. Evaluating the Effect of Salinomycin on Proliferation Using a Combination of Longitudinal Tracking of Time-Lapses Obtained with DHM and Fluorescence Microscopy

By using DHM, we have previously shown that salinomycin treatment affects cell migration and cell proliferation of JIMT-1 cells [30,41]. Herein, we decided to combine DHM with fluorescence microscopy to further increase our understanding of how salinomycin affects different subpopulations. The experiments were set up in two different ways (Figure 1), in which both salinomycin was added 24 h after seeding. For time-lapses 1 and 2, DHM images were acquired in two 24-h intervals, one starting immediately after drug-addition and the other 24 h after drug-addition (Figure 1A). For Time-lapse 3, DHM images were acquired for 48 h, starting immediately after drug-addition (Figure 1A). After DHM imaging, the cells were fixed and labeled for the expression of CD44 and CD24 or E-cadherin and CD24 with fluorochrome-conjugated antibodies. The cells were tracked throughout the DHM time-lapses (Figure 1B). The cells in the last frame of the time-lapse were then identified in the respective fluorescence image and the expression of each cell was evaluated (Figure 1C). Since CD44 is expressed on all JIMT-1 cells [30], the CD44 expression was only used to identify the location of the cells. Representative images from a DHM time-lapse and the fluorescence images can be found in Figure S1.
The longitudinal tracking data was used to create cell family trees where the tracked cells were matched to their expression of the fluorescent markers. The complete set of cell family trees are found in Figure S2 and schematic representations of family trees are shown in Figure 2A. Supplementary Table S1 shows the maximal number of cell divisions for each family tree for each experimental set up (i.e., control 0–24, control 24–48, salinomycin 0–24, salinomycin 24–48, control 0–48, and salinomycin 0–48). If a cell family had two branches with different numbers of divisions, the higher number was counted.
The first observation is that siblings had the same CD24 expression in all cases in both control and salinomycin-treated cultures (Figure 2A). Thus, it is evident that salinomycin treatment did not result in daughter cells with different CD24 expression. The data show that salinomycin treatment resulted in a relative increase in the CD24+ population by inhibiting the proliferation of the CD24 population. Figure 2(A,B1–B4) show that there was an increase in the CD24 population in control cell cultures between 24 and 48 h compared to 0–24 h. The increase seems to be the result of more cell divisions in the CD24 population compared to the CD24+ population. Table S1 shows that in salinomycin-treated cultures, no cell families were found to have completed three cell divisions. In contrast a large proportion of the control cell families had gone through three divisions during 48 h. In other words, salinomycin treatment specifically inhibited the cell proliferation of the CD24 cells, resulting in a relative decrease in the CD24 population compared to the CD24+ population. In addition, salinomycin treatment affected the cell proliferation in CD24+ expressing cells as well.
For further analysis, the cells were divided into six groups depending on the expression of CD24 and E-cadherin. The CD24 labeling was used to group cells with positive or negative expression, while the E-cadherin was used to group the cells with low, medium, or high expression. Only cells present in the last frame of the DHM time-lapses could be matched with a fluorescence expression. Thus, when data is presented that includes cells not present in the last frame, those cells are designated as unknown. These are cells that were followed in the time-lapses but were not found in the last frame, most likely because they have moved out of the defined area where the time-lapses were captured. In the control 0.3% of the cells were characterized as unknown, while in salinomycin-treated cultures, 21% of the cells were unknown.
First, we evaluated all tracked cells present in the last image of the time-lapse. The proportions of CD44+CD24 cells in the control and salinomycin-treated cultures after 24 and 48 h of treatment were compared. In the control, this subpopulation increased from 43 to 70%, while in the presence of salinomycin the subpopulation was found to be 29% and 32% for the respective time-points (Figure 2(B1)), showing that salinomycin treatment inhibited the increase of CD24 cells in the population.
For E-cadherin, the expression was characterized as low for 57%, as medium for 32%, and as high for 10% of the tracked control cells (Figure 2(B2)). For salinomycin-treated cells the respective numbers were found to be 10%, 43%, and 27%, showing an increase in E-cadherin expression after salinomycin treatment (Figure 2(B2)).
Then the effect of salinomycin treatment on the co-expression of CD24 and E-cadherin was evaluated (Figure 2(B3,B4). In the control (Figure 2(B3)), the CD24+E-cadlow subpopulation contained 15% of the cells, CD24+E-cadmid 12.5%, and CD24+E-cadhigh 2% of the cells, while the CD24E-cadlow subpopulation contained 42%, CD24E-cadmid 21%, and CD24E-cadhigh 7.5% of the cells. For salinomycin-treated cells (Figure 2(B4)), the CD24+E-cadlow subpopulation contained 3.5% of the cells, the CD24+E-cadmid 20% of the cells, and CD24+E-cadhigh 30% of the cells. For the CD24 subpopulations, the distribution of the salinomycin treated cells were 8% CD24E-cadlow, 35% CD24E-cadmid, and 3.5% CD24E-cadhigh. In other words, this shows that the increase in the expression of E-cadherin after treatment with 0.5 µM salinomycin is independent of CD24-expression.

3.2. Longitudinal Tracking of Effects of Salinomycin on Motility

From the longitudinal tracking of cells in time-lapses obtained by DHM, it is also possible to extract data regarding cell movement. Thus, we further analyzed our data regarding motility speed and migration directness in 48-h time lapses. We have previously shown that JIMT-1 cells treated with 0.5 µM salinomycin and analyzed with the same longitudinal tracking method exhibited increased motility, but the migration directness was not affected compared to the control [41]. In the software used for this analysis, i.e., Hstudio, the definition of motility is the accumulated distance over the entire tracking time for each cell. The longer the tracking time is, the higher the motility will be, since there is longer time for the cell to move. Since not all cells could be tracked for the entire time-lapse, we chose to use motility speed. The motility speed was calculated by dividing the motility value of the last frame a cell was tracked in (i.e., the max motility for the cell) with the time of tracking for the cell, as this equalizes for the difference in tracking time. Migration is defined as the shortest distance between the starting point of the tracking and the end point of the tracking for each cell. Migration directness is the ratio between migration and motility and it gives information about how much the cells are jumping around to reach an end point. A ratio of 0 means a cell has not moved at all from the starting point, and a ratio of 1 means a cell has moved straight from its origin to its end point. A ratio for migration directness was calculated for every cell for every capture time. Then we calculated the mean of all these values, i.e., the average migration directness.
From the fluorescence images, we have sorted the cells into six groups as presented above. However, the cells included in those groups are only the cells present in the last frame of the DHM time-lapse as they are the ones with known expression of CD24, CD44, and E-cadherin. The expression of CD24, CD44, and E-cadherin in cells that leave the frame or divide before the last frame cannot be mapped. The cells included in the fluorescence data were tracked for different time-spans depending on the different time-intervals between cell divisions, depending on both the individual cell and the salinomycin treatment, as can be seen in Figure S2.
Max motility speed is the accumulated distance over the time of treatment (max motility) for each cell divided by the time of tracking (Figure 3A,B). Figure 3A,B shows that there was no difference in the max motility speed of cells with unknown fluorescence expression in the control and salinomycin-treated cultures. Figure 3A,B also shows that the max motility speed varied depending on the expression of CD24 and E-cadherin in both control and salinomycin-treated cultures. However, the variation was larger in salinomycin-treated cultures (Figure 3B) compared to the control (Figure 3A) and the highest max motility speed was found in the former. When comparing the max motility speed between control and salinomycin-treated cells based on their expression of E-cadherin only, salinomycin treatment significantly increased the max motility speed in all three E-cadherin groups (low: p < 0.0001, mid: p < 0.01, and high: p < 0.0001). Comparing the max motility speed between the control and salinomycin-treated cells depending on their expression of CD24 only, there was no significant difference between CD24+ cells, however for CD24 cells salinomycin-treatment significantly increased the max motility speed compared to the control (p < 0.0001). In short, independent of E-cadherin expression, salinomycin treatment caused CD24 expressing cells to move faster.
In the control (Figure 3A), there was a significantly higher max motility speed for cells with low expression of E-cadherin compared to cells with high E-cadherin expression (p = 0.007). The data also show that the max motility speed was higher in CD24+ cells compared to CD24 cells (p = 0.0008) independent of E-cadherin expression. In cultures treated with 0.5 µM salinomycin for 48 h (Figure 3B), the max motility speed for cells with low expression of E-cadherin was significantly higher than the max motility speed for cells with mid E-cadherin (p < 0.0001) and high E-cadherin (p < 0.0001) expression (Figure 3B). The CD24E-cadlow cells had a significantly higher motility speed than CD24E-cadmid (p-value < 0.0001). Altogether, in general, cells with low expression of E-cadherin had a higher max motility speed than cells with a higher expression of E-cadherin.
Average migration directness is the migration, i.e., the shortest distance between the starting point of the tracking and the end point of the tracking, divided by motility (Figure 3C,D). As with motility speed, there was no difference between average migration directness comparing control and salinomycin-treated cells with unknown identity (Figure 3C,D). Comparing the average migration directness between control and salinomycin-treated cells based on their E-cadherin expression only, salinomycin treatment significantly decreased the average migration directness for cells with low E-cadherin expression (p < 0.0001) and mid E-cadherin expression (p < 0.001). Moreover. doing the same comparison based on the expression of CD24 gives a significant decrease in average migration directness for both CD24+ cells (p < 0.0001) and CD24 cells (p < 0.00001) in salinomycin-treated cultures compared to the control.
In the control, cells with low expression of E-cadherin had significantly higher migration directness than cells with mid expression of E-cadherin (p = 0.008; Figure 3C). Further, the CD24+E-cadlow cells had significantly higher migration directness than CD24+E-cadhigh (p-value 0.004). For salinomycin-treated cells, there were no significant differences between the groups (Figure 3D). In short, control cells with low or medium expression of E-cadherin moved further away from the starting point than cells with a higher expression. Salinomycin treatment caused all cells to stay closer to the starting point, i.e., migration directness decreased compared to the control.

4. Discussion

Most of our current knowledge of how cells react to different kinds of perturbations is based on analysis of the response of an entire cell population. Individual cells may be analyzed e.g., by using flow cytometry as an end response assay, which may display heterogeneity of the studied entity. However, a challenge in biology is to understand the kinetics in the processes of each individual cell that causes the heterogeneity in the end response. Microscopic techniques like confocal microscopy, immunofluorescence microscopy, phase contrast microscopy, and DHM are today used to follow the behavior of live individual cells through time-lapse imaging. All methods have their advantages and disadvantages. Here we have used DHM because of the advantage of low photo toxicity and because it is label-free. The disadvantage of label free microscopy is that there are questions around cell identification. Here we address such questions by analyzing different subpopulations of JIMT-1 breast cancer cells identified by combining DHM with fluorescence microscopy.
We developed an assay for the classification of individual cells to subpopulations after long time tracking, where the last frame of a time-lapse with digital holographic images was matched with a fluorescence image from the same field of view. We used this approach to investigate the effect of salinomycin on cell division and cell movement in subpopulations distinguished by their CD24-expression in JIMT-1 breast cancer cells. Salinomycin has been shown to inhibit CSCs in many cancer cell types [8,9,10,11,12,13,14,15,16,17] using different assays. Here we show that the CD24 subpopulation was affected within 24 h after addition of salinomycin to the cell culture medium. Cell proliferation was specifically inhibited in the CD24 subpopulation resulting in a relative increase of the CD24+ population. Salinomycin treatment does therefore not appear to induce a phenotypic shift per se regarding CD24.
We have previously shown that salinomycin accumulates in the ER of cells within seconds after addition to the medium, resulting in a disturbance of the Ca2+ transport over the ER membrane caused by the K+ ionophoric activity of salinomycin [37]. K+ is needed as a counter ion in Ca2+ transport over the ER membrane [30]. The disturbed Ca+ transport results in disturbed Wnt signaling. A number of population-based studies besides our own have shown that a blockade of Wnt/β-catenin signaling suppresses CSCs [38]. By combining DHM and fluorescence microscopy that allow longitudinal single cell tracking and identification, we show a selective effect of salinomycin treatment on the CSC population of JIMT-1 cells.
Previously, salinomycin treatment was shown to selectively affect mesenchymal cells, allowing cells with more epithelial characteristics to survive [31]. We have previously shown that 72 h of treatment with salinomycin or salinomycin analogues at their respective IC50 concentrations increases the number of JIMT-1 cells expressing E-cadherin and β-catenin [30]. Here we further analyze the dynamics in the change of E-cadherin expression. By combining fluorescence labeling of CD24 (breast CSCs are CD24 [2,5,6]) with labeling of E-cadherin (a marker for epithelial characteristics), we could evaluate if the individual cells shifted towards a phenotype with less CSC characteristics and more epithelial characteristics after salinomycin treatment or if the population distribution changed due to natural selection. A higher E-cadherin expression after 48 h of treatment with 0.5 µM salinomycin was confirmed in the present study, where CD24+ cells had the largest proportion of cells with high expression. The increase in E-cadherin expression was caused by a selective inhibition of proliferation of cells expressing low levels of E-cadherin.
Salinomycin treatment has been shown to slow cell migration in population-based studies using different methods [13,14,29,41]. We have shown that salinomycin treatment reduces JIMT-1 cell migration in a wound healing assay [30]. Here we show that salinomycin treatment increased average cell motility to the same extent in both CD24+ and CD24 JIMT-1 subpopulations. We also show that even though salinomycin treatment increases cell motility, at the same time it decreases average cell migration. We have found the same results in another experimental set up using JIMT-1 cells, which corroborates the data presented here [41]. However, these data are not in conflict as cell migration is related to how far cells are moving from a starting point while motility reflects the movement around a starting point. Thus, salinomycin-treated cells seem to be “dancing” in circles in place to a higher degree than control cells. We have seen similar behavior in the context of other treatments (not published) and the mechanism behind this needs further elucidation.

5. Conclusions

In conclusion, the combination of DHM and fluorescence microscopy is powerful. It allowed us to show for the first time that the decrease in the CD24 CSC subpopulation already after 24 h of salinomycin treatment is caused by specific inhibition of proliferation of the CD24 population while the CD24+ population is not affected. This implies that the phenotypic shift towards less stemness caused by salinomycin treatment is due to positive selection of the CD24+ cells.

Supplementary Materials

The following are available online at https://www.mdpi.com/2076-3417/10/14/4732/s1, Figure S1: Representative images from DHM time-lapses and fluorescence, Figure S2: Cell family trees of JIMT-1 cells tracked through time-lapses of digital holographic images, Figure S3: Fluorescence image displaying the visual evaluation of E-cadherin -labeled cells as low (red arrow), mid (blue arrow) or high (green arrow). The cell with the red arrow is barely visible on a computer screen, Table S1: Interpretation of number of cell divisions seen in Figure S2 in relation to labelling.

Author Contributions

Conceptualization, B.J., K.A., S.K., and S.O.; Methodology, B.J., K.A., S.K. and S.O.; Validation, S.K. and S.O.; Formal analysis, S.K. Investigation, S.K. and S.O.; Resources, B.J., K.A. and S.O.; Data curation, S.K. and S.O.; Writing—original draft preparation, S.K., and S.O.; Writing—review and editing, B.J., K.A., S.K., and S.O.; Visualization, S.K. Supervision, B.J., K.A. and S.O.; Project administration, K.A. and S.O. All authors have read and agreed to the published version of the manuscript.

Funding

This work was supported by funding from the Swedish Research Council (VR), Forska Utan Djurförsök, by a donation from Carolina LePrince with the “Kalenderflickorna” and associated sponsors, and by donations to Stina Oredsson’s research group at Lund University (http://biology.lu.se/cancer-stem-cells).

Acknowledgments

We thank Daniel Strand for providing salinomycin and Helena Fritz for expert technical help.

Conflicts of Interest

K.A. and B.J. are employed at Phase Holographic Imaging. S.K. is an industrial Ph.D. student at PHI financed by V.R.

References

  1. Sneddon, J.B. Cancer stem cells. Adv. Struct. Saf. Stud. 2009, 568, 217–232. [Google Scholar] [CrossRef]
  2. Ailles, L.E.; Weissman, I.L. Cancer stem cells in solid tumors. Curr. Opin. Biotechnol. 2007, 18, 460–466. [Google Scholar] [CrossRef] [PubMed]
  3. Al-Hajj, M.; Becker, M.; Wicha, M.; Weissman, I.; Clarke, M.F. Therapeutic implications of cancer stem cells. Curr. Opin. Genet. Dev. 2004, 14, 43–47. [Google Scholar] [CrossRef] [PubMed]
  4. Bedard, P.L.; Cardoso, F.; Piccart-Gebhart, M.J. Stemming Resistance to HER-2 Targeted Therapy. J. Mammary Gland. Boil. Neoplasia 2009, 14, 55–66. [Google Scholar] [CrossRef]
  5. Dick, J. Breast cancer stem cells revealed. Proc. Natl. Acad. Sci. USA 2003, 100, 3547–3549. [Google Scholar] [CrossRef] [Green Version]
  6. Al-hajj, M.; Wicha, M.S.; Benito-hernandez, A.; Morrison, S.J.; Clarke, M.F. Prospective identification of tumorigenic breast cancer cells. Proc. Natl. Acad. Sci. USA 2003, 100, 3983–3988. [Google Scholar] [CrossRef] [Green Version]
  7. Gupta, P.B.; Önder, T.T.; Jiang, G.; Tao, K.; Kuperwasser, C.; Weinberg, R.; Lander, E.S. Identification of selective inhibitors of cancer stem cells by high-throughput screening. Cell 2009, 138, 645–659. [Google Scholar] [CrossRef] [Green Version]
  8. Fuchs, D.; Daniel, V.; Sadeghi, M.; Opelz, G.; Naujokat, C. Salinomycin overcomes ABC transporter-mediated multidrug and apoptosis resistance in human leukemia stem cell-like KG-1a cells. Biochem. Biophys. Res. Commun. 2010, 394, 1098–1104. [Google Scholar] [CrossRef]
  9. Zhi, Q.M.; Chen, X.H.; Ji, J.; Zhang, J.N.; Li, J.F.; Cai, Q.; Liu, B.Y.; Gu, Q.L.; Zhu, Z.G.; Yu, Y.Y. Salinomycin can effectively kill ALDHhigh stem-like cells on gastric cancer. Biomed. Pharmacother. 2011, 65, 509–515. [Google Scholar] [CrossRef]
  10. Zhou, J.; Li, P.; Xue, X.; He, S.; Kuang, Y.; Zhao, H.; Chen, S.; Zhi, Q.; Guo, X. Salinomycin induces apoptosis in cisplatin-resistant colorectal cancer cells by accumulation of reactive oxygen species. Toxicol. Lett. 2013, 222, 139–145. [Google Scholar] [CrossRef] [Green Version]
  11. Tang, Q.-L.; Zhao, Z.-Q.; Li, J.-C.; Liang, Y.; Yin, J.-Q.; Zou, C.-Y.; Xie, X.-B.; Zeng, Y.-X.; Shen, J.-N.; Kang, T.; et al. Salinomycin inhibits osteosarcoma by targeting its tumor stem cells. Cancer Lett. 2011, 311, 113–121. [Google Scholar] [CrossRef] [PubMed]
  12. Zhang, G.-N.; Liang, Y.; Zhou, L.-J.; Chen, S.-P.; Chen, G.; Zhang, T.; Kang, T.; Zhao, Y. Combination of salinomycin and gemcitabine eliminates pancreatic cancer cells. Cancer Lett. 2011, 313, 137–144. [Google Scholar] [CrossRef] [PubMed]
  13. He, L.; Wang, F.; Dai, W.-Q.; Wu, D.; Lin, C.-L.; Wu, S.-M.; Cheng, P.; Zhang, Y.; Shen, M.; Wang, C.-F.; et al. Mechanism of action of salinomycin on growth and migration in pancreatic cancer cell lines. Pancreatology 2013, 13, 72–78. [Google Scholar] [CrossRef] [PubMed]
  14. Ketola, K.; Hilvo, M.; Hyötyläinen, T.; Vuoristo, A.; Ruskeepää, A.-L.; Orešič, M.; Kallioniemi, O.; Iljin, K. Salinomycin inhibits prostate cancer growth and migration via induction of oxidative stress. Br. J. Cancer 2012, 106, 99–106. [Google Scholar] [CrossRef] [Green Version]
  15. Shang, Z.; Cai, Q.; Zhang, M.; Zhu, S.; Ma, Y.; Sun, L.; Jiang, N.; Tian, J.; Niu, X.; Chen, J.; et al. A switch from CD44+ cell to EMT cell drives the metastasis of prostate cancer. Oncotarget 2014, 6, 1202–1216. [Google Scholar] [CrossRef] [Green Version]
  16. Kuo, S.Z.; Blair, K.J.; Rahimy, E.; Kiang, A.; Abhold, E.; Fan, J.-B.; Wang-Rodriguez, J.; Altuna, X.; Ongkeko, W. Salinomycin induces cell death and differentiation in head and neck squamous cell carcinoma stem cells despite activation of epithelial-mesenchymal transition and Akt. BMC Cancer 2012, 12, 556. [Google Scholar] [CrossRef] [Green Version]
  17. Larzabal, L.; El-Nikhely, N.; Redrado, M.; Seeger, W.; Savai, R.; Calvo, A. Differential effects of drugs targeting cancer stem cell (CSC) and non-CSC populations on lung primary tumors and msetastasis. PLoS ONE 2013, 8, e79798. [Google Scholar] [CrossRef] [PubMed] [Green Version]
  18. Schenk, M.; Aykut, B.; Teske, C.; Giese, N.A.; Weitz, J.; Welsch, T. Salinomycin inhibits growth of pancreatic cancer and cancer cell migration by disruption of actin stress fiber integrity. Cancer Lett. 2015, 358, 161–169. [Google Scholar] [CrossRef]
  19. Lee, H.-G.; Shin, S.-J.; Chung, H.-W.; Kwon, S.-H.; Cha, S.-D.; Lee, J.-E.; Cho, C.-H. Salinomycin reduces stemness and induces apoptosis on human ovarian cancer stem cell. J. Gynecol. Oncol. 2017, 28, 1–11. [Google Scholar] [CrossRef] [Green Version]
  20. Jangamreddy, J.R.; Ghavami, S.; Grabarek, J.; Kratz, G.; Wiechec, E.; Fredriksson, B.-A.; Pariti, R.K.R.; Cieślar-Pobuda, A.; Panigrahi, S.; Łos, M.J. Salinomycin induces activation of autophagy, mitophagy and affects mitochondrial polarity: Differences between primary and cancer cells. Biochim. Biophys. Acta Bioenerg. 2013, 1833, 2057–2069. [Google Scholar] [CrossRef] [Green Version]
  21. Kim, S.-H.; Choi, Y.-J.; Kim, K.-Y.; Yu, S.-N.; Seo, Y.-K.; Chun, S.-S.; Noh, K.-T.; Suh, J.-T.; Ahn, S.-C. Salinomycin simultaneously induces apoptosis and autophagy through generation of reactive oxygen species in osteosarcoma U2OS cells. Biochem. Biophys. Res. Commun. 2016, 473, 607–613. [Google Scholar] [CrossRef] [PubMed]
  22. Boehmerle, W.; Endres, M. Salinomycin induces calpain and cytochrome c-mediated neuronal cell death. Cell Death Dis. 2011, 2, e168. [Google Scholar] [CrossRef] [PubMed] [Green Version]
  23. Verdoodt, B.; Vogt, M.; Schmitz, I.; Liffers, S.-T.; Tannapfel, A.; Mirmohammadsadegh, A. Salinomycin induces autophagy in colon and breast cancer cells with concomitant generation of reactive oxygen species. PLoS ONE 2012, 7, e44132. [Google Scholar] [CrossRef] [PubMed] [Green Version]
  24. Mai, T.T.; Hamaï, A.; Hienzsch, A.; Cañeque, T.; Müller, S.; Wicinski, J.; Cabaud, O.; Leroy, C.; David, A.; Acevedo, V.; et al. Salinomycin kills cancer stem cells by sequestering iron in lysosomes. Nat. Chem. 2017, 9, 1025–1033. [Google Scholar] [CrossRef] [PubMed] [Green Version]
  25. Al Dhaheri, Y.; Attoub, S.; Arafat, K.; AbuQamar, S.F.; Eid, A.; Al Faresi, N.; Iratni, R. Salinomycin induces apoptosis and senescence in breast cancer: Upregulation of p21, downregulation of survivin and histone H3 and H4 hyperacetylation. Biochim. Biophys. Acta Gen. Subj. 2013, 1830, 3121–3135. [Google Scholar] [CrossRef]
  26. An, H.; Kim, J.Y.; Oh, E.; Lee, N.; Cho, Y.; Seo, J.H. Salinomycin promotes anoikis and decreases the CD44+/CD24 stem-like population via inhibition of STAT3 activation in MDA-MB-231 cells. PLoS ONE 2015, 10, e0141919. [Google Scholar] [CrossRef] [Green Version]
  27. An, H.; Kim, J.Y.; Lee, N.; Cho, Y.; Oh, E.; Seo, J.H. Salinomycin possesses anti-tumor activity and inhibits breast cancer stem-like cells via an apoptosis-independent pathway. Biochem. Biophys. Res. Commun. 2015, 466, 696–703. [Google Scholar] [CrossRef]
  28. Zhang, C.; Lu, Y.; Li, Q.; Mao, J.; Hou, Z.; Yu, X.; Fan, S.; Li, J.; Gao, T.; Yan, B.; et al. Salinomycin suppresses TGF-β1-induced epithelial-to-mesenchymal transition in MCF-7 human breast cancer cells. Chem. Int. 2016, 248, 74–81. [Google Scholar] [CrossRef]
  29. Kopp, F.; Hermawan, A.; Oak, P.S.; Herrmann, A.; Wagner, E.; Roidl, A. Salinomycin treatment reduces metastatic tumor burden by hampering cancer cell migration. Mol. Cancer 2014, 13, 16. [Google Scholar] [CrossRef] [Green Version]
  30. Huang, X.; Borgström, B.; Kempengren, S.; Persson, L.; Hegardt, C.; Strand, D.; Oredsson, S. Breast cancer stem cell selectivity of synthetic nanomolar-active salinomycin analogs. BMC Cancer 2016, 16, 145. [Google Scholar] [CrossRef] [Green Version]
  31. Kopp, F.; Hermawan, A.; Oak, P.S.; Ulaganathan, V.K.; Herrmann, A.; Elnikhely, N.; Thakur, C.; Xiao, Z.; Knyazev, P.; Ataseven, B.; et al. Sequential salinomycin treatment results in resistance formation through clonal selection of epithelial-like tumor cells. Transl. Oncol. 2014, 7, 702–711. [Google Scholar] [CrossRef] [PubMed] [Green Version]
  32. Takeichi, M. Cadherins: A molecular family important in selective cell-cell adhesion Annu. Rev. Biochem. 1990, 59, 237–252. [Google Scholar] [CrossRef] [PubMed]
  33. Takeichi, M. The cadherins: Cell-cell adhesion molecules controlling animal morphogenesis. Development 1988, 102, 639–655. [Google Scholar] [PubMed]
  34. Chekhun, S.; Bezdenezhnykh, N.; Shvets, J.; Lukianova, N. Expression of biomarkers related to cell adhesion, metastasis and invasion of breast cancer cell lines of different molecular subtype. Exp. Oncol. 2013, 35, 174–179. [Google Scholar] [PubMed]
  35. Popescu, C.I.; Giuşcă, S.E.; Liliac, L.; Avadanei, R.; Ceauşu, R.; Cimpean, A.M.; Balan, R.; Amalinei, C.; Apostol, D.C.; Caruntu, I.D. E-cadherin expression in molecular types of breast carcinoma. Rom. J. Morphol. Embryol. Rev. Roum. Morphol. Embryol. 2013, 54, 267–273. [Google Scholar]
  36. Fulga, V.; Rudico, L.; Balica, A.R.; Cimpean, A.M.; Saptefrati, L.; Margan, M.-M.; Raica, M. Differential expression of e-cadherin in primary breast cancer and corresponding lymph node metastases. Anticancer Res. 2015, 35, 759–765. [Google Scholar]
  37. Huang, X.; Borgström, B.; Stegmayr, J.; Abassi, Y.; Kruszyk, M.; Leffler, H.; Persson, L.; Albinsson, S.; Massoumi, R.; Scheblykin, I.G.; et al. The molecular basis for inhibition of stemlike cancer cells by salinomycin. ACS Cent. Sci. 2018, 4, 760–767. [Google Scholar] [CrossRef]
  38. Lu, D.; Choi, M.Y.; Yu, J.; Castro, J.E.; Kipps, T.J.; Carson, D.A. Salinomycin inhibits Wnt signaling and selectively induces apoptosis in chronic lymphocytic leukemia cells. Proc. Natl. Acad. Sci. USA 2011, 108, 13253–13257. [Google Scholar] [CrossRef] [Green Version]
  39. Alm, K.; El-Schich, Z.; Falck, M.; Wingren, A.G.; Janicke, B.; Oredsso, S. Cells and holograms—holograms and digital holographic microscopy as a tool to study the morphology of living cells. Hologr. Basic Princ. Contemp. Appl. 2013, 335–351. [Google Scholar]
  40. Burke, R.T.; Orth, J.D. Through the looking glass: Time-lapse microscopy and longitudinal tracking of single cells to study anti-cancer therapeutics. J. Vis. Exp. 2016, 111, e53994. [Google Scholar] [CrossRef]
  41. Kamlund, S.; Strand, D.; Janicke, B.; Alm, K.; Oredsson, S. Influence of salinomycin treatment on division and movement of individual cancer cells cultured in normoxia or hypoxia evaluated with time-lapse digital holographic microscopy. Cell Cycle 2017, 16, 2128–2138. [Google Scholar] [CrossRef] [PubMed] [Green Version]
  42. Hejna, M.; Jorapur, A.; Song, J.S.; Judson-Torres, R.L. High accuracy label-free classification of kinetic cell states from holographic cytometry. Reports 2017, 7, 127449. [Google Scholar] [CrossRef] [Green Version]
  43. Huang, X.; Borgström, B.; Månsson, L.K.; Persson, L.; Oredsson, S.; Hegardt, C.; Strand, D. Semisynthesis of SY-1 for Investigation of breast cancer stem cell selectivity of C-ring-modified salinomycin analogues. ACS Chem. Boil. 2014, 9, 1587–1594. [Google Scholar] [CrossRef] [PubMed]
Figure 1. Schematic view of the experimental set-up. (A) Before seeding, an area was marked on the outside of the bottom part of Petri dishes. At time-24 h, cells were seeded in multiple Petri dishes. ( Applsci 10 04732 i001
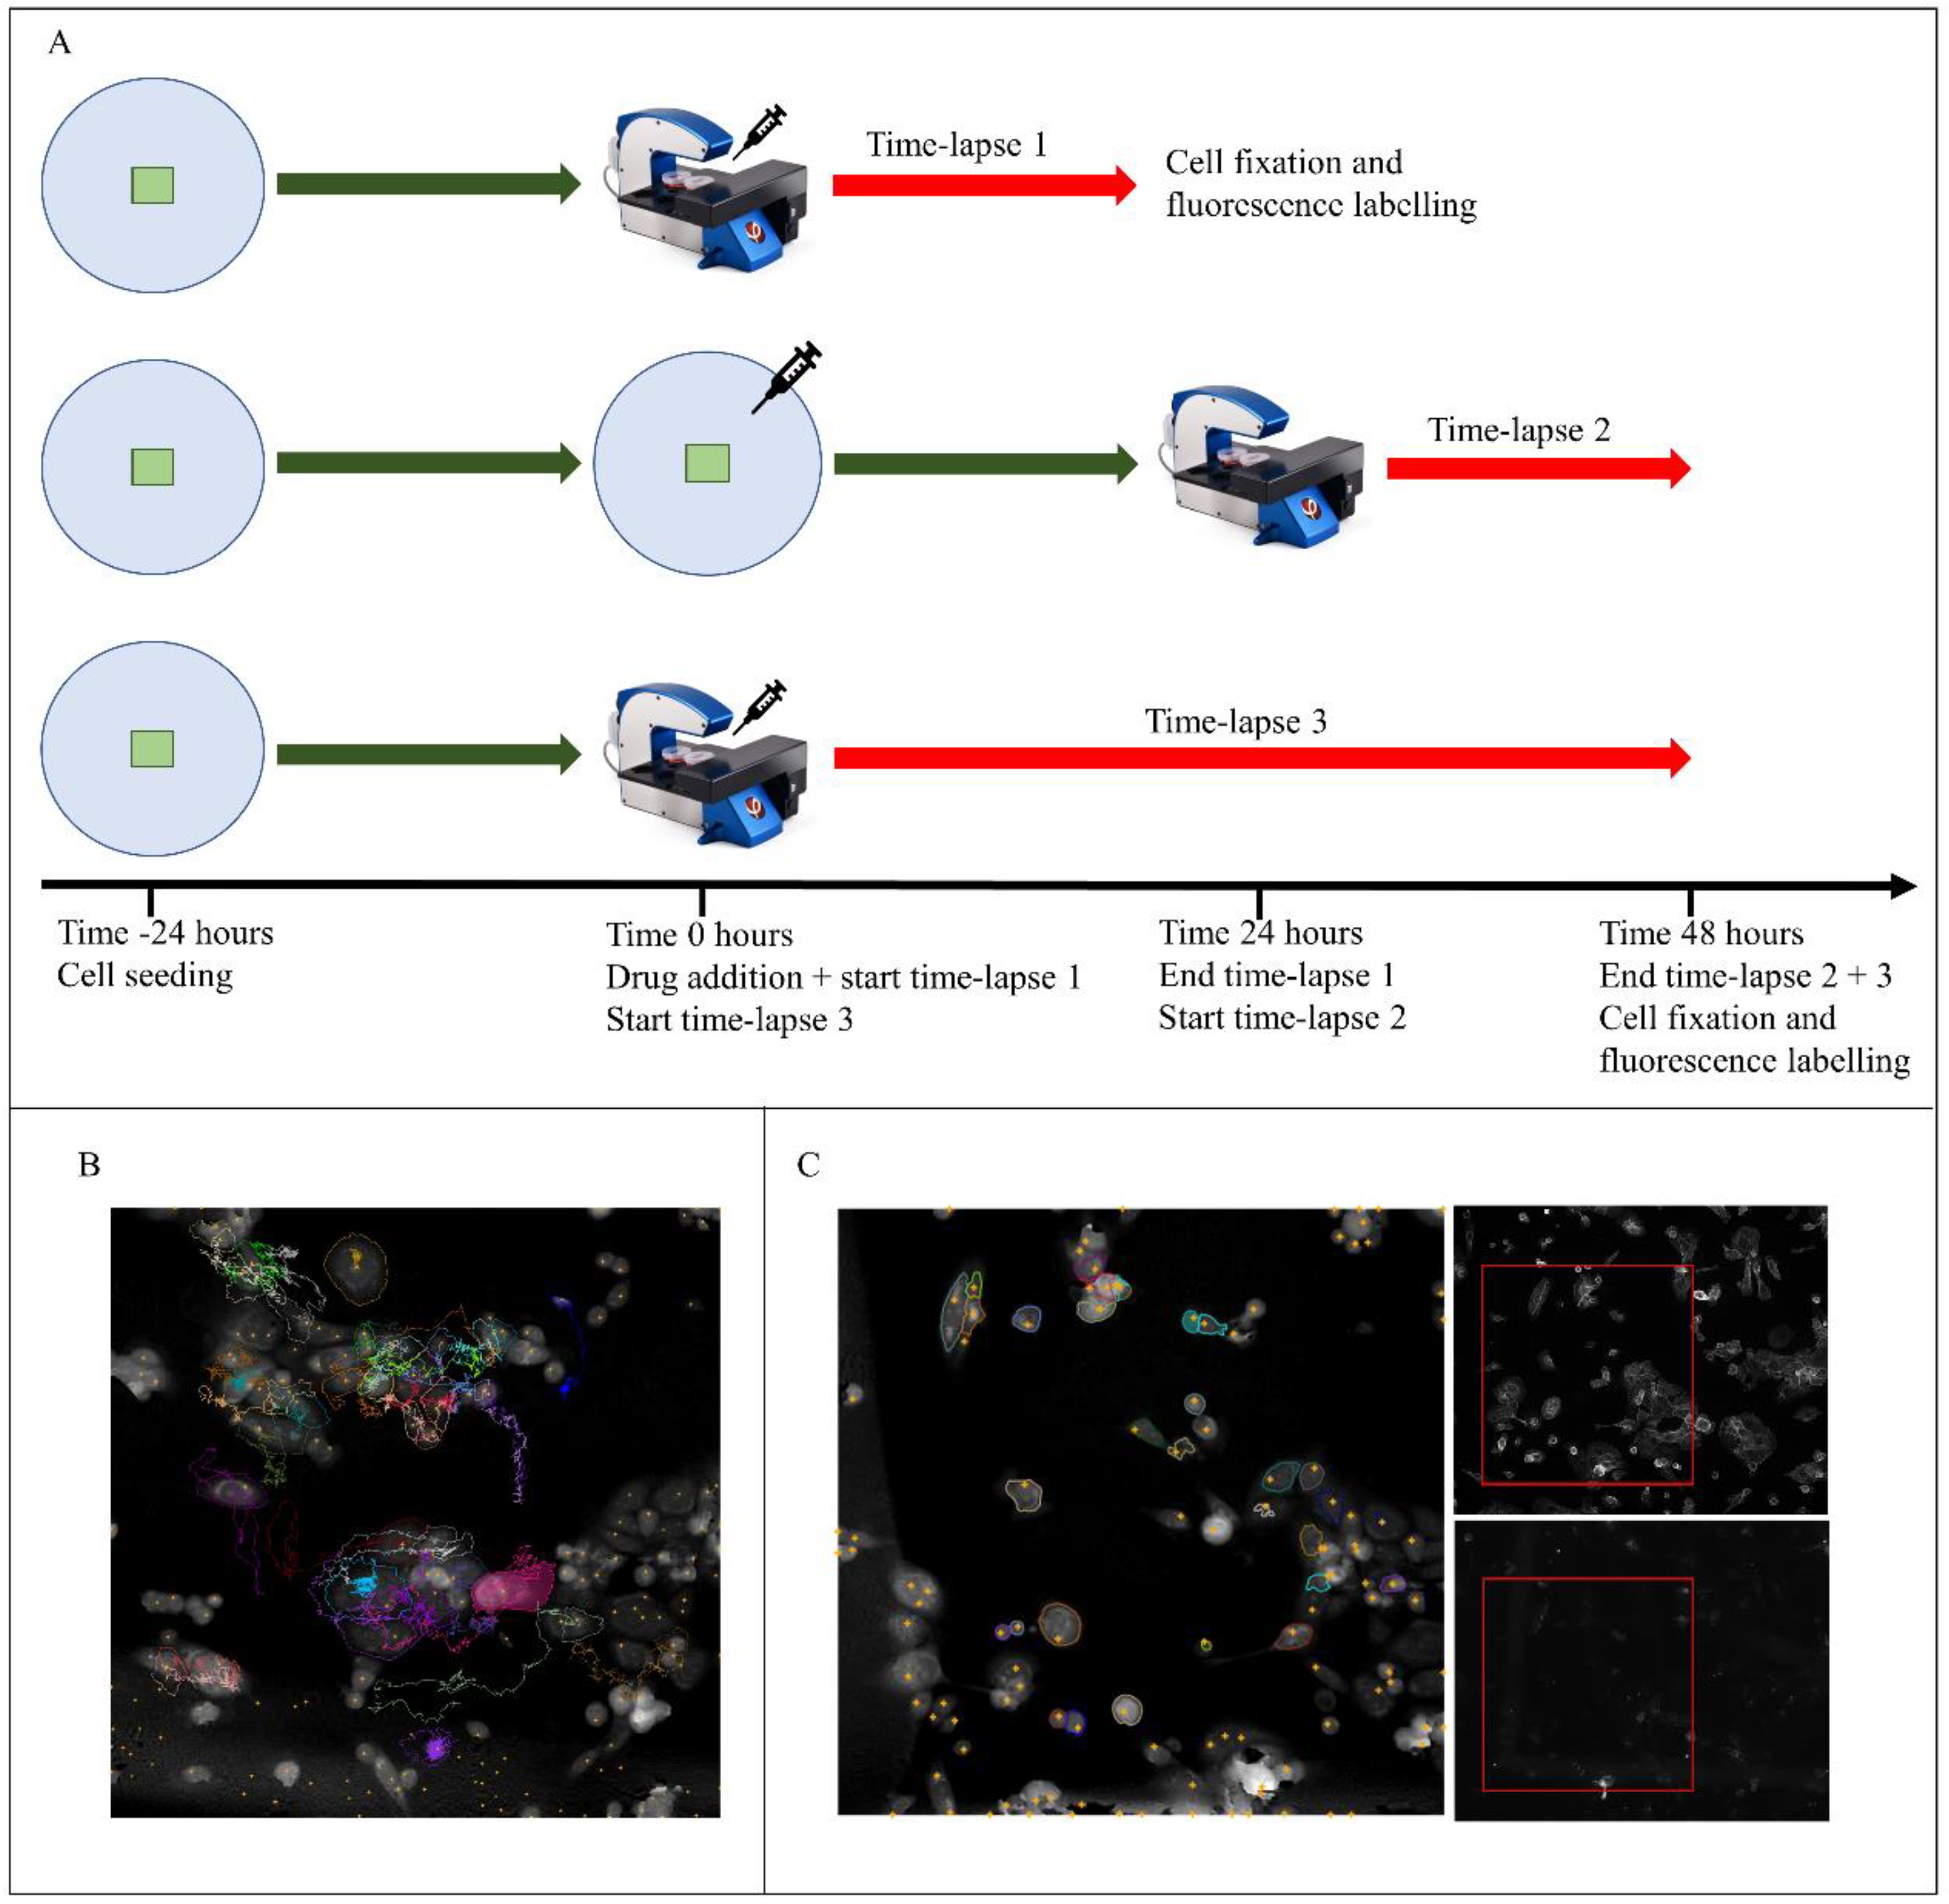
). Salinomycin was added to a final concentration of 0.5 µM 24 h after seeding ( Applsci 10 04732 i002). The cells inside the marked area were imaged by digital holography for 24-h or 48-h periods ( Applsci 10 04732 i003, Time-lapse 3), with the start of the time-lapses immediately after treatment ( Applsci 10 04732 i004, Time-lapse 1) or 24 h after treatment ( Applsci 10 04732 i005, Time-lapse 2). After the time-lapse, the cells were fixed and labeled with FITC-conjugated anti-CD44 antibodies and PE-conjugated anti-CD24-antibodies or labeled with Alexa Flour 488-labeled anti-E-cadherin and PE-conjugated anti-CD24-antibodies and then imaged in a fluorescence microscope. (B) Representative image of cells tracked through a time-lapse of digital holographic images. The colored trails show cell movement during the time-lapse. The tracking is the basis for all longitudinal analysis. (C) Representative images used for visual over-lay, which allowed for cell identification in the time-lapse. Left image: digital holography. Upper right image: fluorescence, CD44 staining. Lower right image: fluorescence, CD24 staining. The red box corresponds to the area image by digital holography.
Applsci 10 04732 g001
Figure 2. Longitudinal tracking combined with fluorescence imaging of JIMT-1 cells cultured in the absence or presence of 0.5 µM salinomycin. (A) Longitudinal tracking of digital holographic microscopy (DHM) time-lapses displayed as representative cell family trees based on the original data in Figure S2. The dashed lines in each panel separate the CD24+ and CD24 cell populations as well as the unknown cells (UN, no label). The expression of E-cadherin is represented as colors of the end-circle in the 0–48 h panels, red = low, blue = medium, and green = high. O: known expression of fluorescence, X: unknown expression due to division before end of the time-lapse, clumping of cells or leaving the frame before the end of the time-lapse. (B14) Proportion of JIMT-1 cells designated into different groups depending on their expression of fluorescence at 48 h. The data are compiled from all data shown in Figure S2. They are derived from 3 independent experiments with 2 independent time-lapses in each.
Applsci 10 04732 g002
Figure 3. Movement behavior of JIMT-1 cells cultured in the absence or presence of 0.5 µM salinomycin. The cells were imaged using time-lapse digital holographic imaging for 48 h starting immediately after treatment. After time-lapse imaging, the cells were fixed and stained for the expression of CD24 and E-cadherin and fluorescence images were acquired at the same field of view as the time-lapse. The tracked cells from the time-lapse were characterized as being either CD24+ or CD24 and the E-cadherin expression was characterized as low, medium, or high, resulting in six groups. The cells that were tracked but that were not present in the last frame of the DHM time-lapse are called unknown (UN). Max motility speed (A,B) is the accumulated distance over the time of treatment (max motility) divided by the time of tracking. Average migration directness (C,D) is the migration, i.e., the shortest distance between the starting point of the tracking and the end point of the tracking, divided by motility. (A) Significant differences for the max motility speed was found between the CD24+ and CD24 populations (p = 0.0008) of the control, and between cells with low or high expression of E-cadherin (p = 0.007). There was also a significant difference between CD24+E-cadmid cells and CD24E-cadmid cells (p = 0.002). (B) Significant differences for max motility speed for the salinomycin-treated sample were found between cells with low or medium expression of E-cadherin (p < 0.0001), as well as those with high expression (p < 0.0001). There was also a significant difference between CD24E-cadlow cells and CD24E-cadmid cells (p < 0.0001). (C) For average migration directness, significant differences were found comparing cells with low E-cadherin expression compared to medium expression (p-value = 0.008), and for CD24+E-cadlow cells compared to CD24+E-cadhigh (p = 0.004). (D) No significant differences in average migration directness were found for the different groups of salinomycin-treated cells. (A,B) Salinomycin treatment significantly increases the max motility speed in all three E-cadherin groups (low: p < 0.0001, mid: p < 0.01, and high: p < 0.0001) compared to control. (C,D) Salinomycin treatment significantly decreased the average migration directness for cells with low E-cadherin expression (p < 0.0001) and mid E-cadherin expression (p < 0.001). All statistics were evaluated using a one-way ANOVA and Tukey honest significant differences.
Applsci 10 04732 g003

