Author Contributions
Conceptualization: D.Z.; methodology, J.P.; software, D.Z.; validation, J.P. and Z.W.; formal analysis, P.W.; investigation, D.Z.; resources, J.P.; data curation, D.Z.; writing—original draft preparation, D.Z.; writing—review and editing, D.Z.; visualization, D.Z.; supervision, Z.W.; project administration, Z.W.; funding acquisition, Z.W. All authors have read and agreed to the published version of the manuscript.
Funding
This study was supported by the National Natural Science Foundation of China (Grant No. 51638009, 51778241, 51978279), the State Key Laboratory of Subtropical Building Science, South China University of Technology (Grant No. 2017ZB28, 2017KD22), the Fundamental Research Funds for the Central Universities, South China University of Technology (Grant No. 2019PY20, D2191390), the Chinese Postdoctoral Foundation of China (Grant No. 2019M652898), Guangdong Basic and Applied Basic Research Foundation (2020A1515011307) and the Young Innovative Talents Program in Universities and Colleges of Guangdong Province (2018KQNCX006).
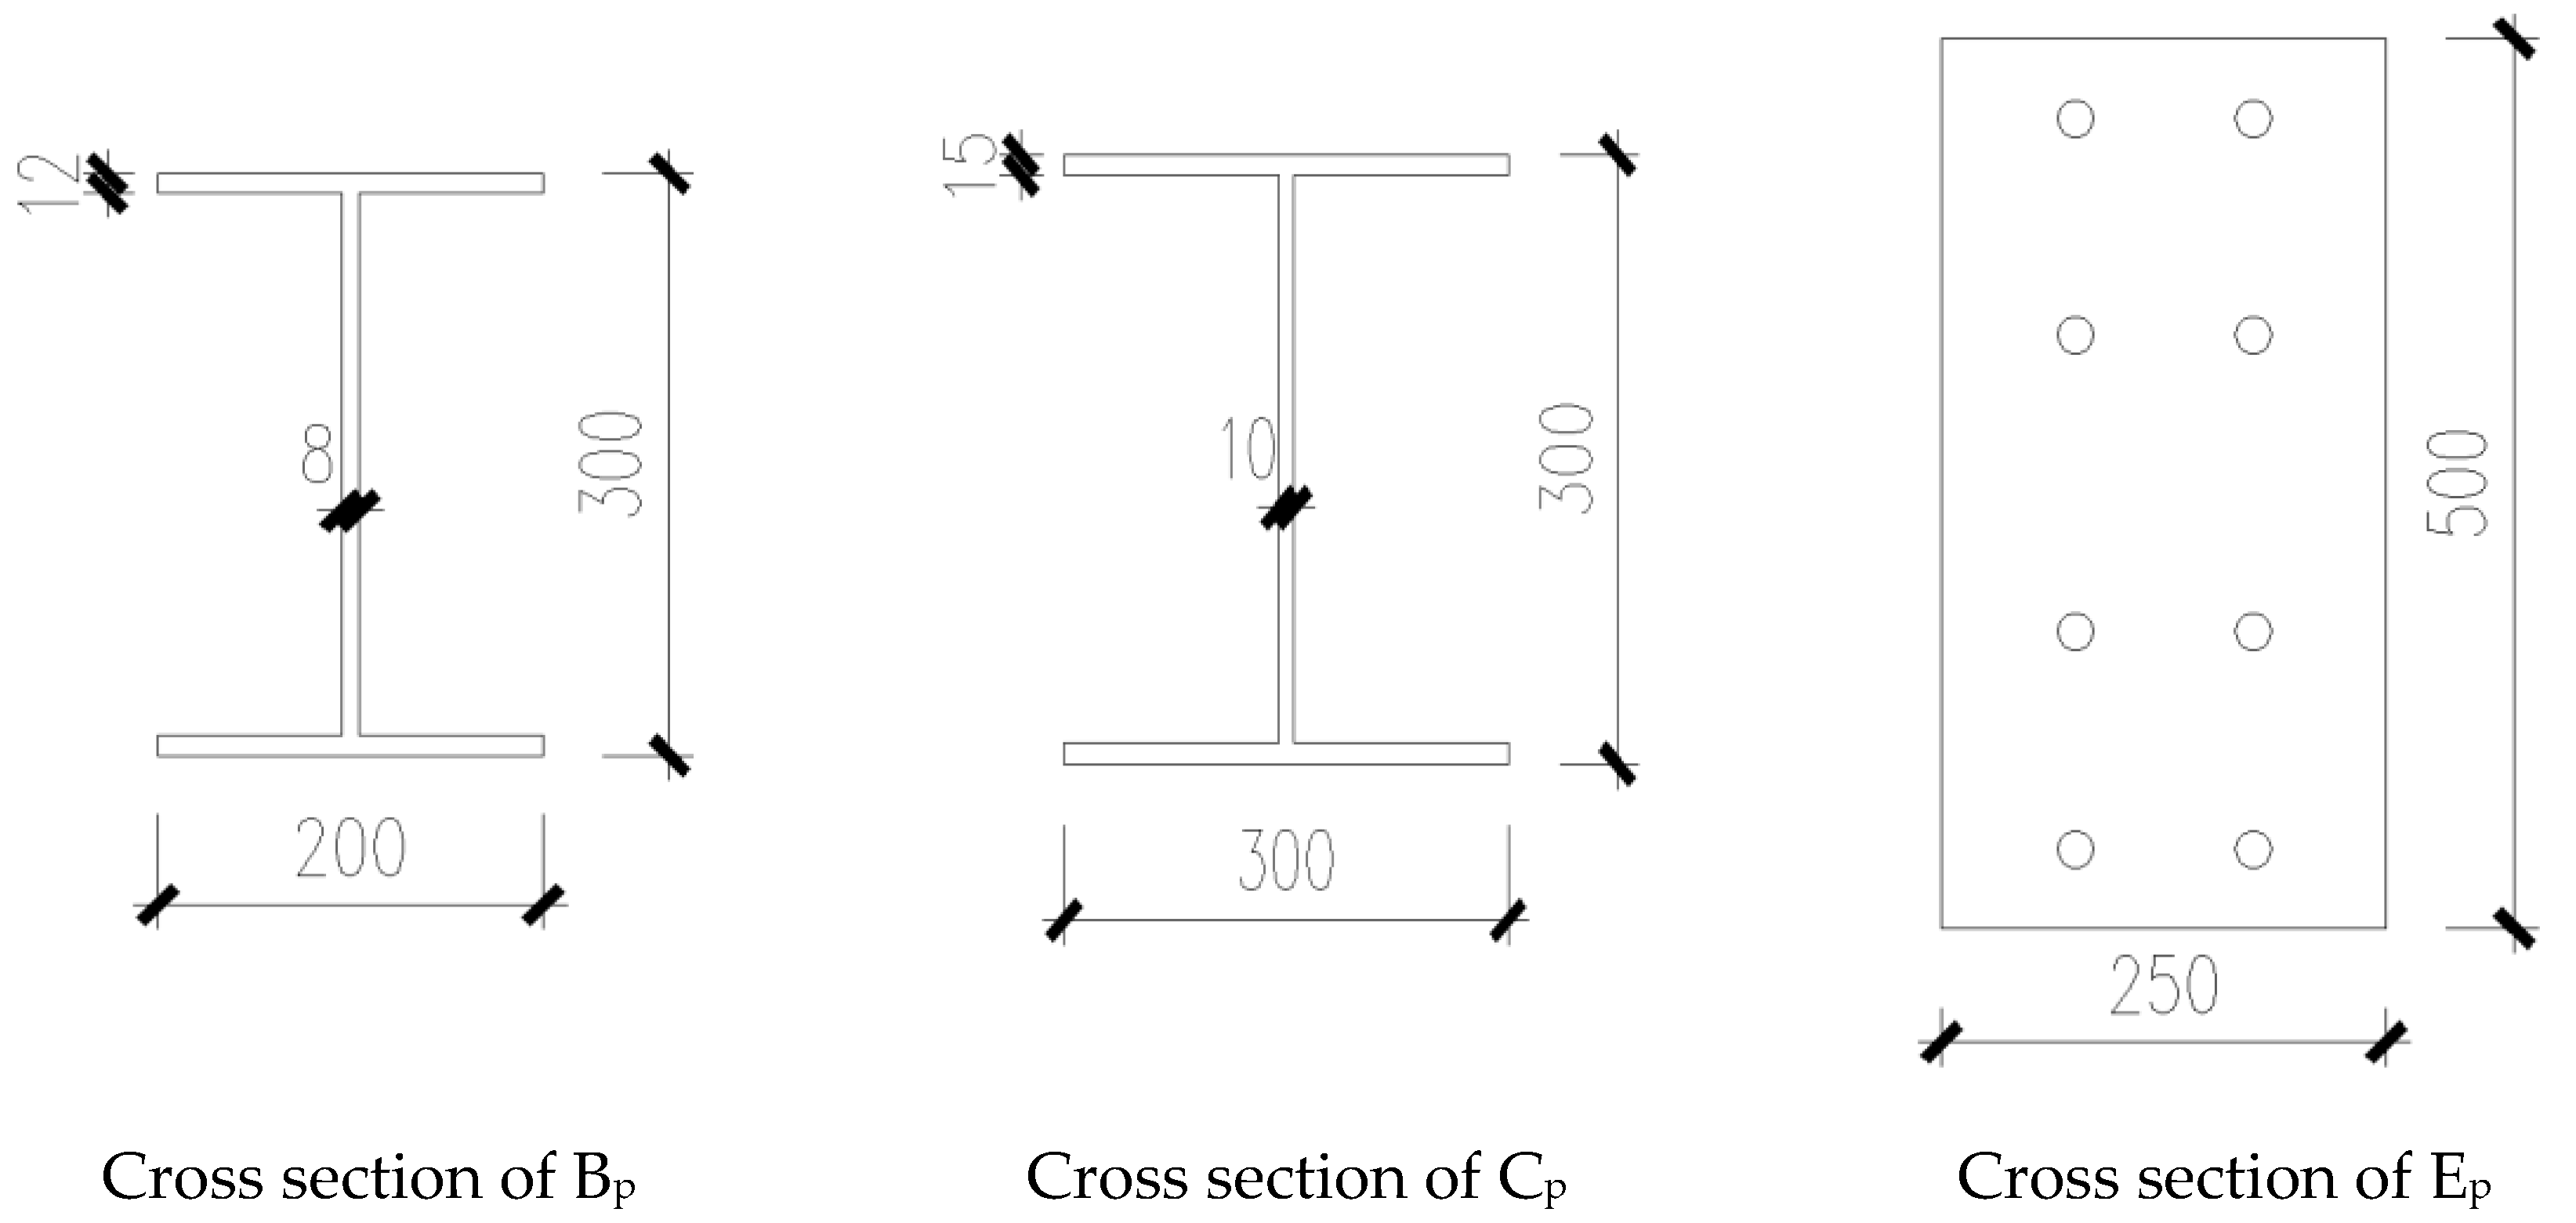
Figure 1.
Schematic diagram of component dimensions.
Figure 1.
Schematic diagram of component dimensions.
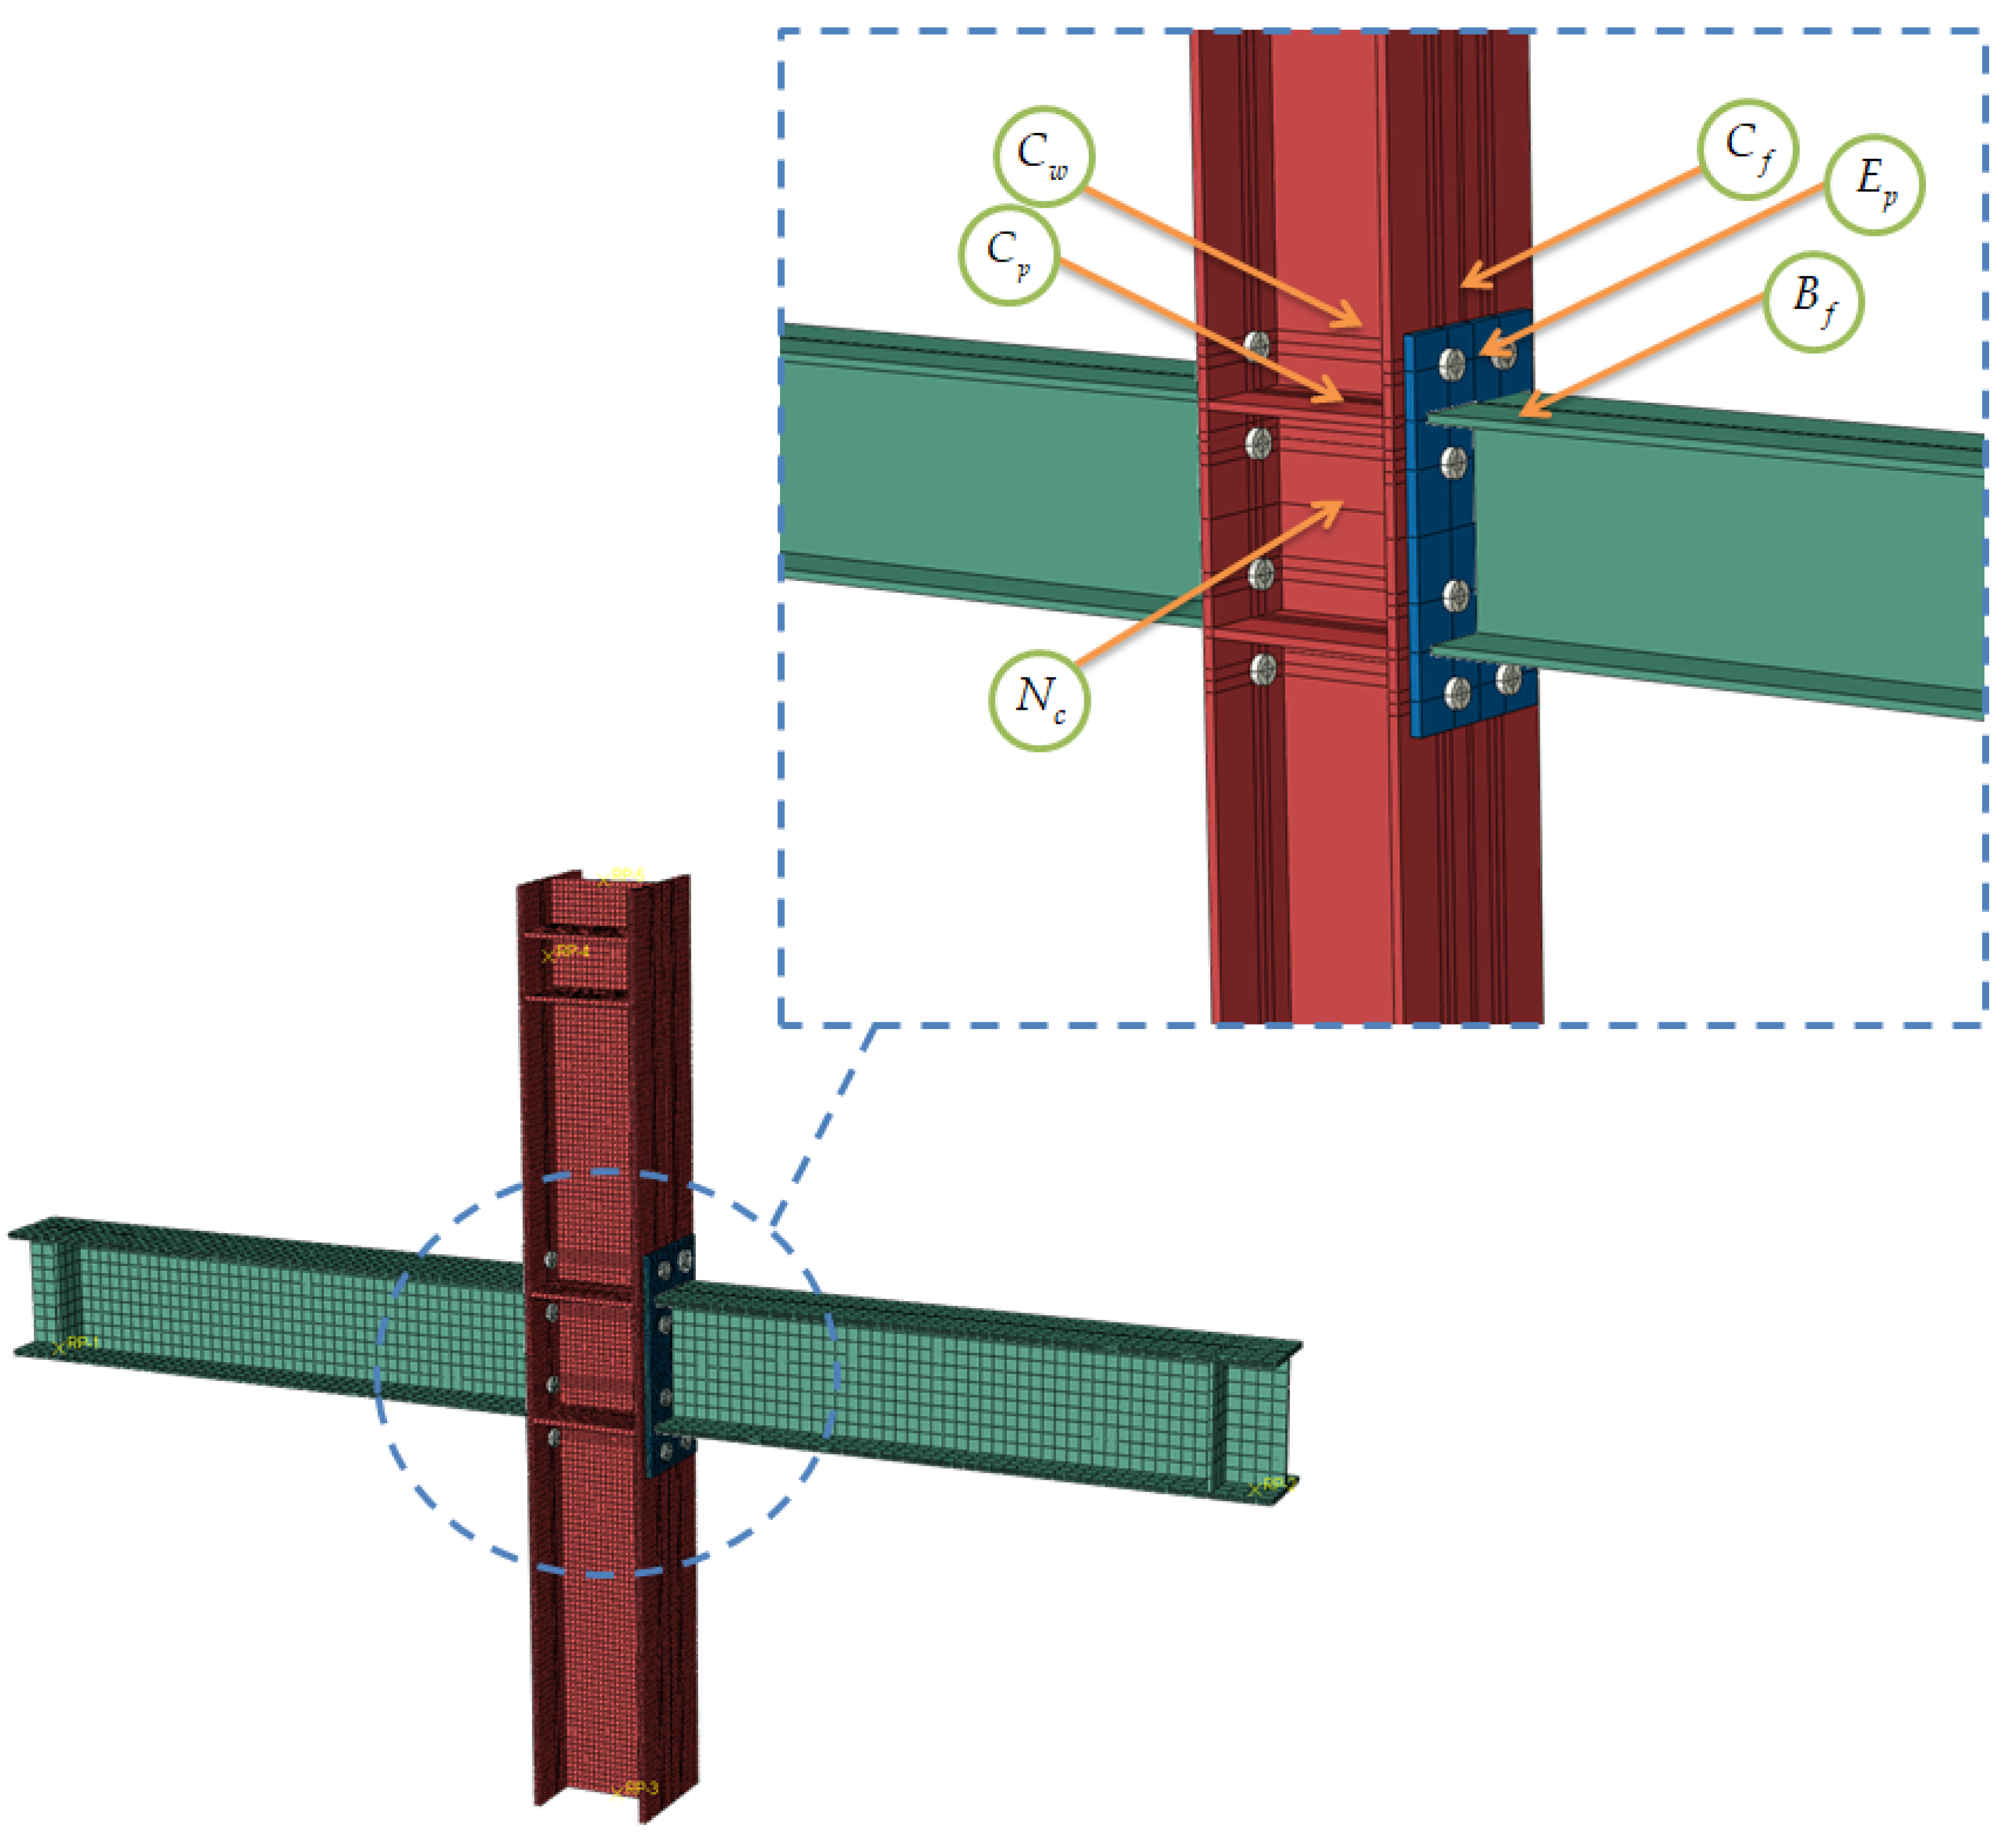
Figure 2.
Specified points of the finite element model.
Figure 2.
Specified points of the finite element model.
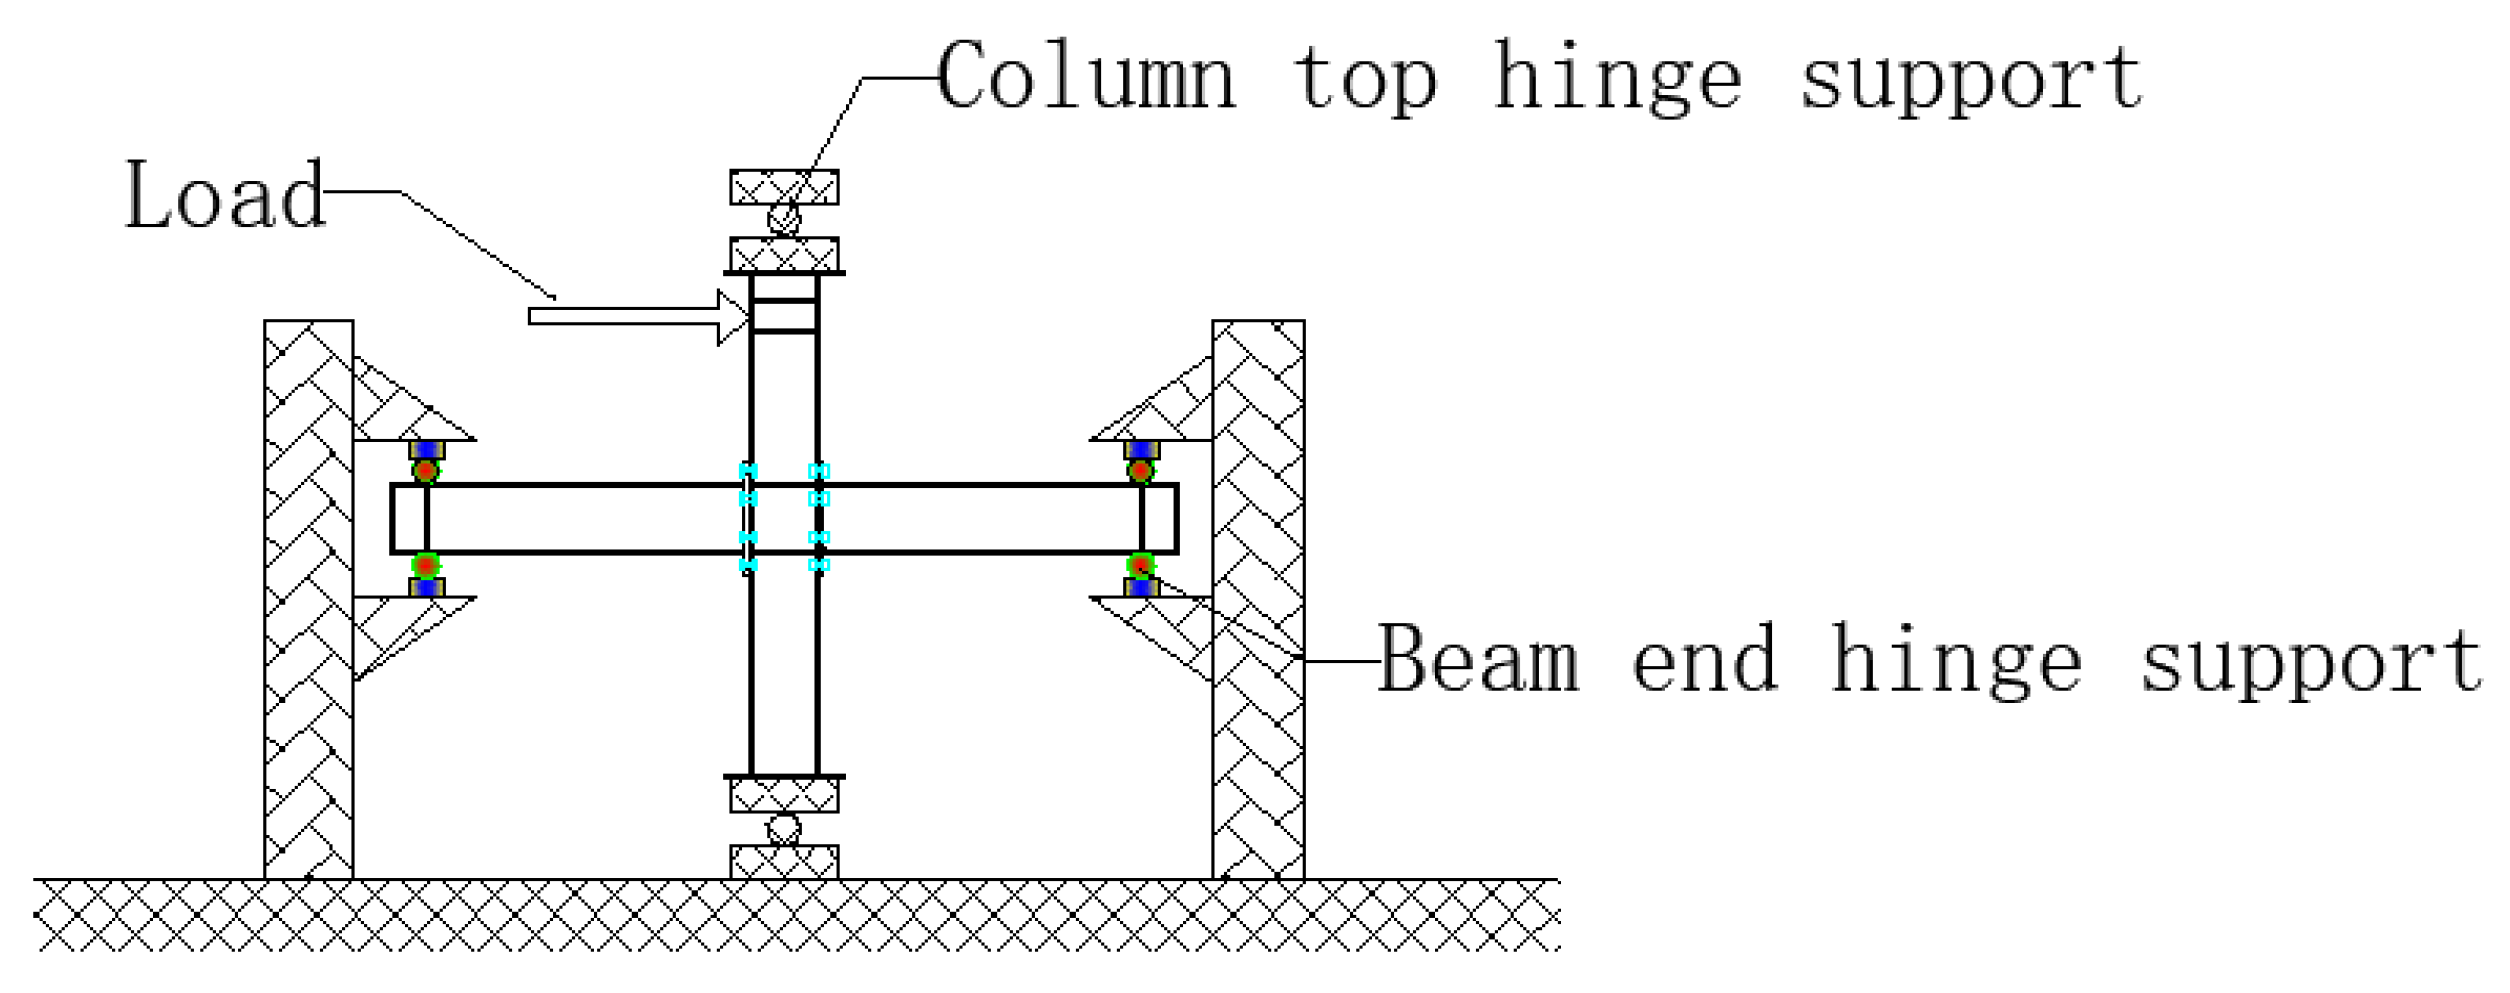
Figure 3.
Boundary conditions of the model.
Figure 3.
Boundary conditions of the model.
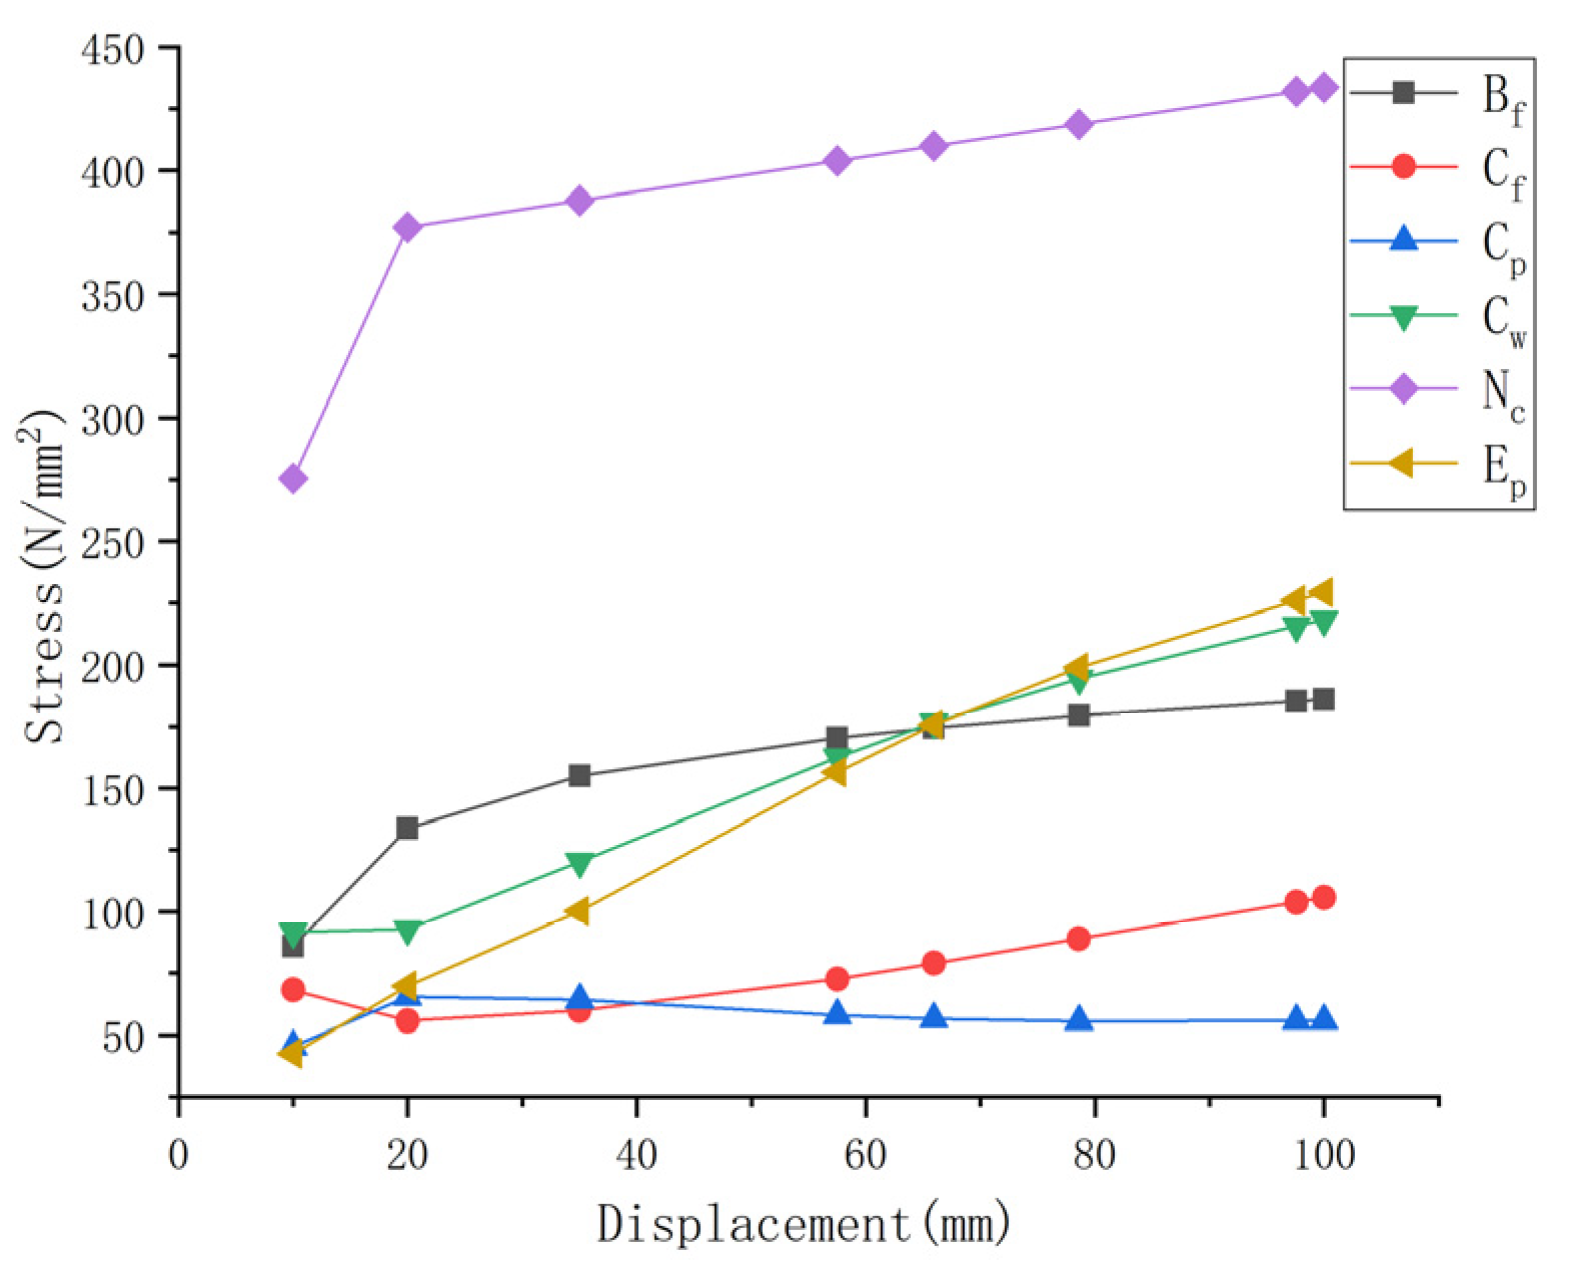
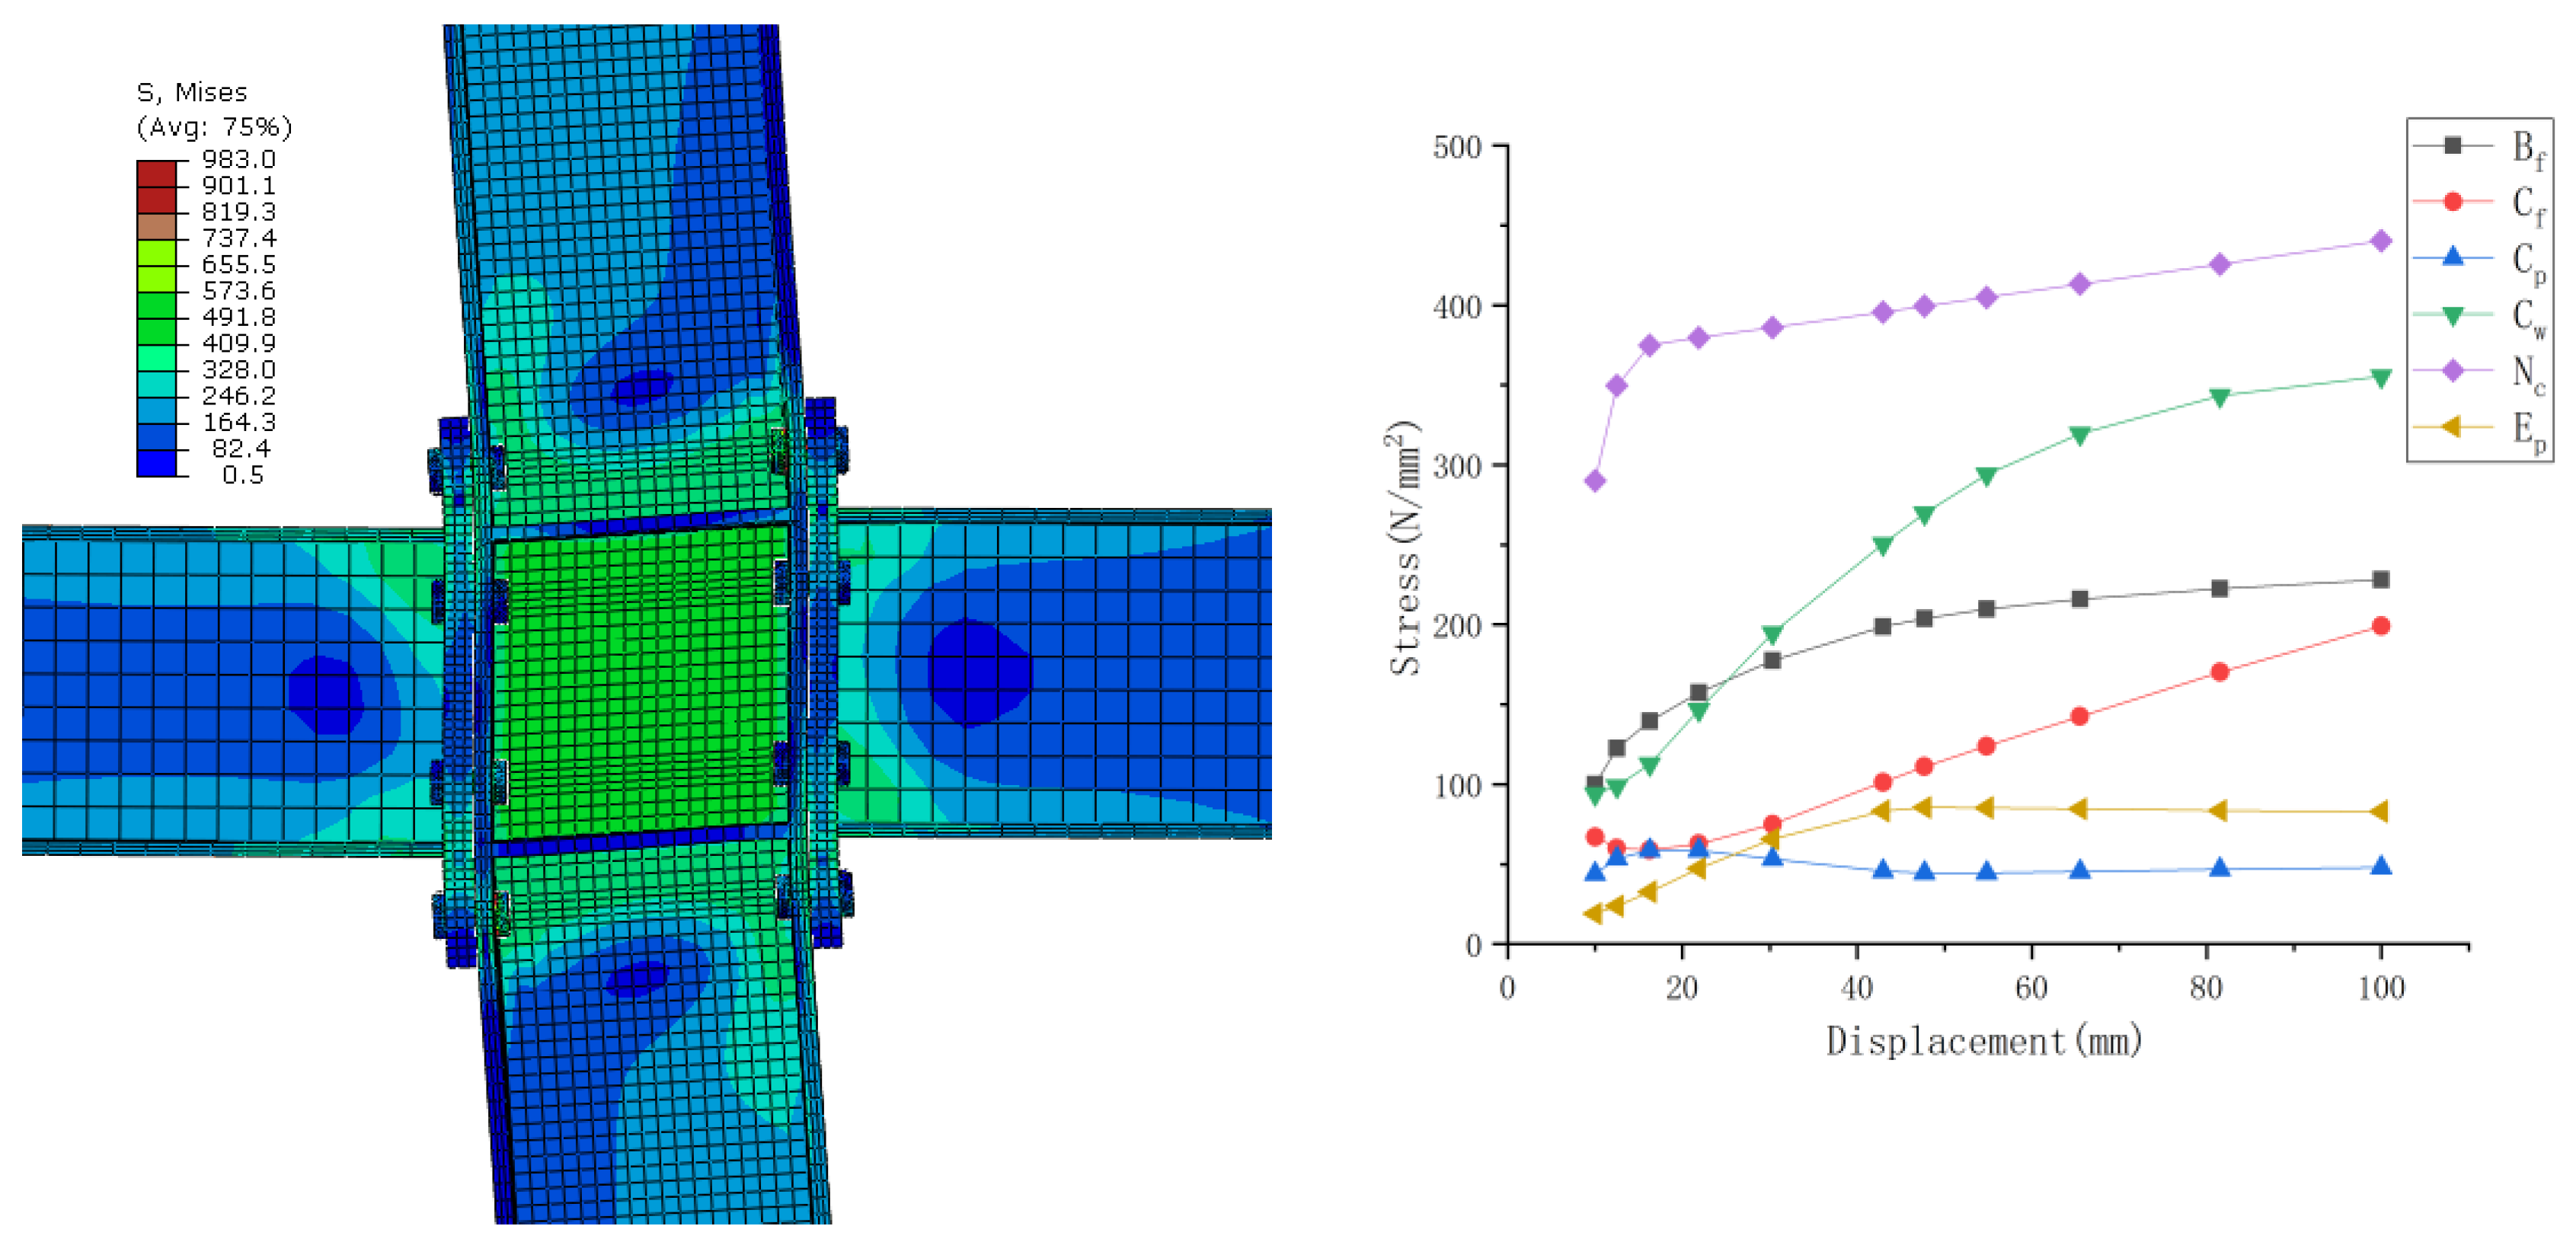
Figure 4.
Prototype stress distribution.
Figure 4.
Prototype stress distribution.
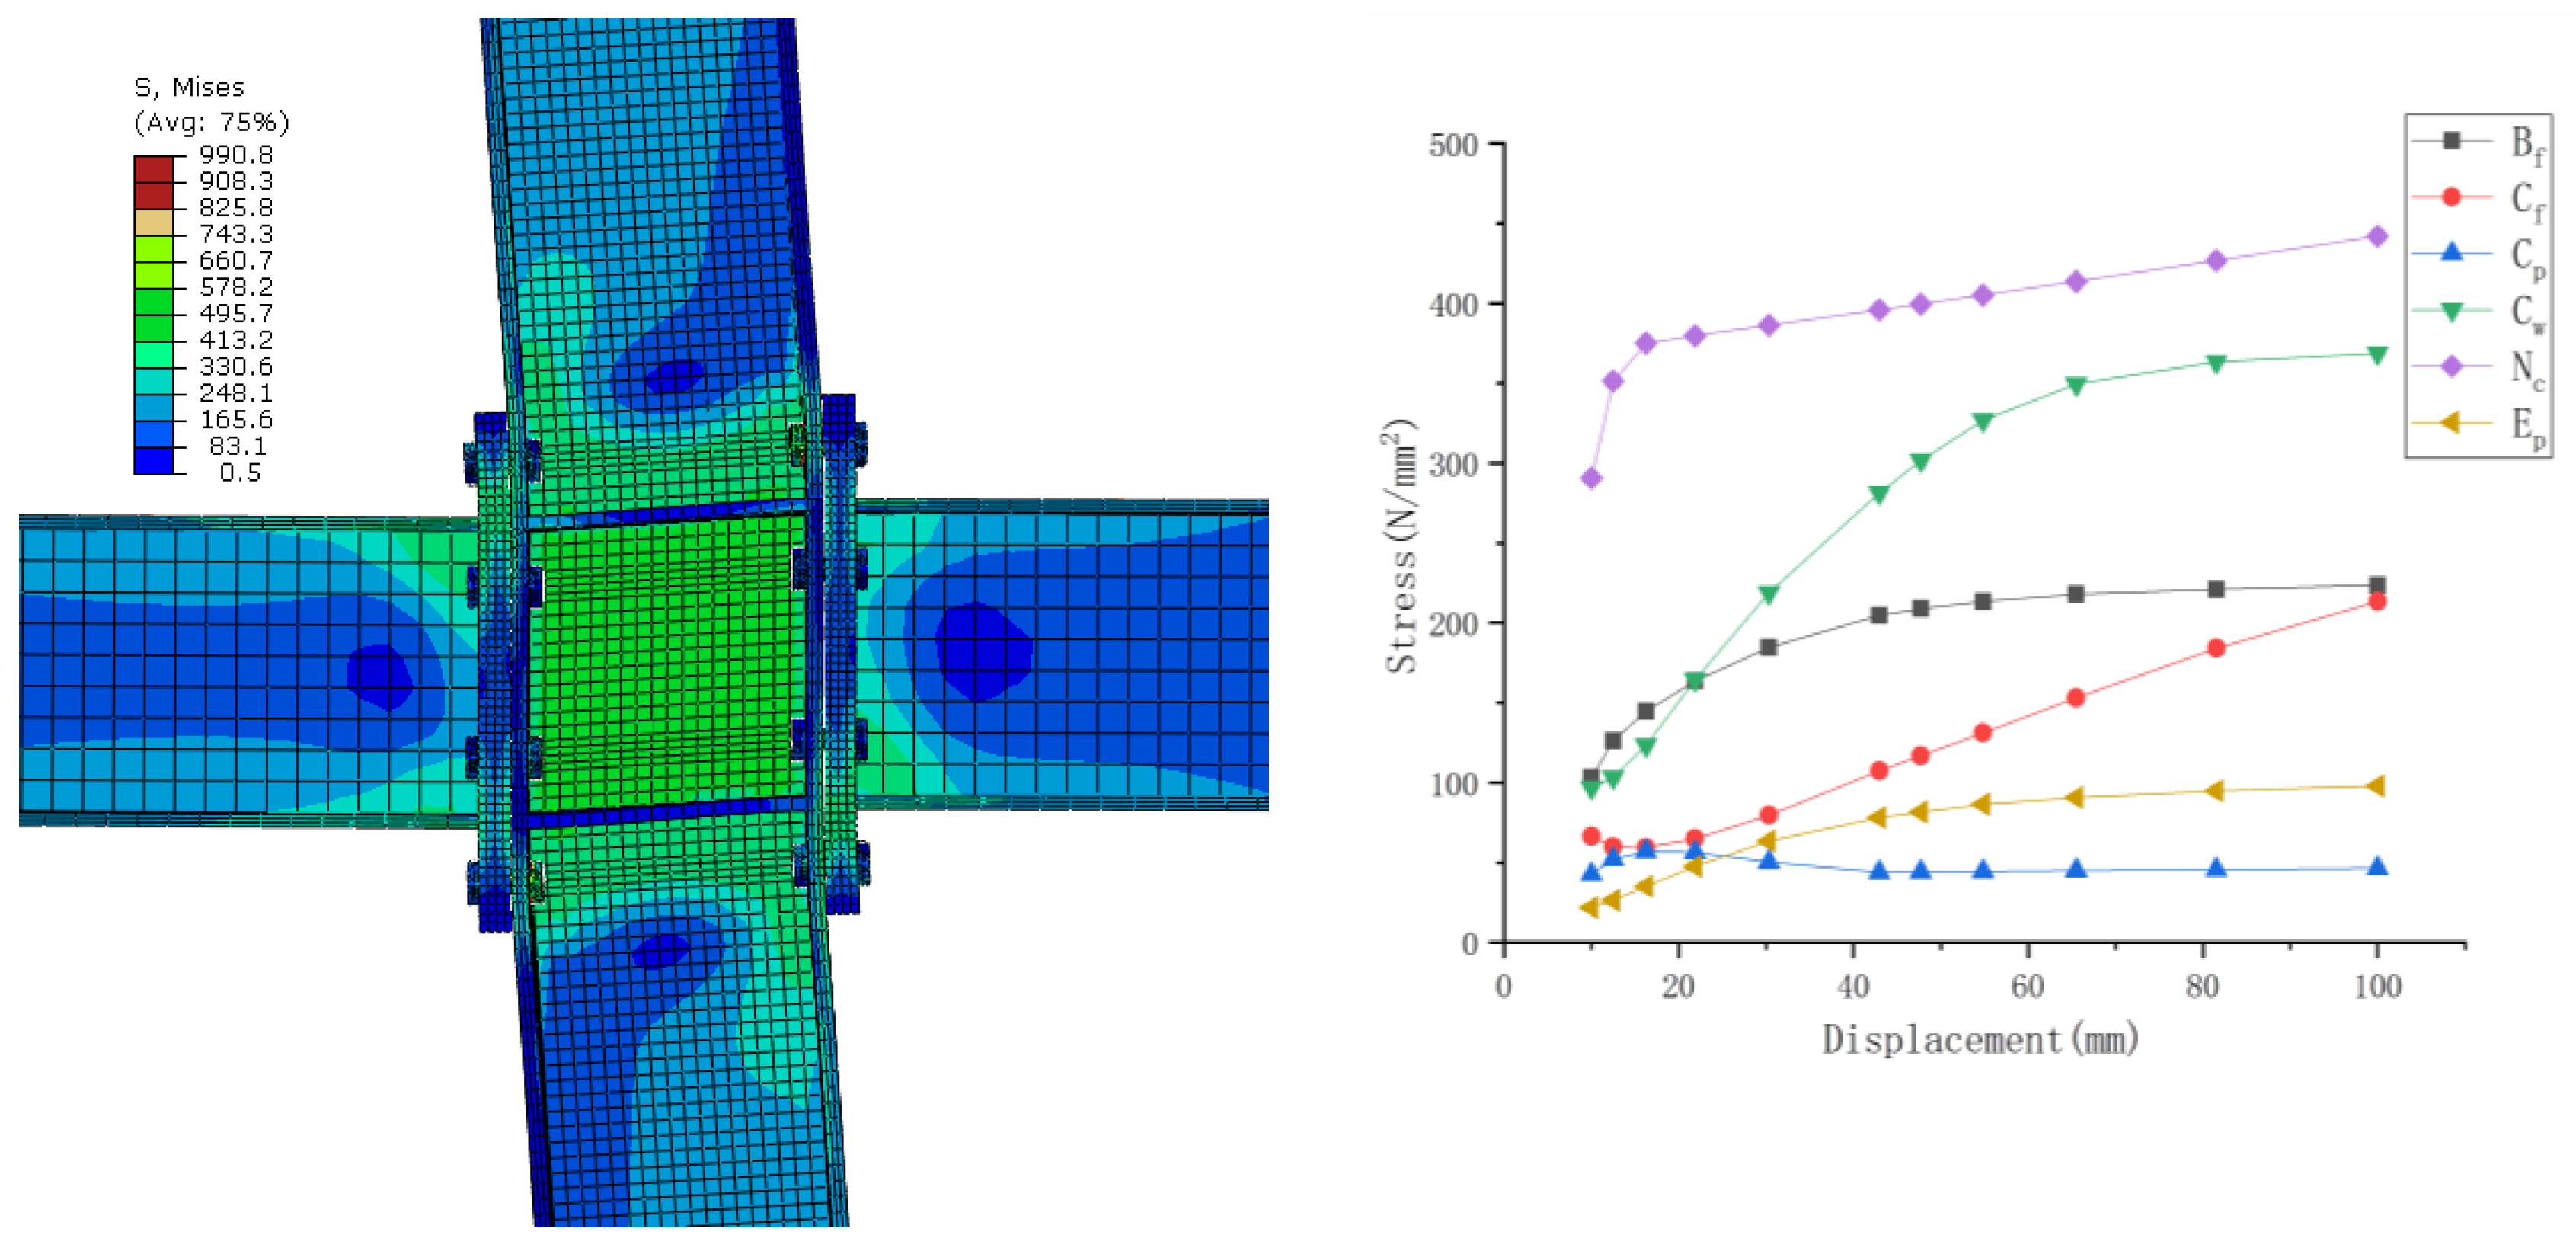
Figure 5.
Model stress distribution.
Figure 5.
Model stress distribution.
Figure 6.
Prototype stress history.
Figure 6.
Prototype stress history.
Figure 7.
Model stress history.
Figure 7.
Model stress history.
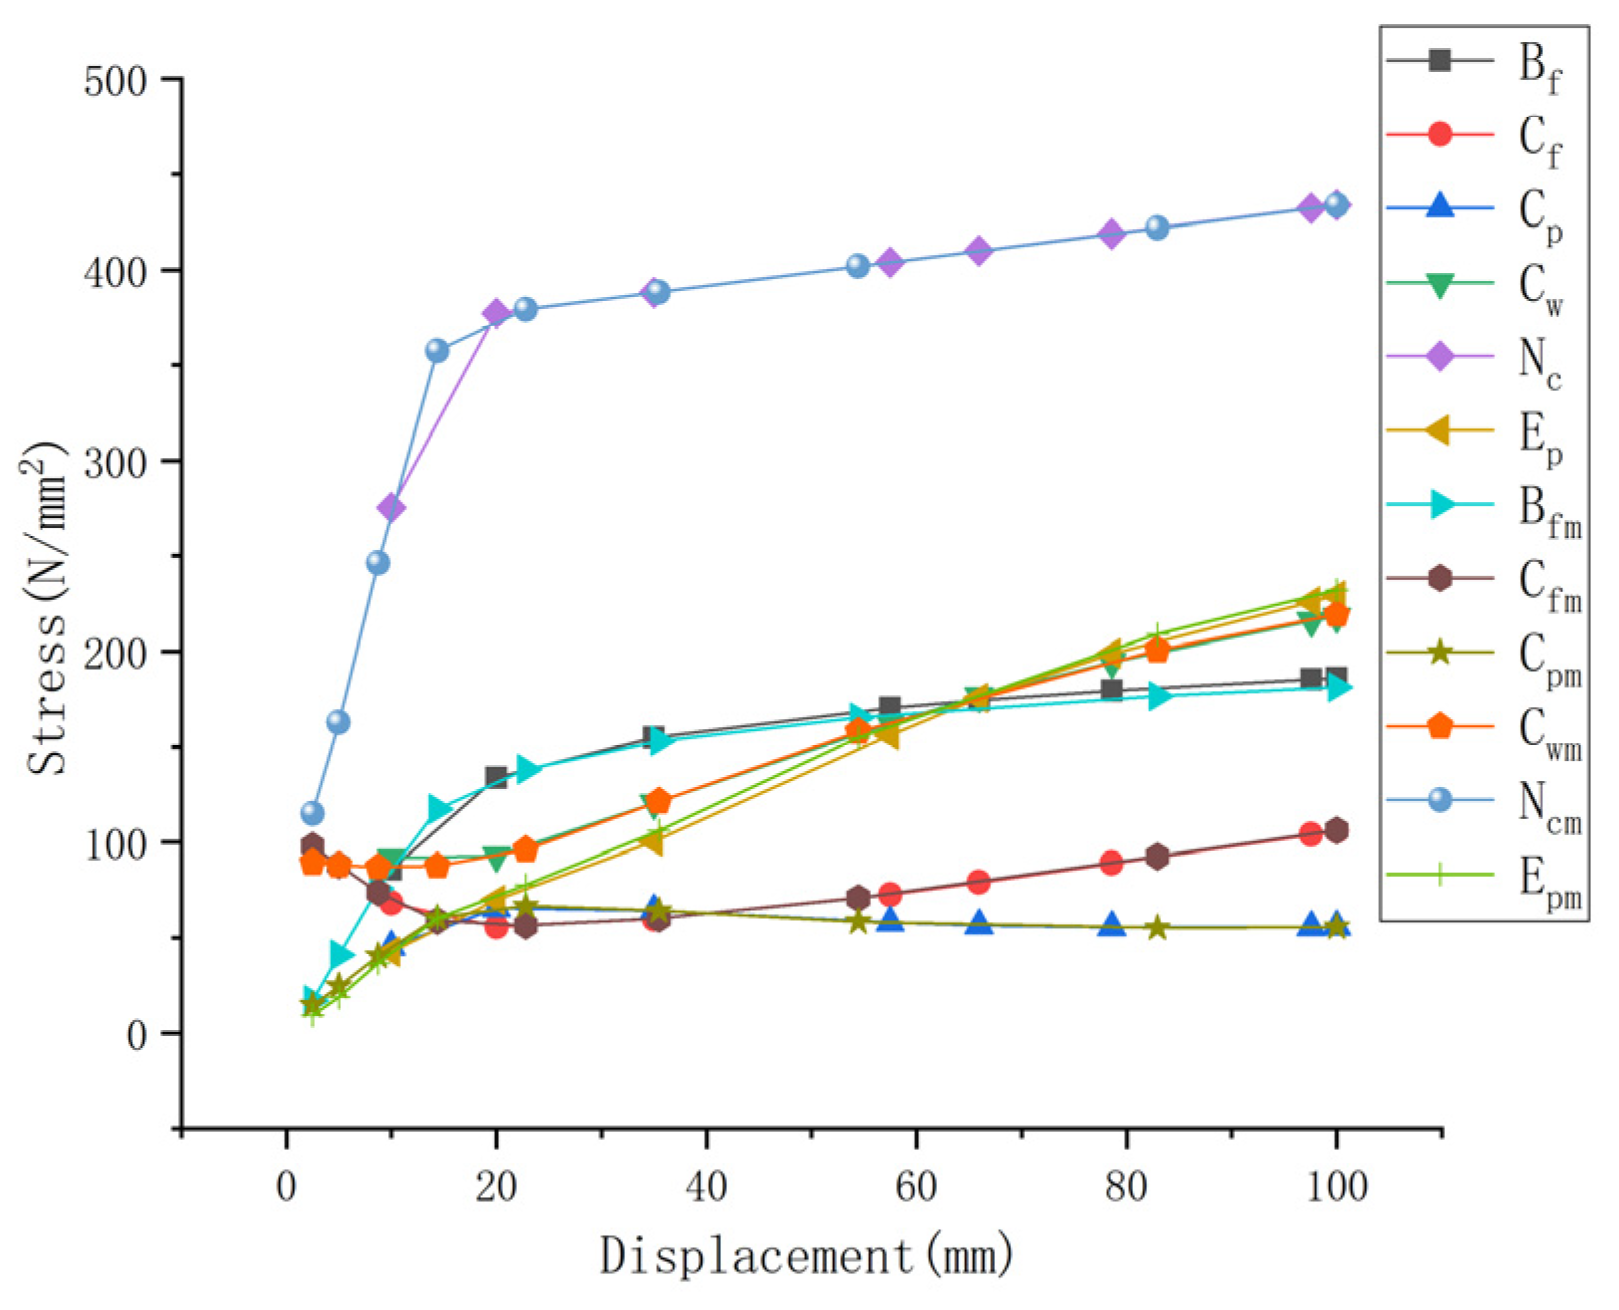
Figure 8.
Comparison of the stress history of the prototype and the model.
Figure 8.
Comparison of the stress history of the prototype and the model.
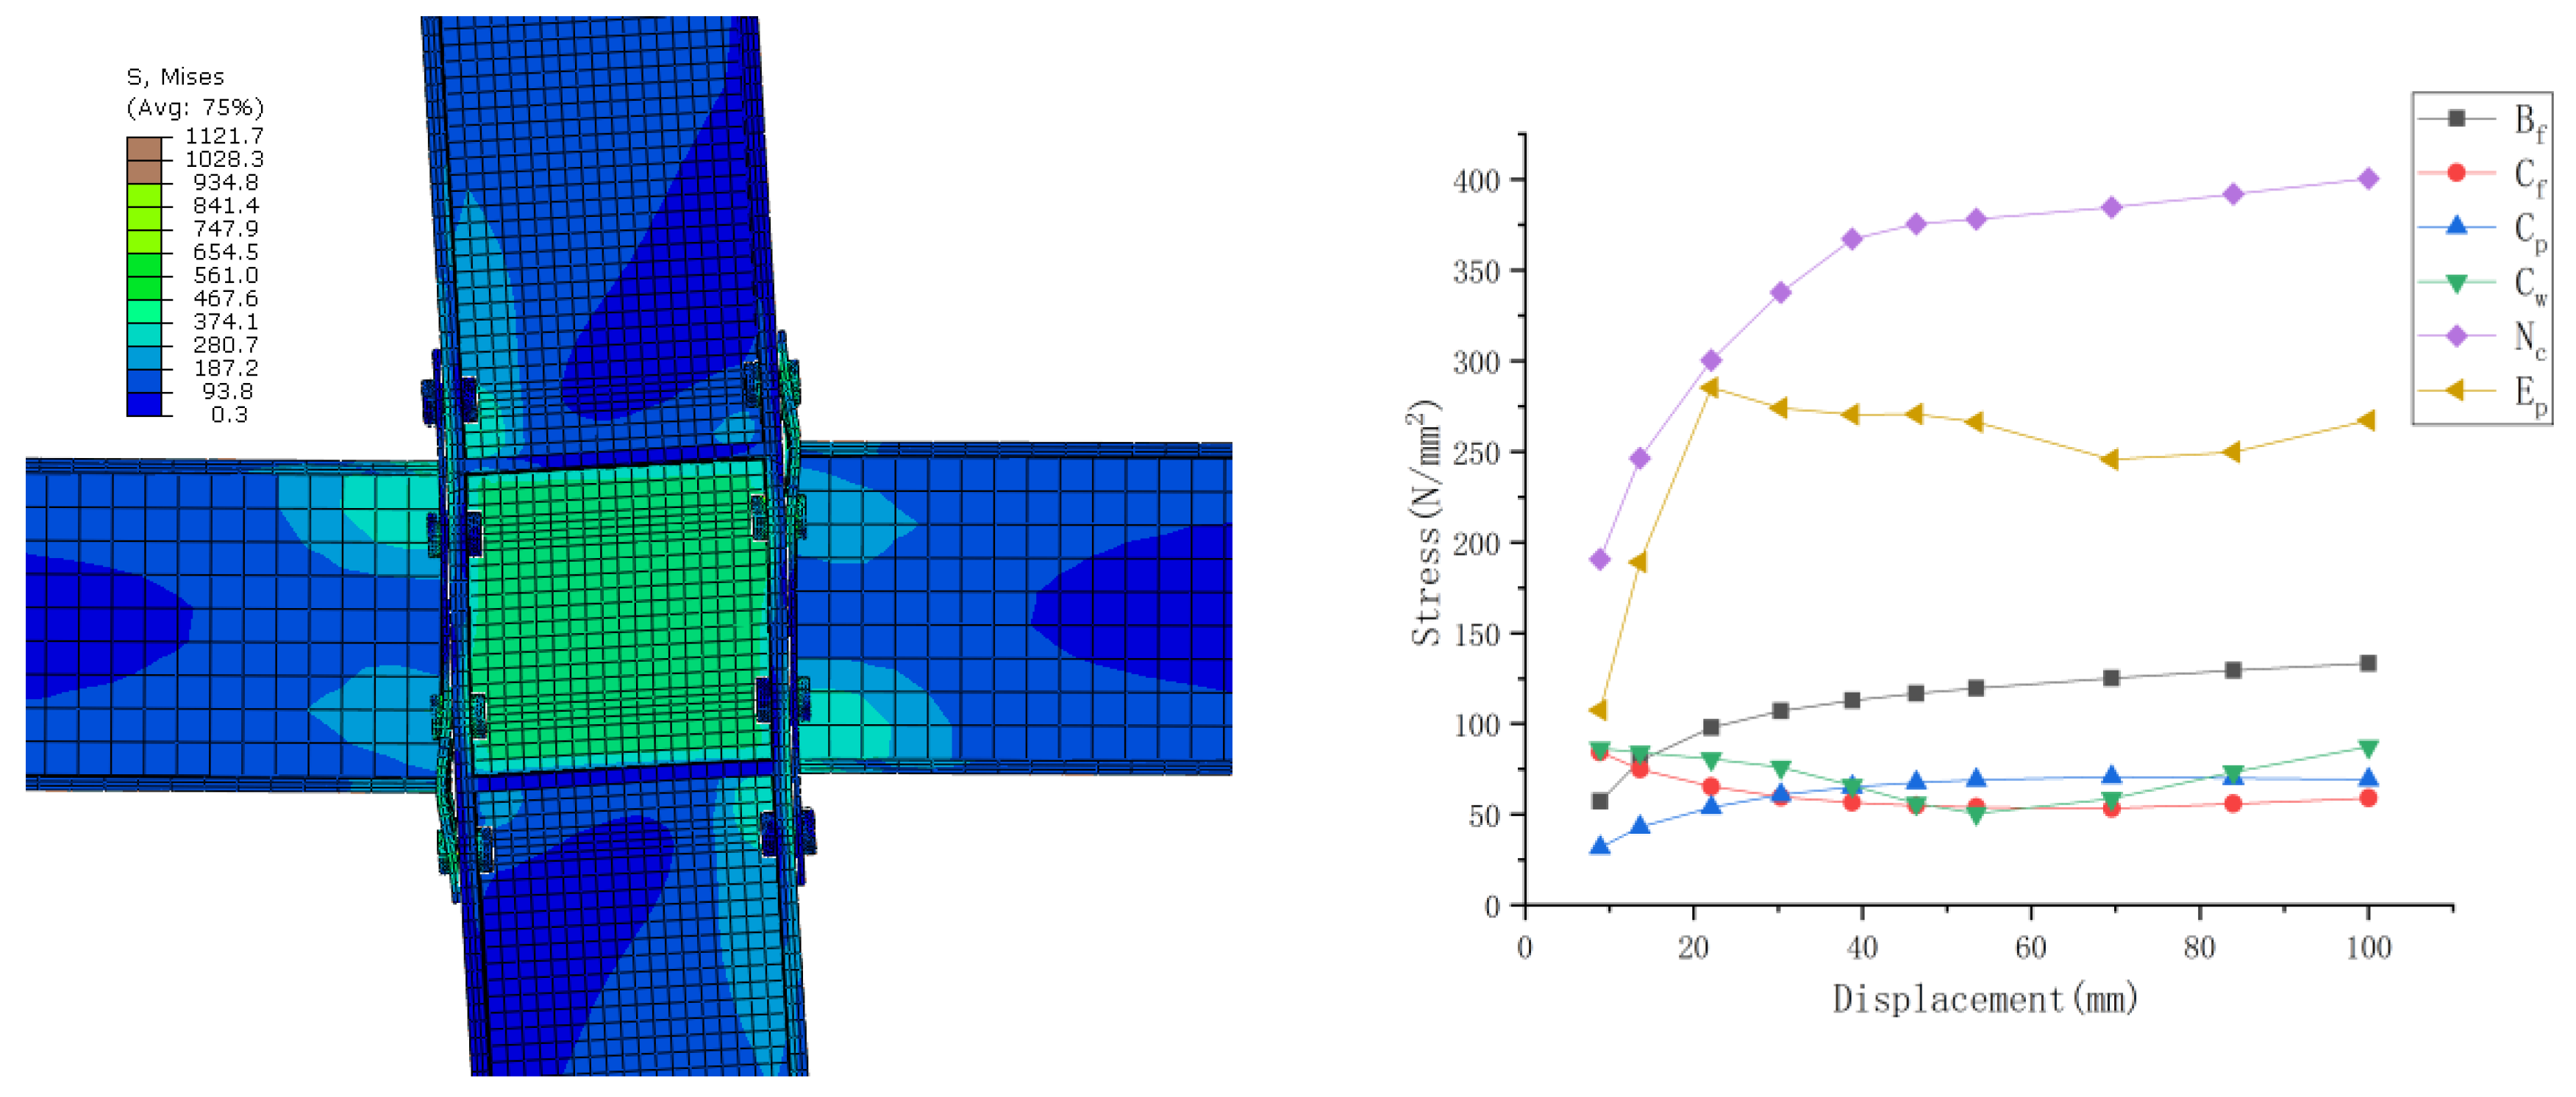
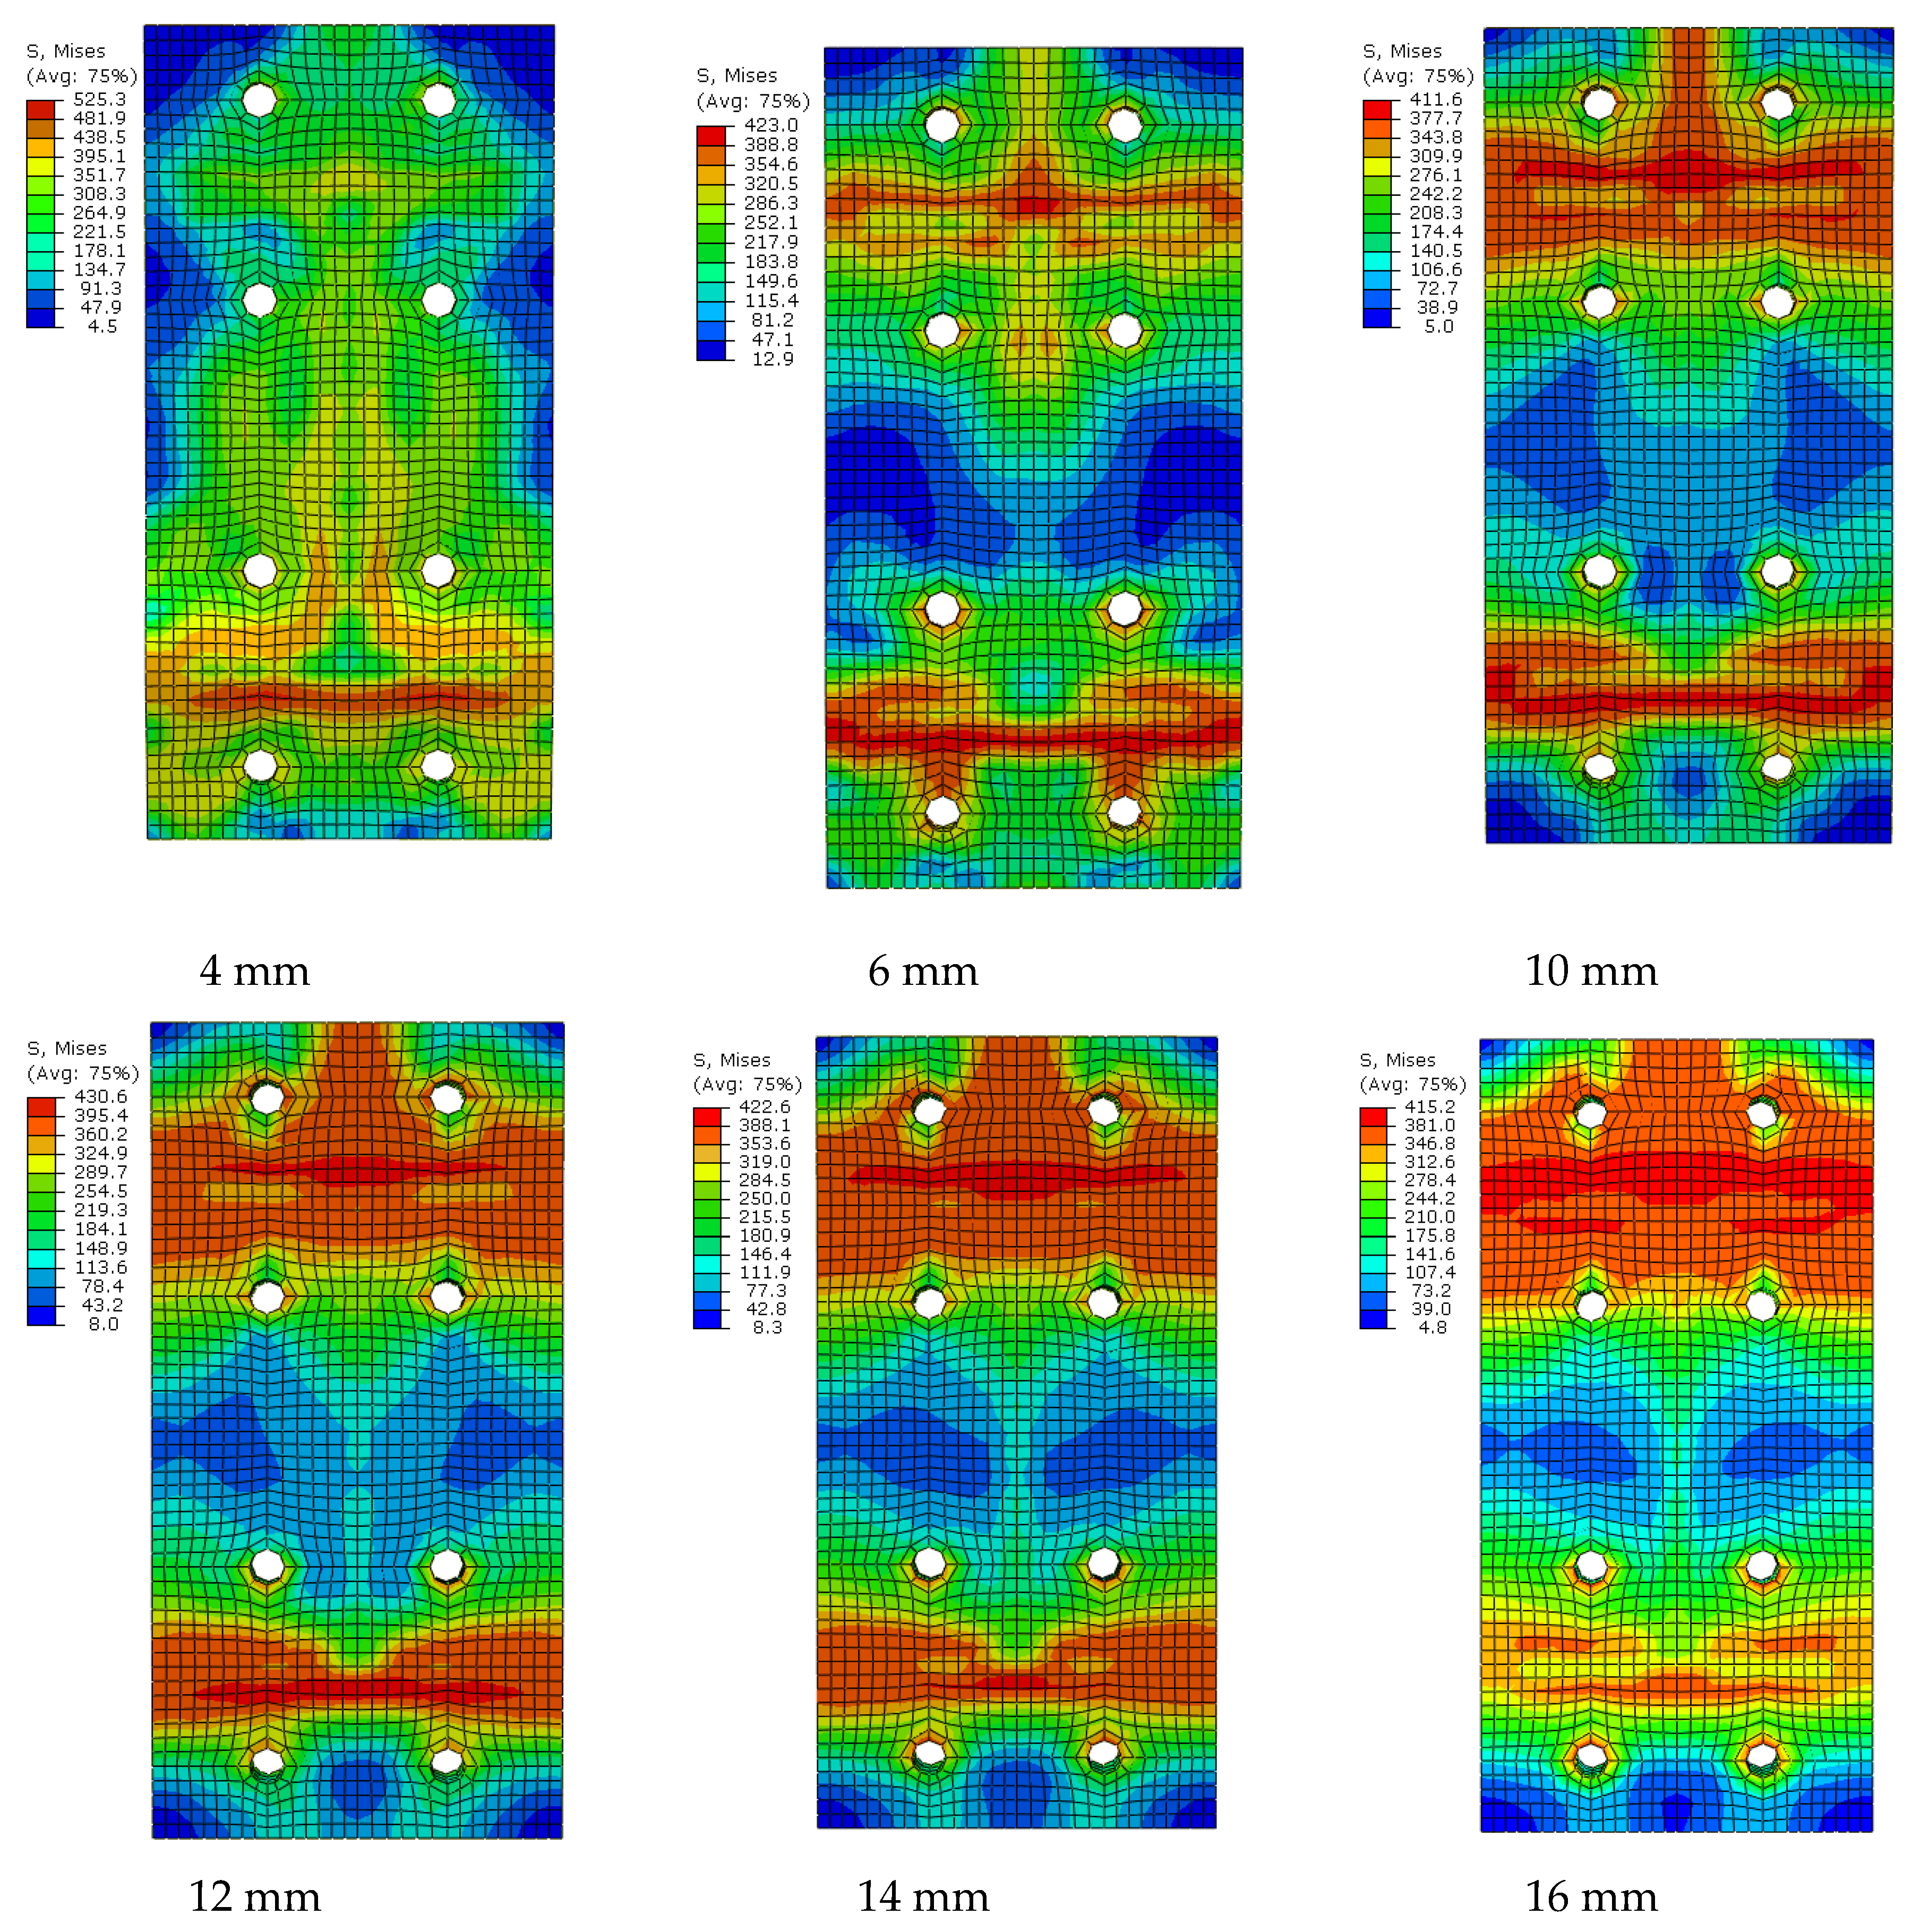
Figure 9.
Stress distribution and stress history at specified points of a 4-mm end-plate.
Figure 9.
Stress distribution and stress history at specified points of a 4-mm end-plate.
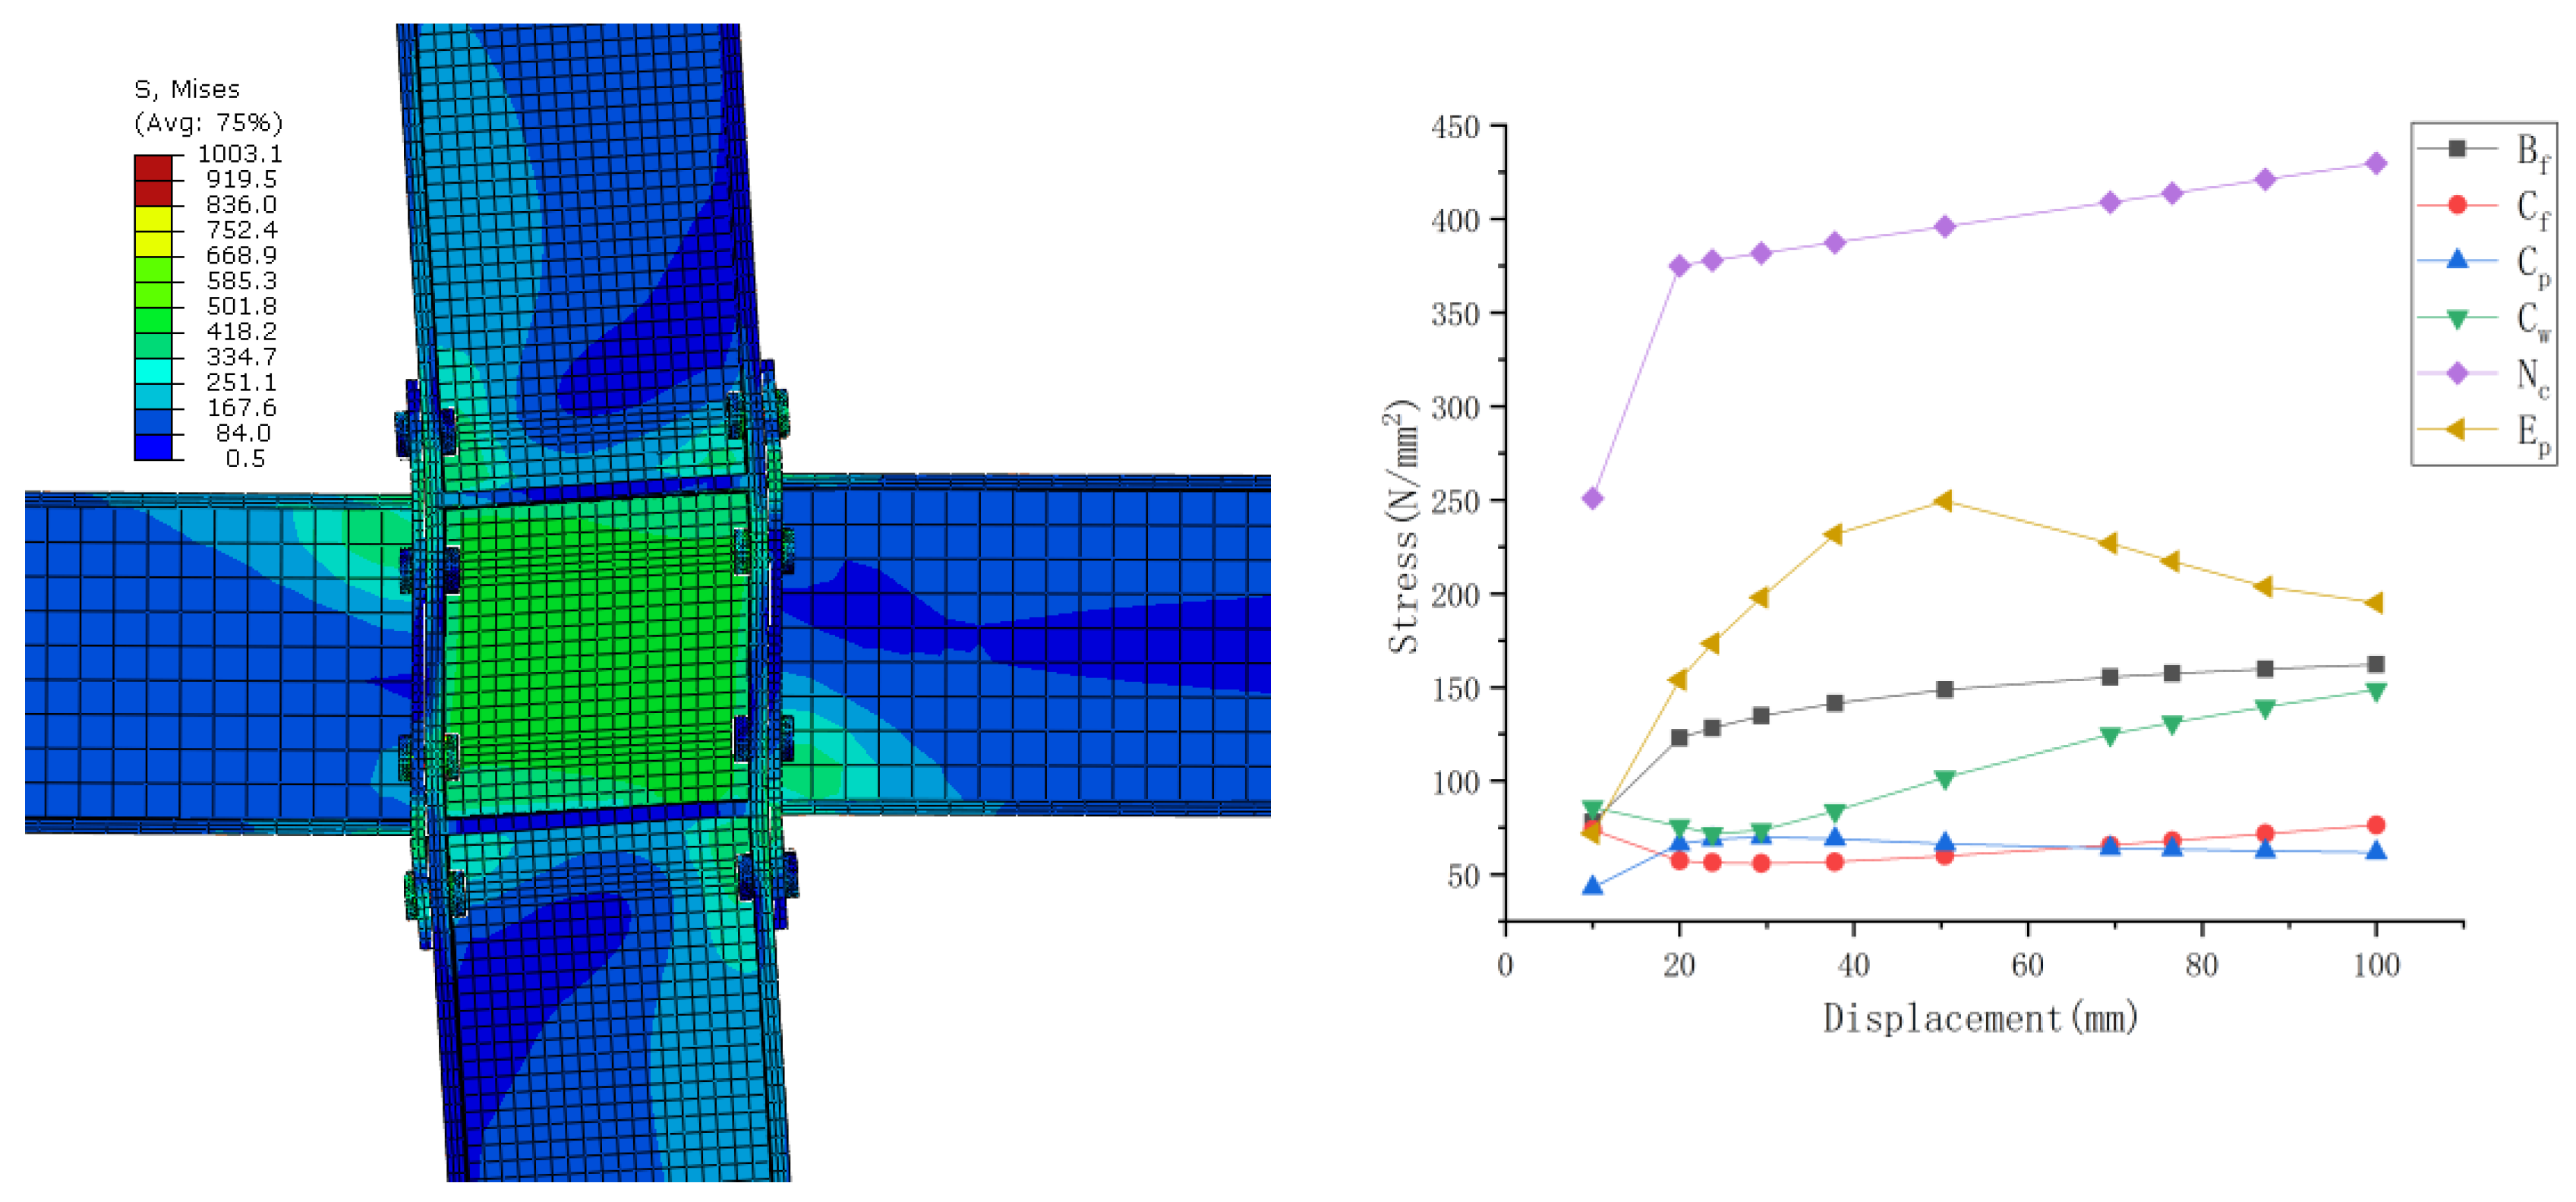
Figure 10.
Stress distribution and stress history at specified points of a 6-mm end-plate.
Figure 10.
Stress distribution and stress history at specified points of a 6-mm end-plate.
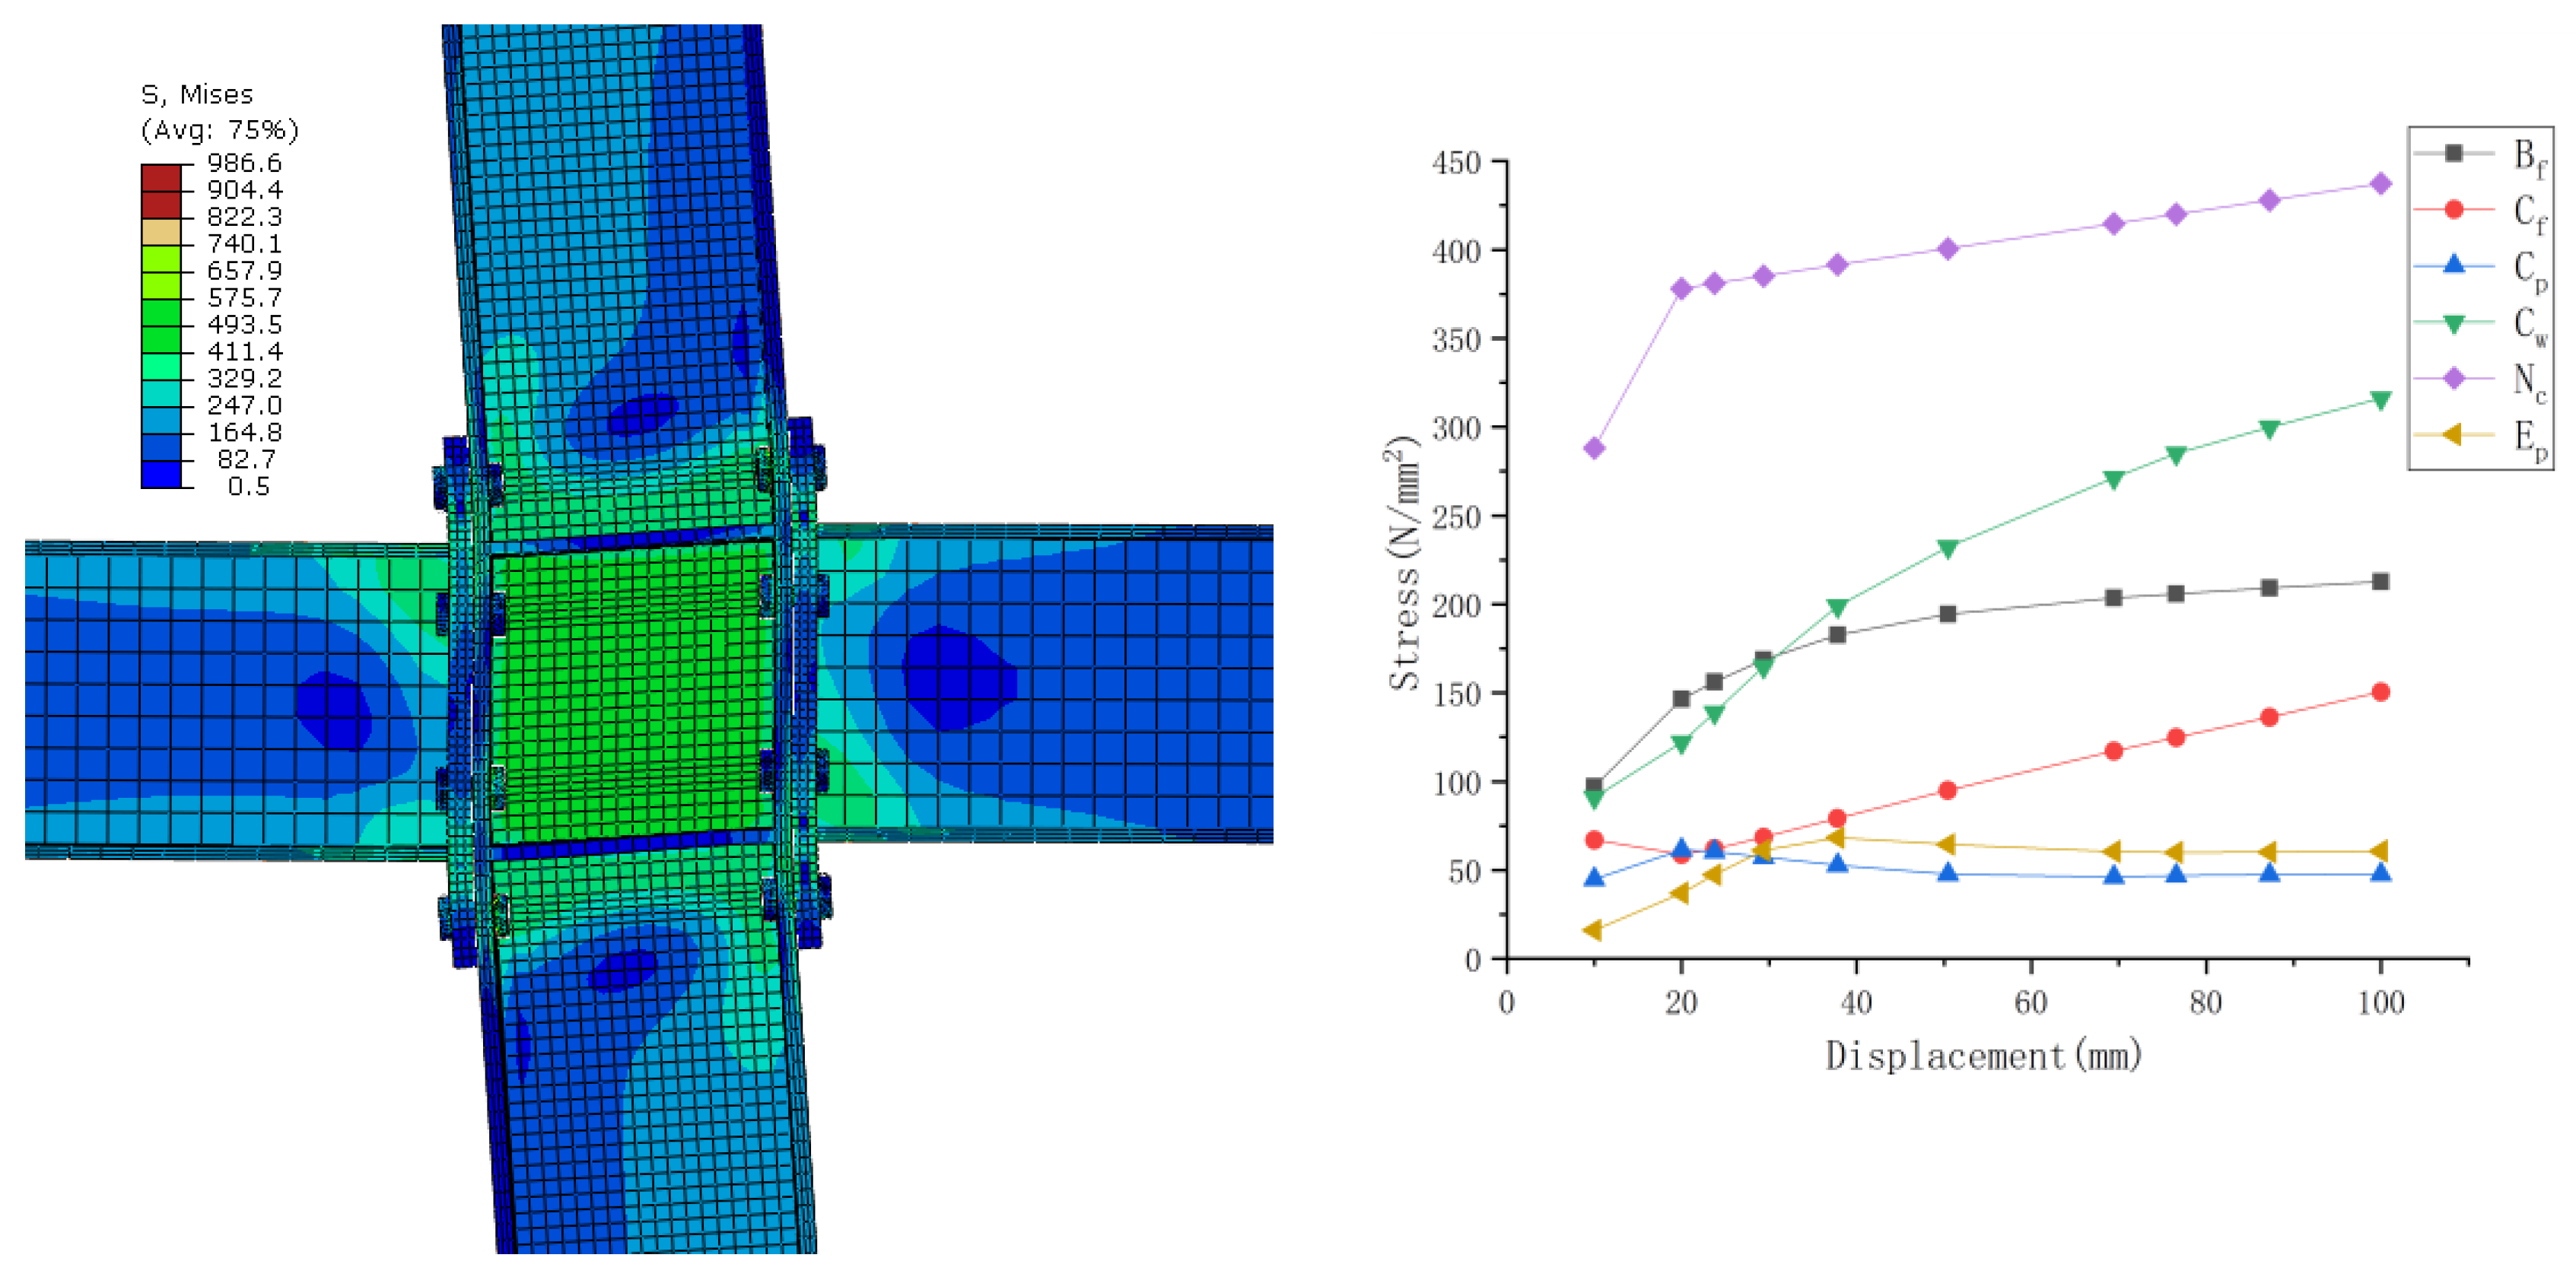
Figure 11.
Stress distribution and stress history at specified points of a 10-mm end-plate.
Figure 11.
Stress distribution and stress history at specified points of a 10-mm end-plate.
Figure 12.
Stress distribution and stress history at specified points of a 12-mm end-plate.
Figure 12.
Stress distribution and stress history at specified points of a 12-mm end-plate.
Figure 13.
Stress distribution and stress history at specified points of a 14-mm end-plate.
Figure 13.
Stress distribution and stress history at specified points of a 14-mm end-plate.
Figure 14.
Stress distribution and stress history at specified points of a 16-mm end-plate.
Figure 14.
Stress distribution and stress history at specified points of a 16-mm end-plate.
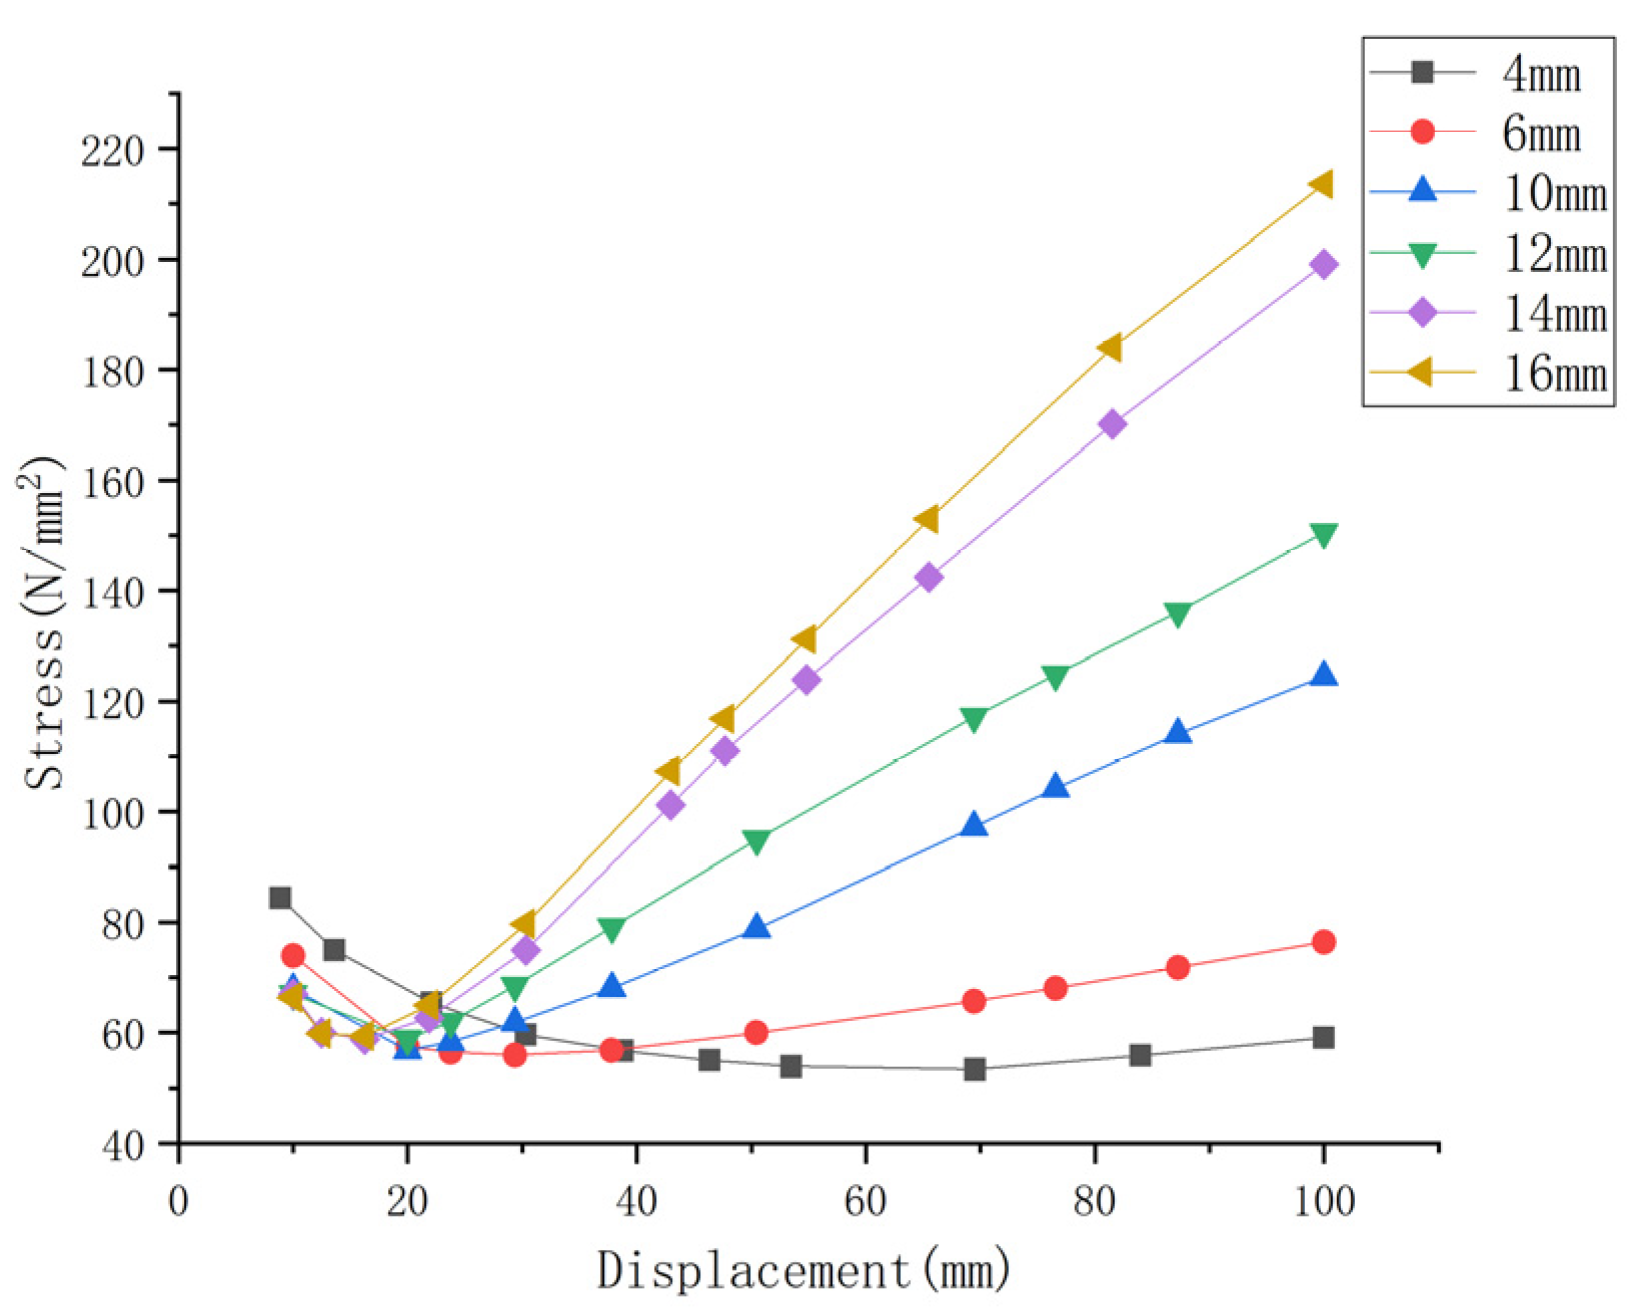
Figure 15.
Stress history at Bf.
Figure 15.
Stress history at Bf.
Figure 16.
Stress history at Cf.
Figure 16.
Stress history at Cf.
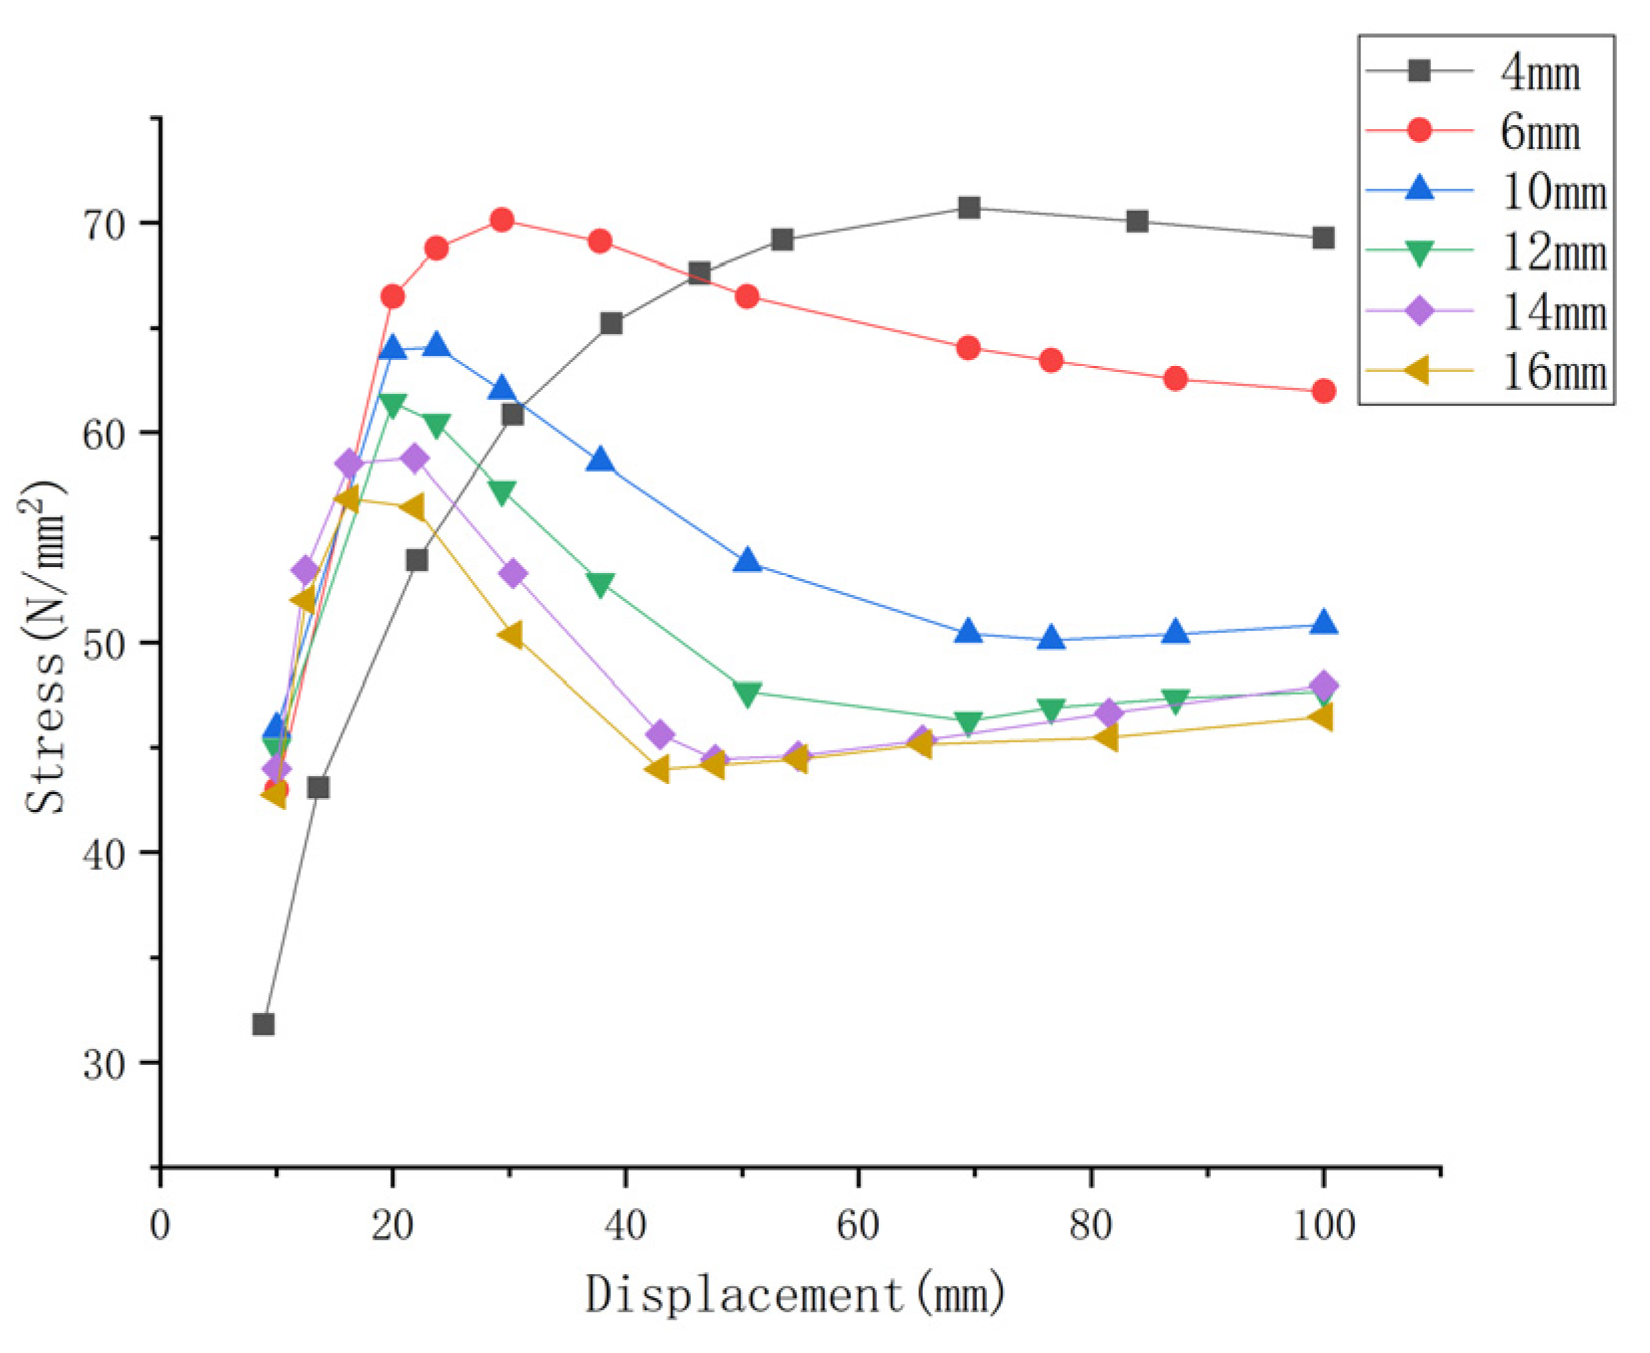
Figure 17.
Stress history at Cp.
Figure 17.
Stress history at Cp.
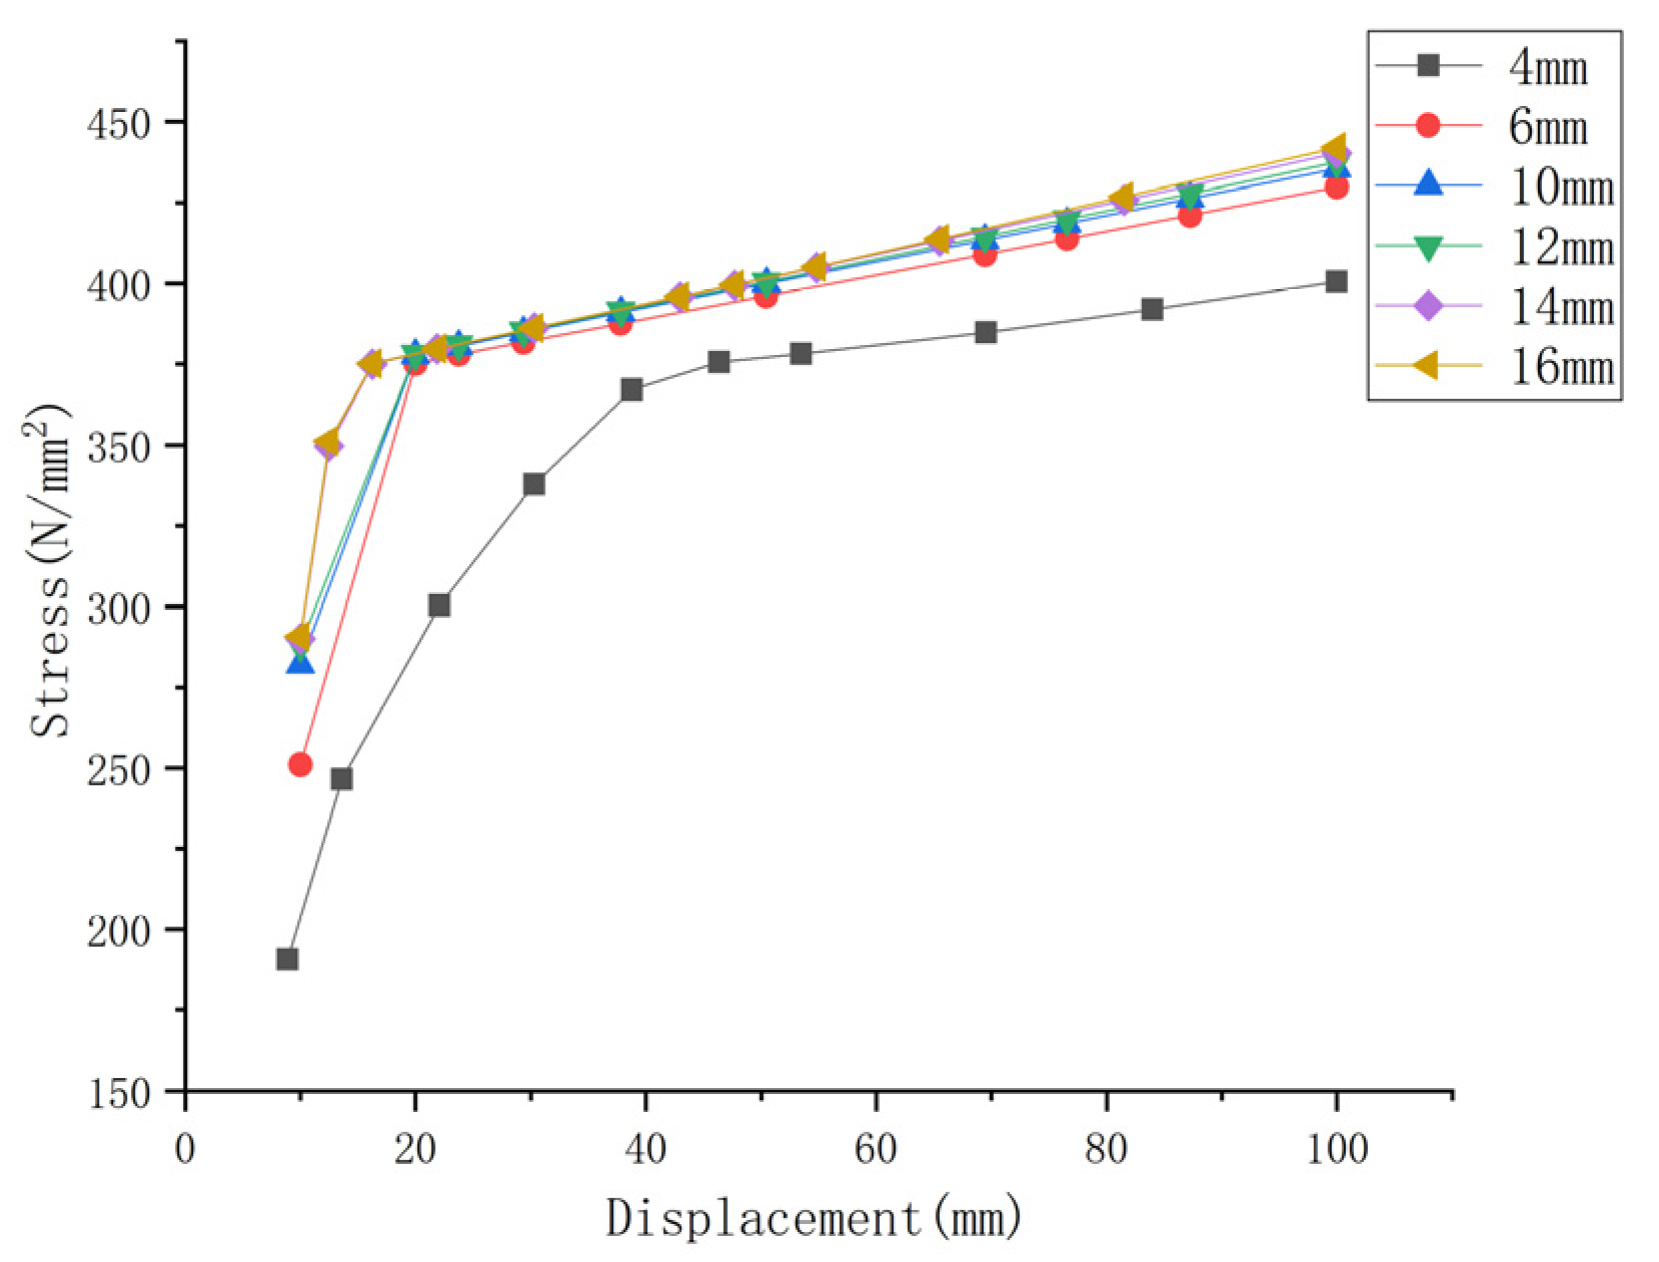
Figure 18.
Stress history at Cw.
Figure 18.
Stress history at Cw.
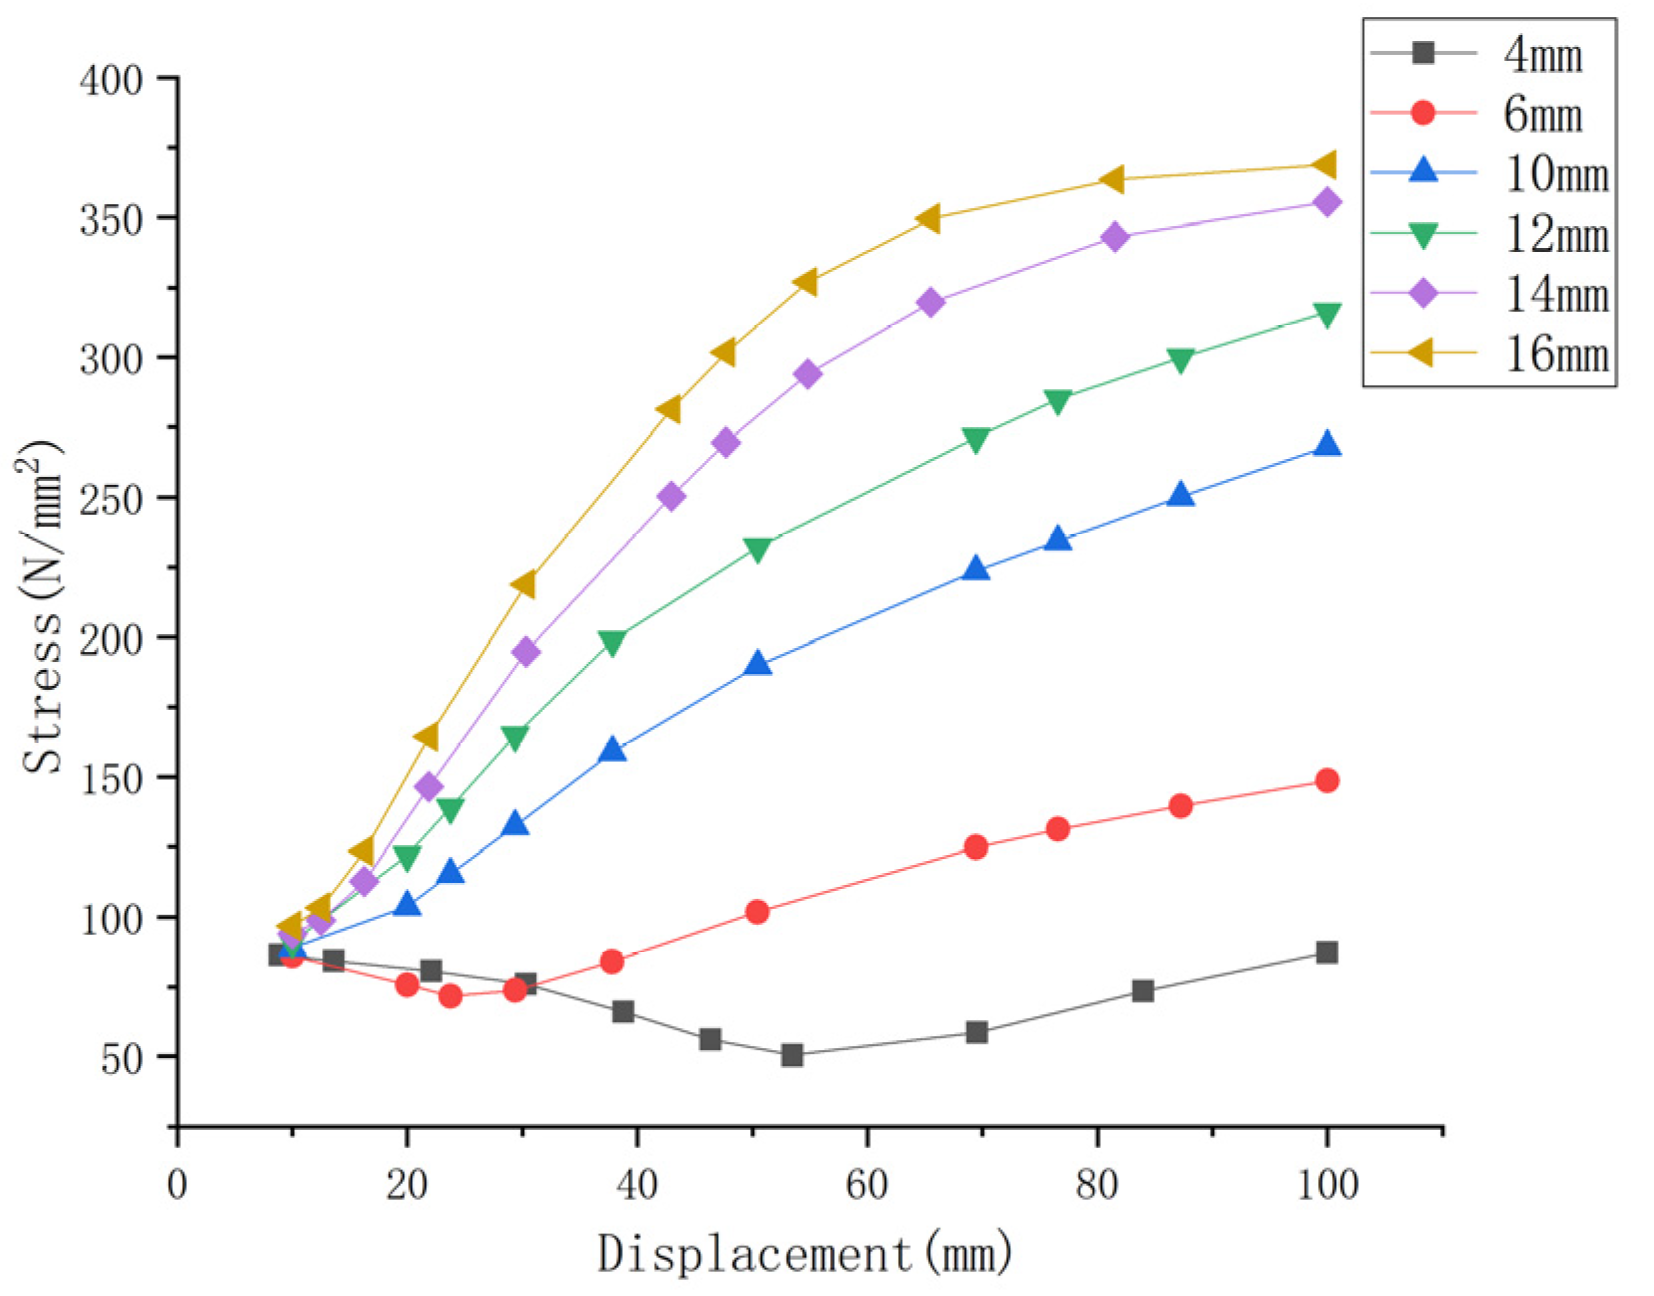
Figure 19.
Stress history at Nc.
Figure 19.
Stress history at Nc.
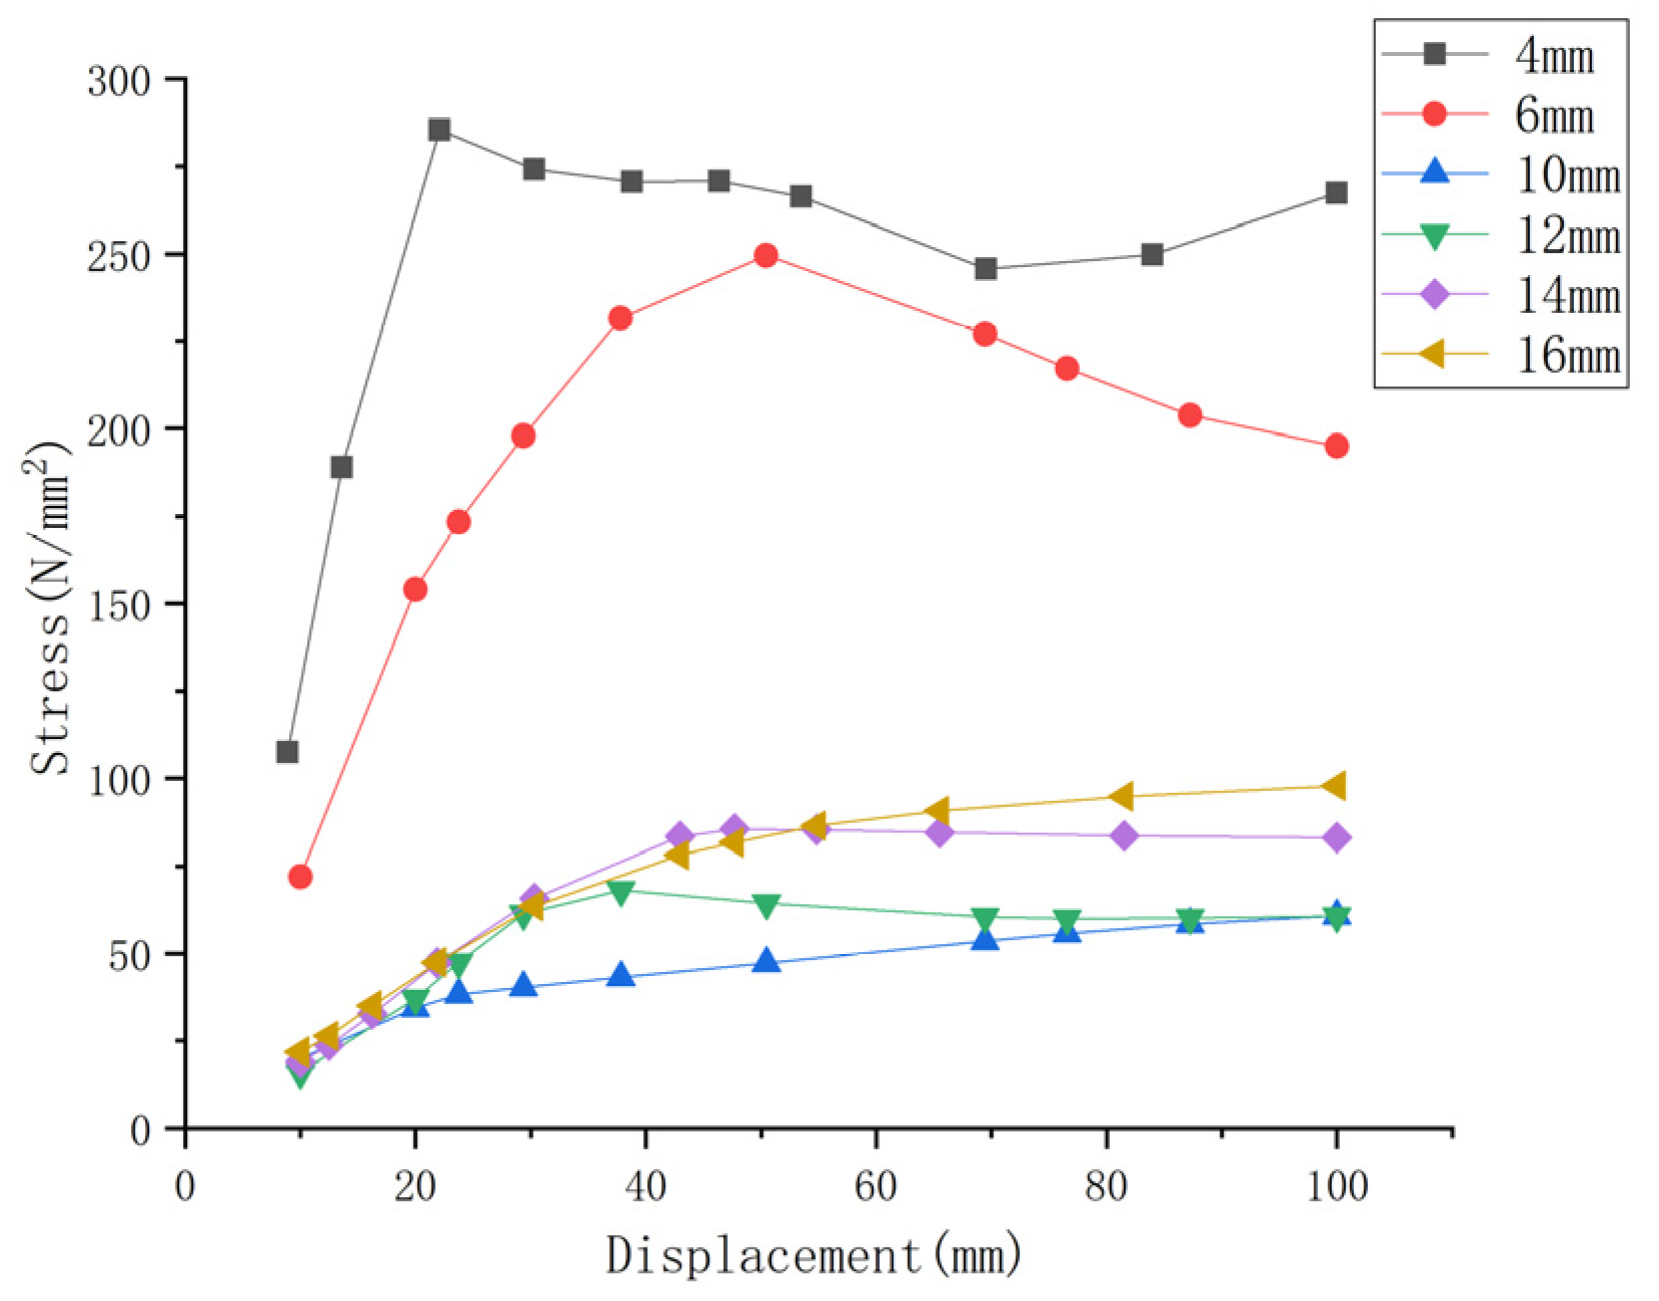
Figure 20.
Stress history at Ep.
Figure 20.
Stress history at Ep.
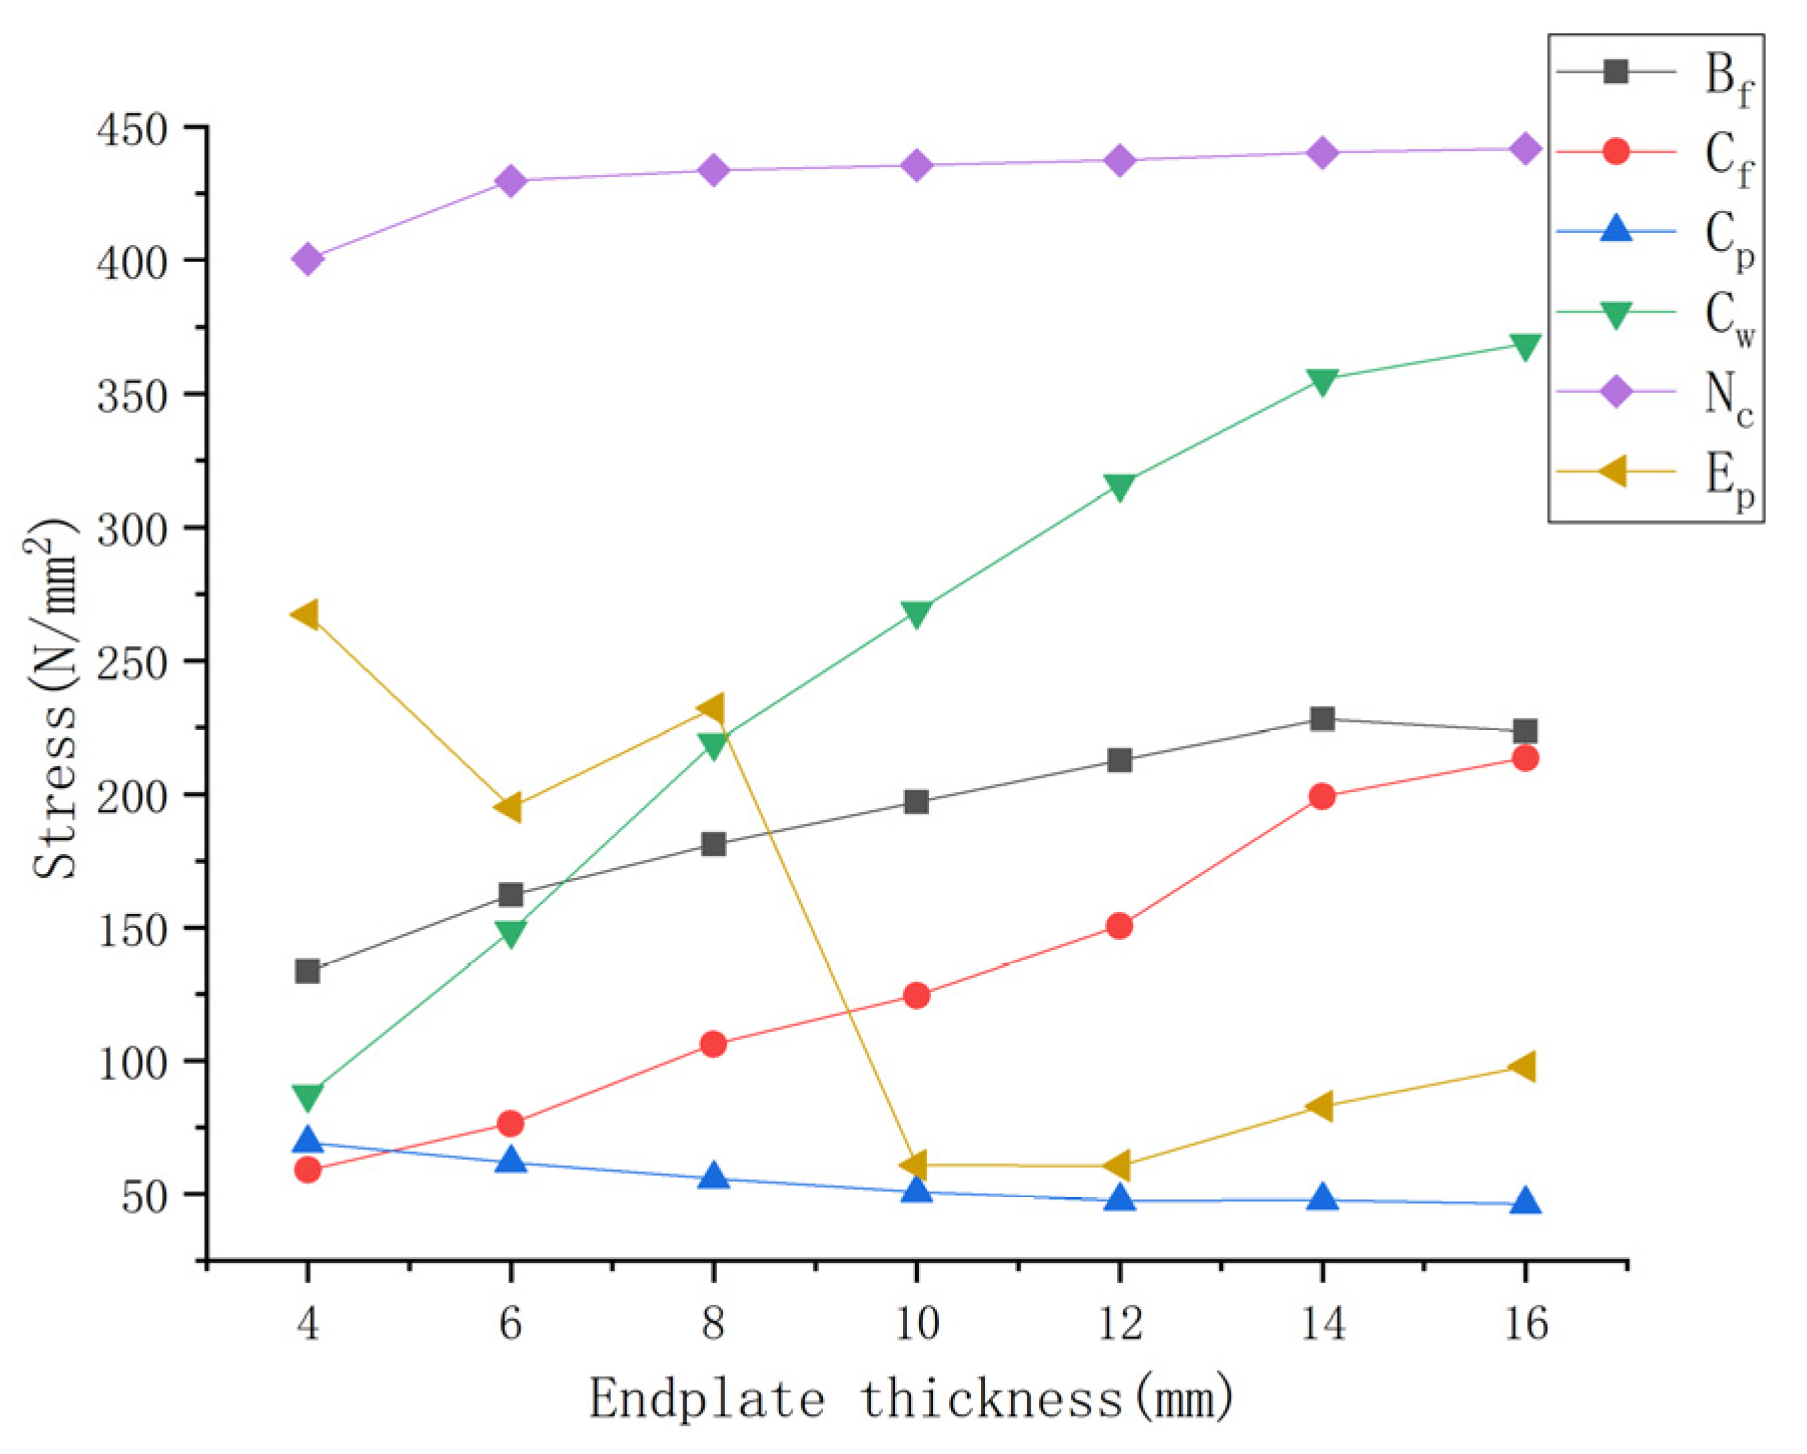
Figure 21.
Comparison of stress history at specified points.
Figure 21.
Comparison of stress history at specified points.
Figure 22.
Stress distribution of the end-plate.
Figure 22.
Stress distribution of the end-plate.
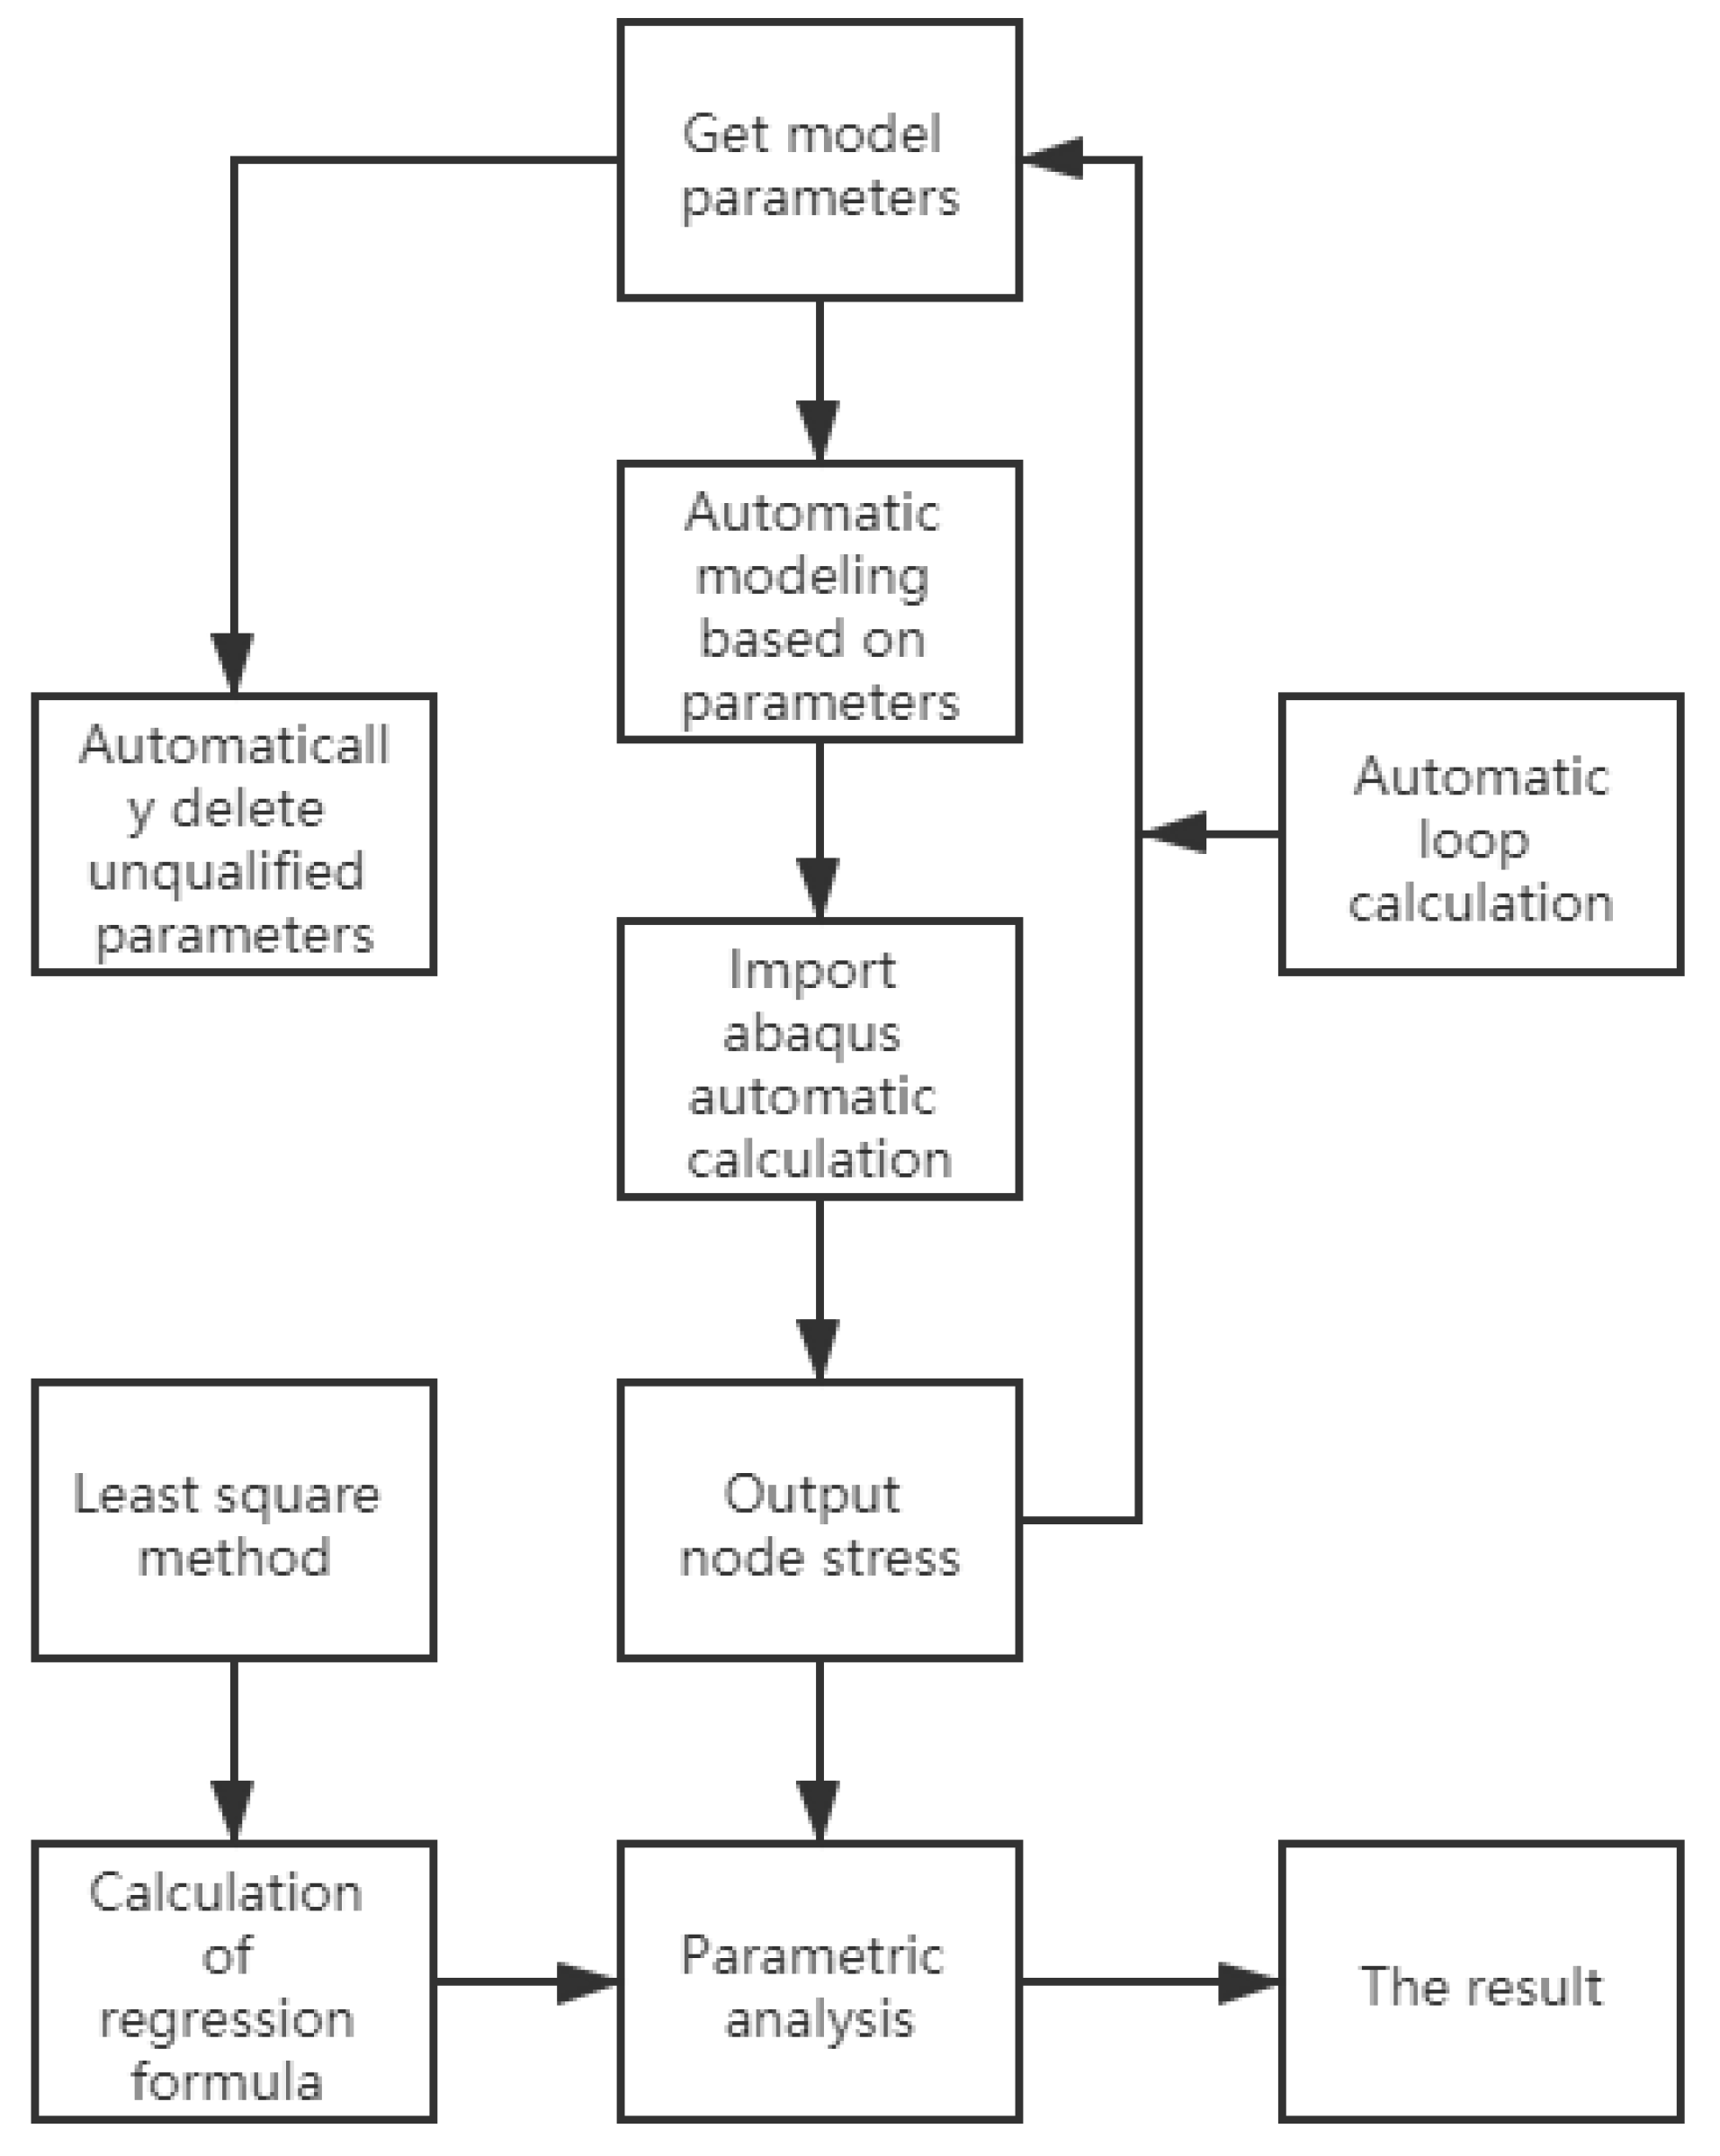
Figure 23.
Analysis flow chart.
Figure 23.
Analysis flow chart.
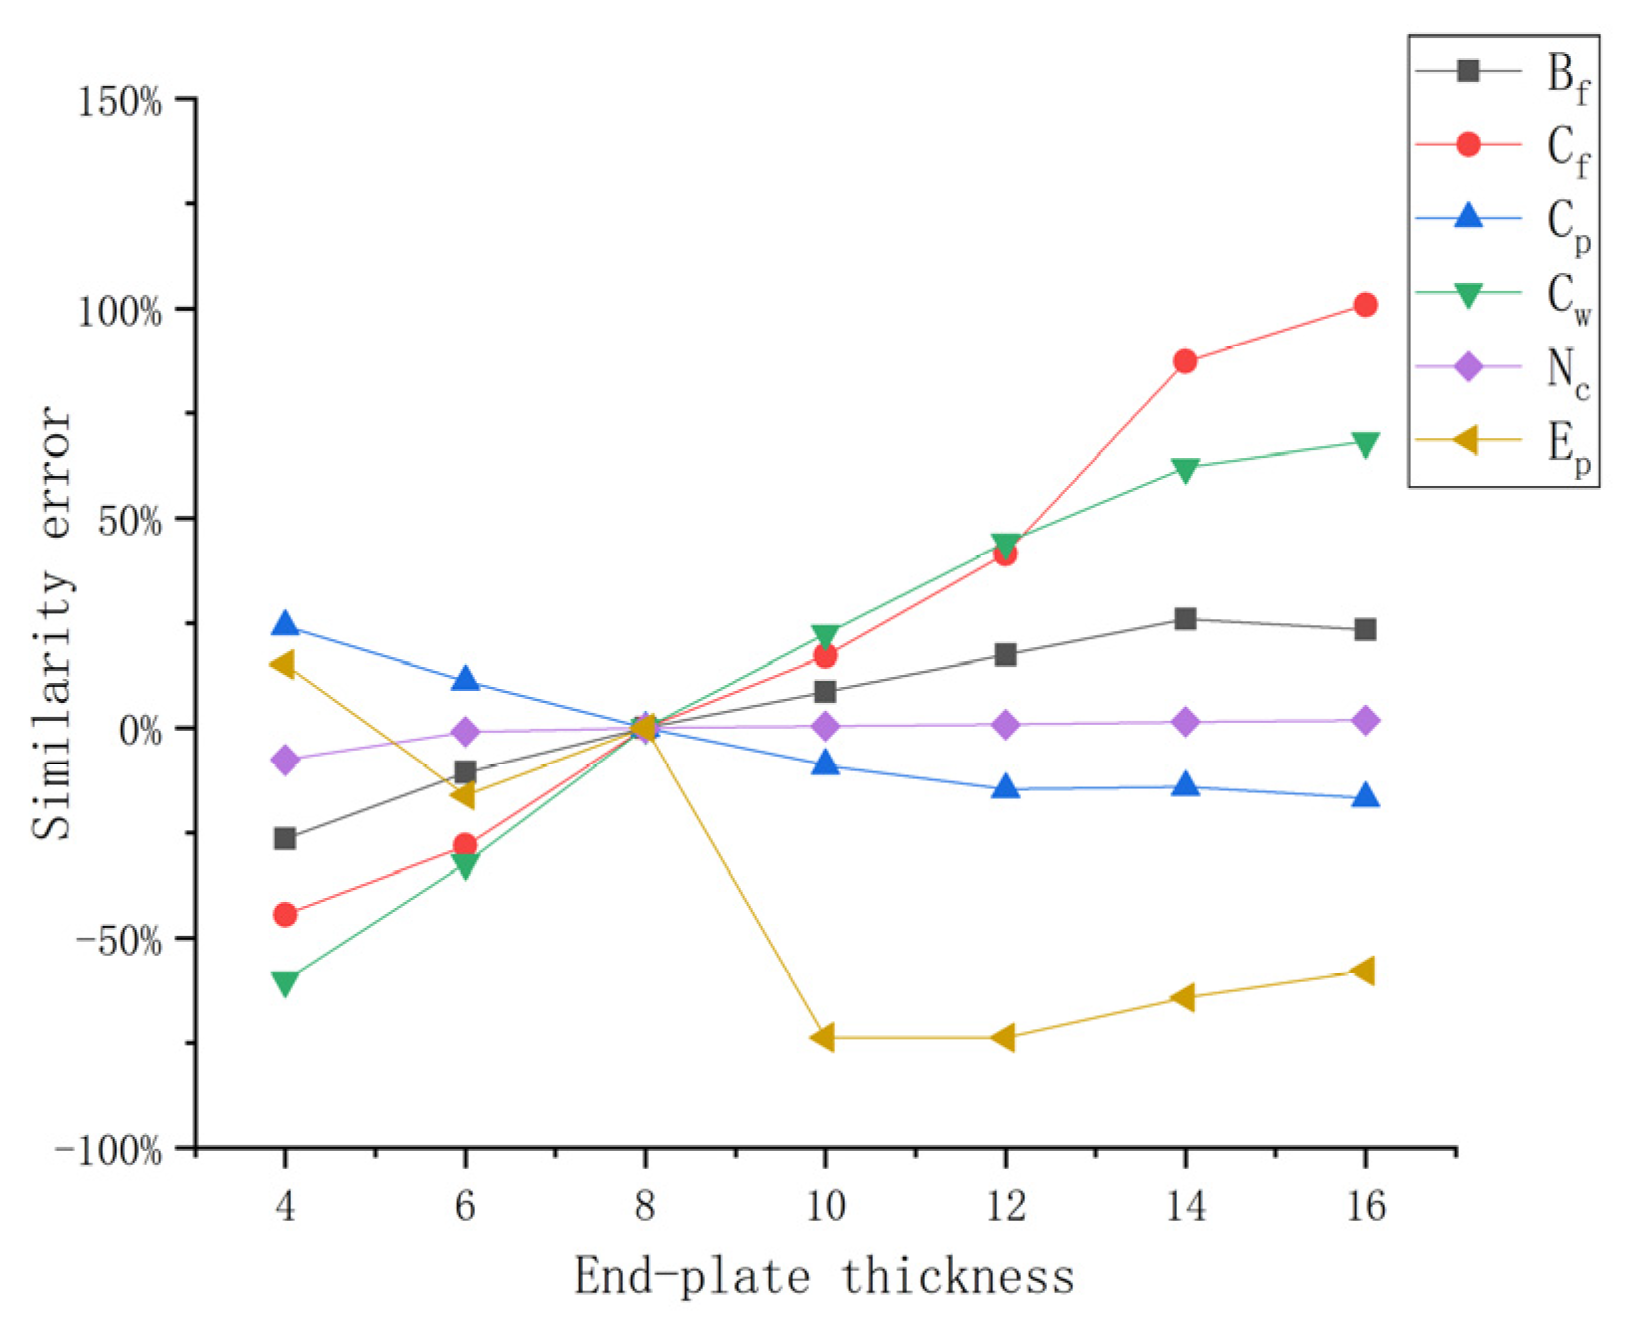
Figure 24.
Similarity errors of different end-plate thicknesses at specified points.
Figure 24.
Similarity errors of different end-plate thicknesses at specified points.
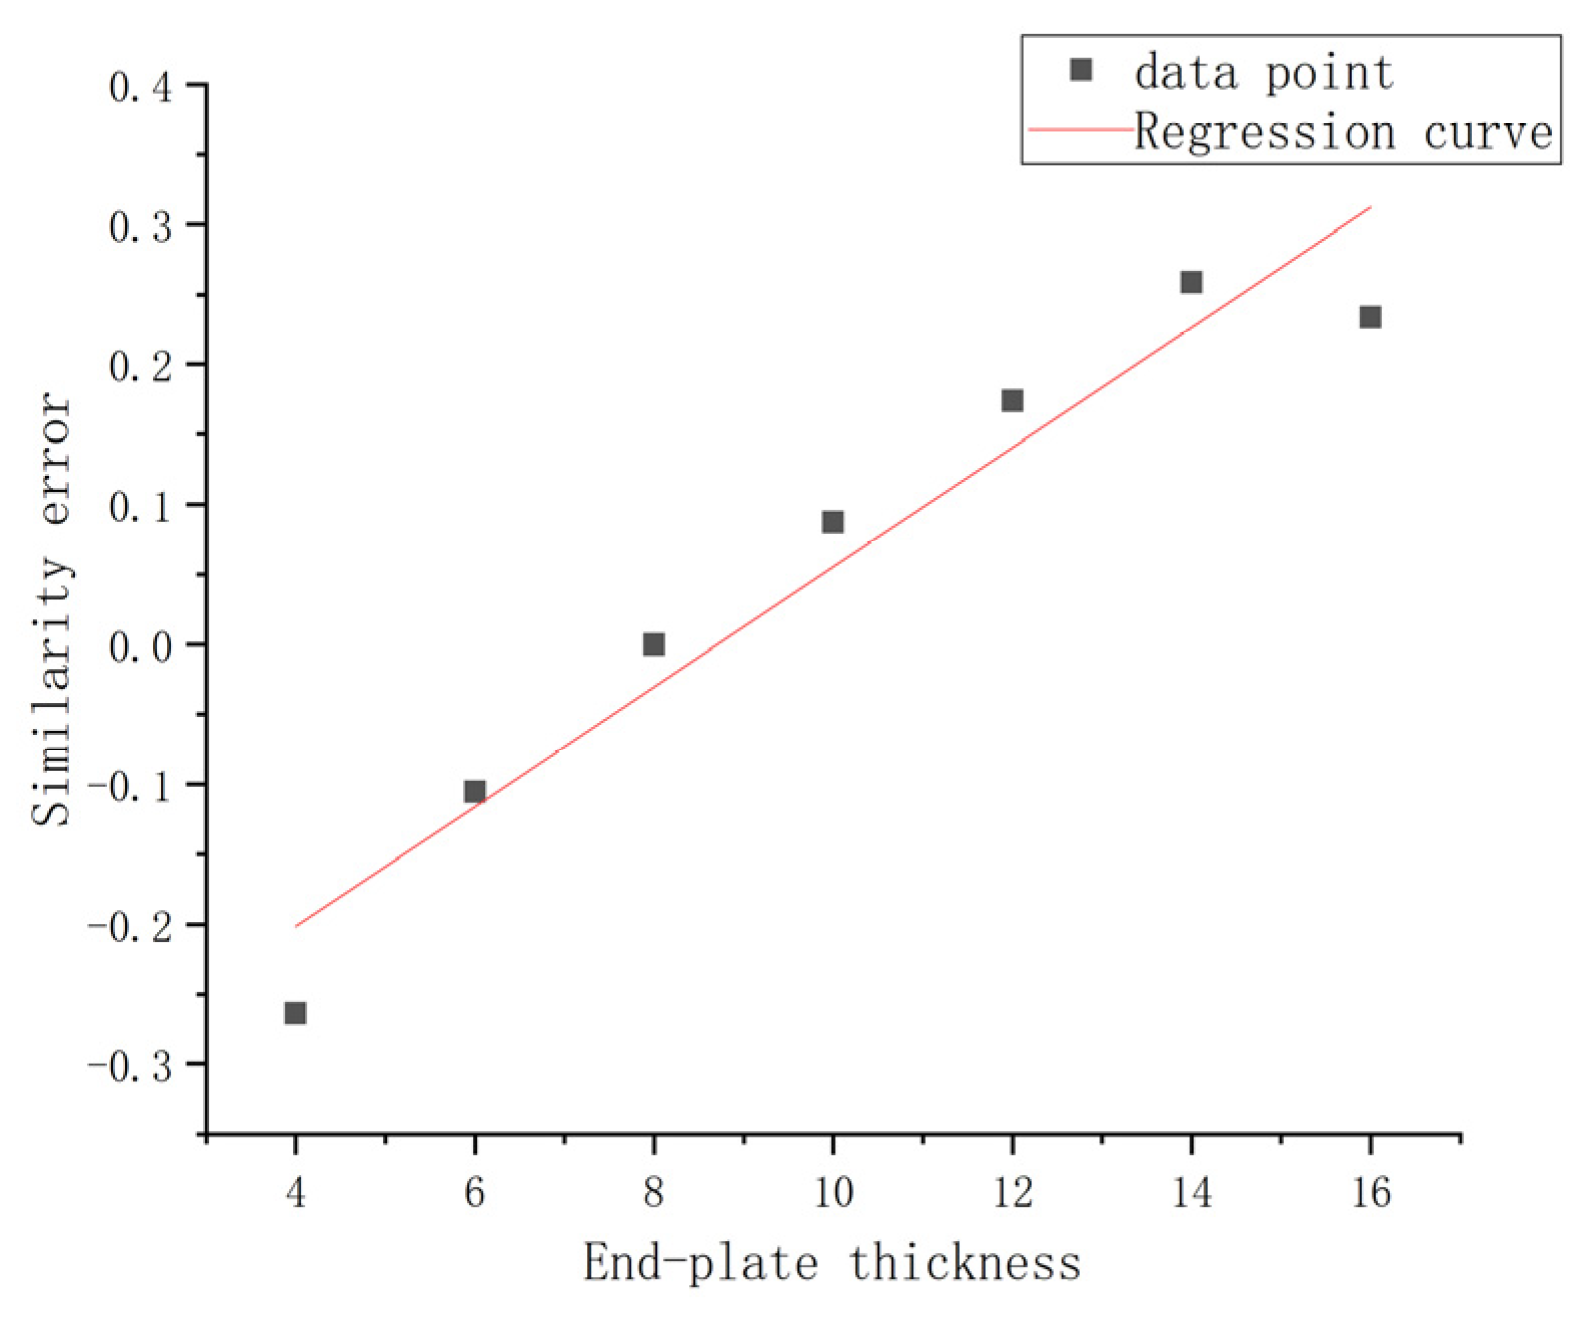
Figure 25.
Data points and the regression curve at Bf.
Figure 25.
Data points and the regression curve at Bf.
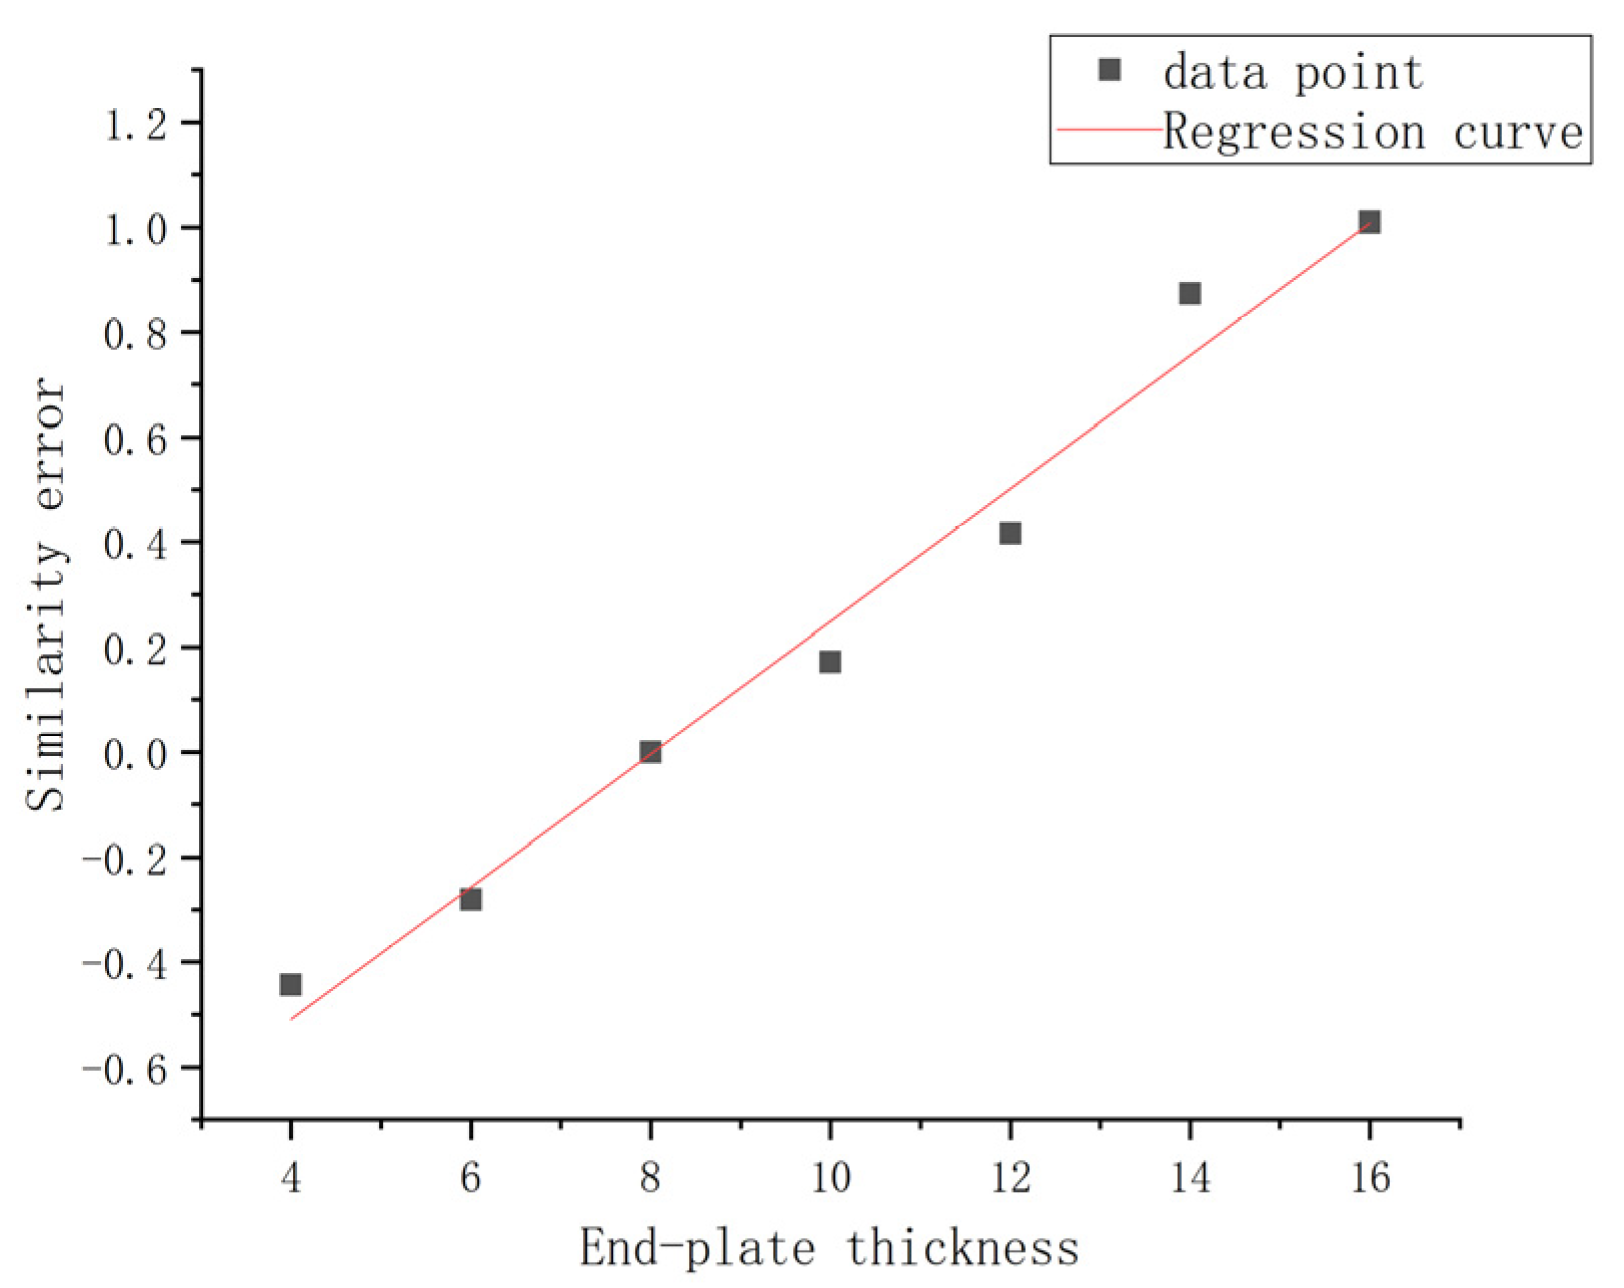
Figure 26.
Data points and the regression curve at Cf.
Figure 26.
Data points and the regression curve at Cf.
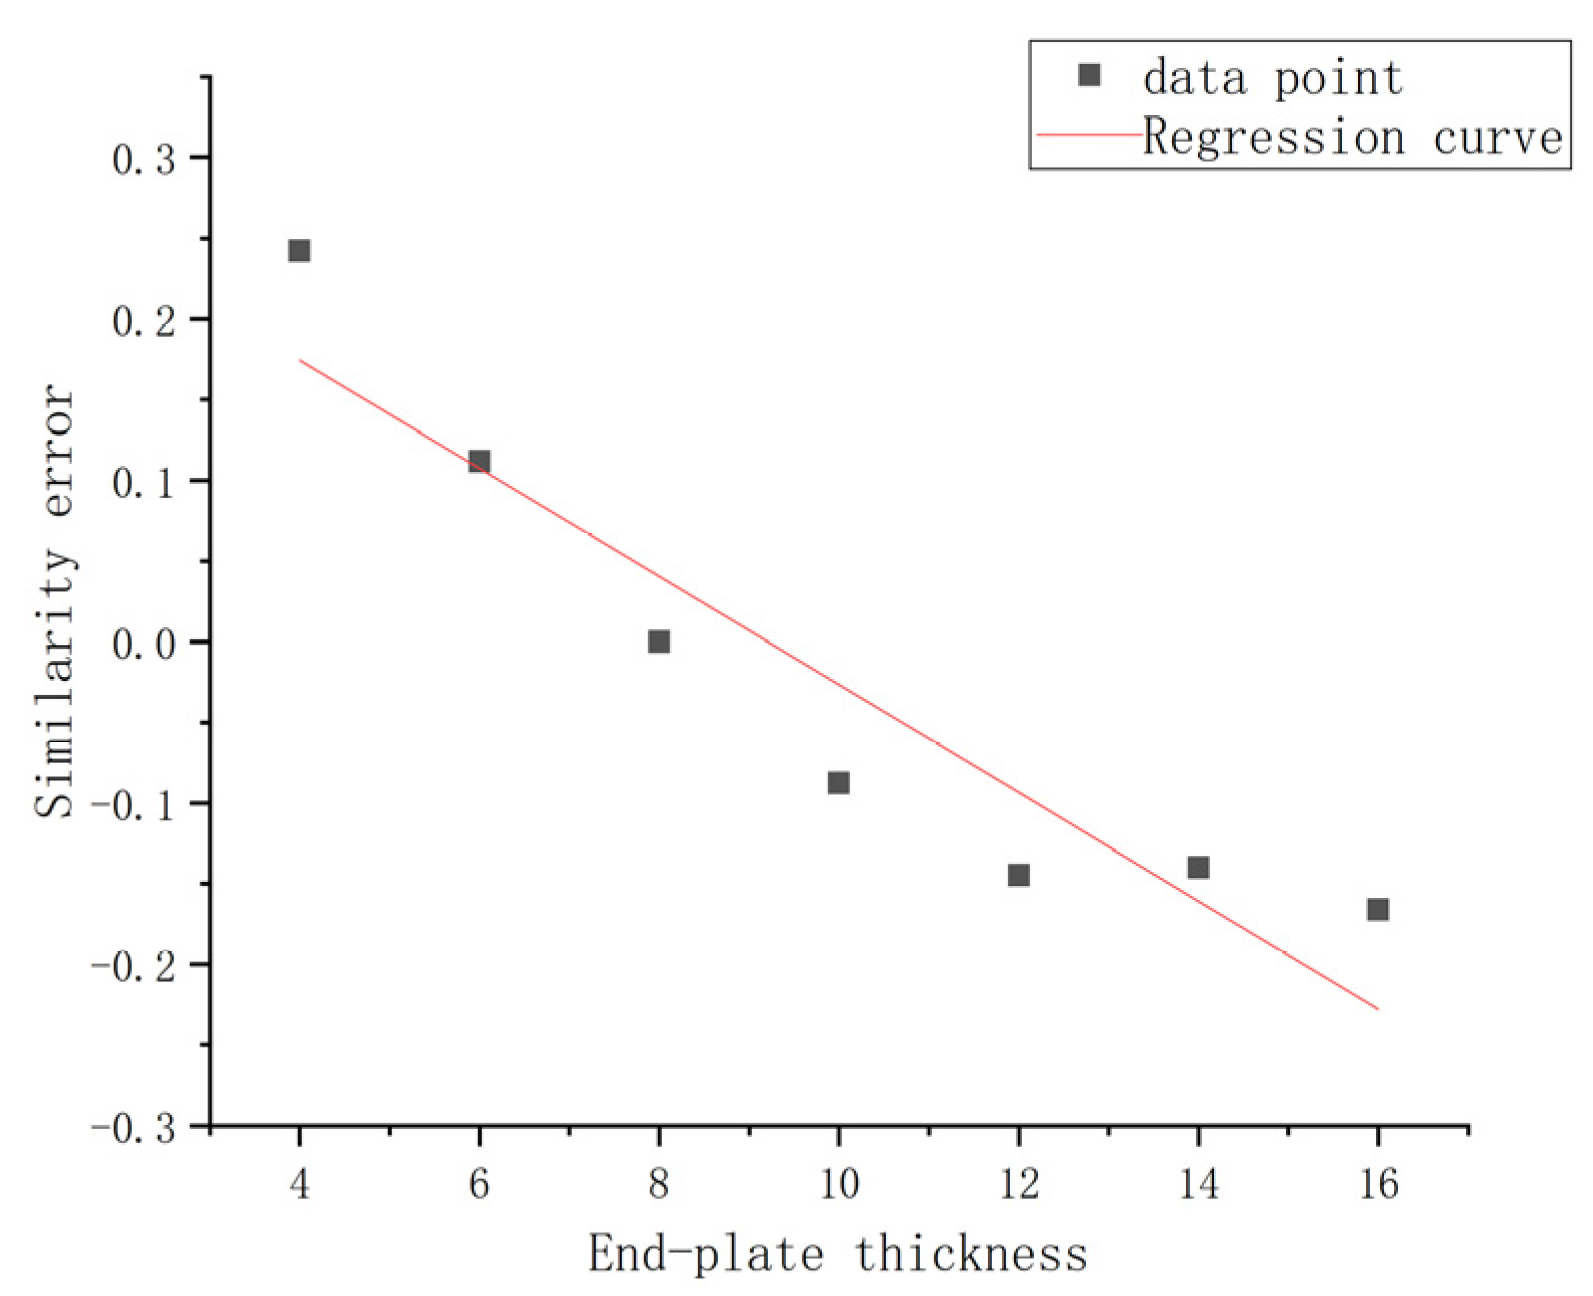
Figure 27.
Data points and the regression curve at Cp.
Figure 27.
Data points and the regression curve at Cp.
Figure 28.
Data points and the regression curve at Cw.
Figure 28.
Data points and the regression curve at Cw.
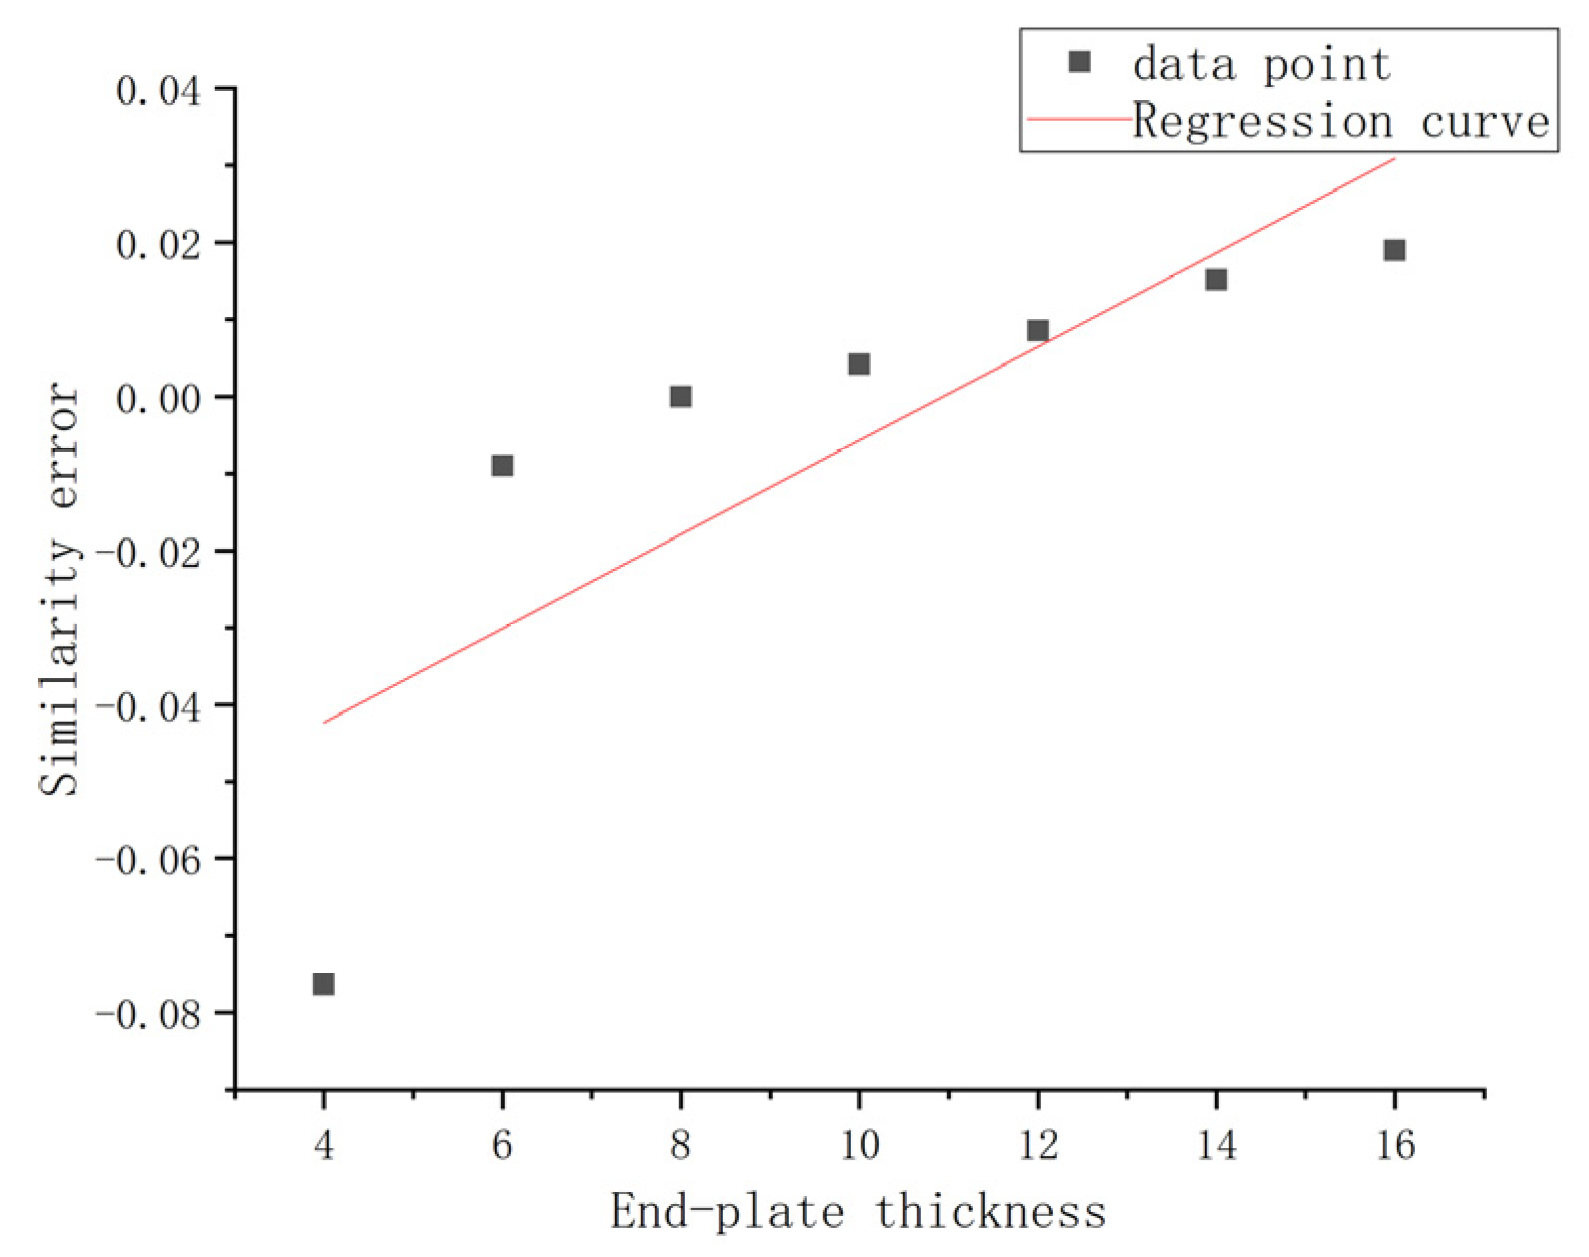
Figure 29.
Data points and the regression curve at Nc.
Figure 29.
Data points and the regression curve at Nc.
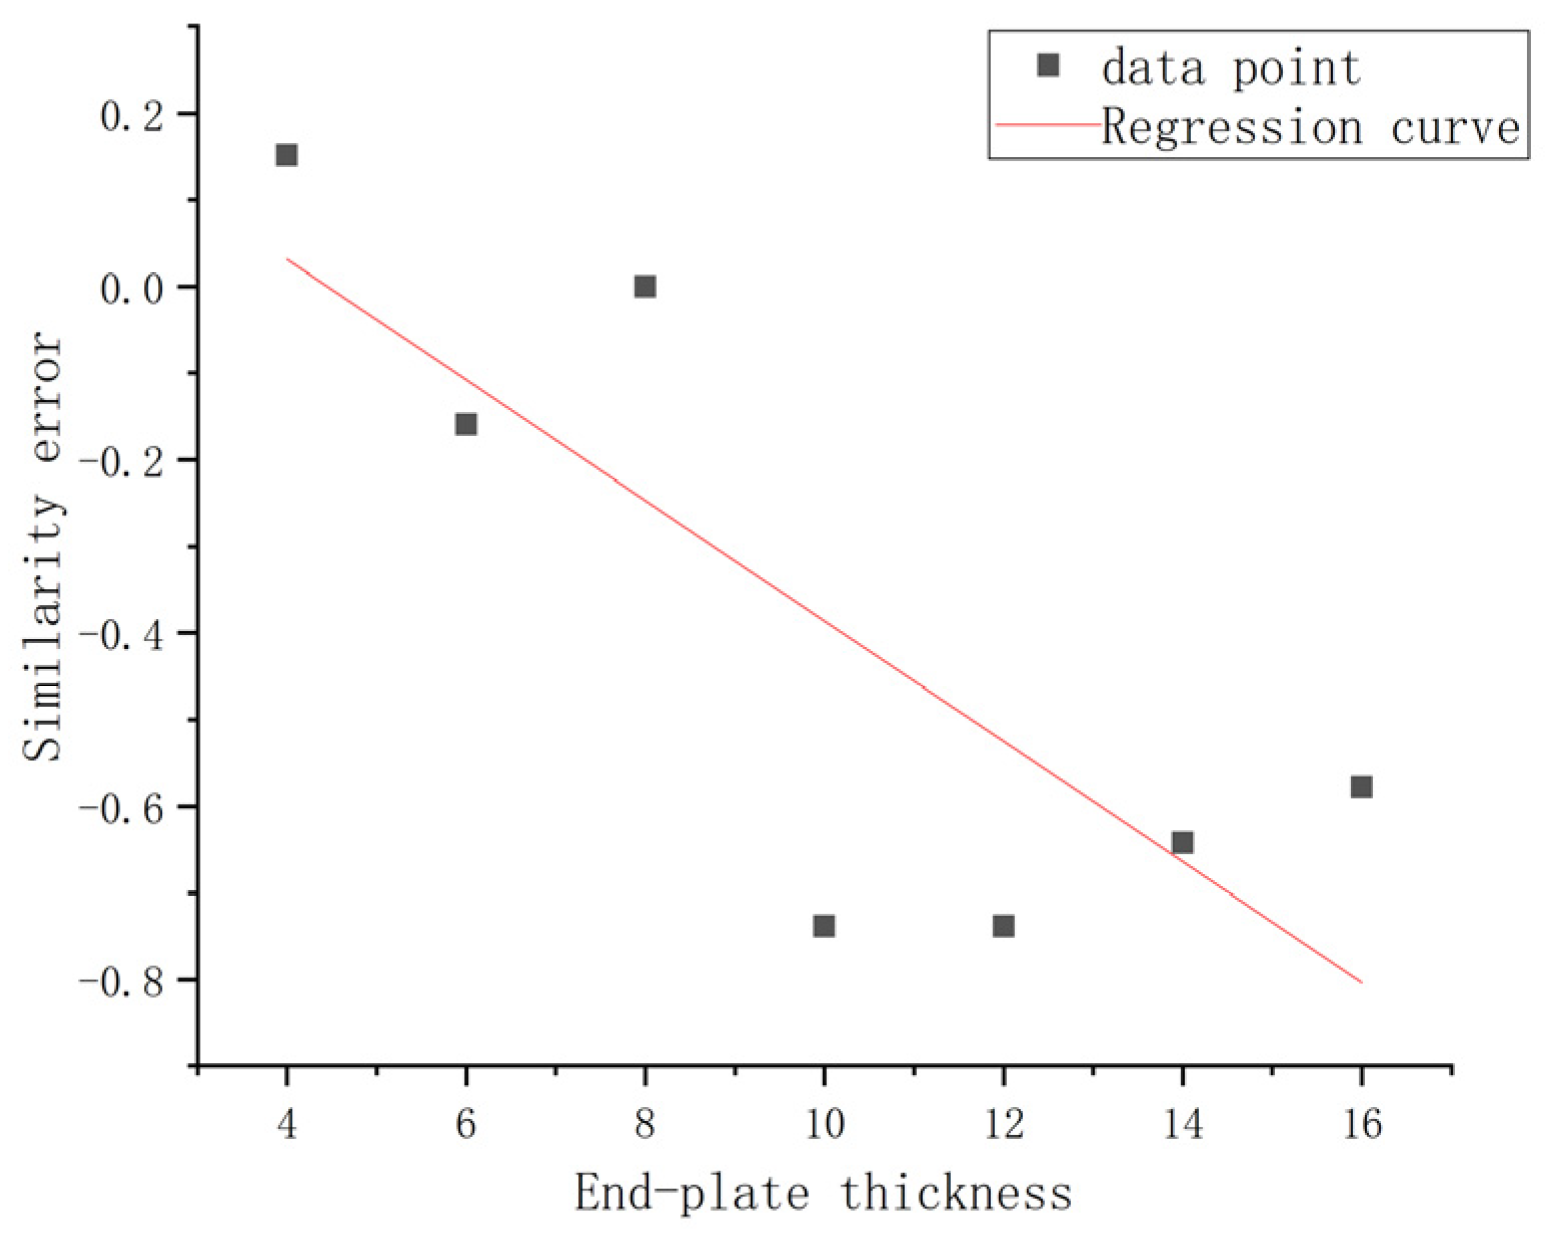
Figure 30.
Data points and the regression curve at Ep.
Figure 30.
Data points and the regression curve at Ep.
Figure 31.
Linear regression-corrected value.
Figure 31.
Linear regression-corrected value.
Table 1.
Table of the physical quantities.
Table 1.
Table of the physical quantities.
| Physical Quantity 1 | Physical Quantity 2 |
|---|
| L: geometric dimension. | A: sectional area. |
| g: acceleration of gravity. | γ: Poisson ratio. |
| F: static load. | ρ: density. |
| M: moment | σ: stress. |
| E: elastic modulus. | ε: strain. |
| G: shear modulus. | s: displacement. |
| K: initial stiffness of semi-rigid joint. | θ: angle. |
| I: moment of inertia | T: time. |
Table 2.
Basic dimensions of related parameters.
Table 2.
Basic dimensions of related parameters.
| Basic Dimension | L | g | F | M | E | G | K | I |
|---|
| F | 0 | 0 | 1 | 1 | 1 | 1 | 1 | 1 |
| L | 1 | 1 | 0 | 1 | −2 | −2 | 1 | 2 |
| T | 0 | −2 | 0 | 0 | 0 | 0 | 0 | 1 |
| Basic Dimension | A | γ | ρ | σ | ε | s | θ | T |
| F | 0 | 0 | 1 | 1 | 0 | 0 | 0 | 0 |
| L | 2 | 0 | −4 | −2 | 0 | 1 | 0 | 0 |
| T | 0 | 0 | 2 | 0 | 0 | 0 | 0 | 1 |
Table 3.
Similarity ratio of each factor.
Table 3.
Similarity ratio of each factor.
| Factor | Similarity Ratio | Factor | Similarity Ratio |
|---|
| SL | 1:2 | SA | 1:4 |
| SF | 1:4 | Sy | 1:1 |
| SM | 1:8 | Sσ | 1:1 |
| SE | 1:1 | Sε | 1:1 |
| SG | 1:1 | Ss | 1:2 |
| SK | 1:8 | Sθ | 1:1 |
Table 4.
Component modulus of completely similar conditions.
Table 4.
Component modulus of completely similar conditions.
| Prototype | Component Modulus (mm) | Model | Component Modulus of Completely Similar Conditions (mm) |
|---|
| Bp | HN300 × 200 × 8 × 12 | Bm | 150 × 100 × 4 × 6 |
| Cp | HN300 × 300 × 10 × 15 | Cm | 150 × 150 × 5 × 7.5 |
| Ep | 250 × 500 × 16 | Em | 125 × 250 × 8 |
| BLp | M20 | BLm | M10 |
Table 5.
Material properties of two steels.
Table 5.
Material properties of two steels.
| Index | Bolt | Beam and Column |
|---|
| Yield strength | 940 | 373.2 |
| Ultimate strength | 1130 | 540.7 |
| Yield strain | 0.05 | 0.08375 |
| Ultimate strain | 0.1 | 0.3 |
Table 6.
Model and prototype unit dimensions.
Table 6.
Model and prototype unit dimensions.
| Position | Prototype (mm) | Model (mm) |
|---|
| Beam | 30 | 15 |
| Column | 30 | 15 |
| End-plate | 8 | 4 |
| Bolt | 2.8 | 1.4 |
Table 7.
The correction of similarity error by fitting algorithm.
Table 7.
The correction of similarity error by fitting algorithm.
| Name | Status | 4 (mm) | 6 (mm) | 8 (mm) | 10 (mm) | 12 (mm) | 14 (mm) | 16 (mm) |
|---|
| Bf | before | −26.38% | −10.55% | 0.00% | 8.75% | 17.40% | 25.89% | 23.35% |
| after | 6.23% | −1.04% | −3.03% | −3.22% | −3.31% | −3.24% | 7.86% |
| Cf | before | −44.40% | −28.07% | 0.00% | 17.22% | 41.65% | 87.37% | 100.94% |
| after | −6.57% | 2.40% | −0.37% | 7.71% | 8.58% | −11.84% | −0.11% |
| Cp | before | 24.24% | 11.18% | 0.00% | −8.78% | −14.46% | −14.00% | −16.62% |
| after | −6.81% | −0.45% | 4.03% | 6.11% | 5.09% | −2.07% | −6.15% |
| Cw | before | −60.19% | −32.18% | 0.00% | 22.44% | 44.27% | 62.22% | 68.29% |
| after | 8.88% | 2.95% | −7.15% | −7.51% | −7.26% | −3.13% | 12.88% |
| Nc | before | −7.64% | −0.90% | 0.00% | 0.42% | 0.85% | 1.52% | 1.90% |
| after | 3.41% | −2.11% | −1.79% | −0.99% | −0.20% | 0.35% | 1.19% |
| Ep | before | 15.17% | −15.96% | 0.00% | −73.79% | −73.85% | −64.23% | −57.81% |
| after | −12.08% | 5.15% | −24.71% | 35.18% | 21.34% | −2.18% | −22.50% |


