Abstract
Vision-based tracking systems enable the optimization of the productivity and safety management on construction sites by monitoring the workers’ movements. However, training and evaluation of such a system requires a vast amount of data. Sufficient datasets rarely exist for this purpose. We investigate the use of synthetic data to overcome this issue. Using 3D computer graphics software, we model virtual construction site scenarios. These are rendered for the use as a synthetic dataset which augments a self-recorded real world dataset. Our approach is verified by means of a tracking system. For this, we train a YOLOv3 detector identifying pedestrian workers. Kalman filtering is applied to the detections to track them over consecutive video frames. First, the detector’s performance is examined when using synthetic data of various environmental conditions for training. Second, we compare the evaluation results of our tracking system on real world and synthetic scenarios. With an increase of about 7.5 percentage points in mean average precision, our findings show that a synthetic extension is beneficial for otherwise small datasets. The similarity of synthetic and real world results allow for the conclusion that 3D scenes are an alternative to evaluate vision-based tracking systems on hazardous scenes without exposing workers to risks.
1. Introduction
Vision-based detection and tracking have already found their way in a wide area of applications. Pedestrian detection has become an essential topic in the modern automotive industry and is also a relevant part of various surveillance systems. Even sports analytics make use of these techniques for the assistance of referees as well as for the automated generation of game statistics. Despite the huge potential, such approaches are rarely employed in the construction sector nowadays. Especially processes on construction sites could benefit from computer vision methods. As construction sites are complex and continuously changing environments, keeping track of the ongoing processes can be challenging. Various trades are involved at each stage of construction and different work orders are executed by workers and construction machines simultaneously. On the one hand, this can affect an individual worker’s workflow since the complex processes are hard to grasp. On the other hand, workers can easily lose track of the ongoing processes in their surroundings while concentrating on their own tasks. This inadvertency may result in hazardous situations. Excavator drivers may fail to notice unaware pedestrian workers crossing their paths. Also, crane operators may lift their loads over workers standing in blind spots.
By monitoring pedestrian workers on site, their current workflows can be optimized [1]. Furthermore, assistance systems can support machine operators in avoiding hazards involving workers [2]. However, a reliable and precise tracking system is a prerequisite for both applications. A multitude of approaches in this field apply tag-based methods where tags are attached to all objects to be monitored. Depending on the specific use case, Radio-Frequency Identification (RFID), Ultra-Wideband (UWB), or Global Navigation Satellite System (GNSS) technology is employed [3]. Approaches using GNSS are usually applied to the localization of equipment, workers, and machines in spacious outdoor construction environments [4,5]. Near to large structures like buildings, walls, and other construction components, GNSS becomes unreliable as it suffers from multipath effects [6]. Tracking workers in the proximity of heavy construction machinery or cranes carrying large loads may, thus, become too inaccurate for operator assistance systems. Accordingly, RFID- and UWB-based approaches are commonly used to improve the safety during construction. By equipping workers with RFID tags, operators get warned if a worker enters the range of a machine’s tag reader [7]. Warning workers of entering hazardous areas can be achieved by positioning the workers using UWB tags and readers [8]. Nevertheless, in general a precise localization by means of radio-frequency technologies remains challenging [9]. Beyond that, all tag-based approaches involve high costs for the amount of required tags and readers [3]. Additionally, wearing such tags causes discomfort for the workers [10]. Camera-based monitoring approaches overcome these deficiencies. They allow for the tracking of workers even close to large structures as they neither suffer from multipath effects nor from other signal interferences leading to an inaccurate positioning. Additionally, they constitute an affordable alternative to tag-based solutions since only a few cameras are required to monitor large areas of construction sites.
In recent years, some effort has already been made to monitor pedestrian workers using computer vision techniques. Firstly, pose estimation is used to recognize specific sequences of movement as well as unsafe actions [11,12]. Secondly, workers are detected in video images using Support Vector Machine (SVM) and k-Nearest Neighbors (k-NN) classifiers [13] and are then tracked over time [14]. More recent approaches employ Convolutional Neural Networks (CNNs) for both detection and tracking purposes [15,16]. However, the detection results of such approaches are in need of improvement. Park and Brilakis [13] state recall rates of % to % at precision rates ranging from % to %, respectively. Luo et al. [15] report an Average Precision (AP) of % with an Intersection over Union (IoU) threshold of only 0.5. Although these results are as of yet insufficient for the implementation of a reliable safety-relevant system, its considerable potential can already be inferred. To improve the detection allowing for an uninterrupted tracking, the training of the underlying machine learning algorithms has to be enhanced. Furthermore, the subsequent evaluation of those systems has to be extended in order to model a broader variety of scenarios which may occur during a real application. This ensures a reliable tracking during productive operation even under challenging conditions. Training and evaluation both require a vast amount of data. This especially holds for deep learning approaches as they usually require a multitude of training samples compared to classical machine learning techniques. However, sufficient datasets rarely exist for construction site scenarios and gathering a comprehensive dataset is time consuming and tedious. Although common data augmentation techniques, such as randomly cropping, flipping, or rotating samples, enable the extension of existing datasets, the effect to the training of a detector is limited. While this increases the variability in the dataset, adapting the training towards scenarios not contained in the initial dataset is unfeasible. Moreover, assembling realistic evaluation scenarios might also require exposing workers to hazards to determine the behavior of a tracking system in such situations.
A solution to the data problem may be synthetic data. Parker [17] defines synthetic data as “any production data applicable to a given situation that are not obtained by direct measurement”. While this definition was originally meant for mathematical models, it can also be applied to machine learning datasets. The complexity of synthetic data generation can range from simple mathematical equations, to fully simulated virtual environments. Synthetic data was mainly used in software development processes, but has lately found application among machine learning research. Generating required data synthetically might be desirable as synthetic data has the ability to extend existing datasets or to create new datasets with a significant reduction in effort. While traditional datasets have to be aggregated and labeled by hand, synthetic data can be accurately labeled automatically. As the ground truth is already available in a simulated environment, labeling becomes trivial. Synthetic data can be created completely from scratch (fully synthetic data) or based on real datasets for data augmentation (partially synthetic data). For example, Jaderberg et al. [18] created a dataset for text recognition by synthetically generating distorted, noisy images of text from a ground truth dictionary. Gupta et al. [19] improved on the idea of synthetic text recognition by rendering text onto real images. Tremblay et al. [20] used synthetic data as a form of domain randomization where random objects are placed in various environments. The amount of possible combinations enables a CNN to recognize the important part of a picture with minimal effort in dataset generation. The size of a synthetic dataset based on a 3D environment is nearly unlimited as can be seen in the SYNTHIA dataset [21]. Utilizing dynamic objects and render settings, scenarios can be varied indefinitely. One popular technique is co-opting video games with realistic graphics for various imaging tasks, such as depth estimation [22] or image segmentation [23]. Furthermore, synthetic datasets can be augmented by creating variations of lighting or environmental conditions like rain or fog. Tschentscher et al. [24] created a synthetic dataset of a car park in Unreal Engine 4 where camera angles and weather conditions can be changed at will. Through the use of this dataset, Horn and Houben [25] improved a k-NN based parking space detection algorithm by six percentage points while simultaneously reducing the time for generating the dataset.
As this paper focuses on the improvement of the detection and tracking of construction workers, a few particularities have to be taken into consideration. Construction sites depict more complex and harder to model environments than the well structured car park scenarios in [25]. Sites are essentially less structured and subject to greater changes. Construction material, machinery, and workers operate or interact with each other almost everywhere on the site. In the course of this, occlusions of the workers by construction machines and their loads occur frequently. Additionally, modeling human shapes and behaviors realistically is still a challenging task. Compared to the simple trajectories of cars, a worker’s movement is significantly more complex and harder to predict. Dynamic environments such as these require a diversified dataset that covers all cases of working on a construction site, including dangerous situations which would be unethical to re-enact in a real world scenario.
Lately, image style transfer learning such as Cycle-Consistent Generative Adversial Networks (CycleGANs) [26] has been used for data augmentation. CycleGANs are able to learn a bidirectional image style mapping between two unlabeled image domains. The two image sets for training the GAN do not need to be paired sets, but there is still a significant amount of training data required. Wang et al. [27] use this technique to enhance their synthetic dataset for crowd counting by augmenting the synthetic dataset with image styles from existing datasets. Since the synthetic data in [27] is collected from a video game, the image style is significantly different from actual camera footage. However, the small size and low variation in environmental conditions of common real world datasets of construction sites complicate the training of a GAN. Additionally, in this work, full control over the synthetic scenes’ setup is required to sufficiently model potential hazardous situations, which includes the image style. Thus, this paper does not use CycleGANs for data augmentation.
Hence, the aim of this paper is to investigate the usage of synthetically generated data for improving both, the training and the evaluation of construction site monitoring systems. For this, several 3D scenes of construction sites with varying lighting and environmental conditions are modeled. Sequences of these scenes are extracted to extend a self-recorded real world dataset. In order to identify the effects of synthetic data, a monitoring system is built that tracks pedestrian construction workers over time. The system detects workers in consecutive video frames using YOLOv3 [28] and tracks them by Kalman filtering. To prove the concept of this paper, first the detector’s performance is evaluated when it is trained on the real world dataset only. Then, the results are compared to the performance when synthetic data is gradually added to the set of training samples. We found that providing well-chosen computer generated scenes to the training set improves the detection performance by 7.5 percentage points in mean average precision (mAP). In the end, the detector achieves a mAP of %. If inaccuracies resulting from manual labeling and image scaling are taken into account, the mAP even increases to %. In another setting, the tracking performance of the proposed monitoring system on real world and synthetic scenarios is compared. The experiment shows that the tracking system yields similar results on both kinds of datasets. This illustrates that synthetic data provides a reasonable alternative for the evaluation of the tracking performance on hazardous situations without exposing workers to risks.
The remainder of this paper is organized as follows: Section 2 introduces the datasets as well as the tracking system. Section 3 summarizes two experiments and their results to prove the proposed concept. First, the use of synthetic data for the training of the detector is investigated in Section 3.1. Second, Section 3.2 examines the comparability of real world and synthetic data in terms of the evaluation of a tracking system. The results of these experiments are discussed in Section 4 and an exemplary use case evaluating such a monitoring system is shown. Finally, Section 5 summarizes the findings and provides an outlook to future work.
2. Materials and Methods
In order to investigate the effect of synthetically generated data on the training and evaluation of a vision-based tracking system in the scope of construction sites, we created a dataset from computer generated 3D scenes. This dataset is used to augment a small self-recorded dataset (see Section 2.1) of pedestrian workers walking across a construction site. As described in detail in Section 2.2, we modeled multiple 3D scenarios which depict various lighting and environmental conditions as well as different movement patterns for the represented workers. To evaluate our approach, we built a monitoring system that tracks pedestrian workers in video sequences. The underlying detector’s hyperparameter settings are described in Section 2.3 while Section 2.4 outlines the tracking process, respectively.
2.1. Real World Dataset
Since video datasets of construction sites including pedestrian workers from a top view perspective are rarely publicly available, we assembled a small generic dataset on our own. For this, we recorded several sequences of walking construction workers using a camera mounted in a height of around 20 . This results in a bird’s-eye-like view in the center of the images whereas the view becomes oblique near the borders. A reasonable dataset should exhibit a large variation in the data samples. This includes different lighting and environmental conditions of the scenes as well as various objects and differences in their appearance. To realize variation in our dataset, we chose two environmental scenarios. These contain different ground textures and lighting conditions as well as different types of construction sites and present objects. While the ground in one scene is uniformly paved (see Figure 1a), the other scene exhibits sandy, paved, and graveled parts, as shown in Figure 1b. The scenes are recorded at different daytimes to include different but realistic lighting conditions. This results in a well-exposed to overexposed illumination in the one scene at noon whereas in the other scene, in the evening, long shadows and lateral illumination are present. The scenes also vary in their setup and item selection. One shows a roadwork-like setup containing parked and driving cars as well as striped delineators, poles, and garbage cans. The other is a building work-like scene including a construction barrier and barrier tape. In both scenes, there are areas of different illumination conditions ranging from slightly underexposed to a high overexposure. The pedestrian workers wear safety vests and helmets throughout and walk randomly across both scenes including sudden stops and directional changes. They also interact with and relocate static objects like pylons and barriers.
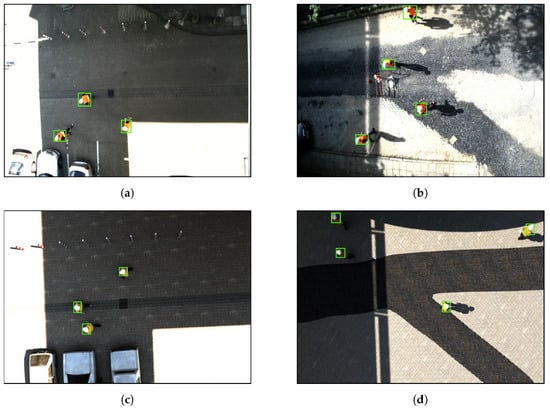
Figure 1.
Comparing the different environmental scenarios of the real world dataset in (a,b) to their 3D generated counterparts in (c,d), respectively. Ground truth labels are marked as green rectangles.
The resulting dataset is labeled manually to provide ground truth for training and evaluation purposes. For this, workers are identified by rectangular bounding boxes closely framing their heads, shoulders, and safety vests. In Figure 1, these labels are represented by green rectangles.
The dataset is split into two separate subsets. A share of the recorded video sequences is assigned to each subset. This way, the construction worker detector can be trained on one subset while the evaluation is carried out on the other subset unknown to the detector until then. The shares are assigned in a way that both environmental scenarios are equally distributed within each. Each subset only obtains every tenth frame of the assigned sequences in order to ensure a sufficient amount of variation among the images. The number of workers visible in each frame varies as workers occasionally entered and left the camera’s field of view during recording. Although we do not identify particular workers, the number of visible workers per image and their locations are known since the sequences were manually labeled beforehand. In the following, each visible worker per image is referred to as a worker instance. In conclusion, the subsets are organized as follows: the training set consists of 660 images of both environmental conditions containing 1000 pedestrian worker instances while the evaluation set shows 2750 worker instances in 1300 images of different sections of the recorded sequences.
2.2. Synthetic Data Generation
The synthetic dataset was built to emulate the environment and technical specifications of the real world dataset. Figure 2 summarizes the synthetic data creation process. Blender 2.80 was used for the creation of the different scenes, which were rendered using the Cycles rendering engine. All scenes were built by hand to represent real construction sites, depicting a varied set of scenes. Using a physically-based renderer allows for more realistic images than game engines, but also increases render time. For the comparison of real and synthetic data, the two real scenes were recreated (see Figure 1c,d). Overall, 8 different scenes with a total of 3835 frames and 32 tracked subjects were created for this work. Table 1 lists all created scenes, with sample frames shown in Figure 3. Similar to the real world dataset, the synthetic dataset incorporates different lighting and weather conditions, ground surface types, and surrounding clutter. As for the real dataset, this increases the variation of the data samples as well as modeling the most common conditions and construction site types. The lighting conditions include sunny, cloudy, and rainy. The incidence angle of the sun varies to simulate the different lighting conditions at different times of the day, including long shadows in the morning and evening. Overexposure emulates the effect present in the real world dataset (compare Figure 1a,c). The virtual workers wear different safety vests (in either green, yellow, or orange) and different helmets (in either white or yellow) to ensure variability in the dataset. To ensure that the pose and movement of the virtual workers are realistic, motion capture data from the Carnegie Mellon University Motion Capture Database was used. The motion capture data was rigged onto the construction worker model to create realistic animations. Virtual workers conduct multiple different actions in the created scenes, including walking, picking up objects, interacting with each other, or repairing or using equipment. Several other moving objects are added, such as cars, forklifts, and construction material. Dangerous situations are also included, where construction material is lifted above workers’ heads (see Figure 3a,d). Workers may also be partly occluded by objects.
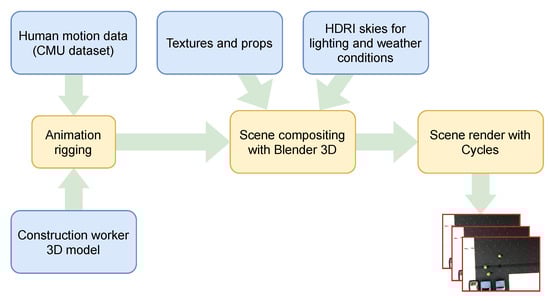
Figure 2.
Process for creating synthetic scenes.

Table 1.
Descriptions of the created computer generated scenes.
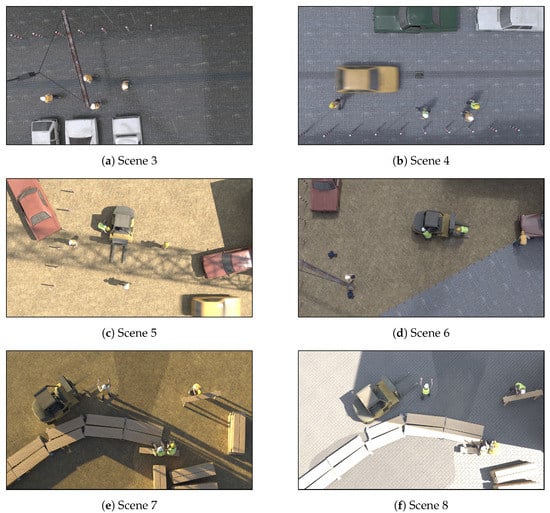
Figure 3.
Synthetic scenes 3–8. See Table 1 for descriptions.
Ground truth labels were extracted automatically from the 3D data. For this, a spherical hull was placed, which encompasses the head and part of the shoulders of a virtual construction worker. The points of the hull for each subject in each frame were transformed into image coordinates, with the bounding box of the image coordinates then serving as the rectangular label. The labeling process was done completely automatically from the source 3D data, not requiring any manual labeling. Resulting labels are depicted in Figure 1.
2.3. Hyperparameter Setting
In the course of this paper, we developed a simple construction worker tracking system using deep learning. We did not aim at building the system to serve as an optimal ready-to-use safety device but to investigate the possibilities of synthetic data for training and evaluation of such approaches in construction site scenarios.
Our system detects pedestrian construction workers in the camera images and tracks them over time in consecutive image frames. For detection, we apply YOLOv3 [28] as it combines classification and detection of the workers in a single CNN. The network was trained on parts of the labeled datasets described in Section 2.1 and Section 2.2. Training the network from scratch is unfeasible due to the limited amount of real world data even though we have already made extensive use of YOLO’s built-in data augmentation features. Hence, we rely on transfer learning to avoid overfitting the network to our small dataset during training. For this, we trained our network with a mini batch size of 64 based on the Darknet53 model, which has been pre-trained on ImageNet [29]. To quickly adjust the network towards the newly introduced class of pedestrian workers, we began the training with a high learning rate of 0.001. The learning rate was then scaled down by a factor of 0.1 each 3800 epochs until training ended after 10,400 epochs. This facilitates a finer adjustment of the weights so that these converge towards an optimal result. For regularization, we adapted the weights by a momentum of 0.9 and a weight decay of 0.0005.
Besides the hyperparameters directly affecting the learning behavior, YOLO’s detection quality and especially its speed highly depend on the given input image size. Scaling down high resolution images may vanish smaller image features relevant for proper detection. Conversely, the larger the input image is, the longer it takes for YOLO to process the entire image. A suitable scaling of high resolution images with regard to the case of application has, thus, to be determined beforehand. By comparing the detector’s performance on different input image sizes, we identify the size which yields optimal detection results in accordance with the preservation of real-time applicability. For this, we train and evaluate the detector’s performance on various scales of the real world datasets described in Section 2.1. Since the input image size should be a multiple of 32 px because of YOLO’s downsampling architecture, we start our tests with a size of 416 × 416 px, which is equivalent to a factor of 13. For further tests, we gradually increase that factor each time by 3 up to an image size of 800 × 800 px. The performances of these test runs are compared by the mAP score as proposed for the evaluation of the COCO Detection Challenge [30]. As depicted in Equation (1), besides averaging over recall values at with values, this score also averages over different IoU thresholds in steps. As a consequence, more accurate detection results are rewarded with a higher score.
For reasonable monitoring or assistance systems, an accurate localization of pedestrian workers on construction sites is desirable. Thus, we choose the COCO mAP score as this score implicitly indicates the localization accuracy.
Although we found that detection accuracy generally rises with increasing image size, the detection speed rigorously drops. At the base image size, we measure a detection time for a single image of 46 with a mAP of % on the evaluation dataset. At our maximum image size, the detection time increased to 97 . This corresponds to about 10 frames per second (fps), which would inhibit a reliable tracking as addressed in Section 2.4. Pointing out a mAP of % at still about 15 fps, we decide for an image size of 608 × 608 px as a reasonable tradeoff between detection time and mAP. Using this setup, we are able to analyze at least every second frame at frame rates of up to 30 fps. On the one hand, this speed is still sufficient for the tracking while, on the other hand, we can take advantage of a reasonable detection quality.
2.4. Tracking
After the workers are detected in a video frame, a track is assigned to each of them. For this, we apply Kalman filtering, which relies on a motion model only. An appearance model as it is provided by other tracking approaches would be redundant since our YOLO detector already takes care of this. For the purpose of tracking pedestrian workers, a simple motion model that only includes a worker’s two-dimensional location and velocity is sufficient. According to this, our motion model describes the transition from one state t to the next state , as shown in Equation (2).
Beginning with an initial detection of a worker, the motion model is used to predict this worker’s location in the ensuing video frame. Afterwards, the subsequent frame is evaluated. The workers’ locations predicted by the Kalman filter in the preceding frame and the detections made by YOLO in the current frame are, then, matched using the Hungarian method. We use the locations of the matching detections to update the estimation of each track towards the actual worker’s position. This prevents the tracks from drifting off. Detections that do not match any pre-existing track will create a new track. This way, our detector serves for both, initializing tracks and providing evidence for existing tracks. Those tracks for which no evidence is found will persist for a maximum of 12 frames without further evidence. From this, we can derive the workers’ walking path trajectories as well as their prospective walking directions.
Although the Kalman filter was originally developed for linear tracking, it copes with non-linearity to some extent [31]. However, the pedestrian workers’ movements can be highly non-linear. In the short time period between only a few consecutive video frames, though, the workers’ movements can be assumed to be almost linear. For this reason, the tracks should be updated at least on every second frame. This drastically decreases the probability of occurrence of non-linearities. Considering this, the Kalman filter has to deal with non-linear state transitions only if workers are not detected for several video frames. An adequate detection beforehand is, thus, a necessary requirement for reliable tracking.
3. Results
We conduct different experiments in order to examine the benefits of synthetically generated data. Our experiments investigate both the training and the evaluation of computer vision-based construction site monitoring systems. For this, we developed a tracking system based on YOLOv3 and Kalman filtering. The data generation and the tracking approach are both described in Section 2.
Our first experiment focuses on the effects of synthetic data on the training of the detector. For this, we contrast the performance of YOLOv3 trained on our real world dataset (see Section 2.1) to a detector additionally trained on different subsets of our synthetic dataset, as illustrated in Section 2.2. The suitability of synthetically generated data for the purpose of evaluating the tracking system’s performance is, then, determined in a second experiment, shown in Section 3.2. We examine the similarity between the tracking performances of our system when applied to real world video sequences and to their synthetically generated counterparts.
3.1. Effects of Synthetic Data on the Training
In Section 2.3, we determined the baseline mAP of % on real world data at our desired input image size. This allows us to examine the effect of adding supplementary synthetic data during training on the detector’s performance. For this, we successively add more and more subsets of our synthetic dataset to the set of training samples. These subsets exhibit different characteristics as described in the following. In the first trial, we add the synthetic scenes 1, 2, and 3 to the existing training set. In total, these scenes show 2130 pedestrian worker instances in 750 images. The amount of provided information is not significantly enhanced by these scenes. It only increases the sheer number of samples as the scenes imitate the real world samples, which have already made up the training dataset beforehand. This results in an increase of the mAP by 1.7 percentage points to a value of %. Next, we further extend the training dataset by adding the synthetic scenes 4, 5, and 6, which consist of 1510 images showing 5170 worker instances in total. The compositions of these scenes differ from those of the scenes before, but the environmental conditions remain similar. Trained on the resulting dataset, our detector yields a mAP of %. This is an increase of only 0.5 percentage points in comparison to the previously trained detector. By subsequently adding scene 7 containing 2490 worker instances in 620 images, we incorporate different lighting conditions into our training dataset. The scene is brightly illuminated, which leads to large cast shadows. Workers are consistently located in over- and underexposed areas. By this, the mAP drastically increases by 5.2 percentage points to %. Further training samples of scene 8, which exhibit environmental conditions similar to scene 7, have only little effect on the detection quality. Although this scene provides another 2490 worker instances in 620 images, the mAP only increases to %. The bar graph in Figure 4 summarizes the increase of the mAP over the successively added subsets of our synthetically generated dataset.
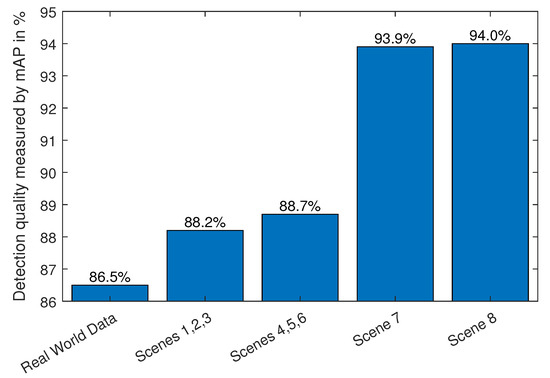
Figure 4.
Increase of YOLO’s detection quality by successively adding synthetic data samples.
3.2. Tracking System Evaluation
The final detector generated in the previous experiment (see Section 3.1) is embedded into a simple tracking system. Its detections are passed to a Kalman filter to estimate the detected workers’ movements, as explicitly described in Section 2.4. By means of the developed tracking system, we investigate the suitability of computer generated 3D scenes for the evaluation of computer vision-based tracking systems. For this, we compare its tracking results on real and synthetic construction site scenarios. Our tracker is compared by means of the two different real world scenarios (see Section 2.1) and their computer generated counterparts described in Section 2.2. From each scenario we extract a continuous 10 second video sequence in which four pedestrian workers move across the scene varying their pace and direction in each sequence. All video sequences also include sudden stops as well as pedestrian workers coming close to and crossing each other. In the real world sequences, ground truth is labeled manually whereas this is done automatically (see Section 2.2) for the computer generated scenes.
We contrast the accuracy of our tracker on each of these video sequences by the average overlap score (AOS) and the center location error ratio (CER) metrics while its robustness is measured by the track length (TL). These metrics are adapted from [32] as shown in Equations (3) to (5)
where n and N denote the number of video frames in which a worker is tracked and the number of frames in which the worker is present, respectively. The workers’ bounding box areas are indicated by A and their centers by C. The superscripts G and T indicate ground truth and tracked bounding boxes, respectively. Lastly, denotes the two dimensional euclidean distance and represents the two dimensional size of an area.
Table 2 and Table 3 summarize the tracking results on the first and second pair of scenes, respectively. As can be seen, in each of the sequences our tracker identifies four tracks. Each of these corresponds to one of the pedestrian workers as illustrated in Figure 5 for all sequences. No tracks are set up mistakenly tracking other objects in the scenes. With an average of 96% in AOS and a very low CER on both real world scenes, our tracking system yields an accurate performance. In addition, the averages in TL of 97% and 98% highlight the systems’ robustness. Deviations from the optimal TL are mainly due to the fact that it takes a few frames until sufficient consecutive detections are identified to start a track. In isolated cases, starting a track was delayed since the initial detection was complicated by odd lighting conditions. The measurements’ averages of the synthetic scenes are slightly lower than those of the real world scenes, but still demonstrate an accurate performance of the tracking system.
Table 2.
Comparison of our system’s tracking performance on the first scene from our real dataset and its synthetic counterpart. IDs are assigned randomly and correspond to a single tracked worker each.
Table 3.
Comparison of our system’s tracking performance on the second scene from our real dataset and its synthetic counterpart. IDs are assigned randomly and correspond to a single tracked worker each.
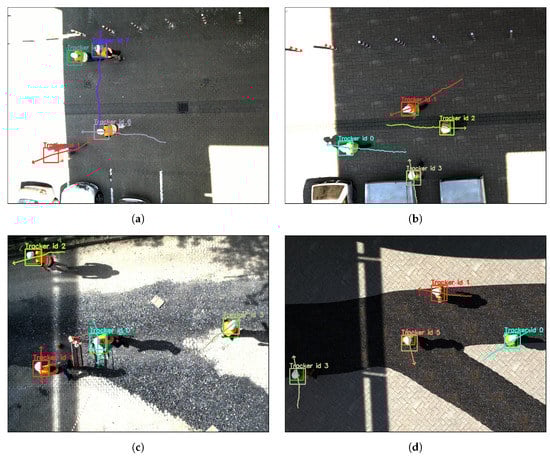
Figure 5.
Tracking results on the real world sequences in (a,c) and their synthetic counterparts in (b,d). Ground truth labels are marked as green rectangles whereas differently colored rectangles illustrate tracked workers’ positions. Each worker’s trajectory is represented by a colored line and the prospective movement is depicted as a colored arrow.
4. Discussion
Our first experiment, shown in Section 3.1, highlights the benefits of using computer generated data for training a detector on construction related scenarios when only little real world data is available. Making use of such data, we boosted our detector’s precision from % in mAP using only a small real world dataset to % by augmenting the dataset with synthetic data. This amounts to an increase of 7.5 percentage points. Nevertheless, the experiment also shows that synthetic data samples have to be chosen carefully in order to properly increase the detection quality. Adding more data samples of similar kind to a small set of training data generally improves the detection quality. This becomes apparent when extending our dataset by the synthetic scenes 1, 2, and 3, which increases the mAP by 1.7 percentage points (see Figure 4). The detection results in Figure 6a,b illustrate that the detected regions become more accurate, which results in a higher mAP score. However, the need for more samples of one specific kind is satiated at a certain amount. The model learned by the detector, then, already considers all relevant features provided by such samples. No further insights can be drawn from such samples. As a consequence, the detection quality languishes as it occurred when adding the scenes 4, 5, and 6 to the training dataset. A further addition of more samples could cause the model to overfit to these training samples, resulting in an even worse performance on the evaluation set. The dataset extension by scene 7 points out that new samples possessing various conditions can further improve the detection results even though these are of synthetic nature. As shown by the comparison of Figure 6c,d, this enables the detector to even precisely identify workers that were only coarsely detected before due to unusual lighting conditions. Furthermore, the large amount of different training samples aggregated from the synthetic scenes 1–7 enhances the detector’s generalization ability so that it is able to cope with slight occlusions and partial color changes due to overexposed lighting conditions (see Figure 6e,f). When adding too many samples of a kind, once more the results begin to languish illustrated by extending the dataset by scene 8. These findings show that computer generated data is exceedingly advantageous to augment a dataset by environmental and lighting conditions that do not occur often. Recording training data on construction sites over a long period in order to cover all conditions is a tedious task. Instead, recording only a short real world dataset at certain conditions would be sufficient while particular weather and lighting conditions could be simulated using a 3D environment.
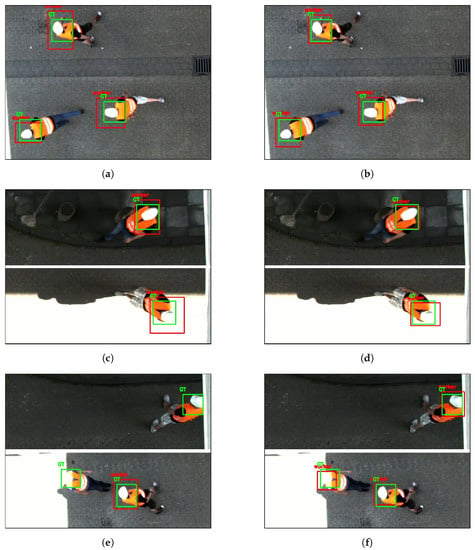
Figure 6.
Comparing the detection results of YOLO trained on different datasets. Red rectangles display YOLO’s detections whereas green rectangles indicate manually labeled ground truth. (a,c,e) show the results of a detector trained on our real world dataset only. The right column illustrates the detection improvements for the same image sections if particular synthetic data is additionally provided for training. In (b), the general accuracy is improved by extending the training dataset by similar data. In (d), detections in under- and overexposed areas are improved by adding samples with different lighting conditions. In (f), workers can be detected despite slight occlusions and dramatic overexposure after adding a large amount of data samples.
Considering the severe downscaling of the input images, the achieved mAP is already a prominent performance. Due to the scaling factor of about 0.317, the ground truth regions shrink from the original 40–50 px to a size of only 13–16 px in the scaled images. Despite the fact that CNNs generally struggle with the detection of very small objects, a precise detection by means of IoU is difficult. Each pixel offset between the detection and the ground truth label in the scaled image implies an offset of about 3 px in the original image. Accordingly, if the detection is only 1 px off, the best possible IoU decreases to 0.94. An offset of 1 px in both x- and y-direction further decreases the IoU to 0.88 at best. Taking into account that manually labeling ground truth is never accurate to a single pixel, minor deviations between detection and ground truth are inevitable. Thus, an IoU of more than 0.85 can already be assumed to be optimal in this case. With respect to this, we can adapt Equation (1) so that the last bin of j contains the results for all IoU values ranging from 0.85 to 0.95. By this modified measure, our detector achieves a mAP of %.
In conclusion, we showed in this experiment that computer generated data is capable of successfully augmenting a construction site related dataset for the purpose of training a CNN. The reasonable choice of synthetic training samples can considerably increase the detection quality. These findings correspond to those in other application areas. It shows that such data is not only advantageous for well structured scenarios like car parks, but also yields reasonable results in crucially more complex environments like construction sites. This is also confirmed by the tracking results on the real world scenes of the second experiment. The simple tracking system based on a detector which was trained on only sparse real world data augmented with synthetic samples already enables suitable monitoring. This further substantiates the use of synthetic data for the training of CNNs in the context of construction sites.
Beyond these findings, the second experiment emphasizes the comparability of real world and synthetic scenes in terms of evaluating vision-based detectors and trackers. The comparison of the tracking results given in Table 2 and Table 3 reveals that our tracker acts similar on both kinds of data. On both scenes, the accuracy measured by the AOS and CER on the synthetic sequences is slightly lower than these on real world sequences. This is not necessarily due to the nature of synthetic data but rather associated with the more precise ground truth labels on the synthetic dataset resulting from the automatic labeling method. These labels enclose the workers even closer than those in the manually labeled sequences so that minor deviations during detection result in lower AOS and CER. The comparison of the green ground truth rectangles in Figure 5a,b as well as in Figure 5c,d illustrates this graphically. Nevertheless, on average there is only a deviation of about four percentage points in AOS and a deviation of 0.0005 in CER on the first scene. Similarly, low deviations are given for the second scene with two percentage points in AOS and 0.0005 in CER. These results indicate a reasonable comparability of the tracking performance on real world and synthetic scenarios. Very similar track lengths on both scenes additionally confirm this finding.
The comparison has shown that the evaluation results on real world and computer generated video sequences resemble each other closely. Accordingly, the quality of a tracking system can be deduced on the basis of computer generated video sequences if sufficient real world data cannot be acquired. For construction site scenarios, this is often the case for hazardous situations since intendedly endangering workers should be avoided. Furthermore, weather conditions may appear on which the detector was not explicitly trained. On the basis of the similar evaluation results on synthetic and real world data, we demonstrate the capabilities accompanied by a virtual environment as developed in this paper in an exemplary way. In this example we use a computer generated video to show the evaluation of a tracking system on a risky situation without exposing any worker to a hazard. Furthermore, it illustrates that various environmental conditions can be simulated without the need for tedious repetitive recordings on multiple days. In order to highlight these benefits, we apply our tracking system to a modified version of synthetic scene 1. We change the weather conditions from a sunny to a heavy rainy day and include a crane lifting and pivoting its load above the heads of pedestrian workers. As depicted in Figure 7, again all four workers are tracked by our system despite the rainy weather conditions, which were not explicitly trained. Table 4 shows that only four tracks were assigned, each corresponding to one of the workers. Though, the trackers accuracy slightly decreases. This indicates that the performance of our tracker on a similar real world scenario should basically be still sufficient but its precision might decrease slightly. However, additionally training the detector on data samples of rainy days might counteract this. Furthermore, Table 4 unveils that the tracking is not interrupted even though the workers are temporarily occluded by the crane’s load. This demonstrates that the tracking system proposed in this paper is even capable of dealing with certain hazardous situations. By identifying the hazardous area around the crane’s load, the crane operator could be warned against approximating pedestrian workers so that risky situations could be prevented. Further tests have to verify whether the system can also cope with larger loads and more difficult weather conditions.
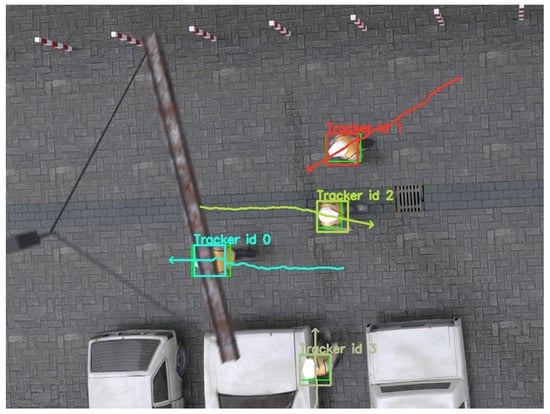
Figure 7.
Tracking results on computer generated hazardous situation on a heavy rainy day. Green rectangles denote ground truth labels whereas differently-colored rectangles illustrate the tracked pedestrian workers.
Table 4.
Tracking results of our system on synthetic scene 3. IDs are assigned randomly and correspond to a single tracked worker each.
5. Conclusions
Productivity and safety management on construction sites could benefit from monitoring pedestrian workers. Based on recorded walking trajectories of workers provided by a tracking system, the workers’ current paths could be assessed and optimized to solve certain tasks more efficiently. These trajectories also reveal the workers’ attention with respect to hazards like falling edges or hazardous materials and areas. Owing to this, safety trainings could be tailored explicitly to the needs of the workers. If the localization of workers is conducted live, workers and machine operators could even be warned of looming hazardous situations, which enables them to counteract early. Computer vision methods are more suitable for such a precise tracking of workers all over the site due to various shortcomings arising from the radio-frequency technology used by tag-based alternatives. However, computer vision approaches have to be trained and evaluated on a vast amount of images. Appropriate datasets are rarely publicly available and recording a sufficient amount of data is extremely time-consuming. For this reason, we investigated the use of synthetic data, which is generated from 3D environments.
Besides a small real world dataset, we generated a synthetic dataset that covers diverse environmental and illumination conditions. In order to analyze the usability of data generated from 3D scenarios, we built a simple tracking system. This consists of a YOLOv3 detector identifying pedestrian workers and a Kalman filter tracking those workers in video sequences. In our experiments, we examined the suitability of synthetic data individually for training and evaluation purposes of a computer vision tracking system. First, we iteratively added more and more synthetic data samples to the training dataset of our YOLO detector. Second, we compared the performance of our tracking system on real world and corresponding 3D generated video sequences.
We found that training on synthetic data samples significantly enhances the detection quality. In our experiments, we were able to boost our detector by 7.5 percentage points over a detector trained on a small real world dataset only. Though, the quality of the resulting detector is highly dependent on the choice of decent training samples. As for real world datasets, synthetic samples should also cover various environmental and lighting conditions. Furthermore, we found that a computer vision-based tracker performs very similarly on real world and 3D generated video sequences. Accordingly, the evaluation on synthetically generated scenes can already provide reliable insights regarding the strengths and weaknesses of a tracking system since its performance can be estimated considerably precisely. As a result, a vision-based tracking system can be tested on a variety of synthetically generated situations before being employed on a real construction site. By this, a flawless tracking can be guaranteed even for rare or exceptional situations.
The findings of our experiments are in accordance with those from other application areas, but additionally highlight that synthetic data are capable of modeling even the complex and dynamic environments of construction sites realistically. For construction site-related applications, this validation is relevant to a special degree. Since datasets are typically rare in this field, data augmentation using synthetic data could advance the use of vision-based approaches in the future. In particular, this facilitates incorporating conditionally occurring lighting and weather conditions into a dataset. By simulating, for example, snowfall or bright sunlight, in a virtual environment, data acquisition can be drastically accelerated and existing datasets can easily be completed. The use of synthetic data allows to model any weather and lighting conditions and to change the construction site setup at will. Otherwise, recordings all over the year and on different sites would be necessary to acquire a reasonable dataset. Further time savings and human resources result from the possibility of automatic labeling. Since the positions of all objects in a virtual scene are known exactly, labeling can be done fully automatically and with substantially higher precision than a manual labeling. Via the extension of various environmental conditions and a precise labeling, datasets can be prepared such that an optimal training is ensured. The resulting system can deal with manifold upcoming conditions without having seen these in the real world before. Besides the training of detectors, computer generated data is also valuable for the evaluation of vision systems. Again, virtual environments can be used to simulate a variety of scenarios to test the system on. This is particularly advantageous for events that rarely occur or are hazardous to replicate in the real world. Risky situations can be evaluated this way without exposing anyone to a serious hazard.
In summary, our major conclusions are as follows: We have shown the applicability of synthetically generated data for vision systems in the area of construction sites. Furthermore, we highlighted the benefits of such data for training and evaluation purposes for the underlying machine learning algorithms. As this paper outlines an overview of the possibilities accompanied with synthetic data, future work should investigate either the training or the evaluation phase in more detail. For now, the limits of using synthetic data for both, training and evaluation remain unclear. It should also be determined to what extent the use of synthetic data is beneficial and if certain scenarios cannot be modeled sufficiently. The impact of such data on different machine learning algorithms could be another topic to focus on. Finally, a tracking system optimally trained and tested on a combination of real world and synthetic data should be employed on a real construction site for a large-scale case study.
Author Contributions
Conceptualization, M.N. and P.H.; data curation, P.H.; investigation, M.N. and P.H.; methodology, M.N.; project administration, M.N.; resources, M.N. and P.H.; software, M.N.; supervision, M.K.; validation, M.N.; visualization, M.N. and P.H.; writing—original draft, M.N. and P.H.; writing—review and editing, M.K. All authors have read and agreed to the published version of the manuscript.
Funding
This research received no external funding.
Acknowledgments
The motion capture data used in this project was obtained from mocap.cs.cmu.edu. The CMU database was created with funding from NSF EIA-0196217. Furthermore, we acknowledge the support by the DFG Open Access Publication Funds of the Ruhr-Universität Bochum.
Conflicts of Interest
The authors declare no conflict of interest.
References
- Cheng, T.; Yang, J.; Teizer, J.; Vela, P.A. Automated Construction Resource Location Tracking to Support the Analysis of Lean Principles. In Proceedings of the Annual Conference of the International Group for Lean Construction, Haifa, Israel, 14–16 July 2010; pp. 643–653. [Google Scholar]
- Teizer, J.; Allread, B.S.; Fullerton, C.E.; Hinze, J. Autonomous Pro-Active Real-Time Construction Worker and Equipment Operator Proximity Safety Alert System. Autom. Constr. 2010, 19, 630–640. [Google Scholar] [CrossRef]
- Nasr, E.; Shehab, T.; Vlad, A. Tracking Systems in Construction: Applications and Comparisons. In Proceedings of the Annual Conference of Associated Schools of Construction, San Luis Obispo, CA, USA, 10–13 April 2013; pp. 9–13. [Google Scholar]
- Riaz, Z.; Edwards, D.J.; Thorpe, A. SightSafety: A Hybrid Information and Communication Technology System for Reducing Vehicle/Pedestrian Collisions. Autom. Constr. 2006, 15, 719–728. [Google Scholar] [CrossRef]
- Khoury, H.M.; Kamat, V.R. High-Precision Identification of Contextual Information in Location-Aware Engineering Applications. Adv. Eng. Inform. 2009, 23, 483–496. [Google Scholar] [CrossRef]
- Xie, P.; Petovello, M.G. Measuring GNSS Multipath Distributions in Urban Canyon Environments. IEEE Trans. Instrum. Meas. 2015, 64, 366–377. [Google Scholar] [CrossRef]
- Chae, S.; Yoshida, T. Application of RFID Technology to Prevention of Collision Accident with Heavy Equipment. Autom. Constr. 2010, 19, 368–374. [Google Scholar] [CrossRef]
- Carbonari, A.; Giretti, A.; Naticchia, B. A Proactive System for Real-Time Safety Management in Construction Sites. Autom. Constr. 2011, 20, 686–698. [Google Scholar] [CrossRef]
- Pradhan, A.; Ergen, E.; Akinci, B. Technological Assessment of Radio Frequency Identification Technology for Indoor Localization. J. Comput. Civ. Eng. 2009, 23, 230–238. [Google Scholar] [CrossRef]
- Juels, A. RFID Security and Privacy: A Research Survey. IEEE J. Sel. Areas Commun. 2006, 24, 381–394. [Google Scholar] [CrossRef]
- Han, S.; Lee, S.; Peña-Mora, F. Vision-Based Detection of Unsafe Actions of a Construction Worker: Case Study of Ladder Climbing. J. Comput. Civ. Eng. 2013, 27, 635–644. [Google Scholar] [CrossRef]
- Yang, J.; Shi, Z.; Wu, Z. Vision-Based Action Recognition of Construction Workers Using Dense Trajectories. Adv. Eng. Inform. 2016, 30, 327–336. [Google Scholar] [CrossRef]
- Park, M.W.; Brilakis, I. Construction Worker Detection in Video Frames for Initializing Vision Trackers. Autom. Constr. 2012, 28, 15–25. [Google Scholar] [CrossRef]
- Park, M.W.; Brilakis, I. Continuous Localization of Construction Workers via Integration of Detection and Tracking. Autom. Constr. 2016, 72, 129–142. [Google Scholar] [CrossRef]
- Luo, X.; Li, H.; Wang, H.; Wu, Z.; Dai, F.; Cao, D. Vision-Based Detection and Visualization of Dynamic Workspaces. Autom. Constr. 2019, 104, 1–13. [Google Scholar] [CrossRef]
- Vierling, A.; Sutjaritvorakul, T.; Berns, K. Crane Safety System with Monocular and Controlled Zoom Cameras. In Proceedings of the International Symposium on Automation and Robotics in Construction, Berlin, Germany, 20–25 July 2018. [Google Scholar] [CrossRef]
- Parker, S.P. McGraw-Hill Dictionary of Scientific and Technical Terms; McGraw-Hill Education: New York, NY, USA, 2003. [Google Scholar]
- Jaderberg, M.; Simonyan, K.; Vedaldi, A.; Zisserman, A. Reading Text in the Wild with Convolutional Neural Networks. Int. J. Comput. Vis. 2016, 116, 1–20. [Google Scholar] [CrossRef]
- Gupta, A.; Vedaldi, A.; Zisserman, A. Synthetic Data for Text Localisation in Natural Images. In Proceedings of the Conference on Computer Vision and Pattern Recognition, Las Vegas, NV, USA, 27–30 June 2016; pp. 2315–2324. [Google Scholar]
- Tremblay, J.; Prakash, A.; Acuna, D.; Brophy, M.; Jampani, V.; Anil, C.; To, T.; Cameracci, E.; Boochoon, S.; Birchfield, S. Training Deep Networks With Synthetic Data: Bridging the Reality Gap by Domain Randomization. In Proceedings of the Conference on Computer Vision and Pattern Recognition Workshops, Salt Lake City, UT, USA, 18–22 June 2018; pp. 969–977. [Google Scholar]
- Ros, G.; Sellart, L.; Materzynska, J.; Vazquez, D.; Lopez, A.M. The SYNTHIA Dataset: A Large Collection of Synthetic Images for Semantic Segmentation of Urban Scenes. In Proceedings of the Conference on Computer Vision and Pattern Recognition, Las Vegas, NV, USA, 27–30 June 2016; pp. 3234–3243. [Google Scholar]
- Atapour-Abarghouei, A.; Breckon, T.P. Real-Time Monocular Depth Estimation Using Synthetic Data With Domain Adaptation via Image Style Transfer. In Proceedings of the Conference on Computer Vision and Pattern Recognition, Salt Lake City, UT, USA, 18–22 June 2018; pp. 2800–2810. [Google Scholar] [CrossRef]
- Richter, S.R.; Vineet, V.; Roth, S.; Koltun, V. Playing for Data: Ground Truth from Computer Games. In Computer Vision—ECCV 2016; Springer International Publishing: Berlin/Heidelberg, Germany, 2016; pp. 102–118. [Google Scholar] [CrossRef]
- Tschentscher, M.; Prus, B.; Horn, D. A Simulated Car-Park Environment for the Evaluation of Video-Based on-Site Parking Guidance Systems. In Proceedings of the IEEE Intelligent Vehicles Symposium, Redondo Beach, CA, USA, 11–14 June 2017; pp. 1571–1576. [Google Scholar] [CrossRef]
- Horn, D.; Houben, S. Evaluation of Synthetic Video Data in Machine Learning Approaches for Parking Space Classification. In Proceedings of the IEEE Intelligent Vehicles Symposium, Changshu, China, 26–30 June 2018; pp. 2157–2162. [Google Scholar] [CrossRef]
- Zhu, J.; Park, T.; Isola, P.; Efros, A.A. Unpaired Image-to-Image Translation using Cycle-Consistent Adversarial Networks. In Proceedings of the 2017 IEEE International Conference on Computer Vision (ICCV), Venice, Italy, 22–29 October 2017; pp. 2223–2232. [Google Scholar] [CrossRef]
- Wang, Q.; Gao, J.; Lin, W.; Yuan, Y. Learning From Synthetic Data for Crowd Counting in the Wild. In Proceedings of the 2019 IEEE/CVF Conference on Computer Vision and Pattern Recognition (CVPR), Long Beach, CA, USA, 16–21 June 2019; pp. 8190–8199. [Google Scholar] [CrossRef]
- Redmon, J.; Farhadi, A. YOLOv3: An Incremental Improvement. arXiv 2018, arXiv:1804.02767. [Google Scholar]
- Deng, J.; Dong, W.; Socher, R.; Li, L.J.; Li, K.; Fei-Fei, L. ImageNet: A Large-Scale Hierarchical Image Database. In Proceedings of the Conference on Computer Vision and Pattern Recognition, Miami, Florida, USA, 20–25 June 2009; pp. 248–255. [Google Scholar] [CrossRef]
- Lin, T.Y.; Maire, M.; Belongie, S.; Bourdev, L.; Girshick, R.; Hays, J.; Perona, P.; Ramanan, D.; Zitnick, C.L.; Dollár, P. COCO—Common Objects in Context. Available online: http://cocodataset.org/#detection-eval (accessed on 10 March 2020).
- Kim, H.; Kim, K.; Kim, H. Vision-Based Object-Centric Safety Assessment Using Fuzzy Inference: Monitoring Struck-By Accidents with Moving Objects. J. Comput. Civ. Eng. 2016, 30, 04015075. [Google Scholar] [CrossRef]
- Xiao, B.; Zhu, Z. Two-Dimensional Visual Tracking in Construction Scenarios: A Comparative Study. J. Comput. Civ. Eng. 2018, 32, 04018006. [Google Scholar] [CrossRef]
© 2020 by the authors. Licensee MDPI, Basel, Switzerland. This article is an open access article distributed under the terms and conditions of the Creative Commons Attribution (CC BY) license (http://creativecommons.org/licenses/by/4.0/).