Article

Experimental Investigation of Industrial Laser Cutting: The Effect of the Material Selection and the Process Parameters on the Kerf Quality

1
Department of Enterprise Engineering Mario Lucertini, University of Rome Tor Vergata, Via del Politecnico 1, 00133 Rome, Italy
2
Department of Economics, Engineering, Society, and Business Organization, Università degli Studi della Tuscia, Via del Paradiso, 47, 01100 Viterbo, Italy
*
Author to whom correspondence should be addressed.
Appl. Sci. 2020, 10(14), 4956; https://doi.org/10.3390/app10144956
Submission received: 22 June 2020 / Revised: 15 July 2020 / Accepted: 16 July 2020 / Published: 19 July 2020
(This article belongs to the Special Issue Laser Manufacturing of Advanced Materials)

Abstract

:
Laser beam cutting is a non-contact, production-flexible and highly productive technique that allows accurate profiling of a wide range of sheet materials. To these and further benefits, laser machining is increasingly being adopted by industry. This paper investigates the effect of material type, workpiece thickness, cutting speed and assistant gas pressure on cut quality for industrial-relevant applications using a CO2 laser. AlMg3 aluminum alloy, St37-2 low-carbon steel and AISI 304 stainless steel were selected to represent the most established materials in many industrial fields and gain insight into different processes (i.e., inert-assisted fusion cutting and oxygen cutting) and absorption behaviors with respect to CO2 laser wavelength. The aim was to enhance the understanding of the mechanisms through which laser cutting parameters and workpiece parameters interact in order to identify general criteria and well-optimized process parameters which guarantee the kerf quality. The quality of laser cut was analyzed in its basic terms: kerf geometry, surface roughness and cut edge quality. The experiments were performed by using a systematic experimental design approach based on Design of Experiments, and the results were validated via Analysis of Variance. Quality assessment was presented and discussed. The visual inspection of cut sections confirms good overall quality and limited presence of laser cut imperfections. The experimental investigation demonstrates that the different materials can be successfully processed within a wide range of the tested values. In addition, optimum cutting conditions which satisfy the straight requirement of the quality standard adopted are identified for each material. This study involves an analysis of both phenomenological and practical issues.

1. Introduction

Nowadays, Laser Beam Cutting (LBC) is the most widely used process in industry for cutting different sheet materials. Laser machining is capable to cut a very large range of materials that covers almost all categories (metals, composites and ceramics). This peculiarity is due to the thermal nature of the laser process that depends on the material thermal behavior rather than on its mechanical properties. Thermal energy is provided by the laser beam and converted into heat. The laser beam can be focused on the material surface to a very small spot and, being electromagnetic radiation, it does not involve mechanical cutting force, tool wear and vibration. Thus, LBC is suitable for cutting hard or brittle materials as well.
The laser beam interacts with the electrons of the material, and part of the energy is absorbed, producing a highly localized rise in temperature up to melting, vaporization or chemical state change. These different physical phenomena that govern the laser–material interaction mainly depend on chemical and physical properties of the material such as absorptivity, thermal conductivity, as well as the laser characteristics including wavelength and power density [1,2]. Melting cutting is by far the most common method for metal cutting, whereas vaporization cutting is typically used for materials with low vaporization energy and high irradiation lasers. Chemical state change cutting is used for some organic materials instead, when the increase in temperature leads to the rupture of the chemical bonds between the molecules. In melting cutting, the molten material is removed from the groove by a pressurized gas assistant jet. Depending on the material to be cut, the auxiliary gas can be inert or active. The first one protects the surface from oxidation, whereas the second one (usually oxygen) generates an intense exothermal reaction that increases the temperature of the cutting area, thus allowing thicker cuts and higher speeds.
Compared to plasma cutting, laser machining offers several benefits such as automation capability and reduced production costs, and it provides higher-quality kerfs [3], even though it allows cutting thinner sections.
The main limiting factor of the LCB is the high temperature reached in the process, and the consequent thermal damage induced into the material machined, such as the formation of Heat Affected Zone (HAZ), recast layer, drag line and slag attachment.
CO2 gas laser and solid-state laser are the most established types of lasers for industrial cutting of metals. CO2 gas lasers (λ = 10.6 µm) are widely adopted because of their high output power and good beam quality. However, high power efficiency, ease of beam guidance, high beam quality and ten times shorter wavelength are some of the advantages of solid-state disk and fiber lasers [4]. Indeed, very different wavelengths lead to diverse absorption behaviors. Steel has acceptable absorption for CO2 laser generated wavelength. Conversely, solid-state lasers (also known as 1 µm radiation) have found a niche application in industrial-scale laser cutting of highly reflective materials such as copper, aluminum and gold [5]. However, CO2 laser cutting of aluminum alloys, although not common, may be of industrial interest. The use of a higher-power source, such as CO2 laser source, combined with highly pressurized assistant gas may overcome these limitations.
Solid-state disk and fiber lasers provide better performance in melting cutting of thin stainless steel sheets (up to 2 mm) with nitrogen as assisting gas, due to the higher beam quality. Under these conditions, solid-state lasers achieve considerably higher cutting speed and surface quality than CO2 lasers. Nevertheless, the spread between the maximum cutting speeds is reduced when increasing sheet thickness. Conversely, in oxygen-assisted laser cutting, solid-state lasers and CO2 lasers exhibit comparable performances in term of cutting speed and cut edge quality. The reasons of this behavior have not yet been fully understood. Possible explanations are concerned with material removal, recoil pressure, cut front absorptivity, primary losses and multiple reflections [6]. As a consequence of the intense laser-material energy transfer, these effects may reduce the effective laser beam intensity at the cut front surface. Indeed, the capacity of the material to absorb the laser radiation is dependent on the coupling between the laser beam and the cut front. The absorptivity of CO2 laser radiation is optimal when the incident angle is close to 90°, while the maximum absorptivity of solid-state laser radiation is achieved for smaller angles. In thick section cutting, the cut front inclination usually is close to 90°, and it depends on the cutting speed [7]. In laser cutting of medium and thick sheets, the absorptivity of ferrous alloys to 1 µm radiation on the surface of the cut front can be lower than its theoretical optimum; this issue can be addressed to the inclination angle of the cut front. As consequence, in these applications, the absorptivity of the CO2 laser beam can be even higher than that of the solid-state laser beam. In addition, the distribution of the coefficient of absorptivity on the cut front is more uniform in CO2 laser cutting, whereas it shows a large drop in the middle of the workpiece thickness in fiber laser cutting [8]. The minimum roughness is related to the absorbed laser energy per unit volume of the removed metal for both laser types regardless of thickness [9].
In the present work, a CO2 laser was adopted because it outperforms solid state laser in cutting of thick sheets due to the higher effective laser beam intensity. Moreover, in CO2 laser cutting of thick sections, the higher kerf width of CO2 lasers exerts a major role in facilitating the melt removal.
LCB is strongly influenced by process parameters; therefore, proper selection of process parameters is required to minimize the amount of energy transferred to the material during machining in order to reduce the thermal damage. To date, a large number of experimental and theoretical investigations have been performed on the LBC of metals. Rajaram et al. [10] used regression analysis to describe the combined effects of laser power and cutting speed on kerf width, surface roughness, size of HAZ and drag line of 4130 steel. It was reported that low feed rate results in smooth surface and low drag line frequency. Radovanović et al. [11] developed ANN models for predicting cut quality of CO2 nitrogen cutting of AISI 304 stainless steel and proposed operating diagrams in support of the parameter selection. The melt removal rate in laser cutting of thick-section stainless steel was characterized by Wandera et al. [12]. It was demonstrated that the efficiency of the melt removal from the cut kerf is affected by assisting gas pressure, nozzle diameter and focal point position. The effect of oxygen in laser cutting of low-carbon and medium-carbon steel was investigated by Shaparev [13]. It was established that the use of oxygen as an auxiliary gas allows the reduction of power and the increase in cutting speed. A mathematical model to predict the drag line width and drag line frequency on stainless steel was developed by Yilbas [14]. It was shown that mechanisms such as molten solidification, gas dynamics and fluctuation of power are associated with the formation of drag lines. Sharifi et al. [15] investigated the effects of process parameters on cutting region temperature and cut edge quality in Nd:YAG laser cutting of AL6061T6 alloy. It was concluded that the laser power density, which in turn depends on the nozzle standoff distance, has a major effect on the cutting region temperature and cut edge quality when the sheet thickness increases.
Most of the research studies focus on specific materials or a group of materials which belong to the same categories regarding the physical properties and chemical composition. Only a minority of these works concern LCB of different metals [16,17].
This paper investigates the effect of material type, workpiece thickness, cutting speed and assistant gas pressure on cut quality in industrial laser cutting of different materials. The quality of cut is of the utmost importance when high degree of precision and accuracy are required. The evaluation of cut quality was based on kerf geometry (kerf width and perpendicularity deviation), surface roughness and cut edge quality. The materials used in this experimental investigation were selected to represent the most commonly used materials in many relevant industrial fields, the aim being to find general criteria and well-optimized sets of process parameters. AlMg3 aluminum alloy and AISI 304 stainless steel were used to investigate nitrogen-assisted fusion cutting with different absorption behaviors with respect to CO2 laser wavelength, whereas St37-2 structural steel was chosen to study oxygen-assisted laser cutting. A factorial design was developed and tested by varying process parameters. The kerf width, taper angle and surface roughness were measured and analyzed. Analysis of Variance (ANOVA) was applied and discussed to study the combined effects of cutting laser parameters and workpiece parameters on the quality output. Finally, a visual inspection of kerf sections was carried out in order to exclude slag formation, uncut area and irregularities on the cut faces.

2. Materials and Experimental Procedure

2.1. Materials

The experimentation was performed on samples of AlMg3 aluminum alloy (EN AW-5754, UNS A95754, 51000), St37-2 low-carbon steel (EN S235JR, ASTM A283C, 1.0037) and AISI 304 stainless steel (EN X5CrNi18-10, AISI 304, 1.4301). The chemical composition and properties declared by the manufacturers are reported in Table 1 and Table 2, respectively.
Aluminum and its alloys exhibit a high strength-to-weight ratio, corrosion resistance and weldability. Given to their considerable properties, Al-alloy sheets are used to produce structural parts for industrial applications in aeronautic, automotive and other relevant technological fields. Aluminum alloys are cut with the use of inert gas, usually nitrogen. More specifically, AlMg3 is an aluminum–magnesium alloy (5xxx series), suitable for cold-forming and welding, which exhibits better corrosion resistance and higher mechanical properties than pure aluminum. As for pure aluminum, AlMg3 is characterized by high thermal conductivity. Heat transfer plays a critical role in laser cutting performance. Since thermal conductivity refers to the rate at which heat is removed from the cutting area, low thermal resistance increases heat dissipation, resulting in lower energy available to the machining and, consequently, higher energy consumption and loss of efficiency. Moreover, heat removal may result in cooling of the molten metal on the underside of the kerf, tapered edge and slag formation [18]. Furthermore, light reflective metals, such as aluminum alloys, may reduce the maximum cutting speed and require more power density to initiate the cut [5].
Steel and its alloys are widely employed in many industries because of their combination of strength and ductility. Steel is typically cut by using oxygen as assisting gas. St37-2 is a structural carbon steel characterized by relatively low hardness and prone to corrosion. Experimentally it was found that the thermal power contribution released by the oxidation reactions of steel is about equal to the power provided by the laser beam (per unit of length). As a result, it is possible to increase the cutting speed or the thickness of metal being cut. Furthermore, the use of oxygen as an assisting gas introduces an element of complexity into the laser cutting of low-carbon steel. In oxygen-assisted laser cutting, the laser beam heats the material to the ignition temperature, and forced burning of iron in oxygen occurs. Therefore, the end product quality depends on the thermal balance of two distinct cutting fronts. When the reaction front dominates, the cutting process results in poor surface quality (side burning).
Compared to steel, stainless steel provides further benefits such as corrosion resistance and oxidation resistance, and it is used in a large variety of applications. Due to the high melting temperature and low viscosity of the oxides generated from the reactions of iron and other alloy elements, oxygen laser cutting of high-strength steel is a more difficult task [19]. Therefore, the use of inert gas is commonly preferred when cutting stainless steel. In particular, AISI 304 is a non-magnetic austenitic stainless steel. It is composed of chromium (~18%) and nickel (~10%) with iron and other elements. Fatigue strength is enhanced by the addition of N (nitriding), induction surface hardening or through cold forming. Thus, AISI 304 is characterized by good weldability and toughness. However, in laser cutting of stainless steel, the exothermic reaction of iron is complicated by the presence of these alloy elements. Therefore, when tight tolerances are required, the use of an inert gas such as nitrogen, argon or helium is suggested [20].

2.2. Equipment

The experimental tests were performed by using a TRULaser 3040 by TRUMPF, equipped with a 5000 W CO2 TruFlow source. 
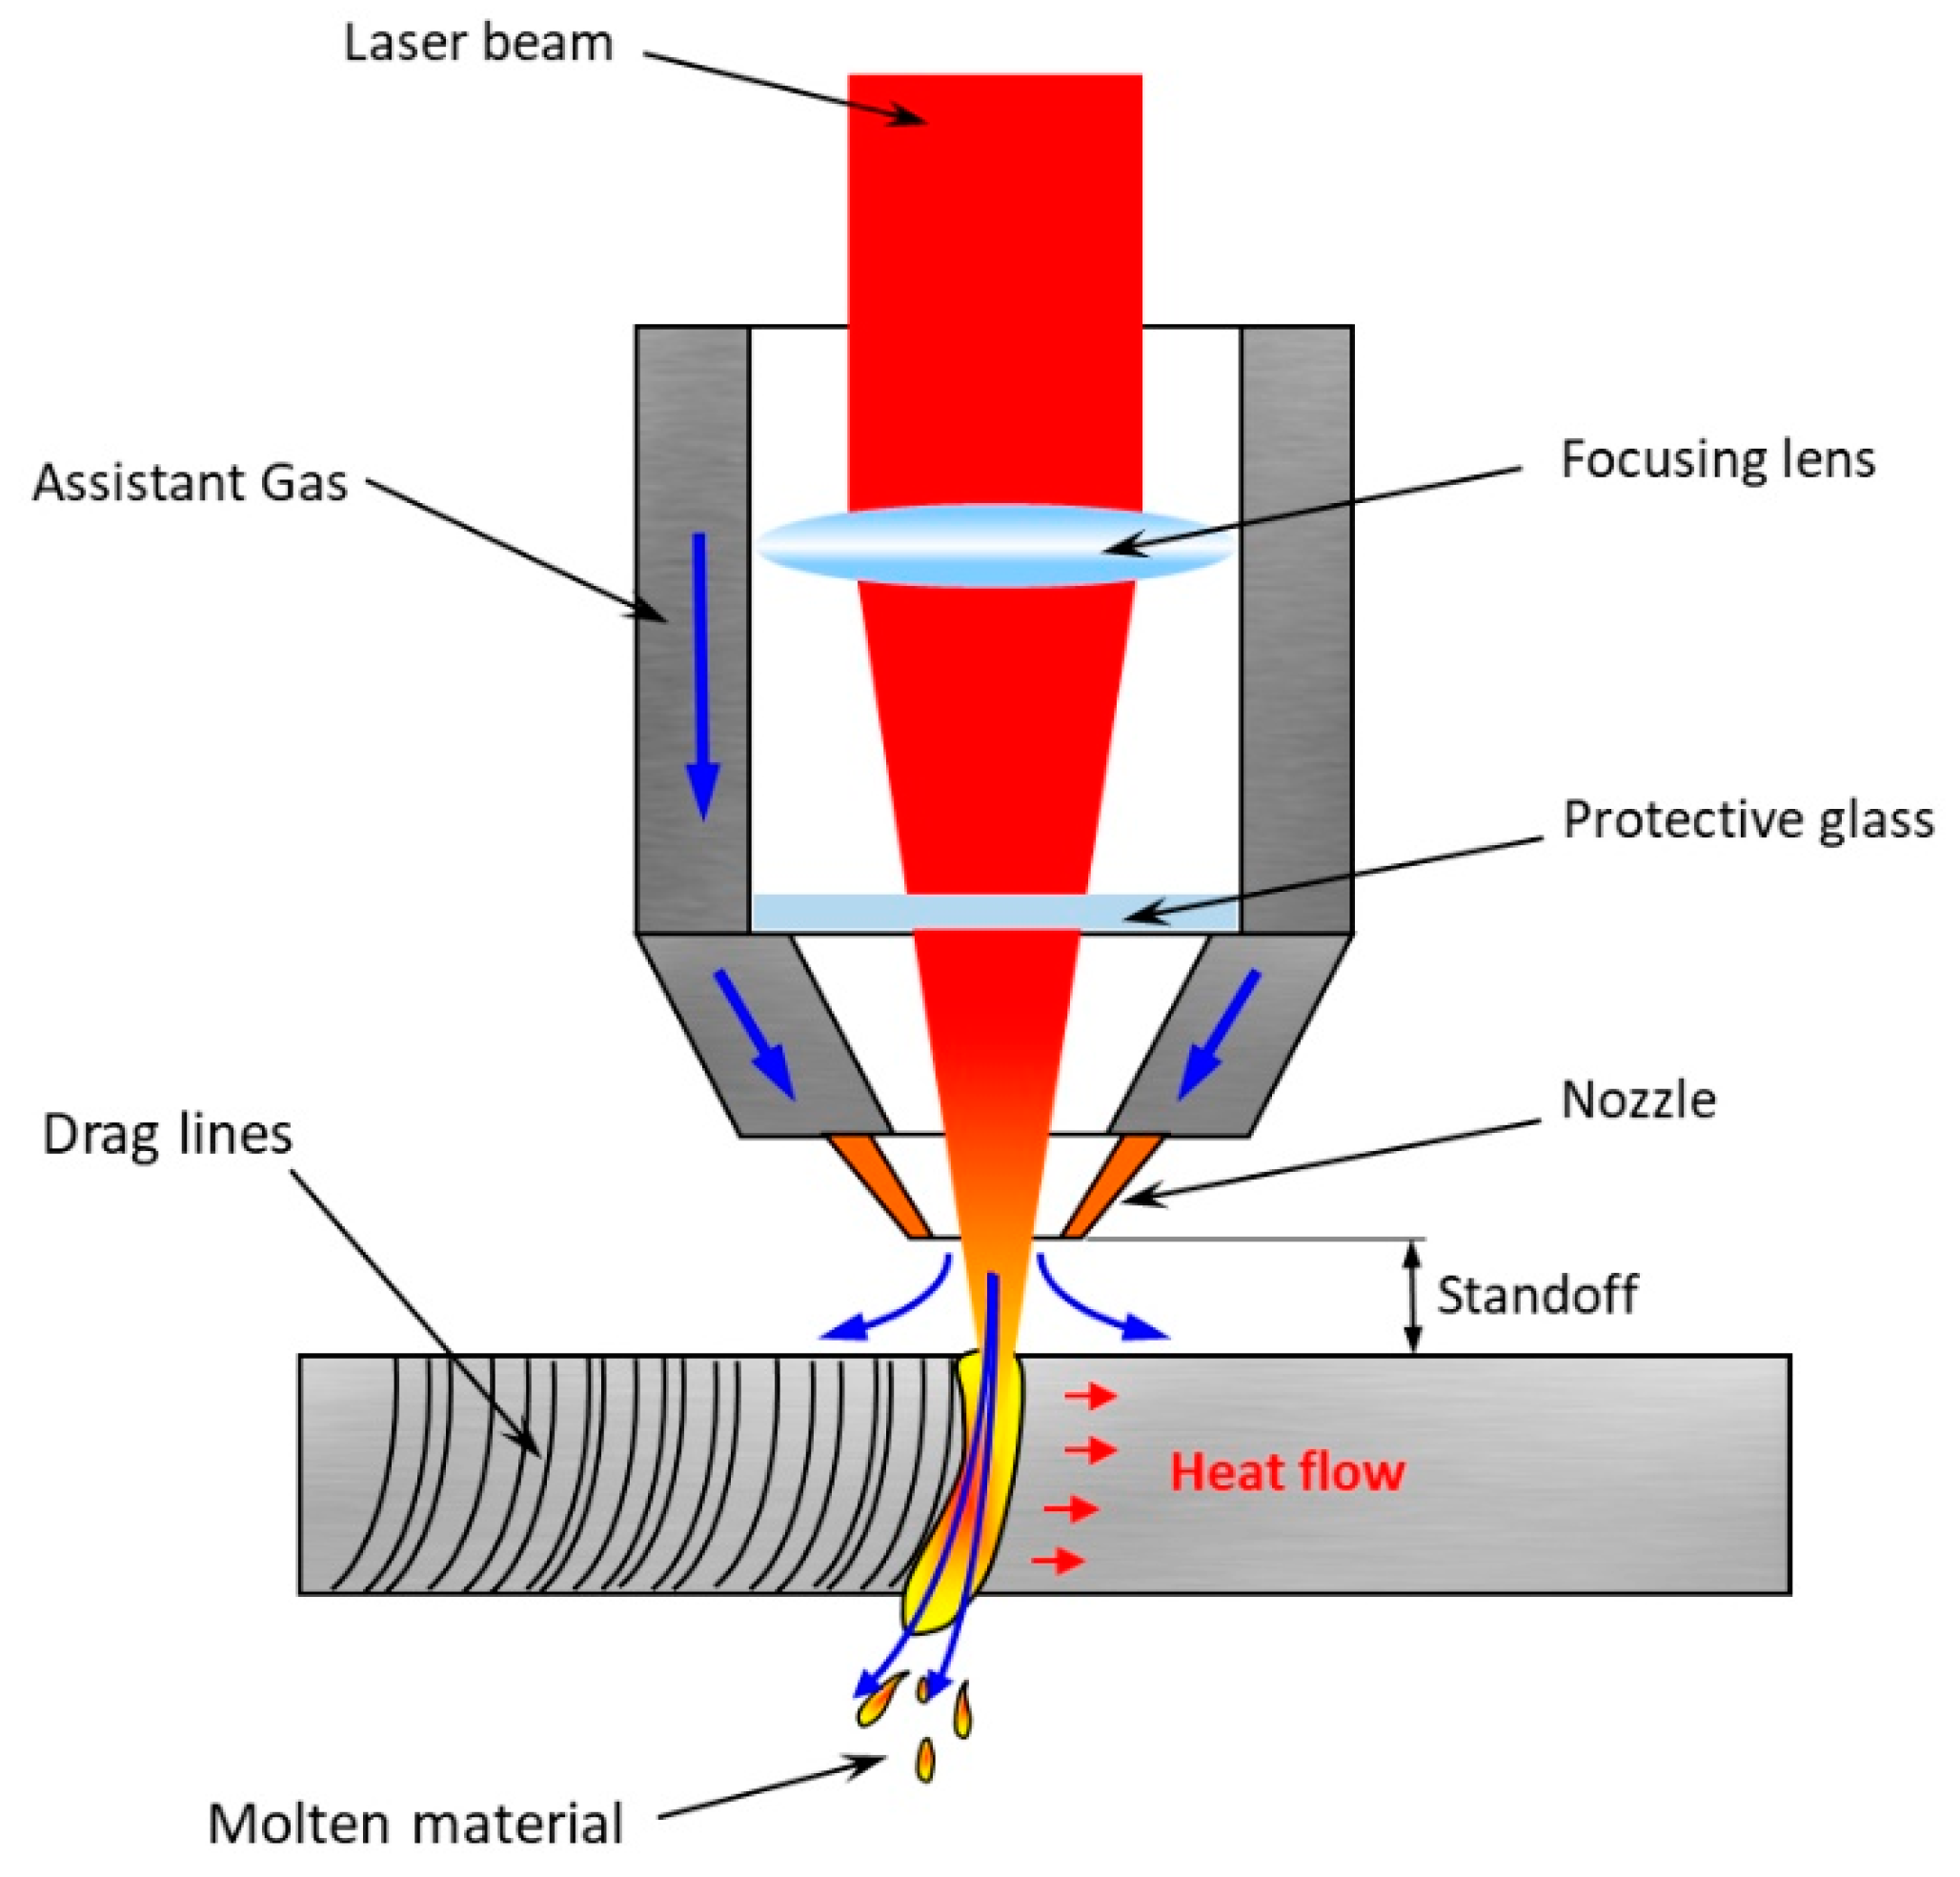
Figure 1 shows the schematic of the experimental setup used for testing where the relevant items involved in the laser cutting process are indicated. The laser system was controlled by means of a Computer Numerical Control (CNC) system. The assisting gas was ejected coaxially through the conical nozzle of the cutting head. A lens system focused the laser beam on a spot with diameter of ~0.3 mm. The beam intensity distribution in the focal spot approximated to the Gaussian distribution. The main features declared by the manufacturer are listed in Table 3.

2.3. Experimental Procedures

The selection of process parameters is of fundamental importance in order to achieve dimensional accuracy, smooth surface and cut edge quality. Therefore, the range of parameters to be tested was identified on the basis of pre-design tests and literature studies. For each material the best-known practice was adopted. As for the assistant gas, AlMg3 and AISI 304 were cut by using nitrogen, whereas St37-2 was cut with oxygen. The assisting gas was ejected coaxially through the conical nozzle of the cutting head. Adjustments of the nozzle diameter allow pressure stabilization and avoid turbulence in the melt. In general, common values for the nozzle diameter are in the range 0.8 - 3 mm, according to material and thickness. The assisting gas jet provides the mechanical action required to drag the molten metal from the kerf, and it forms a boundary layer over the molten surface in which heat transfer occurs, thus avoiding overheating [21]. Furthermore, in oxygen-assisted cutting, the active gas provides an additional thermal contribution to the energy balance. In general, in oxygen-assisted laser cutting, the active gas is injected into the cutting area with a pressure of approximately 0.2–0.6 bar depending on thickness, whereas the injection pressure of nitrogen is considerably higher (of about 16 bar for 10 mm thick sheets).
In inert gas-assisted cutting, the focus position is typically placed on the top or below the surface (negative focus position) to facilitate the inlet of the assisting gas and the ejection of the molten material. Conversely, in oxygen-assisted cutting, the focus position is generally set on the upper surface of the workpiece to rapidly trigger the oxidation reaction, especially for cutting thick sections [22]. Proper setting of the focus position reduces loss of beam intensity and defocusing. Consequently, optimal focal position and nozzle diameter were found for each condition (material-interaction mechanism) at standard standoff distance and kept constant throughout the experimentation.
Cutting speed has a significant influence on material removal and cut front temperature because it governs the laser–material interaction for a given output power. Unsuitably low cutting speeds lead to under-utilization of laser beam energy, whereas excessively high cutting speeds (exceeding a critical threshold) result in a loss of the cutting conditions. Then, once the beam focus was established (depending on the gas type), the maximum cutting speed for each material was found by increasing the cutting speed as long as continuous through-thickness cut was obtained.
In order to study the influence of process parameters on geometrical accuracy and kerf quality, a 32 × 22 full factorial design was developed according to the Design of Experiment (DoE). This is a very effective approach for planning experiments that provides valid and objective results using ‘factorial designs’, in which the factors are changed simultaneously to verify a great number of factors and their interactions without the need for a large number of experimental runs, thus reducing development time and efforts. The control factors adopted were material and thickness as regards workpiece parameters, cutting speed and pressure as regards process parameters. In order to implement the aforementioned method, it is important to normalize the values of numerical parameters.
Two levels of cutting speed were adopted corresponding to 100% and 50% of the maximum cutting speed. The same was applied to the limiting assistant gas pressure. However, it was decided to not include in the experimentation the condition 50%–50%, corresponding to the combination of the low levels, because it was considered not a sufficient condition for ensuring adequate cutting. Therefore, the reduced factorial design consisted of 27 tests. For each condition, two replications were performed. Laser parameters adopted in experimental tests and the control factors (in coded mode) are summarized in Table 4 and Table 5, respectively.
Laser cutting of each sample was performed by varying process parameters in accordance with the experimental plan. Parallel cuts in a comb-like configuration were made on samples (as shown in Figure 2) in order to carry out geometrical analysis and quality assessment of sections.
Aiming to identify the cutting parameters which have a significant influence on kerf quality and assess the adequacy of the developed regression empirical models, Analysis of Variance (ANOVA) was carried out at a confidence level of 95% (α = 0.05). The p-value was used to determine the significance of control factors and their interactions; thus, main effects and first-order interactions are significant when p-value is less than 0.05. The statistical analysis was performed by means of Minitab® R18 software.
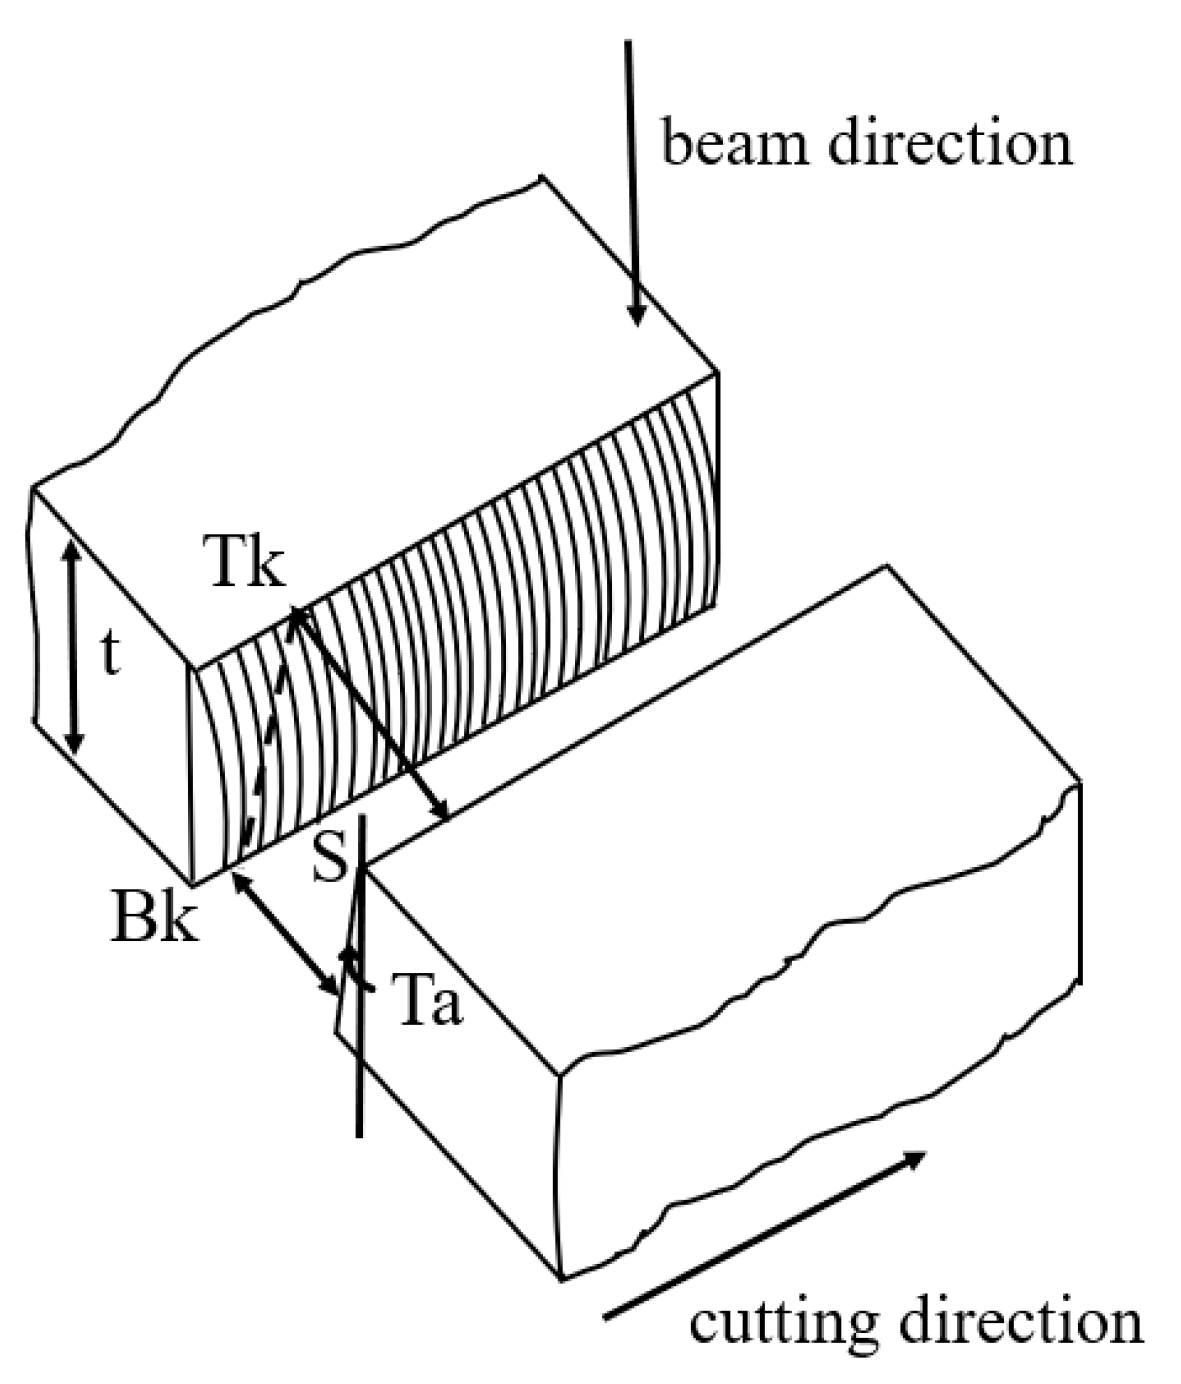
Following the tests, the main response variables which best expressed the geometrical and quality characteristics of kerfs were selected and measured. It is worth noting that in laser cutting the cut edges will never be completely square, but the side walls tend to form a slight v-profile. Therefore, the kerf width generally decreases along with the cutting direction because of heat accumulation at the inlet of the laser beam. To consider the widening of kerf, suitable measurements were taken at different heights starting from the upper surface of the specimens as illustrated in Figure 3. In particular, six measurements of the kerf width were collected from the upper workpiece surface (top kerf, Tk) and the same number were acquired from the workpiece bottom surface (bottom kerf, Bk) proceeding in the beam direction. In addition, the taper angle (Ta) and the section of material removed (S) were computed by Equations (1) and (2):
Ta = tan−1⁡ [(TkBk)/2·t]    [°]
S = (Tk + Bkt/2    [μm2]
where t is sheet thickness.
To highlight the dependence of geometrical response variables on the position at which their measurement was taken, the position was included in the statistical analysis as a control factor. It is useful to point out that it would be more correct to consider the position as a covariate, but the ability to discriminate between response measurements representing different levels of position would be lost. Furthermore, assuming the position as a control factor, it is possible to verify the effect of its interaction with the other control factors on the variables of interest. The geometrical response variables were measured using a 3D digital video microscopy system (Hirox KH-8700) equipped with MXG-2500 ‘revolver’ optics. 3D images of kerf sections were produced by continuously stacking the depth of field in the vertical axis, focus point to focus point, and simultaneously scanning the surface in the horizontal axis.
The roughness of the side cut surface is a typical issue of laser beam cutting and a critical factor for laser cut quality. The formation of a drag line arises from irregularity in the laser beam process such as small drifts or disturbances, solidification of melted material and curvature of the cut front. The cut surface roughness was measured in terms of arithmetic mean surface roughness (Ra), surface roughness depth (Rz) and mean width of profile elements (RSm) perpendicular to the cutting direction, on an evaluation length of 20 mm with a spacing of 2 µm (in accordance with ISO 4287:1997). The roughness profiles were measured using an inductive profilometer (Taylor Hobson Talysurf CLI 2000) equipped with a spherical diamond tip (2 µm radius) and processed by means of a surface analysis software (Talymap Universal 3.1.4). Since, as known, surface roughness is generally worse in the bottom edge, roughness measurements were executed at different heights of the workpiece thickness on each side of the cut. Profiles were acquired on the cut surface in the upper workpiece surface (L1), in the middle of the workpiece thickness (L2) and in the lower workpiece surface (L3), as shown in Figure 4.
Finally, in accordance with UNI EN ISO 17658:2015, a quality assessment was carried out by visual inspection to ensure that no imperfections such as deviation of drag line, adherent slags and microcracks occurred on the cut surface.

3. Experimental Results and Discussion

3.1. Effect of Process Parameters on Kerf Geometry

A preliminary inspection was conducted to identify nonvalid cuts (i.e., presence of holes, material projections or uncut areas). This leads to the exclusion from the subsequent analysis of those cutting conditions which do not guarantee suitable kerfs. More specifically, cuts performed on 6 mm thick St37-2 steel using 50 and 100% of gas pressure and cutting speed, respectively, were found to be incongruous, and consequently their kerf width was omitted. Top and bottom kerf widths are illustrated in relation to cutting speed (Cs) and gas pressure (P) in Figure 5, Figure 6 and Figure 7. It can be observed that the kerf width of each material decreased at the decrease of thickness, in accordance with the behavior found in literature [23]. Since the amount of material to be removed increased with thickness, in laser cutting of thick sections, a greater energy contribution was required to obtain through-thickness cuts, which leads to a longer interaction time and increases the thermal erosion. Furthermore, the efficiency of laser beam decreased with increasing workpiece thickness, owing to conductive losses. Therefore, as it was expected, the minimum kerf width of each material was obtained at the thinnest sections. The comparison between top and bottom kerf widths highlights different shapes of kerf profiles. In most cases (and more precisely in the totality of cases when relating to AISI 304), kerf profiles exhibited the typical slight v-profile or parallel-sided sections. More rarely, the kerf profiles widened slightly at the bottom edge of the workpiece.

ANOVA Results for Kerf Geometry

The ANOVA results for geometrical variables are summarized in Table 6, where significant items are indicated in bold. The ANOVA assumes that observations are independent and normally distributed with equal variances between treatments (homoscedasticity). These assumptions were successfully checked using the graphical examination of residuals [24]. However, for the sake of brevity, its results were not included in this analysis. The statistical analysis proved that all main effects were significant at a confidence level of 95%, with the exception of gas pressure and cutting speed for Tk and S, respectively. It is noticed that the greatest effect or significance (which corresponds to the highest F-value) in relation to the top kerf width was certainly obtained by varying the piece thickness. Conversely, Bk was strongly influenced by the material type, followed by thickness and gas pressure.
Figure 8 and Figure 9 illustrate the main effects plot for Tk and Bk. The increase in the cutting speed reduced the top kerf width, whereas in contrast the bottom kerf width increased. Indeed, at high cutting speed, the irradiation time between the laser and the material was reduced, and consequently, Tk decreased as the result of the lower energy provided. Conversely, the increase in Bk as the cutting speed increased, although more contained, was unexpected. In the range of tested values for cutting speed, this result could be explained by the change in cut front inclination. At the maximum cutting speed (industrial relevant high cutting speed), the cut front was entirely irradiated by the laser beam, and the temperature of the molten metal at the bottom edge of the workpiece increased [25]. Moreover, Bk decreased when the assisting gas pressure increased, owning to the enhancement of the drag force, which facilitates the effective removal of melt from the groove. As it was expected, position was a significant factor in both Tk and Bk models. From the main effects plot in Figure 8, it is possible to observe that Tk first decreased and then increased gradually with position. This curvature also occurs in Figure 9, where conversely Bk first increased and then decreased with position. The curvilinear shape is explained by the existence of different shapes of the cutting profile, as previously mentioned. Furthermore, narrower kerfs were obtained at small thicknesses, beyond which the kerf width started to widen as the thickness increases. Top and bottom kerf widths showed linear trends in relation to thickness which were very similar to each other. Moreover, since aluminum and its alloys are highly reflective metals, laser cutting of AlMg3 needs more energy input to initiate the cut, thus resulting in larger Tk, in accordance with Ref. [19]. The regression model for Tk reached acceptable adequacy index R-sq of 68.93%, whereas that calculated for Bk was at 76.70%. As it was expected, the taper angle was mainly influenced by the material type. In Figure 10, it is possible to observe that laser cutting of AlMg3 generally produced parallel sided-sections, whereas laser cutting of AISI 304 resulted in the typical v-profile, and laser cutting of St37-2 led to a slight widening of kerf. The latter probably originates by the exothermal reaction. Indeed, in oxygen-assisted cutting, the high-temperature molten metal that is not ejected from the cutting area by the assisting gas adheres to the lateral surface and continues the oxidation reaction (side burning) [26]. Clearly, Ta depends on both top and bottom kerf widths since it was calculated by Equation (1). More specifically, Ta decreased when increasing cutting speed or decreasing workpiece thickness because Bk widening exceeded that of Tk, and it decreased as the gas pressure increased owing to the significant reduction of Bk. Concerning the effect of position on the taper angle, the same considerations applied as for Tk and Bk. The main effects plot for S is illustrated in Figure 11. The section of material removed linearly increased with thickness, and being related to Tk and Bk by means of Equation (2), it was strongly affected by the kerf width. Furthermore, as it was expected, S was insensible to the change in cutting speed, and the impact of position was negligible as well. The adequacy of fit for the regression models of Ta and S was 71.88 and 94.5%, respectively.
The most statistically significant two-way interactions are shown in Figure 12. The widening of Tk with the decrease in cutting speed was significantly lower, or even eliminated in laser cutting of AISI 304. This effect was also observed for Bk and Ta, which was derived from the kerf width. A possible explanation lies in the range of values selected for AISI 304: as for cutting aluminum alloys, a relatively low cutting speed is more advisable (owing to the high thermal conductivity), in laser cutting of steel, the increase in cutting speed, where possible, could lead to better interaction of the laser beam. The laser beam utilized to the fullest may increase the temperature in the cutting zone, which is likely to result in kerf widening. This explanation has also been proposed with respect to the widening of Tk observed in the main effects plot. The interaction plot of material and thickness shows that, in laser cutting of AlMg3, the widening of kerf width was aggravated with the increase in thickness more than other materials, and this also applied to Bk. AlMg3 is less suitable for CO2 laser cutting of thick sections because of its high reflectivity.

3.2. Effect of Process Parameters on Surface Roughness

The side cut appears as a finely grooved surface with regular patterns or drag lines. From the observation of the cutting surface, it is generally possible to distinguish three different zones moving downward in the cutting direction: the upper edge of cut, which is characterized by lower surface roughness; the lower edge of cut, which exhibits higher surface roughness and, in some cases, slug; and the middle of the edge of cut, which is an intermediate roughness surface. The roughness profiles were acquired for each of these zones and analyzed separately. The formation of drag lines is a complex and still less-known mechanism involving at the same time thermodynamic, fluid-dynamic and optical phenomena, small process drifts and disturbance. The waviness or finish of the surface was defined by parameters of amplitude (vertical displacement of the profile) and spacing (the sizes of the irregularities along the surface). Arithmetic mean surface roughness (Ra), surface roughness depth (Rz) and mean width of profile elements (RSm) are the most commonly used when approaching the evaluation of the surface roughness of cut edge.

3.2.1. ANOVA Results for Surface Roughness

The ANOVA results for surface roughness are summarized in Table 7 and Table 8, where significant items are indicated in bold. Ra_L1 was found to be affected by material, thickness and mostly M*Cs (%) interaction. Ra_L2 in addition was influenced by the cutting speed, whereas Ra_L3 was dependent only on material. Rz_L1, Rz_L2 and Rz_3 exhibited the same behaviors of Ra; therefore, their statistical analysis was not reported in this work for the sake of brevity. RSm_L1 was only influenced by material and thickness, whereas RSm_L2 was also affected by cutting speed, pressure and t*P (%) interaction. Finally, RSm_L3 was dependent on all the main factors and M*Cs (%) interaction.
The main effect plots for Ra_L1, Ra_L2 and Ra_L3 are reported in Figure 13. It is noticed that laser cutting of AlMg3 resulted in the highest value of Ra, whereas laser cutting of AISI 304 exhibited the lowest. Furthermore, the arithmetic surface roughness of AlMg3 significantly increased along the laser beam direction, whereas that of AISI 304 remained practically unchanged. St37-2 shows only a moderate increase in Ra. As the melt flows along the laser beam direction, the melt film thickness increased, and the hydrodynamic phenomena in the lower workpiece surface became increasingly important. When the melt viscosity and surface tension were high, the melt accumulated at the bottom of the cut groove where it solidified, creating surface ripples. The main power losses were related to thermal conduction followed by convective cooling performed by the assisting gas [27]. Therefore, this effect was less evident in laser cutting of stainless steel due to its relatively low thermal conductivity.
As expected, the lowest arithmetic surface roughness was achieved in laser cutting of thin sections. However, Ra_L3 was found to be unaffected by thickness, since complex phenomena such as overheating, turbulence and slag formation in lower edge of cut can hide the surface roughness. Since Ra is generally measured at one-third of the thickness, this result agrees with previous research [28].
A general decrease in Ra_L2 (that is indicative of the mean surface roughness) was observed when the cutting speed increased. This experimental result, which is apparently in contrast with those of other research studies, can be examined in greater detail in the interaction plot reported in Figure 14. As it was expected, in laser cutting of AlMg3 the lowest value of Ra_L2 (2.68 µm) was achieved at low cutting speed (compared to Ra_L2 = 4.25 µm obtained at high cutting speed), in accordance with the results given in Ref. [19]. In contrast, in laser cutting of St37-2, a higher speed provided the lowest value of Ra_L2 (of ~1.01 compared to 4.41 µm). This behavior could be explained in view of the outcomes described in Ref. [10]. The trend of surface roughness may depend on the range of cutting speed being considered. Indeed, there was a specific range of cutting speed at which Ra was minimum. The arithmetic surface roughness decreased with cutting speed until it reached that optimum, to increase once such threshold was exceeded. Another possible explanation lies in the occurrence of side burning at lower cutting speed, as proposed in Ref. [14]. Finally, AISI 304 was found to be insensitive to changes in cutting speed (~1.63 µm). It is useful to note that this interaction is also found to be significant for geometrical variables.
For extensive analysis of the cutting surface morphology, the spacing parameter RSm was selected. From the statistical analysis, RSm_L1 was only affected by workpiece parameters (i.e., material and thickness), whereas RSm_L2 and RSm_L3 were influenced by all the main effects. The only two significant interactions were t*P (%) and M*Cs (%) for RSm_L2 and for RSm_L3, respectively. As shown in Figure 15, laser cutting of AlMg3 provided the lowest value of RSm, followed by laser cutting of AISI 304, whereas laser cutting of St37-2 resulted in the highest. Moreover, unlike the amplitude parameters, RSm_L2 and RSm_L3 increased when increasing cutting speed. More specifically, this result mainly occurred in laser cutting of AISI 304, as shown in Figure 16. In addition, the mean width of profile elements slightly increased when cutting AlMg3, indicating a small irregularity in the drag lines due to the light-reflectivity and heat-conductivity of this material, in line with Ref [16]. In laser cutting of St37-2, similar to Ra and Rz, RSm also increased from 0.27 to 0.29 mm as the cutting speed decreased. According to the cycling side burning theory, side burning occurs at cutting speeds smaller than the reaction front speed, resulting in the formation of periodic patterns [29].
Furthermore, it was found that RSm decreased with thickness. As for the gas pressure, t*P (%) was found to be significant. The interaction plot for RSm_L2 showed that, in laser cutting of thin sections, the spacing parameter decreased at lower gas pressure (from 0.24 to 0.18 mm). The adequacy of fit for the regression models of roughness parameters was in the range of 66.96–96.65%.

3.2.2. Quality Assessment

In order to highlight the interdependence of laser parameters, the computed values of roughness parameters of each material and thickness (averaged over the three profiles acquired on both sides of kerf) are illustrated in relation to cutting speed (Cs) and gas pressure (P) in Figure 17, Figure 18 and Figure 19. It is possible to note that laser cutting of AISI 304 exhibited good surface roughness for all the tested conditions, and thickness had a major impact on Ra (Figure 20a,b). Conversely, laser cutting of AlMg3 showed the highest surface roughness, in particular at the maximum thickness. The worst conditions in absolute terms occurred when cutting 6 mm thick AlMg3 at high cutting speed and gas pressure (Figure 21a), showing that despite the low melting point of aluminum alloys, the high thermal conductivity and light reflectivity required more energy to produce a fault-free cut edge.
Laser cutting of St37-2 achieved the lowest values of Ra, except for laser cutting of 5 mm thick sheet with low cutting speed and high gas pressure (Figure 22b) and 6 mm thick sheet at the same conditions. The latter indeed was found to be unsuitable, and it was excluded by the preliminary inspection. In contrast, the best cutting conditions were identified at high cutting speed and gas pressure. The lowest surface roughness in absolute terms was achieved in laser cutting of 2.5 mm thick St37-2 with low cutting speed and high pressure (Figure 22c). From the comparison of roughness parameters, it is possible to conclude that the increase of the cutting speed in the range of tested values resulted in a smooth but more irregular surface in the lower edge of the cut when cutting AISI 304, as shown in Figure 20b,c. Moreover, it led to the worsening of the cutting surface in laser cutting of AlMg3 (Figure 21a,b) and improvement of cutting surface when cutting St37-2 (Figure 22a,b). The quality assessment of cut sections was carried out in accordance with the standard ISO 17658:2015 by visual inspection. This standard defines the imperfections in laser beam cutting and the dimensional tolerances.
From the microscope observations it is possible to conclude that kerf sections exhibited a good overall quality, with parallel drag lines and negligible presence of defects shown in the images below. In Figure 20c, it is possible to observe small removal of material in the lower cut face area. Since AISI 304 is rich in alloy elements, the hole formation originated from the change in composition related to the laser heat [30]. In addition, the risk of appearing of pittings in laser cutting of AISI 304 increased at high cutting speed, in line with Ref. [19].
As for AlMg3, in some cases thick samples showed slag adhering to the bottom cut edge due to the cooling of molten metal at the outlet of the groove (Figure 21b). Indeed, in laser cutting of aluminum alloys the melt exhibits higher viscosity than that of molten iron since the thermal conductivity is significantly higher and heat is rapidly dissipated through the material. Moreover, the increasing in cutting speed enhances the drag line curvatures as shown in Figure 21a,b.
Deviation of drag lines is found in laser cutting of St37-2. In Figure 23 it is possible to observe a pronounced advancement of drag lines in the cutting direction followed by an excessive curvature, which could be the curved-drag lines effect of the increase in cutting speed [31]. This effect was accentuated by the use of oxygen. Indeed, the oxidation reaction of oxygen and iron generates a change in the chemical composition with the formation of a lower-viscosity mixture of Fe/FeO than pure iron, Ref. [25].
Finally, cut quality was affected by the hydrodynamic interaction between the melt formation and the melt removal through the action of the high-pressure assisted gas jet. In nitrogen-assisted fusion cutting of thick sections of AlMg3, it was possible to observe the transition from the laminar flow regime into a turbulent boundary layer before the material was dragged away from the kerf, when the assisting gas pressure was not sufficient to sustain the laminar boundary layer throughout the entire cut thickness, consistent with the behavior described in Ref. [12]. The boundary layer separation point corresponding to a significant increase in the surface roughness is highlighted in Figure 24.

4. Conclusions

This paper focuses on the effect of material type, workpiece thickness, cutting speed and assistant gas pressure on cut quality in laser beam cutting of different engineering materials, namely AlMg3 aluminum alloy, St37-2 low-carbon steel and AISI 304 stainless steel using a 5000 W CO2 industrial laser. The evaluation of cut quality was based on kerf geometry (kerf width and taper angle), surface roughness and cut edge quality. The main results can be summarized as follows.
The quality assessment of cut sections (in accordance with the standard ISO 17658:2015) confirmed a good overall quality and limited presence of laser cut imperfections since no solidified droplets, irregularity of face profile and burning of surface were observed. The overall top kerf width, bottom kerf width and taper angle were in the ranges of 599.90 ± 106.85 µm, 562.06 ± 280.01 µm and 0.83 ± 2.48 degrees, respectively.
Concerning kerf geometry, the top kerf width was mainly affected by the workpiece thickness. Conversely, the bottom kerf width was strongly influenced by the material type, thickness and gas pressure. The decrease in the cutting speed increased the kerf width as a result of the higher energy provided. The latter was less visible in the case of the stainless steel cutting. It is proposed that, in the range of values selected for laser cutting of AISI 304, the increase of cutting speed, where possible, enhanced the irradiation of the cut front, thus increasing its temperature toward the bottom. The taper angle was mostly affected by the material type.
As for the side kerf roughness, it was found that laser cutting of AlMg3, which exhibited the worst absorption of CO2 laser radiation, resulted in the highest value of Ra, whereas laser cutting of AISI 304 exhibited the lowest. Furthermore, the arithmetic surface roughness of both AlMg3 and St37-2 increased along the laser beam direction, whereas, in contrast, that of AISI 304 remained practically unchanged. The ANOVA results showed that the arithmetic surface roughness was mainly affected by the interaction between material and cutting speed. In addition, RSm increased when increasing cutting speed, especially in laser cutting of AISI 304. Conversely, in laser cutting of St37-2, RSm increased as the cutting speed decreased; furthermore, it was found that RSm decreased with thickness, demonstrating that the presence of alloy elements leads to a less predictable behavior. The interaction between thickness and gas pressure was found to be significant, showing that the spacing parameter decreased at lower gas pressure in laser cutting of thin sections.
Optimal cutting conditions, satisfying the straight requirements of the quality standard, were identified for each material: in nitrogen-assisted fusion cutting of AlMg3, the conditions Cs = 50% and P = 100% are preferred; oxygen-assisted cutting of St37-2 with Cs = 100% and P = 100% guarantees the best performance in cutting of sections up to 5 mm in thickness. For thicker sections, the condition Cs = 100% and P = 50% were found most suitable; in nitrogen-assisted cutting of AISI 304, the best cut quality was achieved for Cs = 100% and P = 50%. The best performance, in absolute terms, was obtained in oxygen cutting of 2.5 mm thick St37-2 with Cs = 50% and P = 100%, whereas the worst was given by nitrogen-assisted fusion cutting of 6 mm thick AlMg3 with Cs = 100% and P = 100%. These results also show that it is possible to apply industrial-relevant high cutting speeds.

Author Contributions

All the authors contributed equally to the various aspect of this work. Conceptualization, V.T. and S.G.; methodology, G.R. and S.G; resources, V.T.; data curation, G.R. and E.M.; writing-original draft preparation, E.M. and G.R.; supervision, V.T. and S.G. All authors have read and agreed to the published version of the manuscript.

Funding

This research received no external funding.

Conflicts of Interest

The authors declare no conflict of interest.

References

  1. Samant, A.N.; Dahotre, N.B. Laser machining of structural ceramics—A review. J. Eur. Ceram. Soc. 2009, 29, 969–993. [Google Scholar] [CrossRef]
  2. Rodrigues, G.C.; Vorkov, V.; Duflou, J. Optimal laser beam configurations for laser cutting of metal sheets. Procedia CIRP 2018, 74, 714–718. [Google Scholar] [CrossRef]
  3. Jiménez-Peña, C.; Goulas, C.; Preußner, J.; Debruyne, D. Failure Mechanisms of Mechanically and Thermally Produced Holes in High-Strength Low-Alloy Steel Plates Subjected to Fatigue Loading. Metals 2020, 10, 318. [Google Scholar] [CrossRef] [Green Version]
  4. Ter-Mikirtychev, V.V. Fundamentals of Fiber Lasers and Fiber Amplifiers; Springer Series in Optical Sciences; Springer: Cham, Switzerland, 2014; p. 181. [Google Scholar]
  5. Sharma, A.; Yadava, V. Modelling and optimization of cut quality during pulsed Nd:YAG laser cutting of thin Al-alloy sheet for straight profile. Opt. Laser Technol. 2012, 44, 159–168. [Google Scholar] [CrossRef]
  6. Scintilla, L.D.; Tricarico, L.; Wetzig, A.; Beyer, E. Investigation on disk and CO2 laser beam fusion cutting differences based on power balance equation. Int. J. Mach. Tools Manuf. 2013, 69, 30–37. [Google Scholar] [CrossRef]
  7. Rodrigues, G.C.; Vanhove, H.; Duflou, J. Direct Diode Lasers for Industrial Laser Cutting: A Performance Comparison with Conventional Fiber and CO2 Technologies. Phys. Procedia 2014, 56, 901–908. [Google Scholar] [CrossRef] [Green Version]
  8. Zaitsev, A.V.; Ermolaev, G.V.; Polyanskiy, T.A.; Gurin, A.M. Numerical simulation of the shape of laser cut for fiber and CO2 lasers. AIP Conf. Proc. 2018, 1893. [Google Scholar] [CrossRef] [Green Version]
  9. Fomin, V.M.; Гoлышев, А.; Orishich, A.; Shulyat’Ev, V.B. Energy balance in high-quality cutting of steel by fiber and CO2 lasers. J. Appl. Mech. Tech. Phys. 2017, 58, 371–378. [Google Scholar] [CrossRef]
  10. Rajaram, N.; Sheikh-Ahmad, J.; Cheraghi, S. CO2 laser cut quality of 4130 steel. Int. J. Mach. Tools Manuf. 2003, 43, 351–358. [Google Scholar] [CrossRef]
  11. Radovanovic, M. Analysis of correlations of multiple-performance characteristics of optimization of CO2 laser nitrogen cutting of AISI 304 stainnless steel. J. Eng. Sci. Technol. Rev. 2014, 7, 16–21. [Google Scholar]
  12. Wandera, C.; Kujanpaa, V. Characterization of the melt removal rate in laser cutting of thick-section stainless steel. J. Laser Appl. 2010, 22, 62–70. [Google Scholar] [CrossRef]
  13. Shaparev, A. Investigation of the Effect of Oxygen Content in the Auxiliary Process Gas on the Quality and Speed of Laser Cutting of Steel Sheets. Solid State Phenom. 2020, 299, 457–461. [Google Scholar] [CrossRef]
  14. Yilbas, B.S. The analysis of CO2 laser cutting. Proc. Inst. Mech. Eng. Part B: J. Eng. Manuf. 1997, 211, 223–232. [Google Scholar] [CrossRef]
  15. Sharifi, M.; Akbari, M. Experimental investigation of the effect of process parameters on cutting region temperature and cutting edge quality in laser cutting of AL6061T6 alloy. Optik 2019, 184, 457–463. [Google Scholar] [CrossRef]
  16. Radovanovic, M.; Madic, M. Experimental investigations of CO2 laser cut quality: A review. Rev. Tehnol. Neconv. 2011, 15, 35. [Google Scholar]
  17. Badoniya, P. CO2 Laser Cutting of Different Materials—A Review. Int. Res. J. Eng. Technol. 2018, 5, 1–12. [Google Scholar]
  18. Leone, C.; Genna, S.; Caggiano, A.; Tagliaferri, V.; Molitierno, R. Influence of process parameters on kerf geometry and surface roughness in Nd:YAG laser cutting of Al 6061T6 alloy sheet. Int. J. Adv. Manuf. Technol. 2016, 87, 2745–2762. [Google Scholar] [CrossRef]
  19. Lamikiz, A.; De Lacalle, L.N.L.; Sanchez, J.A.; Del Pozo, D.; Etayo, J.; Lopez, J.; Lamikiz, A. CO2 laser cutting of advanced high strength steels (AHSS). Appl. Surf. Sci. 2005, 242, 362–368. [Google Scholar] [CrossRef]
  20. Ghany, K.A.; Newishy, M. Cutting of 1.2mm thick austenitic stainless steel sheet using pulsed and CW Nd:YAG laser. J. Mater. Process. Technol. 2005, 168, 438–447. [Google Scholar] [CrossRef]
  21. Lo, K. A Comparative Study on Nd:YAG Laser Cutting of Steel and Stainless Steel Using Continuous, Square, and Sine Waveforms. J. Mater. Eng. Perform. 2011, 21, 907–914. [Google Scholar] [CrossRef]
  22. Karatas, C.; Keles, O.; Uslan, I.; Usta, Y. Laser cutting of steel sheets: Influence of workpiece thickness and beam waist position on kerf size and stria formation. J. Mater. Process. Technol. 2006, 172, 22–29. [Google Scholar] [CrossRef]
  23. Pocorni, J.; Petring, D.; Powell, J.; Deichsel, E.; Kaplan, A.F. The Effect of Laser Type and Power on the Efficiency of Industrial Cutting of Mild and Stainless Steels. J. Manuf. Sci. Eng. 2015, 138, 031012. [Google Scholar] [CrossRef]
  24. Montgomery, D.C. Design and Analysis of Experiments; John Wiley & Sons, Inc.: Danvers, MA, USA, 2013. [Google Scholar]
  25. Powell, J.; Petring, D.; Kumar, R.V.; Al-Mashikhi, S.O.; Kaplan, A.F.; Voisey, K. Laser–oxygen cutting of mild steel: The thermodynamics of the oxidation reaction. J. Phys. D: Appl. Phys. 2008, 42, 015504. [Google Scholar] [CrossRef]
  26. Chen, S.-L. The effects of high-pressure assistant-gas flow on high-power CO2 laser cutting. J. Mater. Process. Technol. 1999, 88, 57–66. [Google Scholar] [CrossRef]
  27. Гoлышев, А.; Malikov, A.; Orishich, A.; Shulyat’Ev, V.B. Experimental comparison of laser energy losses in high-quality laser-oxygen cutting of low-carbon steel using radiation from fibre and CO2 lasers. Quantum Electron. 2015, 45, 873–878. [Google Scholar] [CrossRef]
  28. Radovanovic, M.; Dašić, P. Research on Surface Roughness by Laser Cut. Annals “Dunărea de Jos” Univ. Galaţi Fascicle VIII: Tribol. 2006, 84–88. [Google Scholar]
  29. Dahotre, N.B.; Harimkar, S.P. Laser Fabrication and Machining of Materials; Springer: Boston, MA, USA, 2008; Volume 53, p. 9. [Google Scholar]
  30. Gorji, N.E.; Saxena, P.; Corfield, M.; Clare, A.; Rueff, J.-P.; Bogan, J.; González, P.G.; Snelgrove, M.; Hughes, G.; O’Connor, R.; et al. A new method for assessing the recyclability of powders within Powder Bed Fusion process. Mater. Charact. 2020, 161, 110167. [Google Scholar] [CrossRef]
  31. Yilbas, B.S. Experimental investigation into CO2 laser cutting parameters. J. Mater. Process. Technol. 1996, 58, 323–330. [Google Scholar] [CrossRef]
Figure 1. Schematic of the experimental setup used for tests.
Applsci 10 04956 g001
Figure 2. Schematic of comb-like configuration used for tests.
Applsci 10 04956 g002
Figure 3. Schematic of kerf geometry.
Applsci 10 04956 g003
Figure 4. Schematic of profile acquisition.
Applsci 10 04956 g004
Figure 5. Kerf width for AlMg3 in relation to cutting conditions and thickness.
Applsci 10 04956 g005
Figure 6. Kerf width for St37-2 in relation to cutting conditions and thickness.
Applsci 10 04956 g006
Figure 7. Kerf width for AISI 304 in relation to cutting conditions and thickness.
Applsci 10 04956 g007
Figure 8. Main effects plot for top kerf width.
Applsci 10 04956 g008
Figure 9. Main effects plot for bottom kerf width.
Applsci 10 04956 g009
Figure 10. Main effects plot for taper angle.
Applsci 10 04956 g010
Figure 11. Main effects plot for kerf section.
Applsci 10 04956 g011
Figure 12. Interaction plot for top kerf width.
Applsci 10 04956 g012
Figure 13. Main effects plot for arithmetic surface roughness (upper, middle and lower workpiece surface).
Applsci 10 04956 g013
Figure 14. Interaction plot for arithmetic surface roughness.
Applsci 10 04956 g014
Figure 15. Main effects plot for mean width of profile elements (upper, middle and lower workpiece surface).
Applsci 10 04956 g015
Figure 16. Interaction plot for RSm.
Applsci 10 04956 g016
Figure 17. Arithmetic mean surface roughness.
Applsci 10 04956 g017
Figure 18. Arithmetic mean surface roughness.
Applsci 10 04956 g018
Figure 19. Arithmetic mean surface roughness.
Applsci 10 04956 g019
Figure 20. AISI 304 kerf lateral surface: (a) 6 mm, Cs = 50% P = 100%; (b) 3 mm, Cs = 50% P = 100%; (c) 3 mm, Cs = 100% P = 100%.
Applsci 10 04956 g020
Figure 21. AlMg3 kerf lateral surface: (a) 6 mm, Cs = 100% P = 100%; (b) 6 mm, Cs = 50% P = 100%; (c) 4 mm, Cs = 50% P = 100%.
Applsci 10 04956 g021
Figure 22. St37-2 kerf lateral surface: (a) 5 mm, Cs = 100% P = 100%; (b) 5 mm, Cs = 50% P = 100%; (c) 2.5 mm, Cs = 50% P = 100%.
Applsci 10 04956 g022
Figure 23. Deviation of drag lines (in accordance with ISO 17658:2015) in 2.5 mm thick St37-2 cut with Cs = 100% and P = 50%.
Applsci 10 04956 g023
Figure 24. Depth of flow separation in 6 mm thick AlMg3 cut with Cs = 100% and P = 50%.
Applsci 10 04956 g024
Table 1. Chemical composition of the adopted materials.
AlMg3
UNI EN 573-3
AlMgMnSiCrZnTiCuFeResiduals
Min (%)94.22.6--------
Max (%)97.43.60.50.40.30.20.150.10.40.15
St37-2
UNI EN 10025
FeCMnSPresiduals
Max (%)98.130.211.500.0550.0550.05
AISI 304
UNI EN 10088-1
FeCSPMnSiNCrNiresiduals
Min (%)75------178-
Max (%)66.570.070.150.045210.1119.510.50.05
Table 2. Main properties of the adopted materials.
PropertiesAlMg3
(UNI EN 1706)
St37-2
(UNI EN 10025)
AISI 304
(UNI 6900-6901)
Units
Density2.707.857.90(g/cm3)
Solidus temperature60014201450(°C)
Liquidus temperature65014601400(°C)
Latent heat of fusion400250290(J/g)
Specific heat900470480(J/kg K)
Thermal conductivity130–1405116(W/m K)
Tensile strength140–240360–510490–685(MPa)
Yield strength (at 0.2%)80–130235185(MPa)
Elongation (at 50 mm)120–2645(%)
Young’s modulus68 206193–200(GPa)
Brinell Hardness52–88130170–360-
Table 3. Main features of the adopted laser system.
FeatureValueUnit
wavelength10,600nm
maximum power 5000W
power consumption (1)35kW
focal length9.80mm
position shifts0.05mm
average dispersion of position (2)0.03mm
maximum thickness of the structural steel sheet25mm
maximum thickness of the stainless steel sheet20mm
maximum thickness of the aluminium alloy sheet12.7mm
working area xy4000 × 2000mm2
maximum weight of workpiece 1700kg
(1) at the maximum output power; (2) on the overall cut length.
Table 4. Laser parameters adopted in experimental tests.
MaterialThickness
(mm)
Nozzle Diameter
(mm)
Focus Position
(mm)
Cs
(m/min)
P
(bar)
Gas Type
AlMg321.708.610N2
42−1.54.28
62.7−72.29
St37-22.50.82.55.20.8O2
50.80.53.70.8
612.53.30.7
AISI 30411.41.58.99N2
31.715.29
62.3−2.52.34.5
Table 5. Control factors and levels adopted in experimental tests.
Control Factors LabelsLow (-)Medium (0)High (+)Unit
Material MAlMg3St37-2AISI 304-
Thickness tminmedmax-
Cutting speed Cs50-100(% Cs)
Gas pressureP50-100(% P)
Table 6. ANOVA results for geometrical variables, computed F-value and p-value.
TkBkTaS
Control FactorF-Valuep-ValueF-Valuep-ValueF-Valuep-ValueF-Valuep-Value
M5.230.00665.870.00047.500.000294.700.000
t113.010.00042.120.00032.880.0001210.490.000
Cs (%)5.720.0177.120.0084.670.0323.410.066
P (%)0.000.96245.870.00041.860.00039.040.000
position10.140.0003.210.0088.460.0003.620.004
M*t10.270.00040.690.00012.260.00051.110.000
M*Cs (%)6.470.0023.420.0344.120.0171.040.355
M*P (%)3.400.0354.770.0098.130.0002.770.065
M*position2.170.0202.320.0131.300.2291.880.049
t*Cs (%)1.480.2292.530.0823.070.0481.430.242
t*P (%)3.260.0401.760.1753.040.0501.610.202
t*position2.080.0261.100.3660.930.5060.560.847
Cs (%) *position0.400.8500.760.5790.640.6730.720.610
P (%) *position6.420.0000.960.4426.260.0002.140.062
Table 7. ANOVA results for arithmetic mean surface roughness, computed F-value and p-value.
Ra_L1Ra_L2Ra_L3
Control FactorF-Valuep-ValueF-Valuep-ValueF-Valuep-Value
M3.440.04424.410.00017.540.000
t3.330.04811.250.0002.660.088
Cs (%)1.080.3076.760.0150.340.564
P (%)1.110.3001.210.2820.000.980
M*Cs (%)12.910.00043.670.00014.820.000
M*P (%)2.090.1391.670.2071.450.252
t*Cs (%)0.150.8640.400.6760.140.872
t*P (%)1.470.2461.740.1952.270.123
Table 8. ANOVA results for mean width of profile elements, computed F-value and p-value.
RSm_L1RSm_L2RSm_L3
Control FactorF-Valuep-ValueF-Valuep-ValueF-Valuep-Value
M22.100.000157.890.00066.060.000
t6.760.00314.990.0007.650.002
Cs (%)0.820.3715.960.0226.190.019
P (%)1.650.20813.180.0014.690.039
M*Cs (%)1.760.1882.080.14410.150.001
M*P (%)1.220.3080.620.5480.070.937
t*Cs (%)1.020.3722.150.1360.480.627
t*P (%)1.640.2099.800.0012.740.082

