Article

The Effect of a 7-Week Training Period on Changes in Skin NADH Fluorescence in Highly Trained Athletes

1
Department of Athletics, Strength and Conditioning, Faculty of Sport Sciences, Poznan University of Physical Education, 61-871 Poznań, Poland
2
Department of Physical Education and Lifelong Sports, Faculty of Sport Sciences, Poznan University of Physical Education, 61-871 Poznań, Poland
3
Department of Physical Therapy and Sports Recovery, Faculty of Health Sciences, Poznan University of Physical Education, 61-871 Poznań, Poland
4
Department of Anthropology and Biometrics, Faculty of Sport Sciences, Poznan University of Physical Education, 61-871 Poznań, Poland
*
Author to whom correspondence should be addressed.
Appl. Sci. 2020, 10(15), 5133; https://doi.org/10.3390/app10155133
Submission received: 4 June 2020 / Revised: 15 July 2020 / Accepted: 24 July 2020 / Published: 26 July 2020
(This article belongs to the Special Issue Sports Performance and Health)

Abstract

:
The study aimed to evaluate the changes of nicotinamide adenine dinucleotide (NADH) fluorescence in the reduced form in the superficial skin layer, resulting from a 7-week training period in highly trained competitive athletes (n = 41). The newly, non-invasive flow mediated skin fluorescence (FMSF) method was implemented to indirectly evaluate the mitochondrial activity by NADH fluorescence. The FMSF measurements were taken before and after an exercise treadmill test until exhaustion. We found that athletes showed higher post-training values in basal NADH fluorescence (pre-exercise: 41% increase; post-exercise: 49% increase). Maximum NADH fluorescence was also higher after training both pre- (42% increase) and post-exercise (47% increase). Similar changes have been revealed before and after exercise for minimal NADH fluorescence (before exercise: 39% increase; after exercise: 47% increase). In conclusion, physical training results in an increase in the skin NADH fluorescence levels at rest and after exercise in athletes.

1. Introduction

Skin microcirculatory function and efficiency of blood supply to the skin can impact mitochondrial activity and the changes of nicotinamide adenine dinucleotide (NADH) fluorescence in the reduced form [1]. Mitochondrial function can be indirectly evaluated by NADH fluorescence [1] that has been measured in animals [2,3] and humans [1,4] at rest and under various conditions (e.g., ischemia and temperature changes). Bugaj et al. [5] were the first to describe the time course of NADH changes in the skin in athletes at rest and after exercise. In their study, a new method of evaluating NADH fluorescence—flow mediated skin fluorescence (FMSF)—was utilized. The FMSF method is based on the ability of NADH to autofluorescence. The fluorescence measured using the FMSF method reflects the dynamics of in vivo changes in NADH levels in most superficial layers of the skin [5,6,7]. Bugaj et al. [5] have shown that exercise to exhaustion induces changes in skin NADH fluorescence, in other words, the values recorded after exercise were higher than those before exercise (increase in: basal NADH fluorescence 13%, maximal NADH fluorescence 7% and minimal NADH fluorescence 12%).
Nicotinamide adenine dinucleotide (NAD) is synthesized in the cytosol, mitochondria, and nucleus. This molecule is active in the cytoplasm during glycolysis and in the mitochondria during oxidative phosphorylation when adenosine-5′-triphosphate (ATP) is produced [8]. NAD occurs in two forms: oxidized NAD+ and reduced NADH. NAD takes part in many biological reactions including electron transport. The reduction of NAD+ to NADH occurs almost exclusively in the mitochondria at the final stage of cellular respiration [9,10].
In the human body, there is a pool of NAD that takes reduced (NAD+) and oxidized (NADH) forms, transforming into each other [8]. Importantly, the NAD pool is only constant for relatively short periods [8,11]. In the long term, the NAD amount changes depending on several factors such as age, diet, physical activity, medicaments, boosters, time of the day, etc. [11]. NAD+ metabolism is complex and includes many NAD+-consuming pathways as well as de novo and salvage pathways [8].
Mayevsky and Barbiro-Michaely [1] have claimed that the monitoring of the NADH level in tissue provides important information about the mitochondrial metabolic state (energy production, amount of intracellular oxygen). In addition, changes in the NAD+/NADH ratio reflect cellular respiration processes in mitochondria, thus indirectly represent their function [1,5]. Studies on changes in NADH in response to physical exercise were performed on animal and human skeletal muscle samples, but not in the skin [8,9,12]. Early reports including animals did not provide a clear answer as to how NADH levels were modified by exercise [13,14]. Subsequent human research had shown that intensive exercise, unlike light exercise, shifted the NAD+/NADH balance toward NADH [8,15]. Only Koltai et al. [16] have examined the influence of endurance training on changes in NAD+ level in rat muscles and showed that training resulted in an increase in NAD+ biosynthesis.
Studies on skeletal muscle mitochondria are valuable, but usually invasive due to the use of the biopsy technique [17,18] and expensive if transmission electron microscopy is used [19]. However, it has been suggested that physical exercise brings beneficial changes not only in skeletal muscle mitochondria, but also in skin mitochondria [20]. It has been demonstrated that physical exercise results in several beneficial mitochondrial adaptations [19,21,22,23,24,25]. Various changes were extensively studied in skeletal muscle mitochondria [19,21,25,26,27], while only one study dealt with the changes in the skin [20]. However, we do not know whether training only affects muscle mitochondria, or the adaptations also take place in skin mitochondria that are easily accessible to study because they lie superficially.
To the best of our knowledge, there is a lack of studies describing the effect of physical training on changes in NADH fluorescence in the skin. The novel, noninvasive, and cheap flow mediated skin fluorescence method can be a source of valuable information about the mitochondrial activity. Therefore, the study aimed to evaluate the changes in NADH fluorescence in the superficial skin layer resulting from a 7-week training period in highly trained competitive athletes. We hypothesize that physical training results in an increase in the NADH fluorescence levels in athletes.

2. Materials and Methods

2.1. Subjects

Forty-one highly trained athletes (28 men, 13 women), ages ranging from 18 to 35 years, participated in the study. They were members of the Polish national team or athletes taking part in national and international competitions. They represented the following sport disciplines: triathlon (Olympic distance: 1.5 km swim, 40 km bike ride, 10 km run) (seven men, four women); long-distance running (5 km, 10 km, and marathon) (six men, two women); Olympic taekwondo (six men, one woman); sprint (100 m, 200 m, and 4 × 100 m relay) (six men, one woman); canoeing (three men); and fencing (five women). Before starting the study, each participant was informed about the aim and procedures, potential risks, and the possibility to withdraw at any time without giving any reason. All athletes gave their written consent to participate in the examinations and fulfilled a questionnaire on their health status and potential contraindications. All athletes had valid health certificates issued by a physician who specialized in sports medicine, thus were eligible for training and competition. Exclusion criteria were illness symptoms, injuries, and taking drugs (temporarily or chronically). Only the data of those athletes who were present at both examinations was analyzed. The study was conducted in accordance with the Declaration of Helsinki. The Ethics Committee of the Poznan University of Medical Sciences in Poland approved the study protocol (approval no. 1017/16 issued on 5 October 2016).

2.2. Training Characteristics

All participants attended training sessions at least six times a week. During the whole 7-week period under study (general preparation phase of the one-year cycle), the athletes had on average 57 training sessions of a total duration of 71.2 h. The average duration of a single session was 84 min.

2.3. Study Design

The study was conducted in the Human Movement Laboratory of the Department of Athletics, Strength and Conditioning at the Poznan University of Physical Education (Poznań, Poland). Athletes arrived at the laboratory in the morning. During all measurements, the constant temperature was maintained (20‒21 °C) by an air conditioning system. On the day of the examination, the participants could only eat a light breakfast. It was also recommended for them to avoid coffee or tea for 12 h, alcohol for 24 h, and hard exercise for 48 h before each examination. After arriving, athletes changed into their lightweight sports clothing (without watches and wristbands potentially affecting blood flow) and acclimatized to the laboratory conditions for at least 30 min. During this time, they completed the required questionnaires, and height and weight measurements were performed.
Athletes underwent the examinations twice: at the beginning of the general preparation phase and after seven weeks, at the end of this phase. Each time, the same procedure was applied: (1) initial resting blood pressure measurement; (2) resting NADH fluorescence measurement; (3) blood draw, (4) incremental exercise test; (5) second blood draw; (6) post-exercise blood pressure measurement; and (7) post-exercise NADH fluorescence measurement (3 min after the end of the test).

2.4. Incremental Exercise Test

The exercise test was conducted on the H/P Cosmos treadmill (h/p/cosmos sports & medical GmbH, Nussdorf – Traunstein, Germany). All participants were familiar with the treadmill test because they regularly (2‒3 times a year) participated in similar tests. The purpose of this examination was to assess maximal oxygen uptake (VO2max) and peak heart rate (HR).
Respiratory gases were collected and analyzed using the MetaMax 3B ergospirometer (Cortex Biophysik BmbH, Leipzig, Germany) and the MetaSoft Studio 5.1.0 software (Cortex Biophysik BmbH, Leipzig, Germany). The exercise protocol started with a 4-min warm-up at the treadmill speed of 6 km/h. Then, the treadmill accelerated by 2 km/h every 3 min. The treadmill inclination was 1% throughout the whole test. The test terminated if the athlete signaled his/her voluntary exhaustion by raising one hand. Maximal oxygen uptake was considered to be reached if the oxygen uptake (VO2) was stabilized despite the further increase in treadmill speed. All participants were highly trained, so during the test, all of them reached a plateau in VO2 uptake. We also checked three additional conditions to confirm reached maximal oxygen uptake: (i) HR reached at least 95% of the age-adjusted HR; (ii) cutoff blood lactate concentration ≥ 9 mmol/L for man and ≥7 mmol/L for women; and (iii) respiratory exchange ratio was ≥1.1 [28]. Heart rate was measured using the Polar H6 Bluetooth Smart monitor (Polar Electro Oy, Kempele, Finland) attached to a chest strap.

2.5. Lactic Acid Measurements

Capillary blood samples were obtained from the fingertip at rest and 2 min after the exercise test. A total of 20 μL of whole blood was drawn to a micro test tube using a capillary. Biosen C-line (EKF Diagnostics, Cardiff, UK) was used to measure the level of lactate.

2.6. Anthropometric Measure

Anthropometric measurements were performed according to standardized procedures. Body mass (kg) and height (cm) were measured with a digital measuring station Seca 285 (SECA, Hamburg, Germany). Body mass index (BMI) was calculated as body weight divided by height squared (kg/m2).

2.7. Nicotinamide Adenine Dinucleotide Fluorescence

NADH fluorescence was measured using the AngioExpert device (Angionica, Łódź, Poland, 2016) based on the flow mediated skin fluorescence (FMSF) method. FMSF enables recording of the changes in NADH fluorescence as a function of time in response to ischemia and reperfusion in forearm skin cells. During the measurement, AngioExpert emits light at the wavelength of 460 nm [6,7]. NADH molecules have autofluorescence capability at a wavelength of 460 nm [9]. The changes in fluorescence intensity observed during the examination are produced in the most superficial skin cells (epidermis) [6,29], which is due to very shallow skin penetration by excitation light at the wavelength of 340 nm. About 90% of the recorded signal comes from the skin depth up to 0.5 mm. The activated skin region is not directly supplied with blood, but is supplied with oxygen by deeper blood vessels [6,7,29].
During the examination, each participant sat on a chair with his/her arm resting on the measuring device. Immediately before examination, systolic (SBP) and diastolic (DBP) blood pressure was measured using the Omron 3 (Omron, Kyoto, Japan) device. At the start of the FMSF examination, basal fluorescence was registered for 2 min. Then, an occlusion cuff was inflated up to the pressure of 50 mmHg above the SBP for 200 s. After this time, blood flow in the forearm was restored (cuff deflated) and the changes in NAD fluorescence were recorded for a further 3 min [7].
The following parameters related to NAD fluorescence were measured or calculated (Figure 1):
  • Bmean—Basal fluorescence at the wavelength of 460 nm, recorded at rest at the beginning of the measurement;
  • FImax—The maximal increase in fluorescence above the baseline observed during forearm ischemia;
  • FRmin—The maximal drop in fluorescence below the baseline observed during reperfusion;
  • Imax—The relative increase in fluorescence = the difference between Imax and Bmean;
  • Rmin—The relative drop in fluorescence = the difference between Bmean and FRmean;
  • IRampl—The maximal range of changes in fluorescence = the sum of Rmin and Imax; and
  • CImax—The relative (percentage) contribution of Imax to IRampl [7].
The second measurement was made according to the same methodology, 3 min after the end of the treadmill test. A sample measurement of the NADH fluorescence from a 23-year-old male sprinter before and after training was shown in Figure 2.

3. Results

3.1. Basic Characteristics

The resting DBP, SBP, and BMI were within normal ranges. Other descriptive characteristics are presented in Table 1.

3.2. Measured Parameters

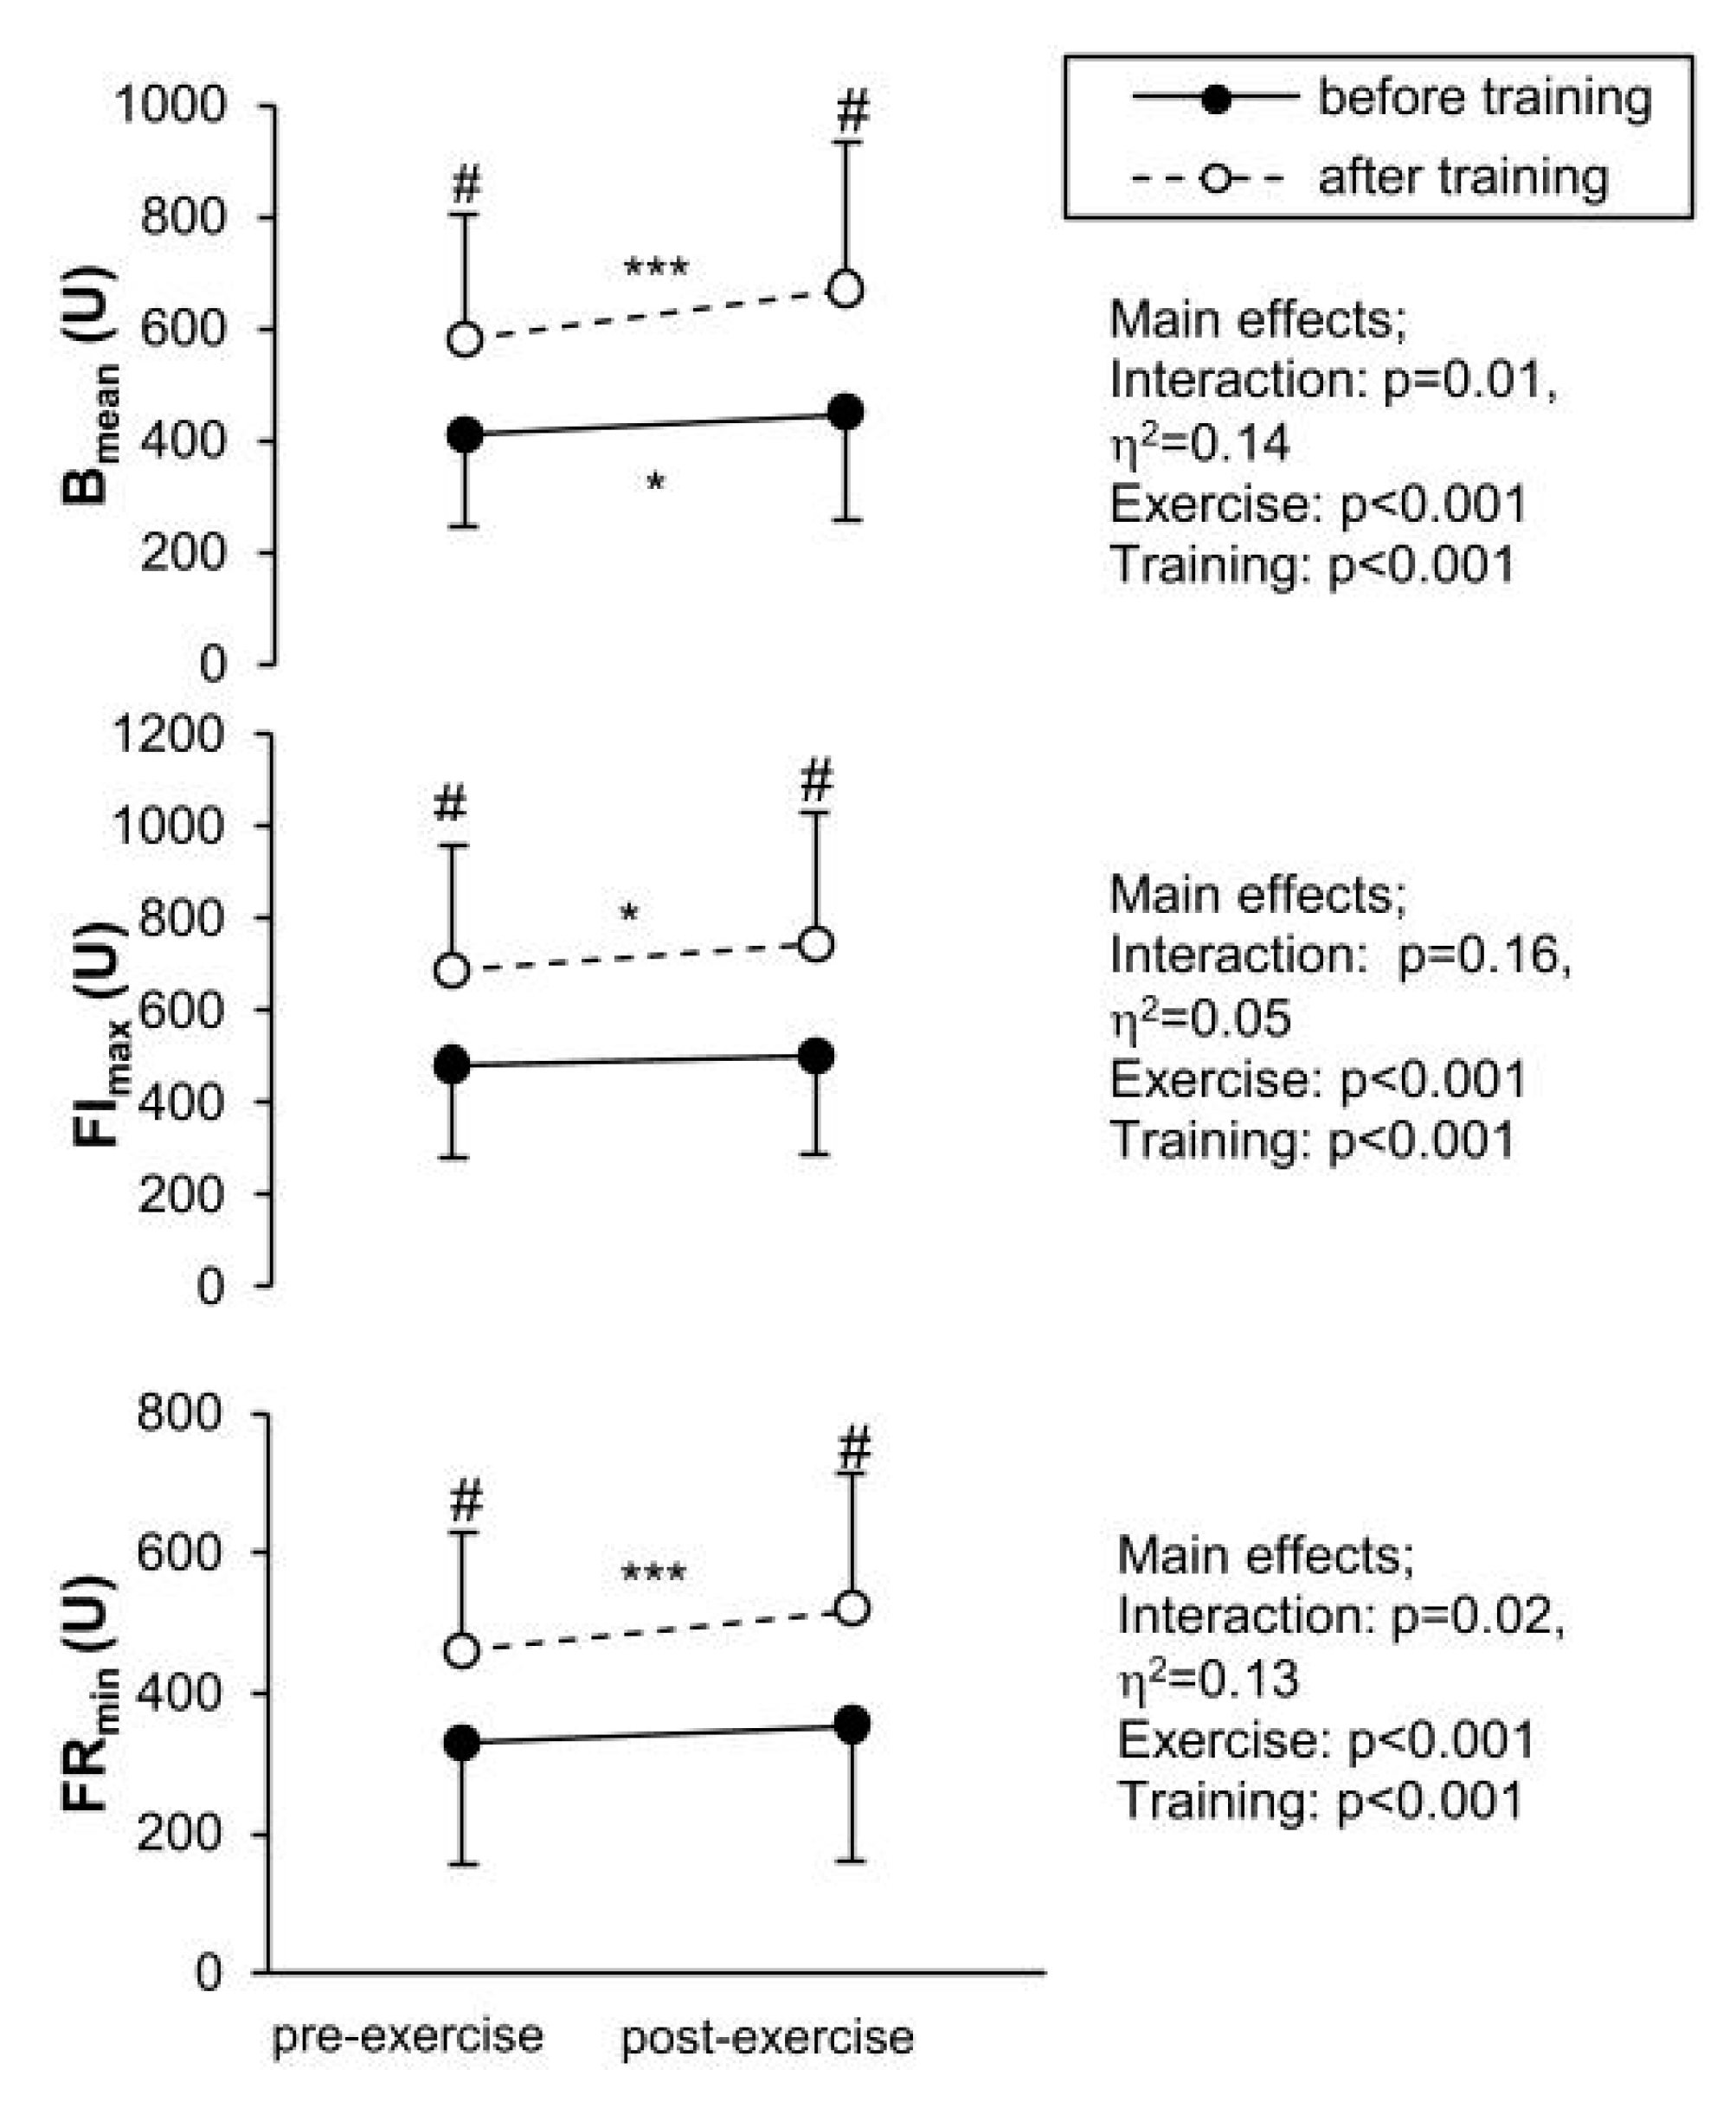
The values of the measured parameters are shown in Figure 3. At the first examination (before the training period), only Bmean significantly increased between the pre- (410.8) and post-exercise (449.3) measurements. At the second examination (after the training period), the values of all measured parameters significantly increased between resting and post-exercise condition. Bmean increased from 579.5 to 671.9, 16%; FImax increased from 685.8 to 742.4, 8% and FRmin from 459.1 to 520, 13%. All measured parameters (both resting and post-exercise) significantly increased between the first and second examination.

3.3. Calculated Parameters

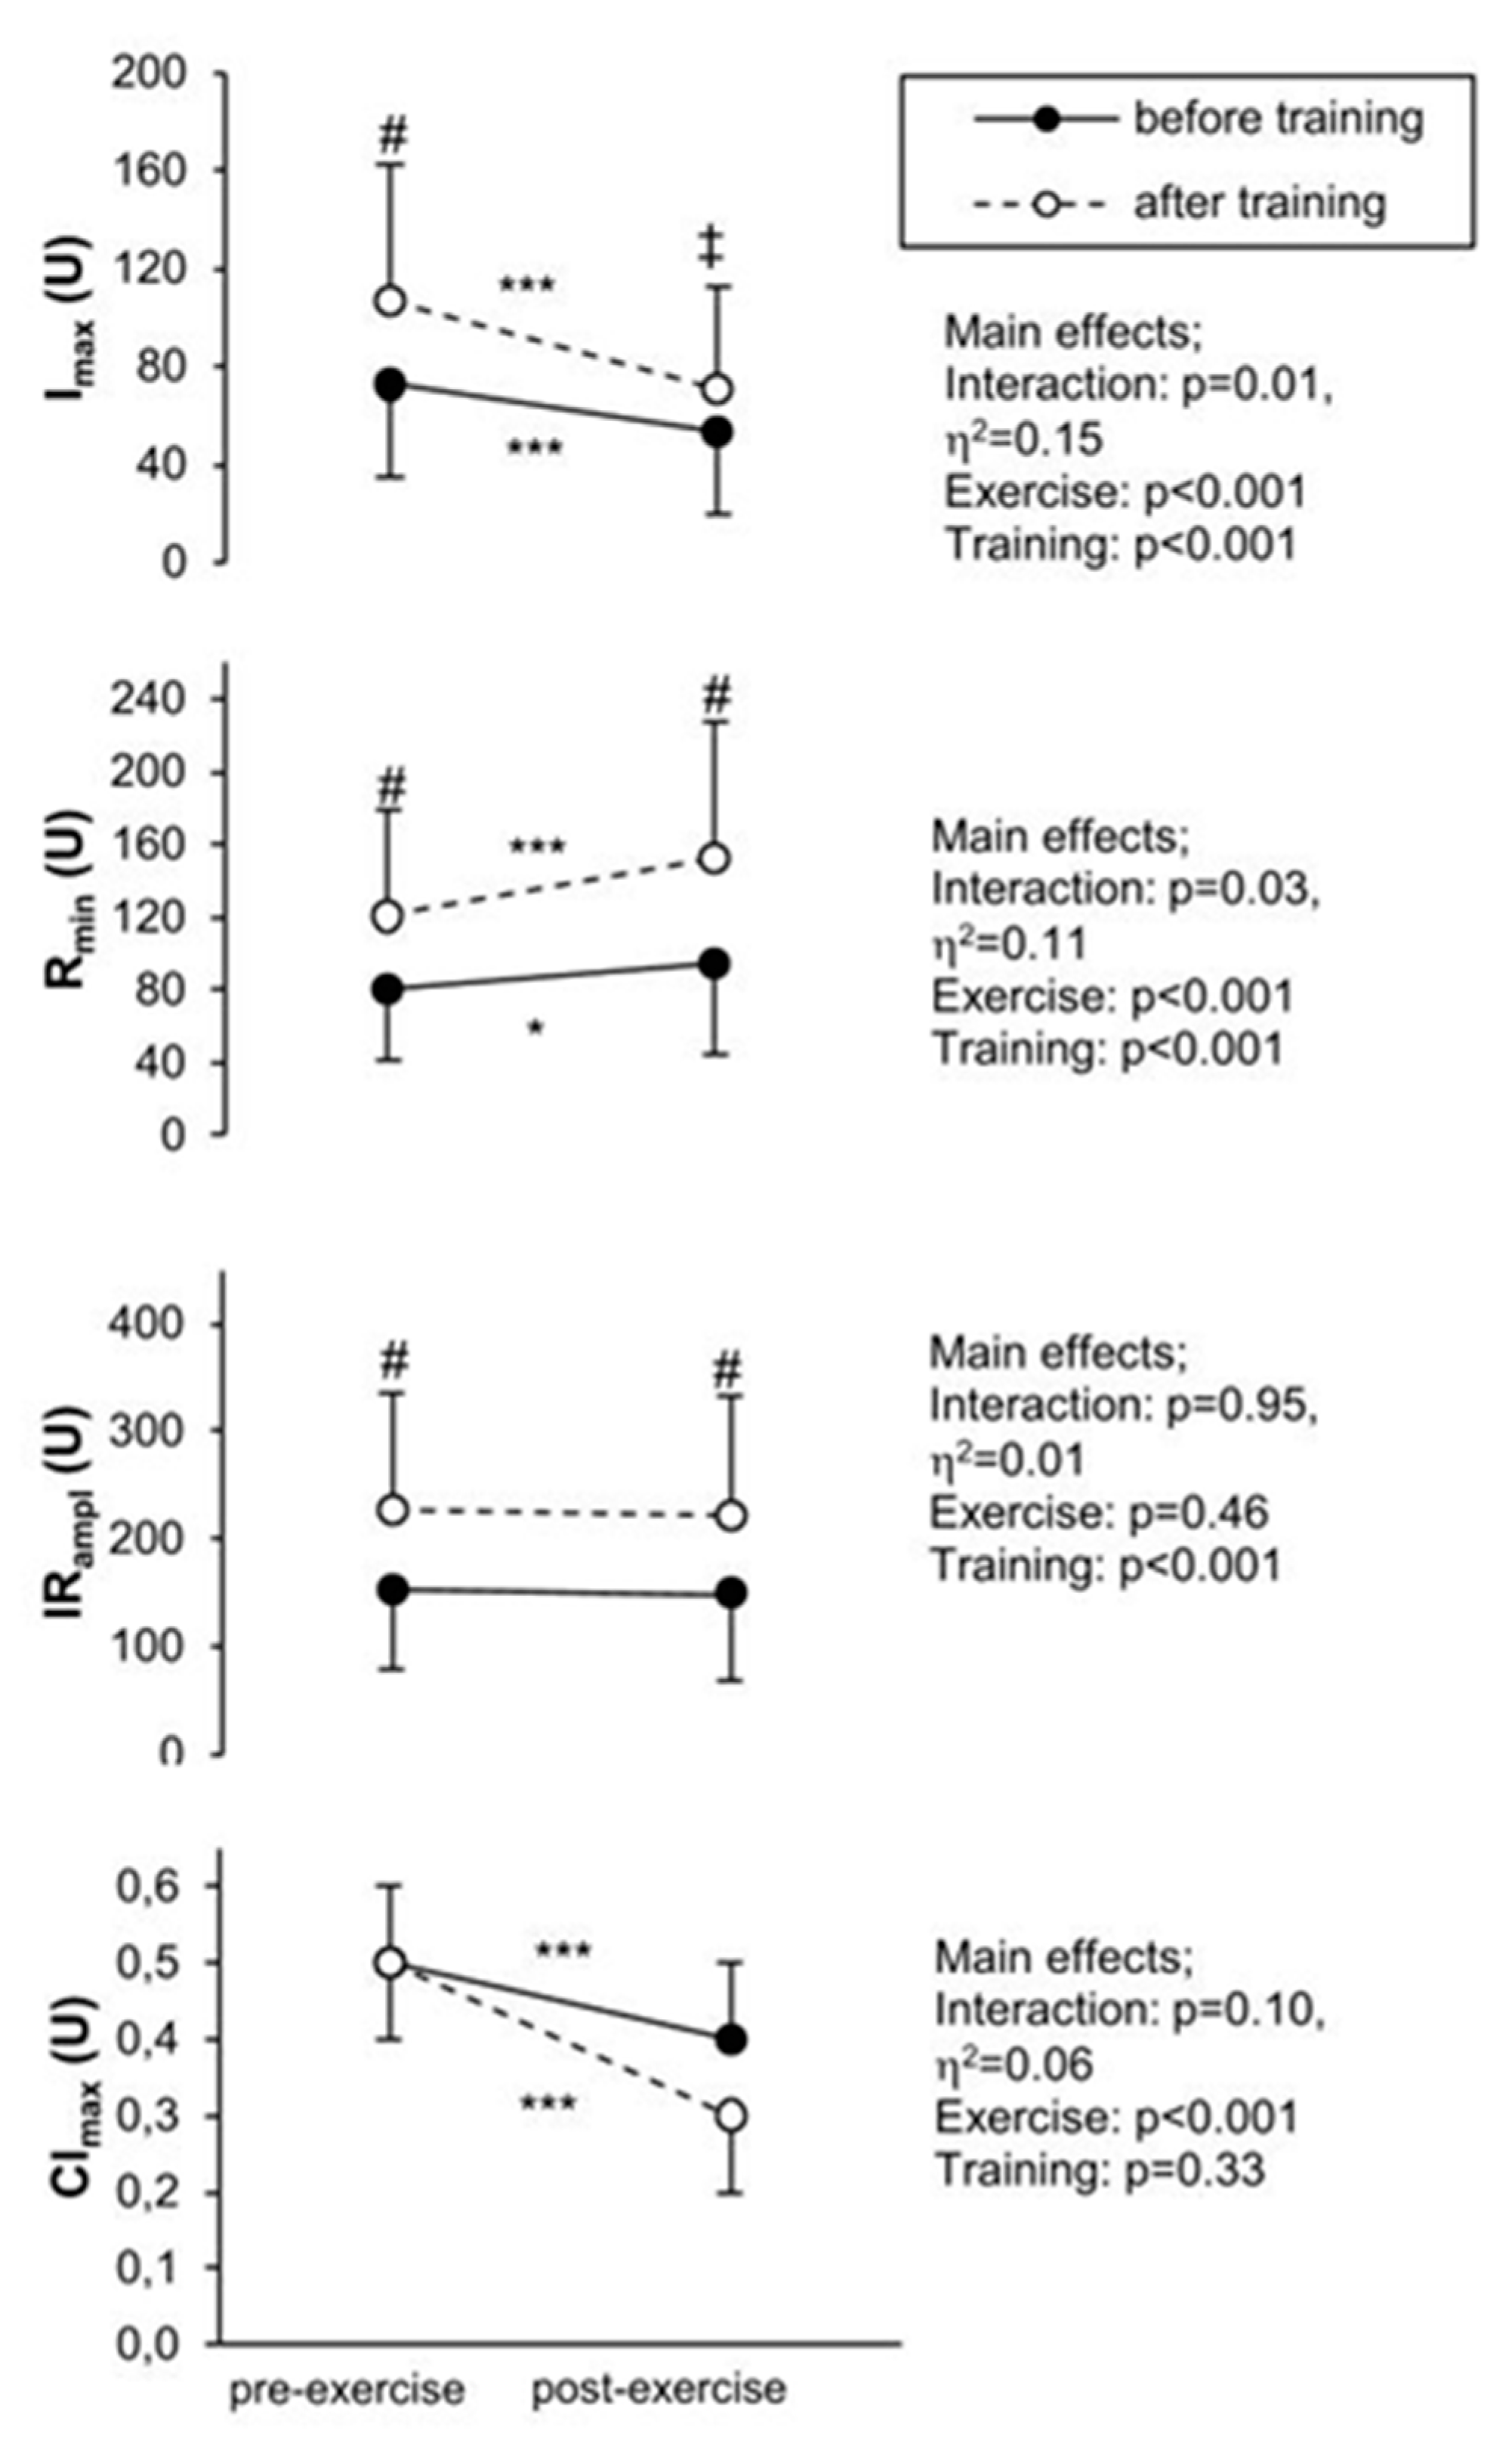
The values of the calculated parameters are presented in Figure 4. Imax significantly decreased after exercise in both pre- (from 72.6 to 53.9, 26% decrease) and post-training (from 106.3 to 70.6, 34% decrease) examinations. Imax values were higher after than before training pre- (from 72.6 to 106.3, 46% increase) and post-exercise (from 53.9 to 70.6, 31% increase).
Rmin significantly increased after exercise compared to resting conditions in both examinations before (from 80.3 to 94.7, 18% increase) and after training (from 120.4 to 151.9, 26% increase). The pre- and post-exercise values of Rmin were higher after than before training (pre-exercise 50% and post-exercise 60%).
The IRampl parameter did not significantly differ between resting and post-exercise conditions in both examinations. Its pre- and post-exercise values were significantly higher after than before the training period (pre-exercise from 152.9 to 226.7, 48% increase; post-exercise from 148.6 to 222.4, 50% increase).
The values of CImax were significantly lower after than before exercise in both examinations (before training decreased from 0.5 to 0.4; after training decreased from 0.5 to 0.3). There were no differences observed before when compared to after training.

4. Discussion

In this study, for the first time, the changes in NADH fluorescence in epidermal cells have been investigated in highly trained athletes before and after a training period. The main and novel finding is a significant increase in NADH fluorescence after training.

4.1. The Effect of Training

In our study, an increase in NADH fluorescence after a 7-week training period in highly trained athletes was observed. It is widely known that physical training induces several adaptations including mitochondrial adaptations [22]. The measurement of NADH fluorescence may be used to indirectly evaluate the mitochondrial function and information about its metabolic status [1,5]. However, the changes in NADH fluorescence alone do not allow us to answer the question of what particular metabolic changes took place. It is known that NAD+ and NADH are in balance (i.e., the more NAD+, the less NADH and vice versa [8]). Therefore, the higher post-training NADH fluorescence shown in our study may indicate increased NAD turnover.
Our participants represented different sport disciplines, but the study was only conducted in the general preparation period of the annual training cycle. The main goal of this period, regardless of sports discipline, was the development of endurance capacity. VO2max did not change after training in our athletes, which is in line with other reports [30,31] that also did not observe such changes in highly trained athletes in an annual training cycle. However, we assume that the changes occurred at the cellular respiration level. The endurance-dominant training in all athletes significantly affected the increase in the NADH fluorescence, which can be reflected by the changes in mitochondrial functions as shown in measured NADH parameters (Bmean, FImax, FRmin). The post-training increase in Bmean, FImax, and FRmin suggests a training-induced increase in the total NAD pool. However, there is a lack of research on training-induced changes in skin mitochondria. We can only compare our findings with those obtained from muscle mitochondria. To the best of our knowledge, the only research on training-related changes in NAD levels was performed on rat muscles. It has been found that NAD levels increased in response to endurance training [16]. There is a lack of studies on NAD changes in trained humans. The training-related changes in mitochondria have been widely described in human muscles [19,21,22,25,32]. The training-related changes in the mitochondria are probably connected with the improvement in mitochondrial biogenesis and the removal of dysfunctional mitochondria [21,22,25,32]. After training, an increase was observed in the levels of proteins related to mitochondrial biogenesis [21,25] and an improvement in mitochondrial respiratory function [19]. It is suggested that the profile of the mitochondrial changes depends on training intensity and volume. Training volume seems to affect mitochondrial content, whereas training intensity is correlated with the improvement in mitochondrial respiration [19]. It must be remembered that exercise does not necessarily imply exactly the same metabolic changes in muscle and skin mitochondria. However, intense physical activity affects mitochondrial activity and induces an increase in NADH fluorescence, which we have shown in our previous study [5]. Therefore, the observed increase in NADH fluorescence after 7-weeks of training may indirectly indicate adaptive changes in skin mitochondria.

4.2. Exercise Response

In our recent paper [5], we showed that a single bout of exercise until exhaustion induced a significant increase in skin NADH fluorescence. The results of this study are in line with our previous observations. We found that the Imax parameter, related to fluorescence intensity, decreased after exercise and that the Rmin parameter increased after exercise. The likely explanation is that with limited aerobic metabolism, NADH is accumulated and the NAD+ amount decreases because anaerobic metabolism does not allow for restoring NAD+ from NADH to a sufficient extent [33,34,35].
However, some authors [36] suggest that the decrease in NADH fluorescence intensity during reperfusion not only shows the change in mitochondrial function, but also in microcirculatory and endothelial functions related to the efficiency of blood supply to the skin. Both the skin blood vessels’ thermoregulatory [37,38,39] and endothelial [40] functions improved after training. Our study supports this view and suggests improvements in exercise tolerance based on NADH fluorescence measurement.

4.3. Practical Application

The FMSF method might be useful to evaluate metabolic adaptations related to mitochondrial function and/or microcirculatory function as the effect of training (training efficiency). This might also be used to observe the recovery after exercise when returning to the resting NADH values.

5. Conclusions

Athletes showed significant changes in NADH fluorescence in skin cells after a 7-week training period. We found that they achieved higher post-training values in basal NADH fluorescence (Bmean) (pre-exercise 41% increase and post-exercise 49% increase). Additionally, the maximal increase in fluorescence during occlusion (FImax) and the maximal drop in fluorescence after reperfusion (FRmin) were higher at rest and post-exercise after training (FImax 42% at rest, and 47% post-exercise, FRmin (39% at rest, and 47% post-exercise). In conclusion, physical training results in an increase in the skin NADH fluorescence levels at rest and after exercise in highly trained athletes. We suggest that the measurements can reflect the training-induced changes in the metabolic status of the skin mitochondria.

Author Contributions

Conceptualization, O.B. and J.Z.; Methodology, J.Z., K.K., and O.B.; Software, J.Z.; Validation, J.Z. and O.B.; Formal analysis, J.Z., D.W., and O.B.; Investigation, O.B., J.Z., D.W., K.K., A.K., and P.K.; Resources, K.K. and J.Z.; Data curation, J.Z. and O.B.; Writing—original draft preparation, O.B.; Writing—review and editing, K.K., J.Z., P.K., and A.K.; Visualization, O.B., J.Z., and A.K.; Supervision, J.Z. and K.K.; Project administration, J.Z.; Funding acquisition, J.Z. All authors have read and agreed to the published version of the manuscript.

Funding

This research was funded by ANG/ZK/2/2016 project, being a part of the project funded by the European Union from the resources of the European Regional Development Fund under the Smart Growth Operational Program, grant number POIR.01.01.01-00-0540/15.

Acknowledgments

We thank all the participants for their full cooperation.

Conflicts of Interest

The authors declare no conflict of interest.

References

  1. Mayevsky, A.; Barbiro-Michaely, E. Use of NADH fluorescence to determine mitochondrial function in vivo. Int. J. Biochem. Cell Biol. 2009, 41, 1977–1988. [Google Scholar] [CrossRef]
  2. Palero, J.A.; Bader, A.N.; Gerritsen, H.C. In vivo monitoring of protein-bound and free NADH during ischemia by nonlinear spectral imaging microscopy. Biomed. Opt. Express 2011, 2, 1030–1039. [Google Scholar] [CrossRef] [Green Version]
  3. Pappajohn, D.J.; Penneys, R.; Chance, B. NADH spectrofluorometry of rat skin. J. Appl. Physiol. 1972, 33, 684–687. [Google Scholar] [CrossRef]
  4. Balu, M.; Mazhar, A.; Hayakawa, C.K.; Mittal, R.; Krasieva, T.B.; König, K.; Venugopalan, V.; Tromberg, B.J. In vivo multiphoton NADH fluorescence reveals depth-dependent keratinocyte metabolism in human skin. Biophys. J. 2013, 104, 258–267. [Google Scholar] [CrossRef] [Green Version]
  5. Bugaj, O.; Zieliński, J.; Kusy, K.; Kantanista, A.; Wieliński, D.; Guzik, P. The effect of exercise on the skin content of the reduced form of NAD and its response to transient ischemia and reperfusion in highly trained athletes. Front. Physiol. 2019, 10, 600. [Google Scholar] [CrossRef] [PubMed]
  6. Katarzynska, J.; Lipinski, Z.; Cholewinski, T.; Piotrowski, L.; Dworzynski, W.; Urbaniak, M.; Borkowska, A.; Cypryk, K.; Purgal, R.; Marcinek, A.; et al. Non-invasive evaluation of microcirculation and metabolic regulation using flow mediated skin fluorescence (FMSF): Technical aspects and methodology. Rev. Sci. Instrum. 2019, 90, 104104. [Google Scholar] [CrossRef]
  7. Sibrecht, G.; Bugaj, O.; Filberek, P.; Niziński, J.; Kusy, K.; Zieliński, J.; Guzik, P. Flow-Mediated Skin Flurescence method for non-invasive measurement of the NADH at 460 nm—A possibility to assess the mitochondrial function. Postepy Biol. Komorki 2017, 44, 333–352. [Google Scholar] [CrossRef]
  8. White, A.T.; Schenk, S. NAD+/NADH and skeletal muscle mitochondrial adaptations to exercise. Am. J. Physiol. Endocrinol. Metab. 2012, 303, E308–E321. [Google Scholar] [CrossRef] [PubMed] [Green Version]
  9. Mayevsky, A.; Chance, B. Oxidation-reduction states of NADH in vivo: From animals to clinical use. Mitochondrion 2007, 7, 330–339. [Google Scholar] [CrossRef] [PubMed]
  10. O’Donnell, J.M.; Kudej, R.K.; LaNoue, K.F.; Vatner, S.F.; Lewandowski, E.D. Limited transfer of cytosolic NADH into mitochondria at high cardiac workload. Am. J. Physiol. Heart Circ. Physiol. 2004, 286, H2237–H2242. [Google Scholar] [CrossRef] [Green Version]
  11. Rajman, L.; Chwalek, K.; Sinclair, D.A. Therapeutic potential of NAD-boosting molecules: The in vivo evidence. Cell Metab. 2018, 27, 529–547. [Google Scholar] [CrossRef] [PubMed] [Green Version]
  12. Mayevsky, A.; Rogatsky, G.G. Mitochondrial function in vivo evaluated by NADH fluorescence: From animal models to human studies. Am. J. Physiol Cell Physiol 2007, 292, C615–C640. [Google Scholar] [CrossRef] [PubMed]
  13. Duboc, D.; Muffat-Joly, M.; Renault, G.; Degeorges, M.; Toussaint, M.; Pocidalo, J.J. In situ NADH laser fluorimetry of rat fast- and slow-twitch muscles during tetanus. J. Appl. Physiol. 1988, 64, 2692–2695. [Google Scholar] [CrossRef] [PubMed]
  14. Jobsis, F.F.; Stainsby, W.N. Oxidation of NADH during contractions of circulated mammalian skeletal muscle. Respir. Physiol. 1968, 4, 292–300. [Google Scholar] [CrossRef]
  15. Sahlin, K.; Katz, A.; Henriksson, J. Redox state and lactate accumulation in human skeletal muscle during dynamic exercise. Biochem. J. 1987, 245, 551–556. [Google Scholar] [CrossRef] [Green Version]
  16. Koltai, E.; Szabo, Z.; Atalay, M.; Boldogh, I.; Naito, H.; Goto, S.; Nyakas, C.; Radak, Z. Exercise alters SIRT1, SIRT6, NAD and NAMPT levels in skeletal muscle of aged rats. Mech. Ageing Dev. 2010, 131, 21–28. [Google Scholar] [CrossRef] [Green Version]
  17. Boushel, R.; Gnaiger, E.; Larsen, F.J.; Helge, J.W.; Gonzalez-Alonso, J.; Ara, I.; Munch-Andersen, T.; van Hall, G.; Søndergaard, H.; Saltin, B.; et al. Maintained peak leg and pulmonary VO2 despite substantial reduction in muscle mitochondrial capacity. Scand. J. Med. Sci. Sports 2015, 25, 135–143. [Google Scholar] [CrossRef] [Green Version]
  18. Guadalupe-Grau, A.; Fernández-Elías, V.E.; Ortega, J.F.; Dela, F.; Helge, J.W.; Mora-Rodriguez, R. Effects of 6-month aerobic interval training on skeletal muscle metabolism in middle-aged metabolic syndrome patients. Scand. J. Med. Sci. Sports 2018, 28, 585–595. [Google Scholar] [CrossRef]
  19. Granata, C.; Jamnick, N.A.; Bishop, D.J. Training-Induced Changes in Mitochondrial Content and Respiratory Function in Human Skeletal Muscle. Sports Med. 2018, 48, 1809–1828. [Google Scholar] [CrossRef]
  20. Crane, J.D.; MacNeil, L.G.; Lally, J.S.; Ford, R.J.; Bujak, A.L.; Brar, I.K.; Kemp, B.E.; Raha, S.; Steinberg, G.R.; Tarnopolsky, M.A. Exercise-stimulated interleukin-15 is controlled by AMPK and regulates skin metabolism and aging. Aging Cell 2015, 14, 625–634. [Google Scholar] [CrossRef]
  21. Busquets-Cortés, C.; Capó, X.; Martorell, M.; Tur, J.A.; Sureda, A.; Pons, A. Training and acute exercise modulates mitochondrial dynamics in football players’ blood mononuclear cells. Eur. J. Appl. Physiol. 2017, 117, 1977–1987. [Google Scholar] [CrossRef] [PubMed]
  22. Drake, J.C.; Wilson, R.J.; Yan, Z. Molecular mechanisms for mitochondrial adaptation to exercise training in skeletal muscle. FASEB J. 2016, 30, 13–22. [Google Scholar] [CrossRef] [PubMed]
  23. Jacobs, R.A.; Lundby, C. Mitochondria express enhanced quality as well as quantity in association with aerobic fitness across recreationally active individuals up to elite athletes. J. Appl. Physiol. 2013, 114, 344–350. [Google Scholar] [CrossRef] [PubMed] [Green Version]
  24. Jacobs, R.A.; Flück, D.; Bonne, T.C.; Bürgi, S.; Christensen, P.M.; Toigo, M.; Lundby, C. Improvements in exercise performance with high-intensity interval training coincide with an increase in skeletal muscle mitochondrial content and function. J. Appl. Physiol. 2013, 115, 785–793. [Google Scholar] [CrossRef] [Green Version]
  25. Yan, Z.; Lira, V.A.; Greene, N.P. Exercise training-induced regulation of mitochondrial quality. Exerc. Sport Sci. Rev. 2012, 40, 159–164. [Google Scholar] [CrossRef] [Green Version]
  26. Di Donato, D.M.; West, D.W.D.; Churchward-Venne, T.A.; Breen, L.; Baker, S.K.; Phillips, S.M. Influence of aerobic exercise intensity on myofibrillar and mitochondrial protein synthesis in young men during early and late postexercise recovery. Am. J. Physiol. Endocrinol. Metab. 2014, 306, E1025–E1032. [Google Scholar] [CrossRef] [Green Version]
  27. Robinson, M.M.; Dasari, S.; Konopka, A.R.; Johnson, M.L.; Manjunatha, S.; Esponda, R.R.; Carter, R.E.; Lanza, I.R.; Nair, K.S. Enhanced protein translation underlies improved metabolic and physical adaptations to different exercise training modes in young and old humans. Cell Metab. 2017, 25, 581–592. [Google Scholar] [CrossRef] [Green Version]
  28. Edvardsen, E.; Hem, E.; Anderssen, S.A. End criteria for reaching maximal oxygen uptake must be strict and adjusted to sex and age: A cross-sectional study. PLoS ONE 2014, 9, e85276. [Google Scholar] [CrossRef] [Green Version]
  29. Dunaev, A.V.; Dremin, V.V.; Zherebtsov, E.A.; Rafailov, I.E.; Litvinova, K.S.; Palmer, S.G.; Stewart, N.A.; Sokolovski, S.G.; Rafailov, E.U. Individual variability analysis of fluorescence parameters measured in skin with different levels of nutritive blood flow. Med. Eng. Phys. 2015, 37, 574–583. [Google Scholar] [CrossRef]
  30. Zarębska, E.A.; Kusy, K.; Słomińska, E.M.; Kruszyna, Ł.; Zieliński, J. Alterations in exercise-induced plasma adenosine triphosphate concentration in highly trained athletes in a one-year training cycle. Metabolites 2019, 9, 230. [Google Scholar] [CrossRef] [Green Version]
  31. Włodarczyk, M.; Kusy, K.; Słomińska, E.M.; Krasiński, Z.; Zieliński, J. Change in lactate, ammonia, and hypoxanthine concentrations in a 1-year training cycle in highly trained athletes: Applying biomarkers as tools to assess training status. J. Strength Cond. Res. 2020, 34, 355–364. [Google Scholar] [CrossRef]
  32. Wilkinson, S.B.; Phillips, S.M.; Atherton, P.J.; Patel, R.; Yarasheski, K.E.; Tarnopolsky, M.A.; Rennie, M.J. Differential effects of resistance and endurance exercise in the fed state on signalling molecule phosphorylation and protein synthesis in human muscle. J. Physiol. 2008, 586, 3701–3717. [Google Scholar] [CrossRef]
  33. Finsterer, J. Biomarkers of peripheral muscle fatigue during exercise. BMC Musculoskelet. Dis. 2012, 13, 218. [Google Scholar] [CrossRef] [Green Version]
  34. Kane, A.; Sinclair, D. Sirtuins and NADC in the development and treatment of metabolic and cardiovascular diseases. Circ. Res. 2018, 123, 868–885. [Google Scholar] [CrossRef]
  35. Robergs, R.A.; Ghiasvand, F.; Parker, D. Biochemistry of exercise-induced metabolic acidosis. Am. J. Physiol. Regul. Integr. Comp. Physiol. 2004, 287, R502–R516. [Google Scholar] [CrossRef] [PubMed]
  36. Hellmann, M.; Tarnawska, M.; Dudziak, M.; Dorniak, K.; Roustit, M.; Cracowski, J.L. Reproducibility of flow mediated skin fluorescence to assess microvascular function. Microvasc. Res. 2017, 113, 60–64. [Google Scholar] [CrossRef] [PubMed]
  37. Charkoudian, N. Mechanisms and modifiers of reflex induced cutaneous vasodilation and vasoconstriction in humans. J. Appl. Physiol. 2010, 109, 1221–1228. [Google Scholar] [CrossRef] [PubMed]
  38. Chudecka, M.; Lubkowska, A. The use of thermal imaging to evaluate body temperature changes of athletes during training and a study on the impact of physiological and morphological factors on skin temperature. Hum. Mov. 2012, 13, 33–39. [Google Scholar] [CrossRef]
  39. Simmons, G.H.; Wong, B.J.; Holowatz, L.A.; Kenney, W.L. Changes in the control of skin blood flow with exercise training: Where do cutaneous vascular adaptations fit in? Exp. Physiol. 2011, 96, 822–828. [Google Scholar] [CrossRef] [PubMed] [Green Version]
  40. Roche, D.M.; Rowland, T.W.; Garrard, M.; Marwood, S.; Unnithan, V.B. Skin microvascular reactivity in trained adolescents. Eur. J. Appl. Physiol. 2010, 108, 1201–1208. [Google Scholar] [CrossRef] [PubMed]
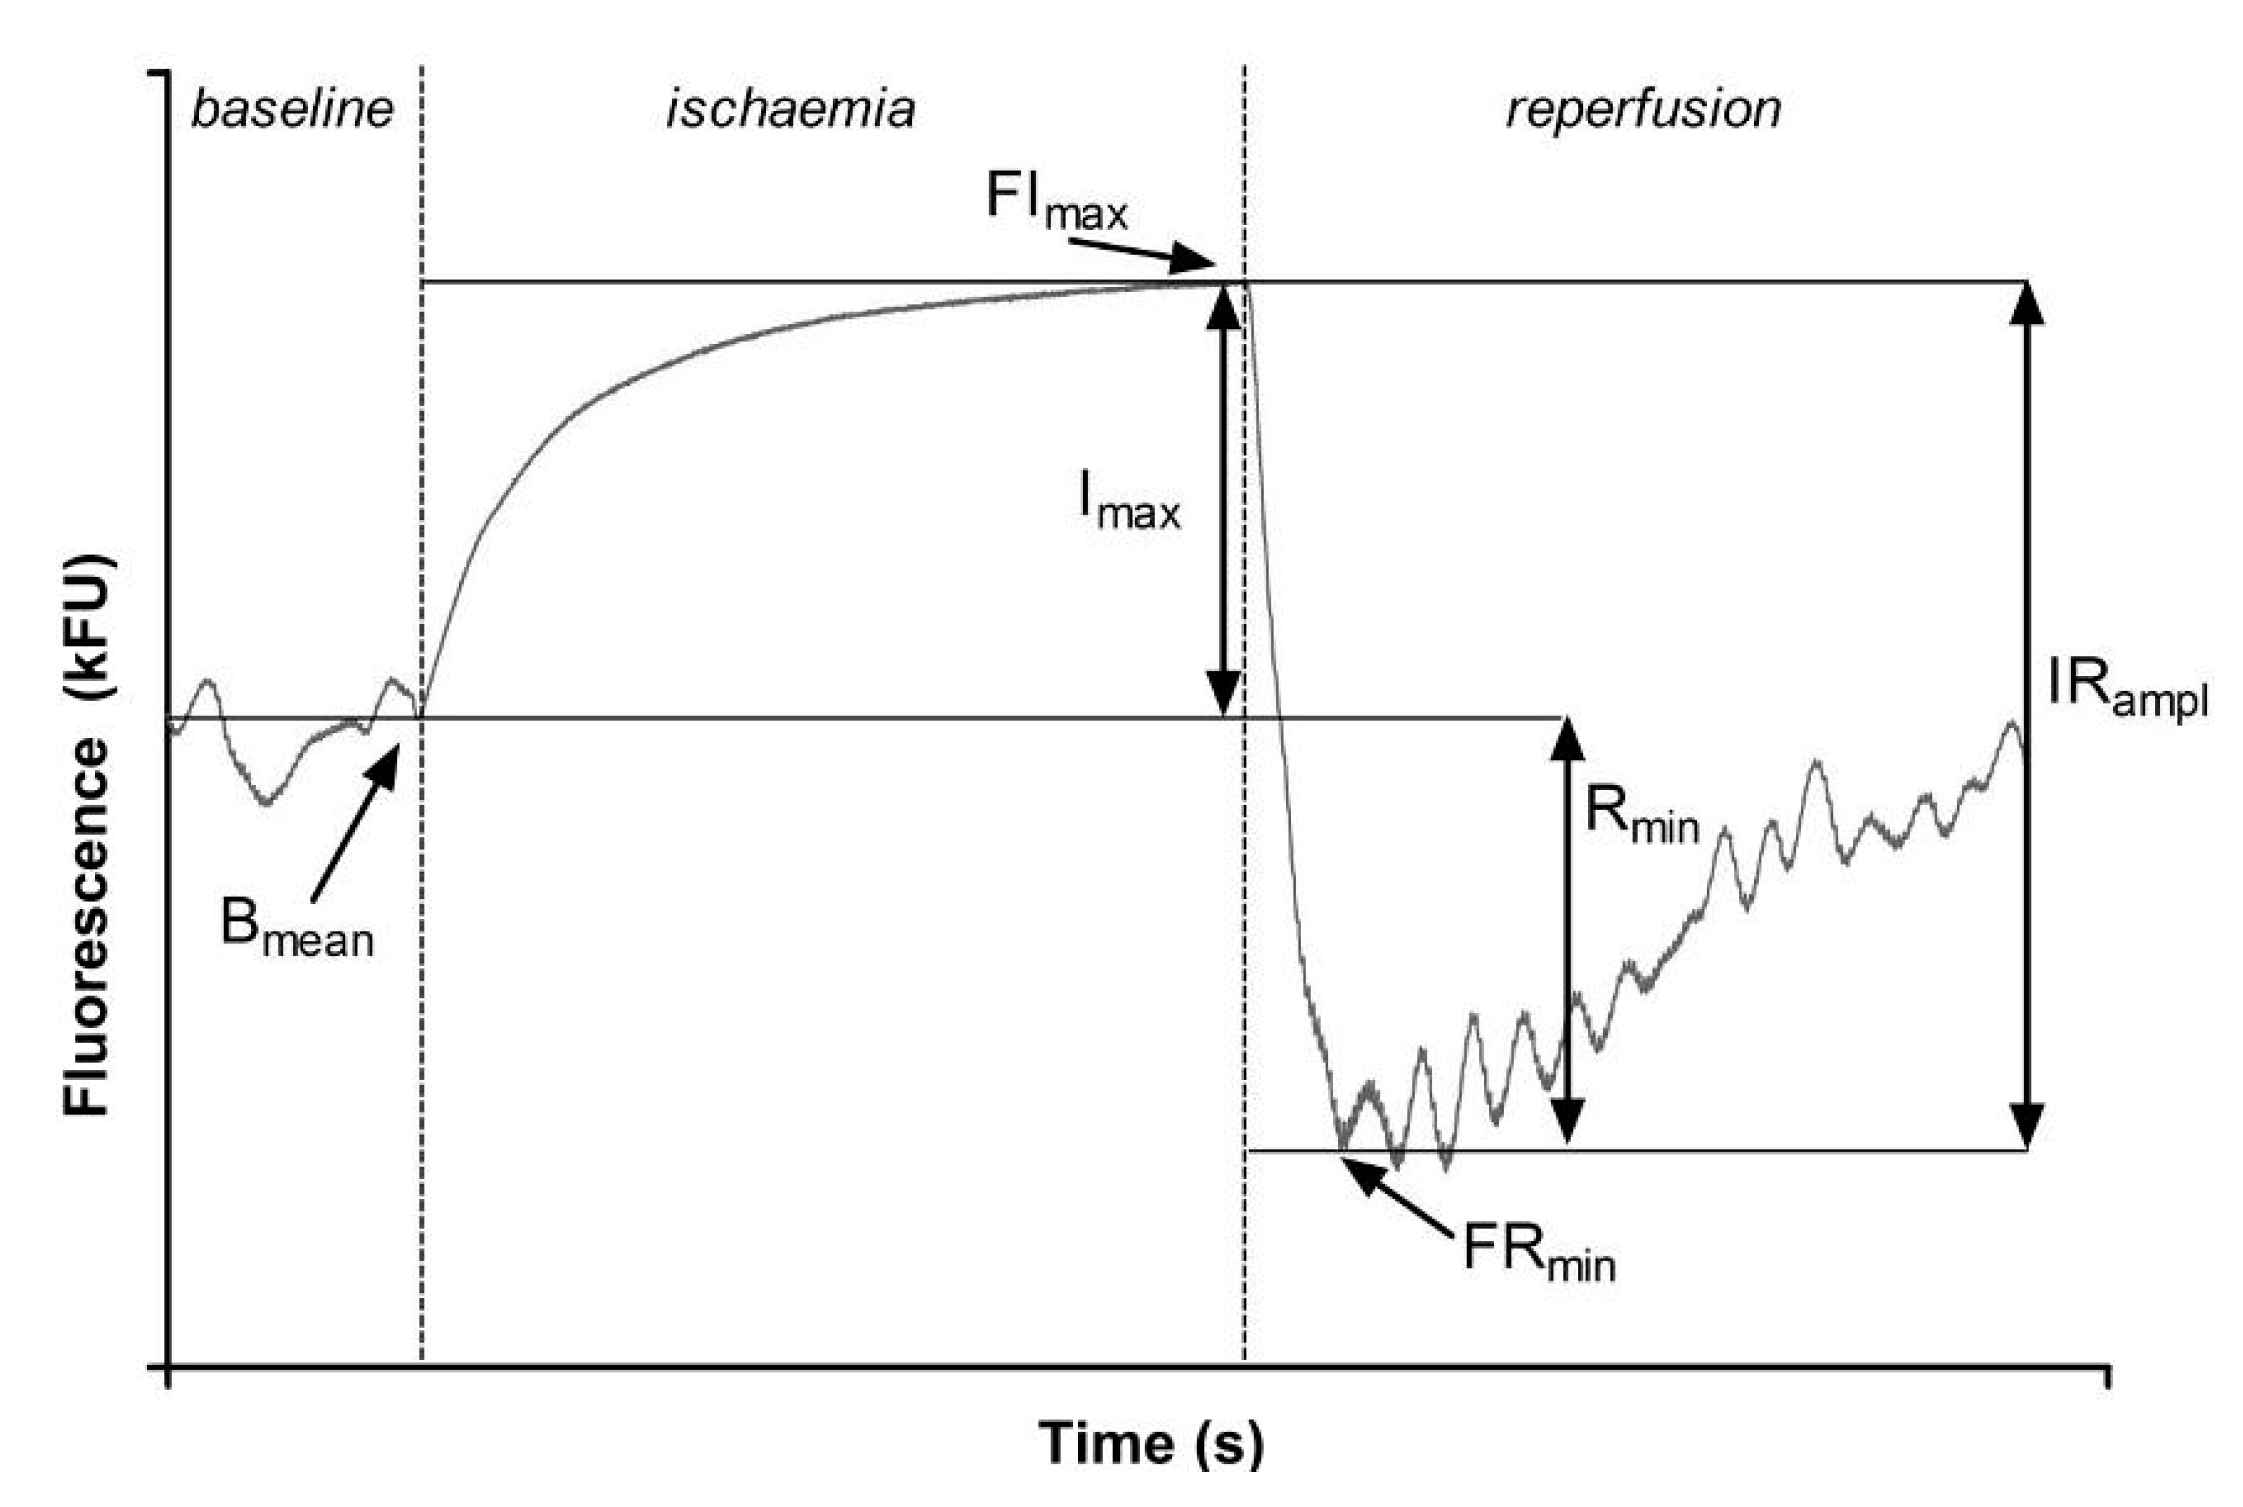
Figure 1. Parameters describing the Flow Mediated Skin Fluorescence. Bmean—Mean value of the basal fluorescence; FImax—Maximal fluorescence during ischemia; FRmin—The first minimal fluorescence value during reperfusion; Imax—The net increase in fluorescence over the baseline during ischemia; IRampl—The amplitude of fluorescence change during ischemia and reperfusion; Rmin—The net reduction in fluorescence below the baseline. Reprinted from Bugaj et al. [5].
Applsci 10 05133 g001
Figure 2. A sample Flow Mediated Skin Fluorescence measurement in a 23-year-old male sprinter. Changes in nicotinamide adenine dinucleotide fluorescence are shown before and after 7-weeks of training, at rest, and after cardiopulmonary exercise test until exhaustion. The first 2 min serve to determine the baseline fluorescence level. This was followed by a 200-s ischemia (increase in fluorescence) and a 290-s reperfusion (decrease in fluorescence).
Applsci 10 05133 g002
Figure 3. Measured parameters. Flow Mediated Skin Fluorescence parameters in athletes (N = 41) in two examinations, before and after the cardiopulmonary exercise test until exhaustion. Bmean—Changes in the mean value of the basal fluorescence; FImax—Changes in maximal fluorescence during ischemia; FRmin—Changes in the first minimal fluorescence value during reperfusion. Values are means (SD). A two-way analysis of variance (relation between exercise and training), post-hoc Scheffe test, significant differences between pre- and post-exercise: *** p < 0.001, ** p < 0.01, * p < 0.05; significant differences between before and after training # p < 0.001, p < 0.01, § p < 0.05.
Applsci 10 05133 g003
Figure 4. Calculated parameters. Flow Mediated Skin Fluorescence parameters in athletes (N = 41) in two examinations, before and after the cardiopulmonary exercise test. Imax—Changes in the net increase in fluorescence over the baseline during ischemia; IRampl—Changes in the amplitude of fluorescence change during ischemia and reperfusion; Rmin—Changes in the net reduction in fluorescence below the baseline; CImax – Changes in Imax/IRampl ratio. Values are means (SD). A two-way analysis of variance (relation between exercise and training), post-hoc Scheffe test, significant differences between pre- and post-exercise: *** p < 0.001, ** p < 0.01, * p < 0.05; significant differences between before and after training # p < 0.001, p < 0.01, § p < 0.05.
Applsci 10 05133 g004
Table 1. Basic characteristics of the studied athletes.
ParameterBefore TrainingAfter Training
Age (years)22.4 ± 4
Training experience (years)8 ± 2.3
Height (cm)178.1 ± 7.3178.1 ± 7.3
Weight (kg)69.1 ± 10.369 ± 10.3
BMI (kg/m2)21.6 ± 2.321.6 ± 2.3
SBPrest (mmHg)127.6 ± 14.3119.3 ± 10.8 ***
DBPrest (mmHg)69.9 ± 7.372.9 ± 9.3 *
SBPexerc (mmHg)148 ± 18.3139.2 ± 16.3 **
DBPexerc (mmHg)74.5 ± 8.178.2 ± 8.1 *
VO2max (mL/min/kg)58.8 ± 8.659.5 ± 8.6
HRpeak (beats/min)191.7 ± 8191.9 ± 8.9
LArest (mmol/L)1.2 ± 0.51.0 ± 0.3 **
LAmax (mmol/L)9.9 ± 1.510.2 ± 1.9
Averaged data are presented as mean ± standard deviation (SD), and results of the t-test for dependent samples, * p < 0.05, ** p < 0.01, *** p < 0.001 significantly different pre-training. BMI−body mass index; SBP−systolic blood pressure; DBP−diastolic blood pressure; rest−before cardiopulmonary exercise test; exerc−after cardiopulmonary exercise test; VO2max (mL/min/kg)−maximal oxygen uptake; HRpeak−peak heart rate; LArest−resting lactate concentration; LAmax−maximal lactate concentration.