Article

Field Monitoring of the Deformation and Internal Forces of the Surrounding Rock and Support Structures in the Construction of a Super-Span High-Speed Railway Tunnel—A Case Study

Key Laboratory for Urban Underground Engineering of Ministry of Education, Beijing Jiaotong University, Beijing 100044, China
*
Author to whom correspondence should be addressed.
Appl. Sci. 2020, 10(15), 5182; https://doi.org/10.3390/app10155182
Submission received: 30 June 2020 / Revised: 15 July 2020 / Accepted: 23 July 2020 / Published: 28 July 2020
(This article belongs to the Section Civil Engineering)

Abstract

:
A super-span tunnel that has the characteristics of a large excavation area, a small high-span ratio and a significant spatial effect exhibits a complex mechanical response during the excavation process. In this paper, taking the Badaling Great Wall station in Beijing, China as the engineering background, a case study of field monitoring a super-span tunnel has been presented. A typical monitoring section was selected in the super-span transition section of the tunnel and the deformation and forces of both the surrounding rock and the support structures were systematically monitored. The dynamic evolution and the spatial distribution characteristics of the monitoring data, including the internal displacement of the surrounding rock, the tunnel displacement, the contact pressure between the surrounding rock and the primary supports, the contact pressure between the primary and secondary supports, the axial forces in the bolts and cables, the internal forces in both the steel arches and the secondary supports and the internal stresses of the surrounding rock, were analyzed. The results of the monitoring and the analyses have shown that the deformation and the forces acting on both the surrounding rock and the tunnel’s lining are directly related to the construction procedures, the geological conditions and the locations in the super-span tunnel. According to the results, a few suggestions to improve the construction of the tunnel have been proposed.

1. Introduction

As the country’s economy had developed, the construction of tunnels in China has entered an era of rapid development [1,2]. More and more super-span tunnels have been proposed in the fields of water conservancy, transportation and municipal engineering [3,4,5]. Table 1 has shown a few typical super-span tunnel examples that have been constructed in China in recent years. Over the past 30 years, Japan, South Korea and some European countries have also accumulated significant experience in constructing super-span tunnels [6]. Super-span tunnels differ from conventional cross-section tunnels in that they have characteristics of super spans, complex support structures and frequent stress conversion between the surrounding rock and the support structures during the different excavation stages. Therefore, designing the support structures, selecting the excavation methods and studying the stability of the surrounding rock of super-span tunnels are widely considered by scholars.
A series of researches have been carried out in the field of super-span tunnels [7,8,9]. Some achievements have been made in the design of supporting structures. Feng et al. [10] evaluated the installation timing of the initial ground supports for a super-span tunnel constructed in hard rock. Wu et al. [11] proposed a new supporting method of shallow buried super-span tunnel based on small tunnel sheds. Jia et al. [12] demonstrated that using a steel-tube-slab structure combined with the pile-beam-arch method is an effective approach when constructing a super-span underground station. Some scholars also focused on the selection of the excavation methods. Sadaghiani and Dadizadeh [13] introduced a successful application of a method for construction of the Mansour Station based on a new pre-supporting system. Mori and Abe [14] studied the effectiveness of the multi-micro shield tunneling method in super rectangular cross-section tunneling. Sharifzadeh et al. [15] analyzed the effect of the central diaphragm and side wall drift methods on the disturbance control of the surrounding rock during excavation of a super-span tunnel. Tonon [16] analyzed the construction concepts of the sequential excavation method as well as new Austrian tunneling method through a case study of a series of super-span tunnels. In addition, some breakthroughs have been made in the study of the stability of the surrounding rock stability. He et al. [17] simulated the deformation and failure evolution of the surrounding rock of the Laohushan tunnel using the improved discontinuous deformation analysis method as well as binocular stereo photography measurement technology. Verma et al. [18] carried out field investigations for five different tunnels located in the Himalayas in India in order to study blast induced rock damage around tunnels. Molladavoodi [19] calculated the response curve and analyzed the radius of the excavation damage zone by combining damage constitutive models with the convergence-confinement method. It can be seen that the above studies were mostly based on experimental investigations, numerical simulations and theoretical analysis. The experimental investigations are mainly influenced by scale effects, and the numerical simulations are excessively dependent on the construction of the model and the parameters that are selected. In addition, it is difficult to use the results of the theoretical analysis as the basis for the design and construction of super-span tunnels due to their inability to deal with complex situations. As the most intuitive and effective research method, field monitoring has rarely been used in study of super-span tunnels; this is because the complex construction process poses considerable difficulty in the installation and preservation of the monitoring elements.
The super-span transition section of the Badaling Great Wall station has great research value because its maximum span reaches 32.7 m; this is 1.5 times the span of most super-span tunnels. This paper has taken the Badaling Great Wall station as the engineering background, and has analyzed the deformation and internal forces of the surrounding rock and support structures. The aims of this research were as follows: (1) to ascertain the state of the deformation and the forces of the surrounding rock, in order to assess the rationality of the excavation method and evaluate the stability of the surrounding rock, as well as to allow for timely warnings of possible engineering accidents in the construction of the tunnel; (2) to assess the stress-strain state of the supporting structures, optimize the support types and parameters, and ensure the safety and quality of the super-span tunnel during its construction. This study can provide a useful reference for the research, design and construction of similar projects in the future.

2. Project Overview and In-Situ Monitoring

2.1. Badaling Great Wall Station

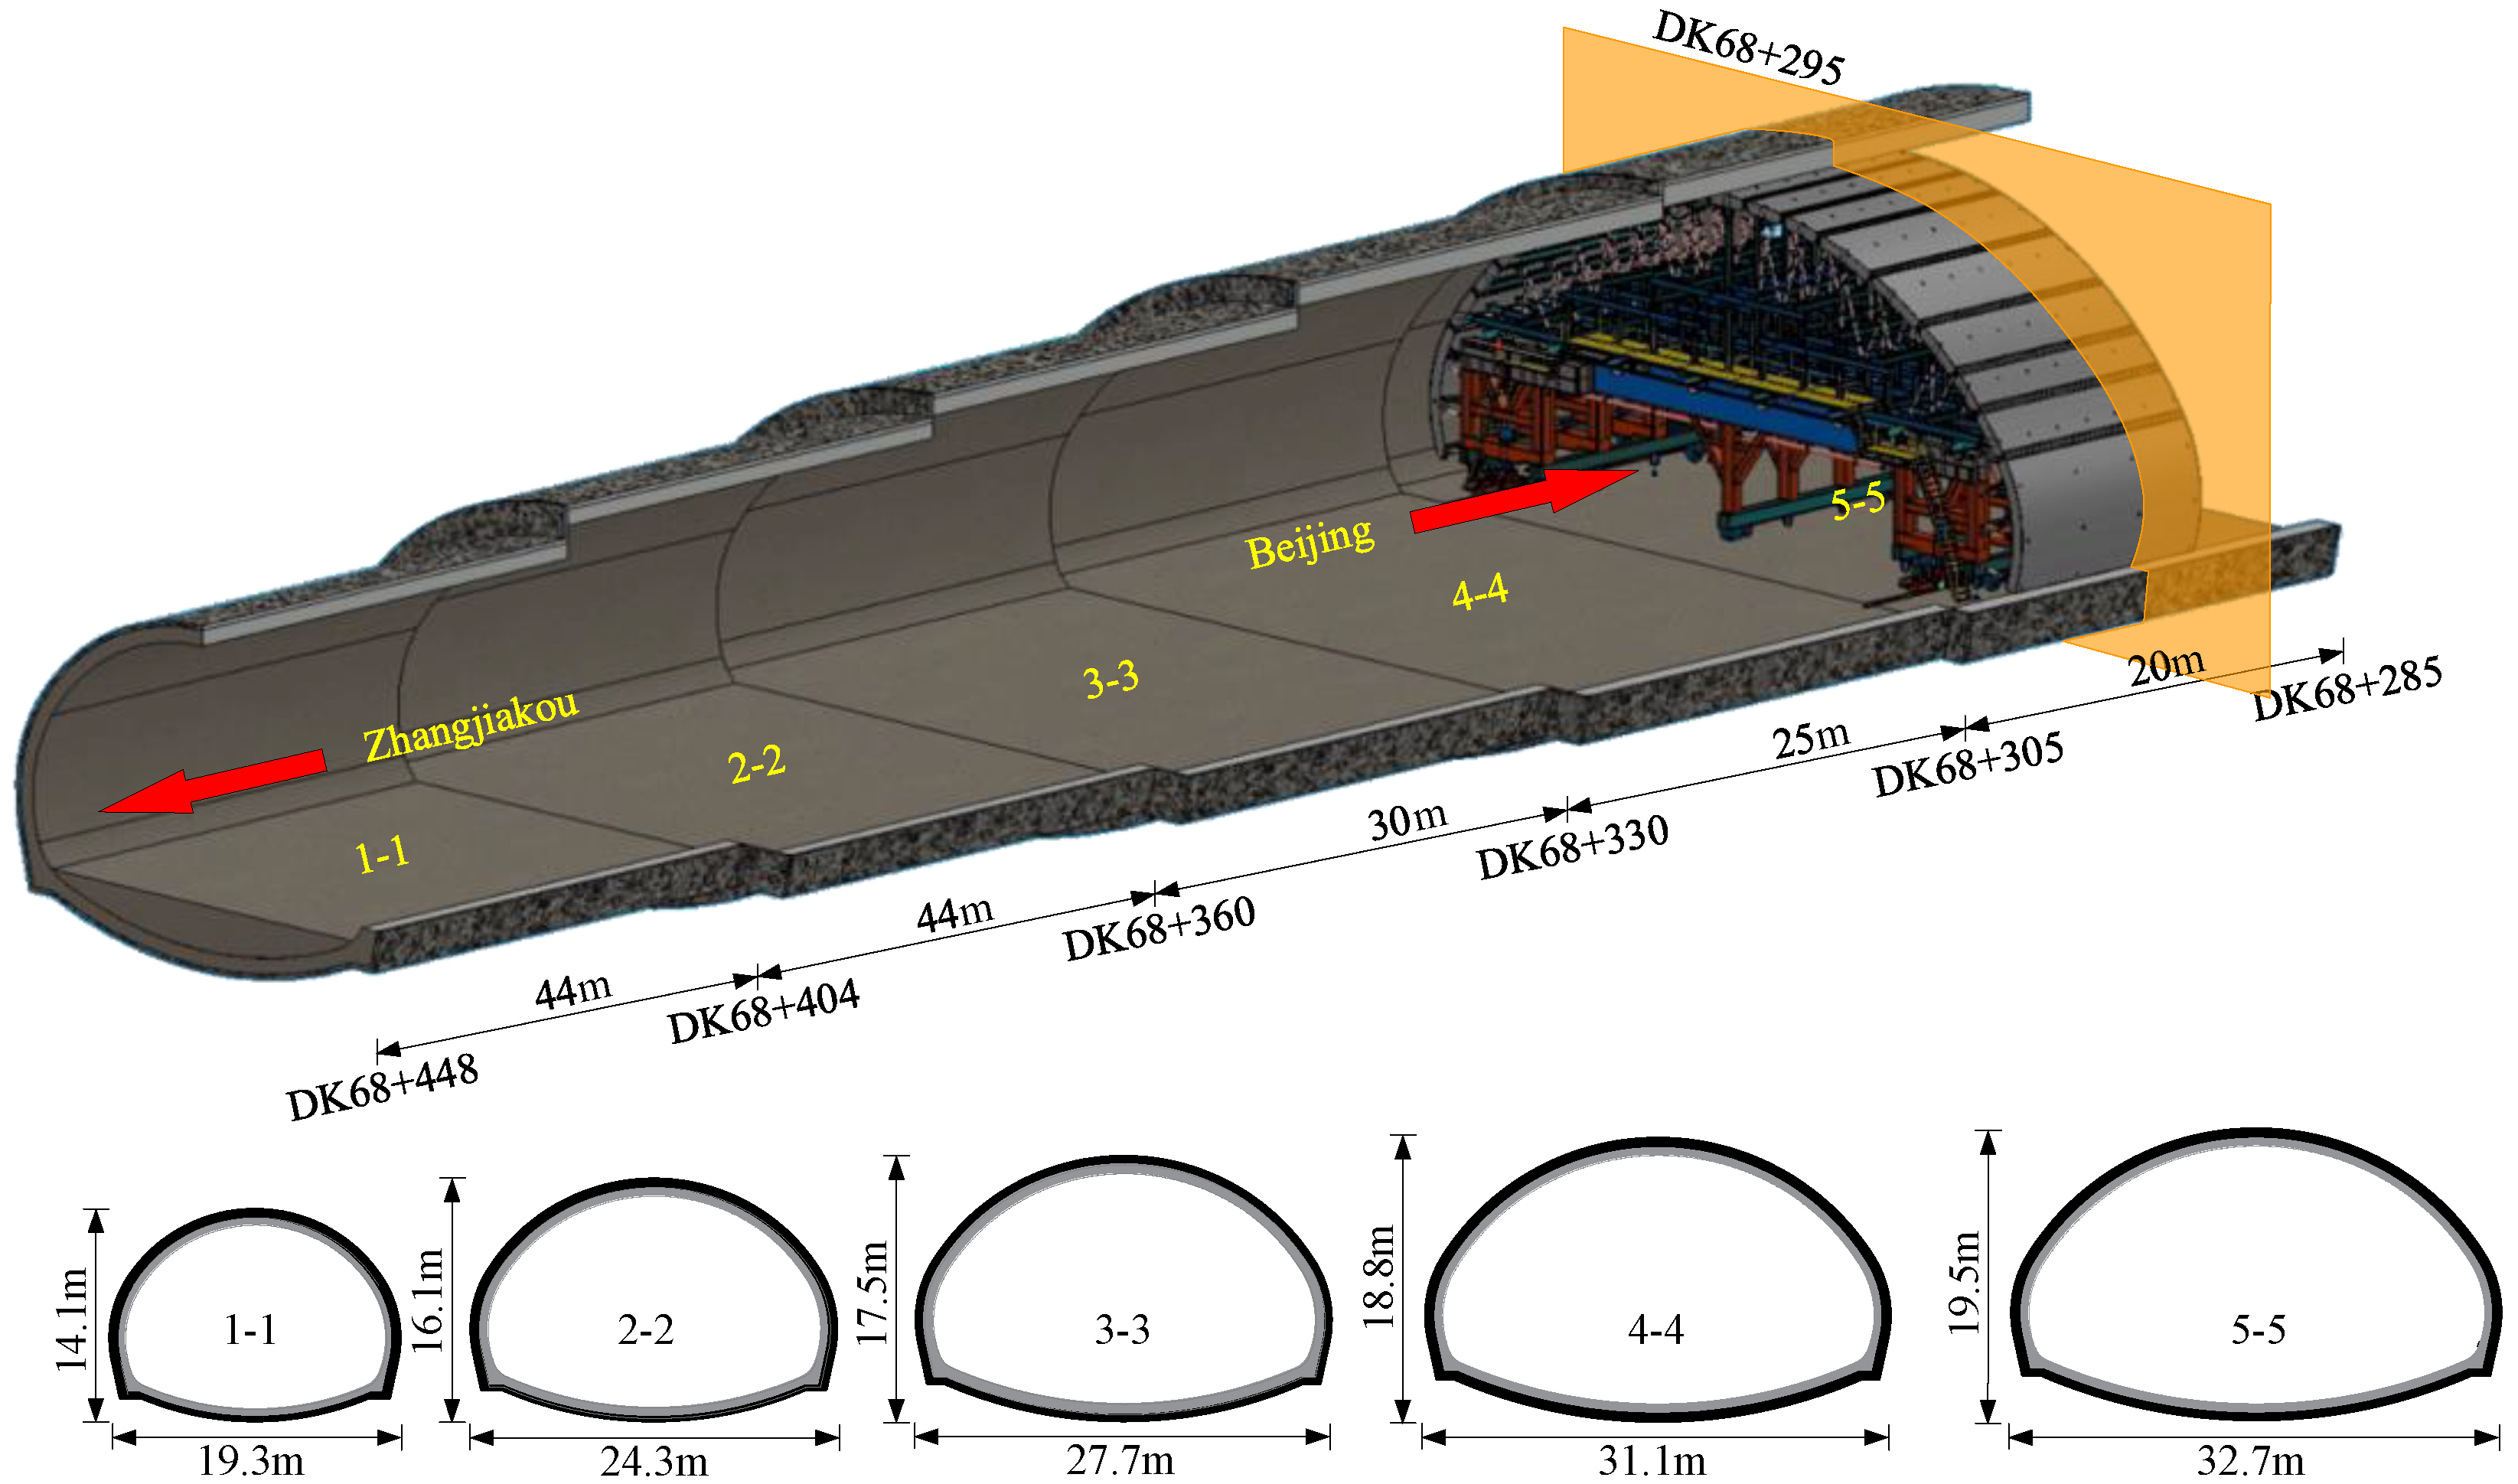
The Beijing-Zhangjiakou High-speed railway is about 174 km long, it has ten stations, and it is an important passenger transport project for the 2022 Beijing Winter Olympic Games (Figure 1). It shortens the travel time from Beijing to Zhangjiakou in Hebei Province to less than one hour. The Badaling Great Wall station, at a maximum depth of 102 m, is the deepest high-speed underground railway station in China, with a total length of 470 m. Figure 2 has shown the main structure of the station, the 163 m long super-span tunnels are located at either end of the station. Figure 3 has shown the layout of the super-span tunnel in the Zhangjiakou direction with five cross-section sizes from DK68+285 to DK68+448.The excavation span of the tunnel within the range of DK68+285 to DK68+305 reaches 32.7 m with an excavation area of 494.4 m2. As the underground high-speed railway tunnel with the largest span in the world, the construction process was very risky.

2.2. Geological Conditions

The Badaling Great Wall station passes through the Jundushan mountains, and there are obvious ground elevation changes. The ground elevation is around 600–1030 m, and the depth of the groundwater level is between 11–77 m. Figure 4 has shown the geology of the super-span tunnel in the Zhangjiakou direction. Complex rock types and several groups of faults and joint systems with different trends have together formed a complex geological environment. The typical physical and mechanical properties of the surrounding rock in the relevant areas have been detailed in Table 2. According to the geological survey data, the ground quality of the surrounding rock was classified as Grade V. Obvious ground settlement and engineering accidents can easily occur when tunneling in the rock of Grade V, as it is considered to be very poor quality. A simplified comparison of the quality of the rock mass between the Chinese classification basic quality (BQ) system and the widely used quality (Q) system has been listed in Table 3 [20].

2.3. Structure of the Tunnel

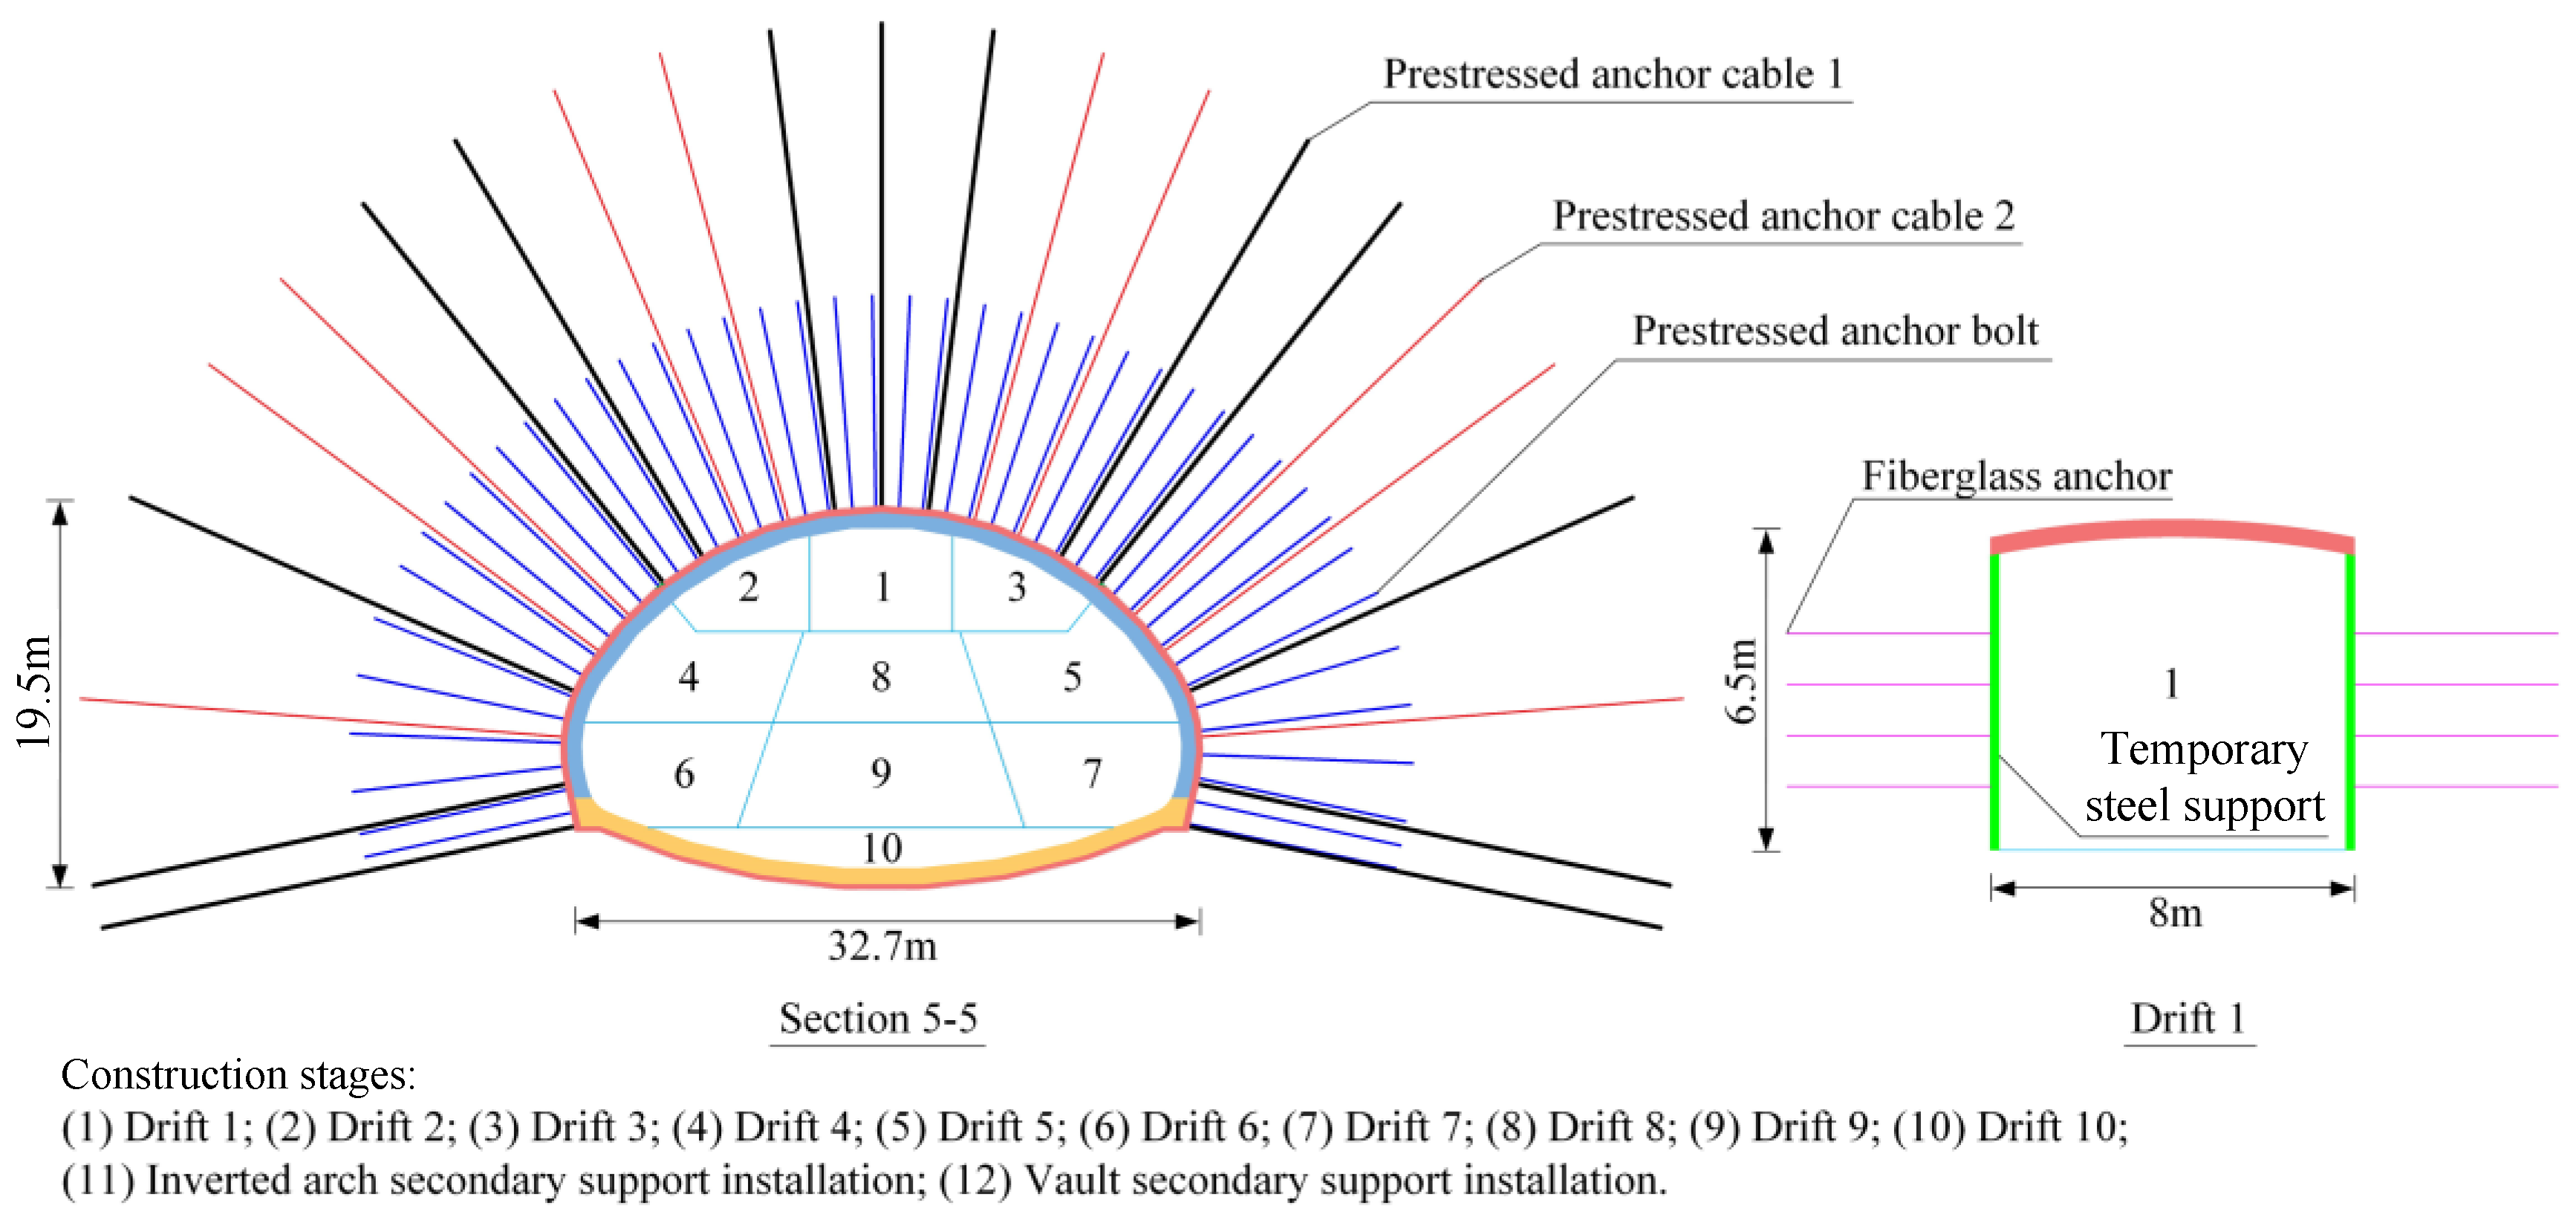
The bench method was used to excavate the super-span transition section. The tunnel was divided into 11 drifts for drilling and blasting and the numbers 1–12 represented the construction stages of it. Figure 5 has shown the support pattern and the excavation process of Section 5-5 of the super-span transition section in the rock of Grade V; detailed support parameters have been shown in Table 4. It should be noted that the shotcrete was sprayed in three layers using different formulations. The initial layer of the shotcrete was immediately sprayed with a thickness of 5 cm after blasting excavation to provide a safe working environment for subsequent construction. Therefore, C30 nano-silica and steel fiber reinforced concrete with high early strength was selected to be used. The 18.2 cm thick second layer of shotcrete construction was carried out after the steel arch had been installed; C30 steel fiber reinforced concrete with improved mechanical properties and toughness was selected to improve the load bearing capacity of the shotcrete. The third layer of shotcrete was sprayed after the prestressed anchor bolts and cables had been installed and tensioned to strengthen the primary supports; the layer was 11.8 cm thick, and the material used was C30 ordinary concrete. The temporary supports installed on the sidewalls of Drift 1 were removed during excavation of Drifts 2 and 3. In order to facilitate the following analysis, Drift 1, Drift 2 and Drift 3, Drift 4 and Drift 5, Drift 6 and Drift 7, Drift 8 and Drift 9, and Drift 10 were defined as the top heading (TH), the upper bench (UB), the middle bench (MB), the lower bench (LB), the rock pillar (RP), and the inverted arch (IA), respectively.

2.4. Monitoring Arrangement

During the construction process of the super-span transition section, detailed monitoring of the deformation and the forces of both the surrounding rock and the support structures was carried out. It can be seen from Figure 3 and Figure 4 that the tunnel within the range of DK68+285–DK68+305 has the characteristics of the largest span and the poorest rock quality. Therefore, the middle section of the above interval, that is DK68+295, was selected as the section to be monitored.
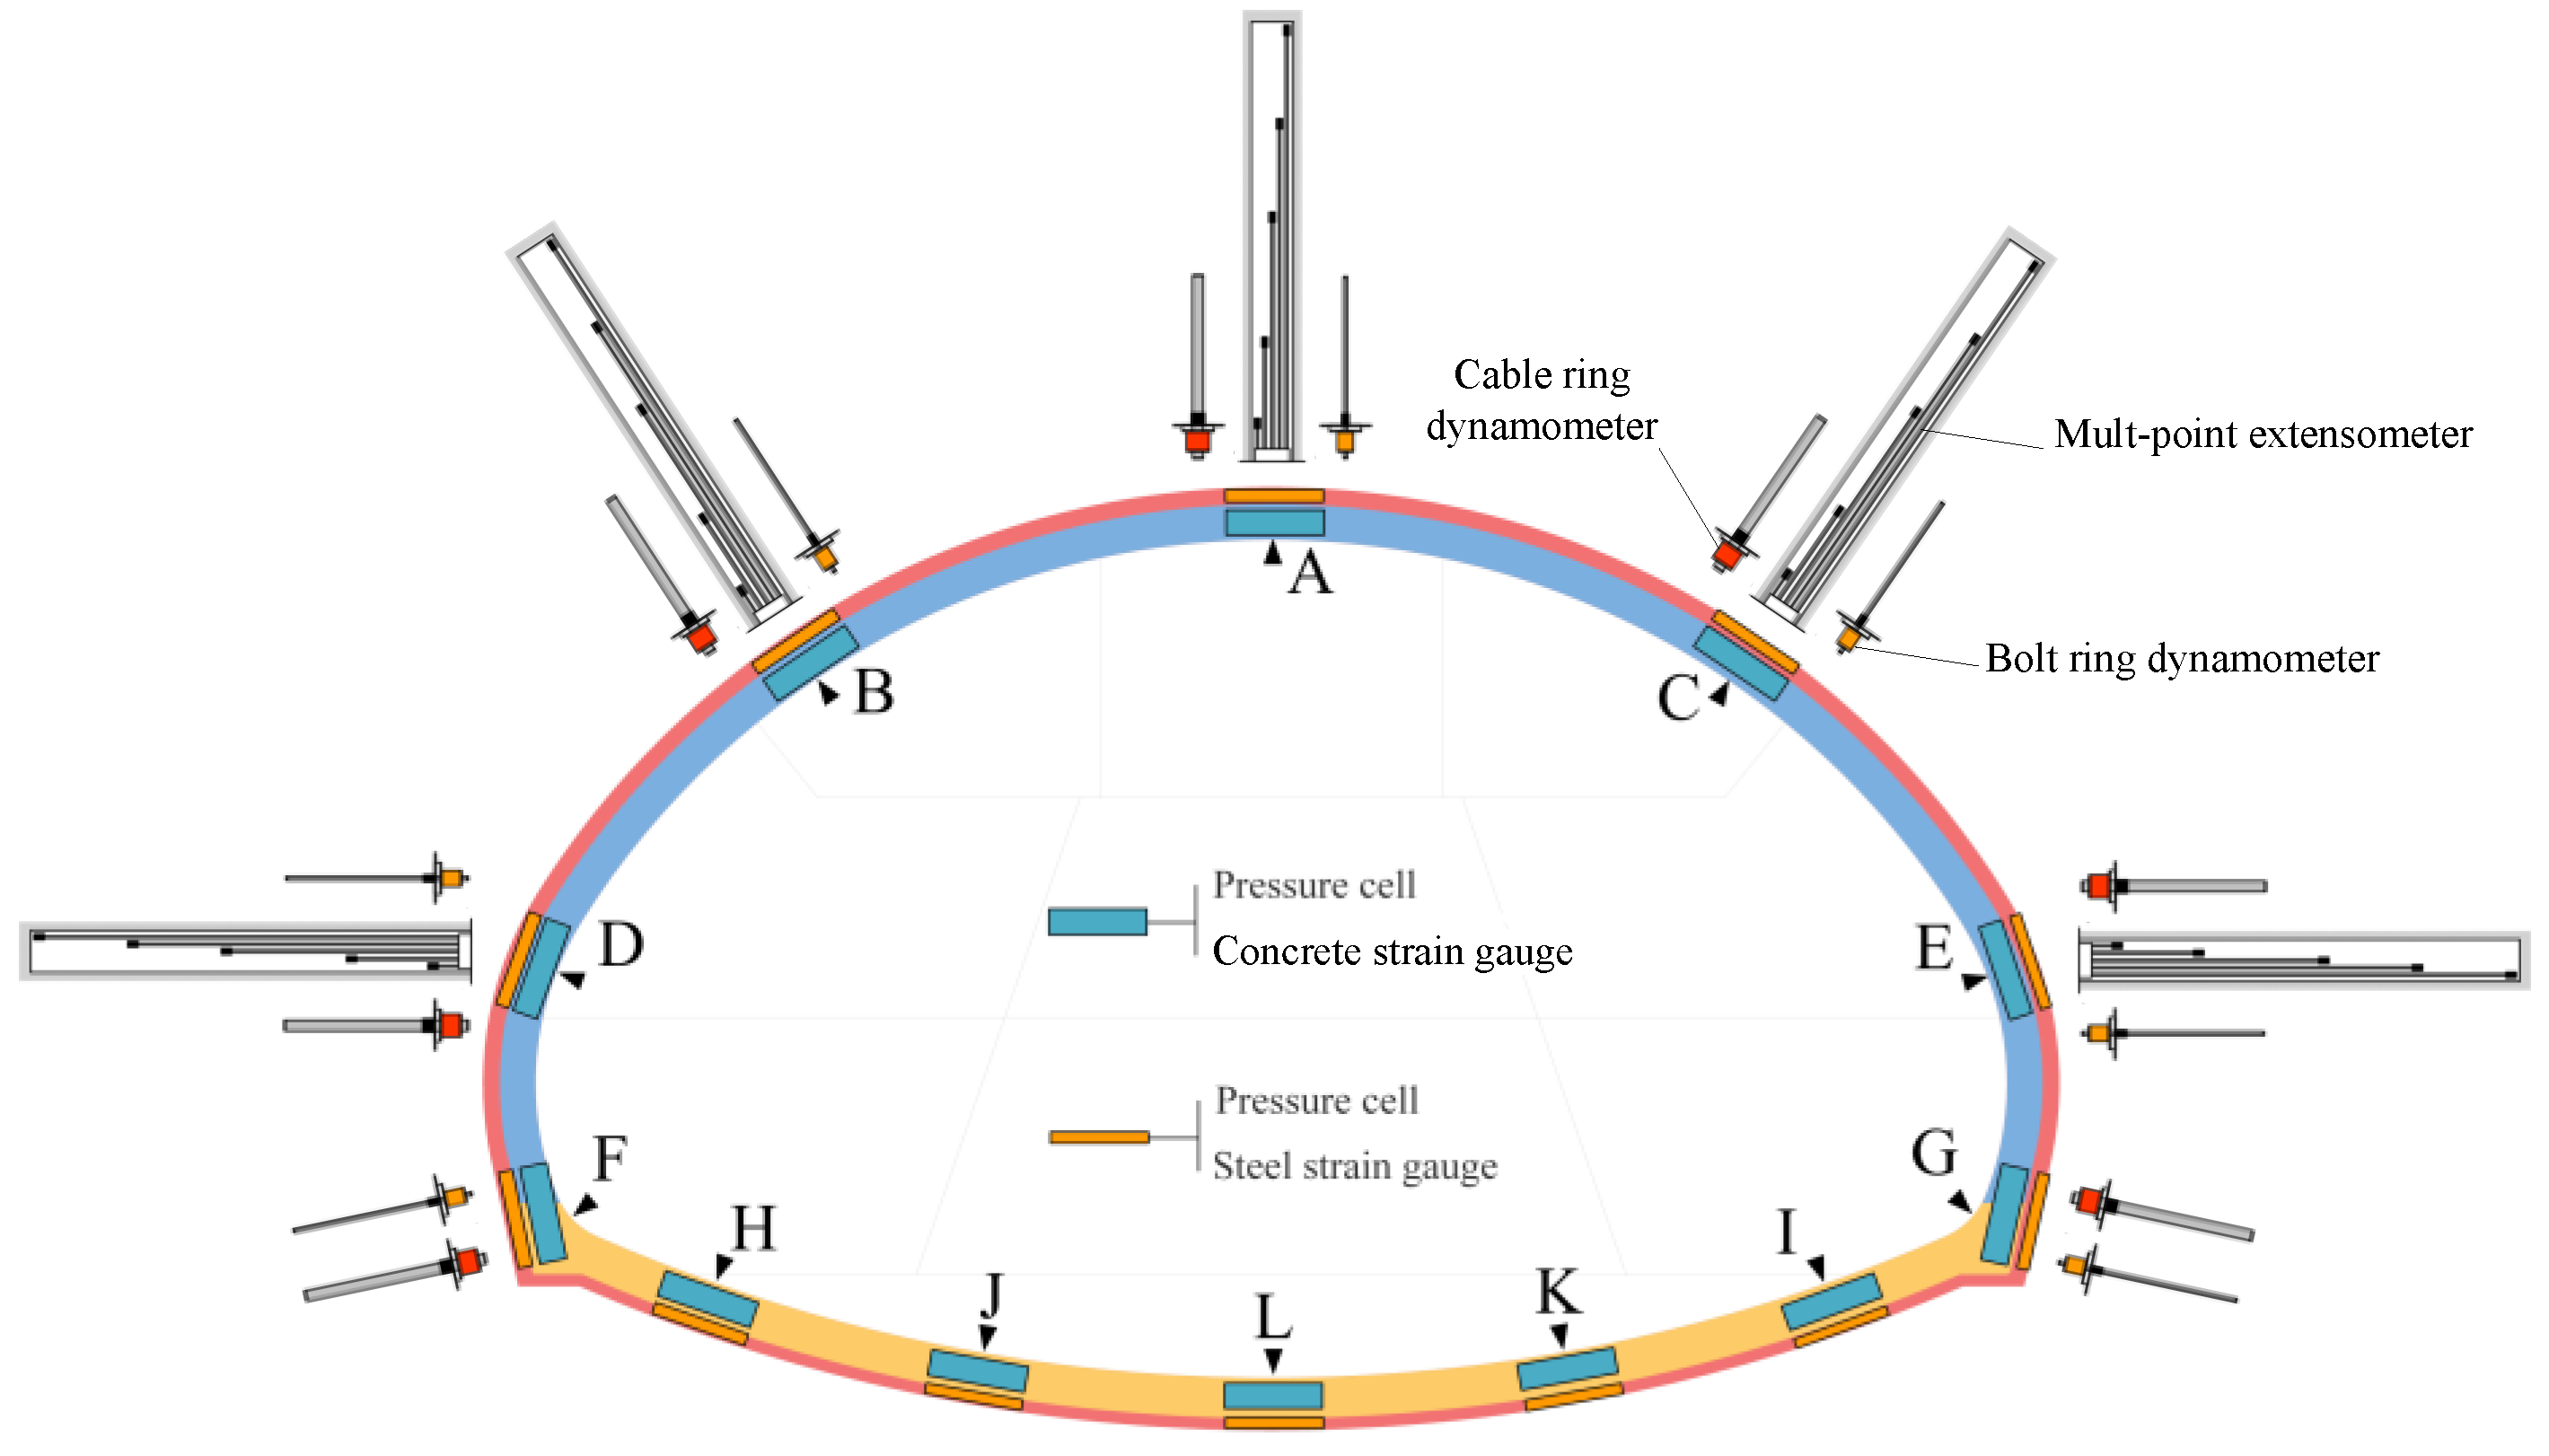
As the most commonly used tunnel monitoring instrument, total stations were used to monitor the tunnel displacement, i.e., arch settlement and horizontal convergence. The internal displacement of the surrounding rock was monitored using multi-point extensometers (see Figure 6). In order to reduce the relative displacement between the anchor heads and the rock around the boreholes, hydraulic anchor heads were used instead of the common anchor heads. The claws of the hydraulic anchor heads could be expanded by increasing the pressure in the oil pump and then anchored in the rock to provide additional holding power.
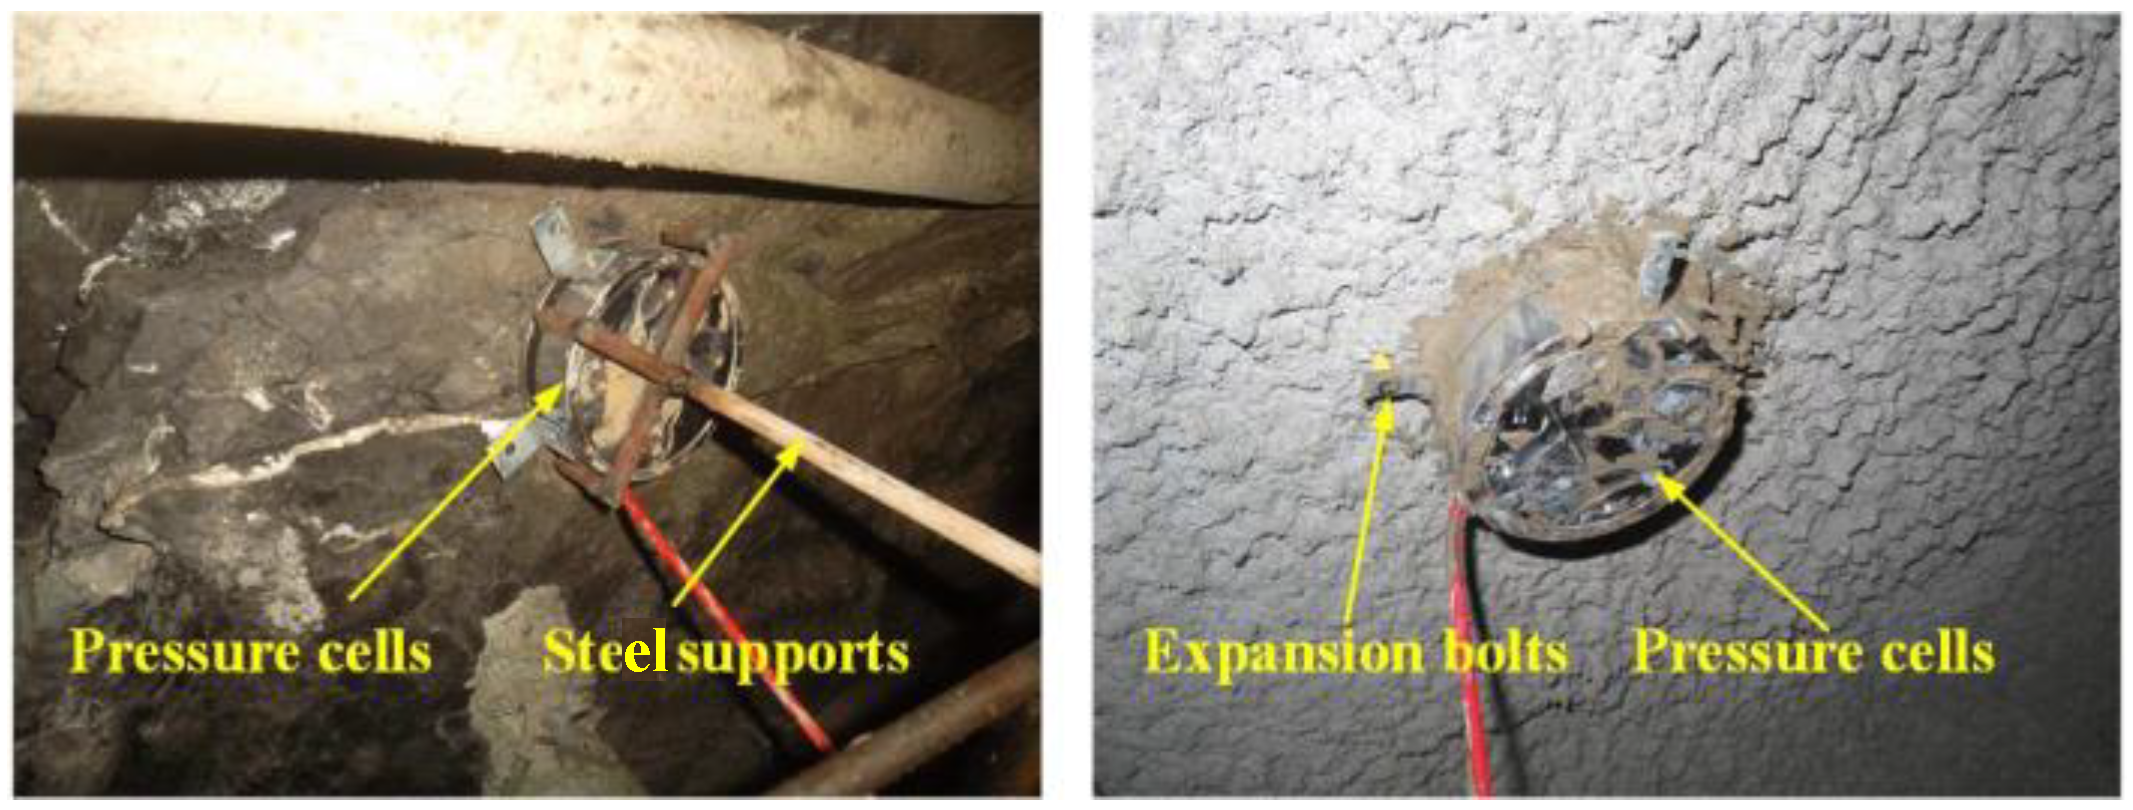
The contact pressure between the surrounding rock and the primary supports and the contact pressure between the primary and secondary supports were monitored using vibrating-wire pressure cells (see Figure 7). In order to make the monitoring results more accurate, measures were taken to ensure that the surface of the pressure cells closely adhered to the surface of the measured mediums. Therefore, when monitoring the contact pressure between the surrounding rock and the primary supports, the steel supports were used to place the pressure cells on a relatively flat surface of the surrounding rock, and the end of these were welded to the four bar lattice girders. When monitoring the contact pressure between the primary and secondary supports, the pressure cells were fixed to the surface of the shotcrete using expansion bolts before the installation of geotextiles and waterproof boards.
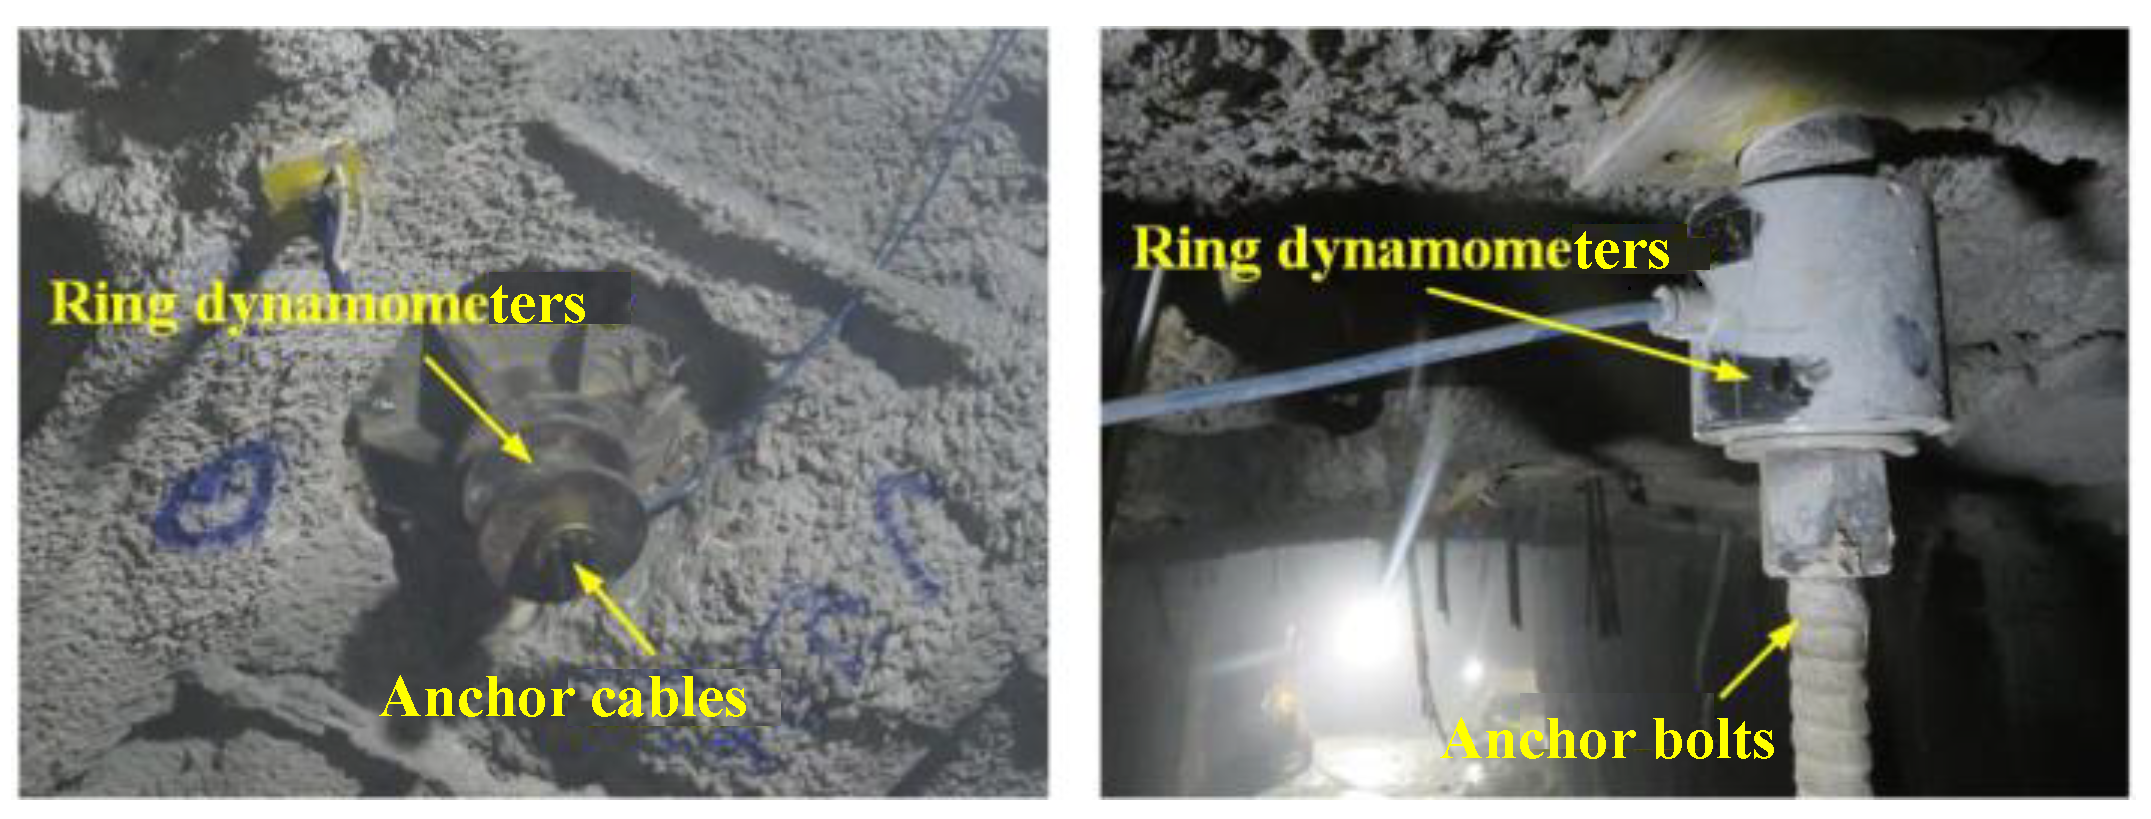
Ring dynamometers were used to monitor the axial forces in both the anchor bolts and cables (see Figure 8).
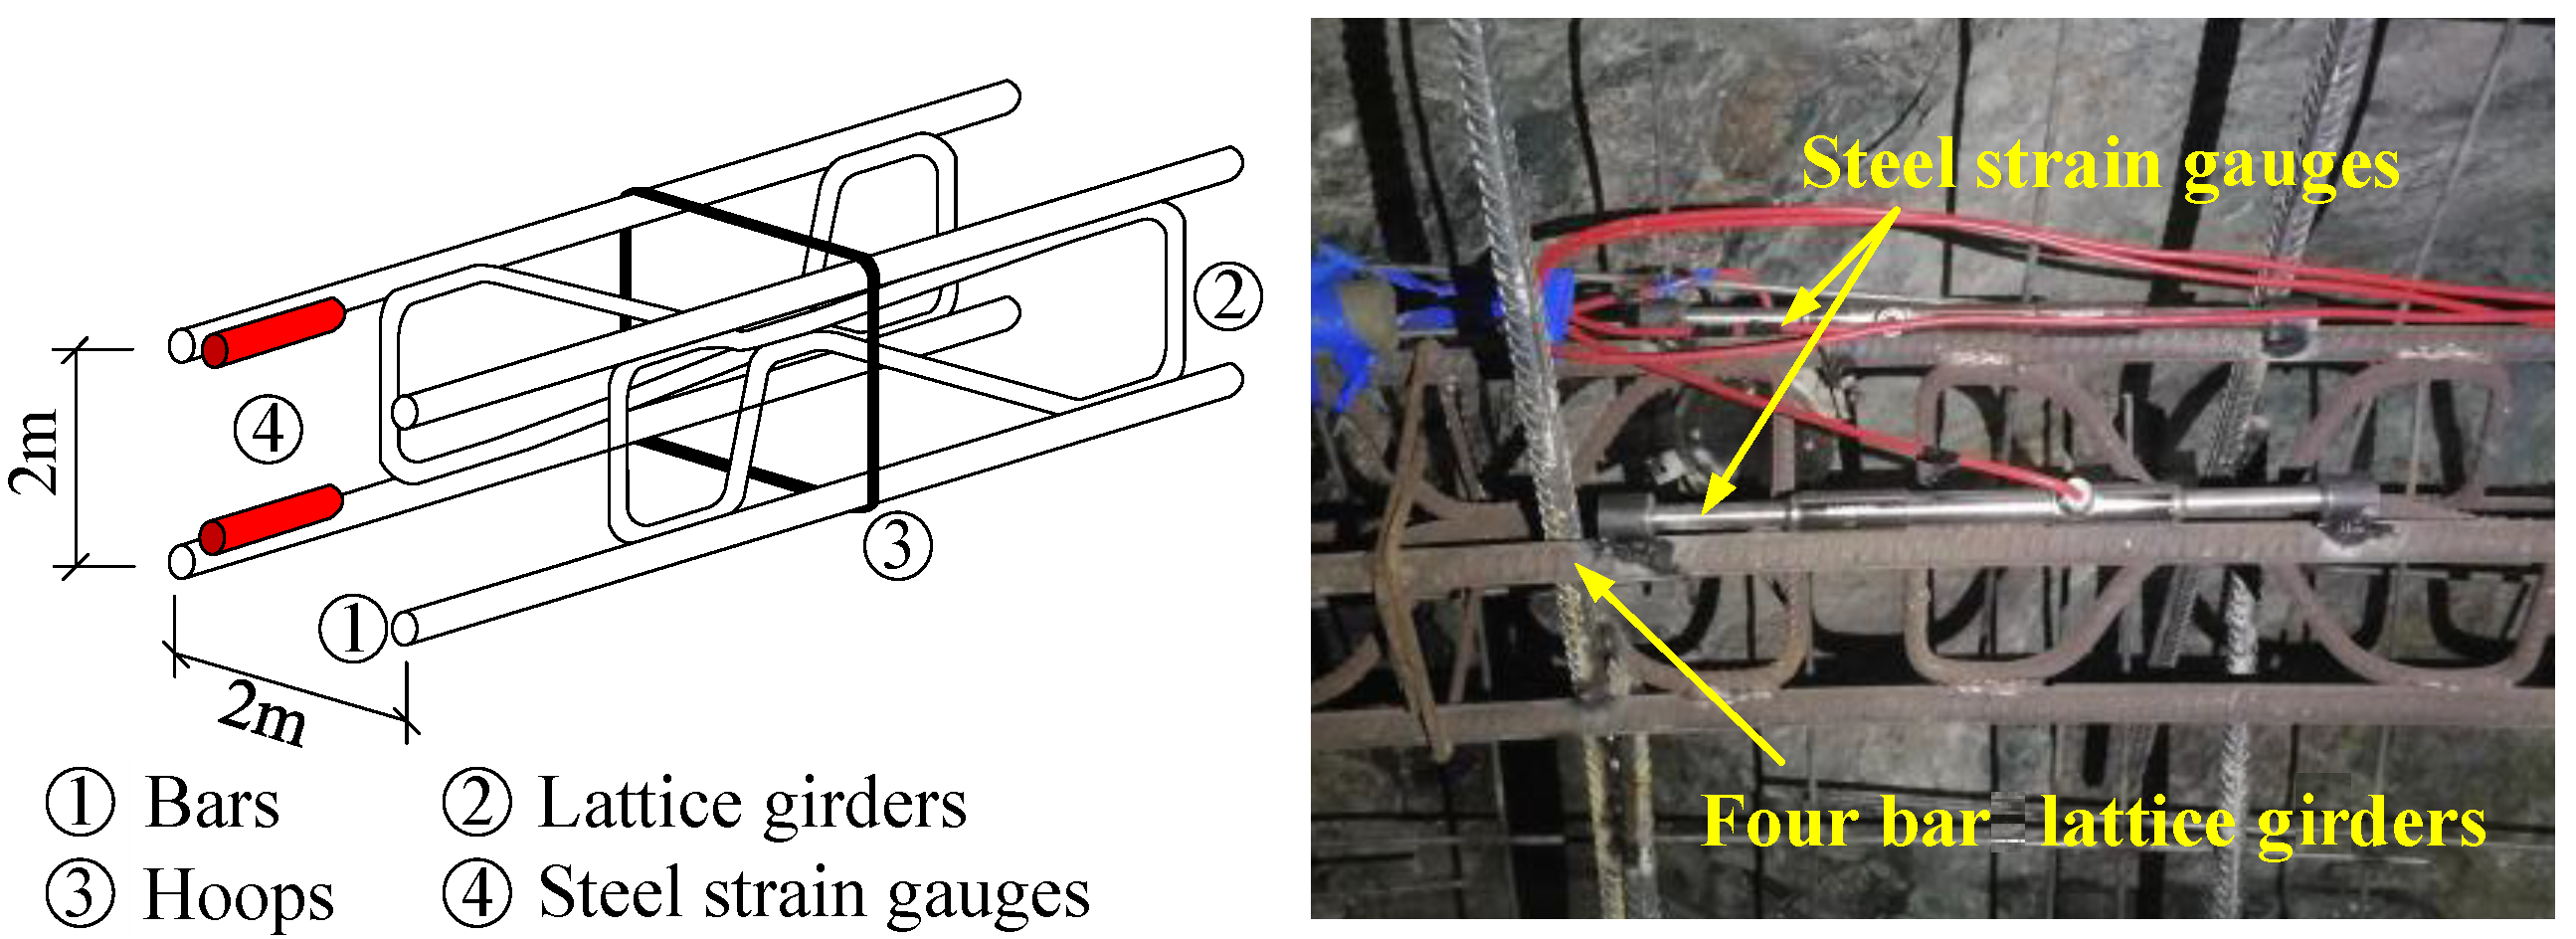
As shown in Figure 9, monitoring of the internal forces of the four bar lattice girders were obtained using steel strain gauges; the monitoring elements at each monitoring point were installed in pairs. The side facing away from the surrounding rock is defined as the inner side, and the side nearest to the surrounding rock is defined as the outer side, the definition holds true here in after.
The stresses in the concrete of the secondary supports were monitored by the concrete strain gauges (see Figure 10). Based on the monitored values, the internal forces in the secondary supports were calculated from Equation (1):
N = 1 2 ( σ i n n e r + σ o u t e r ) b h ; M = 1 2 ( σ i n n e r σ o u t e r ) b h 2
where, N and M are the axial force and bending moment to be calculated, respectively; σ i n n e r and σ o u t e r denote the stress of the inner side and outer side of the secondary supports, respectively; b represents the distance between the two adjacent main bars in the longitudinal direction; h is the thickness of the secondary support.
After comprehensive consideration of the design of the support and excavation stages, the layout of the monitoring points was carried out, as shown in Figure 11. According to the location of the monitoring points, Points A, B and C, D and E, F and G, H to L were defined as the crown, the spandrel, the haunch, the arch springing and the inverted arch, respectively.

3. Monitoring Results and Analysis

3.1. Tunnel Displacement

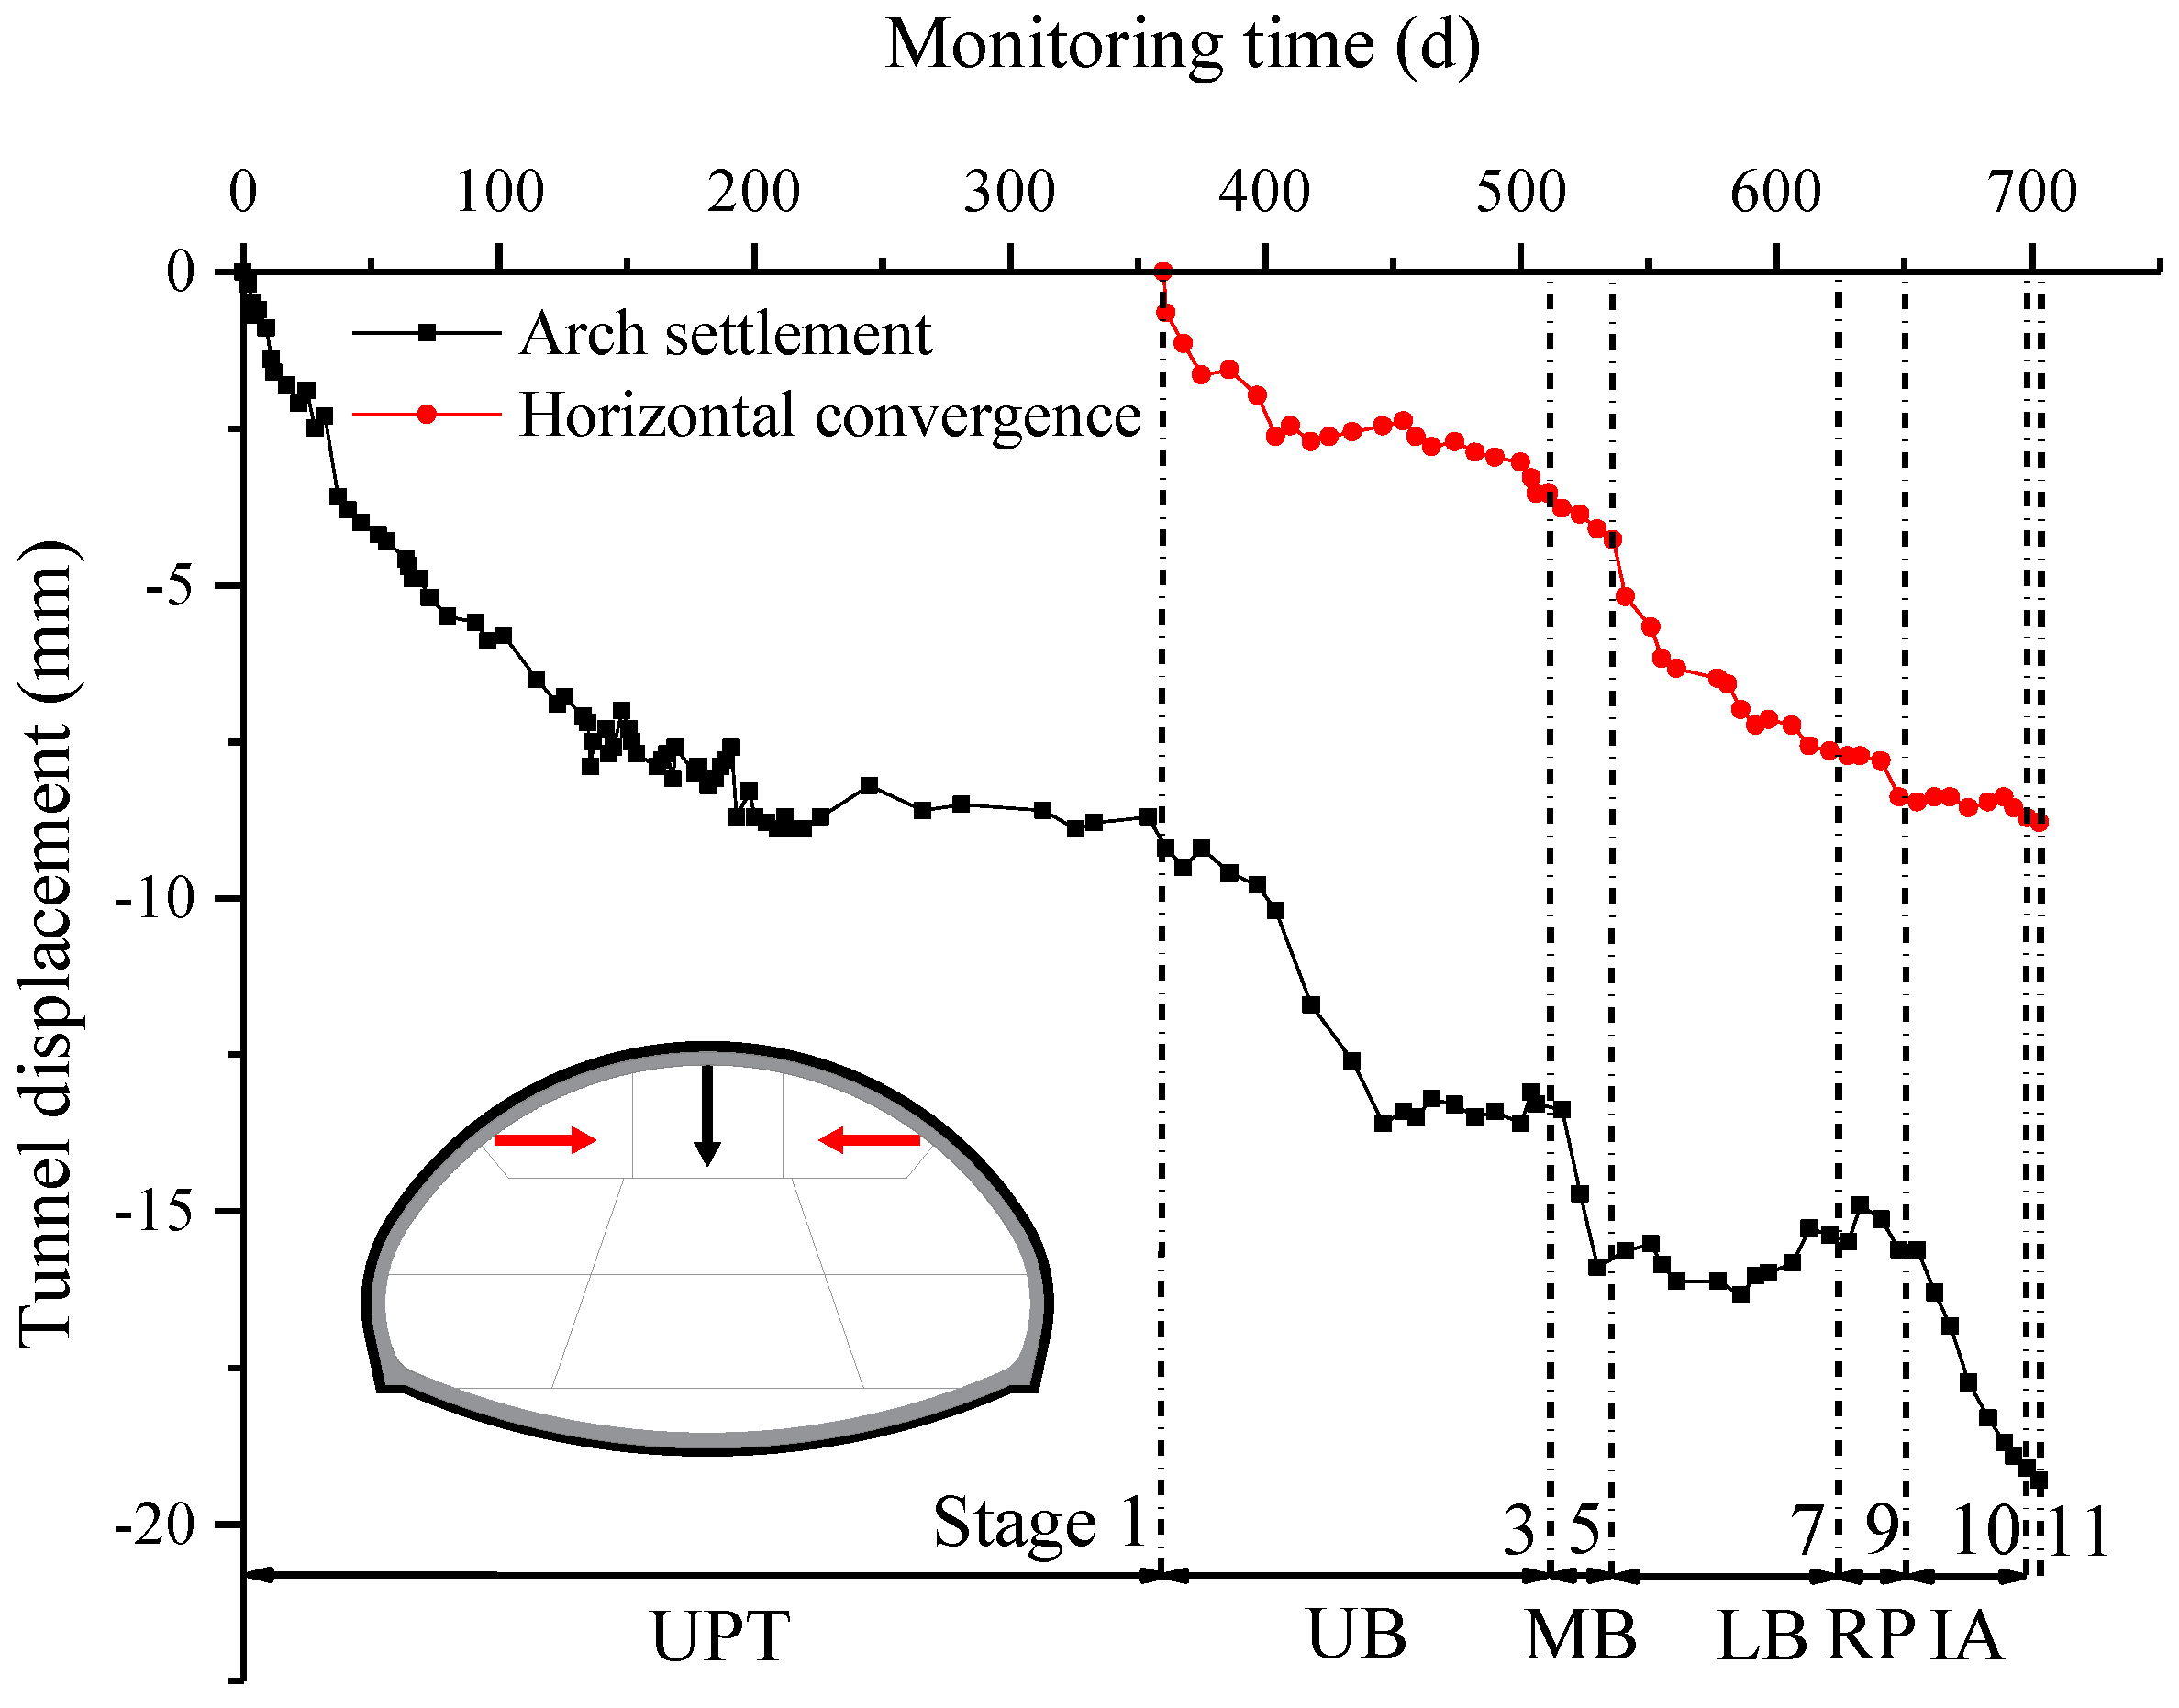
Figure 12 has shown the development process of the tunnel displacements in section DK68+295. It can be seen that the arch settlement and the horizontal convergence both increased sharply in the first 30 days; the deformation then slowed down and reached a staged steady state. However, subsequent construction stages caused varying degrees of increase in the monitored values. It is worth noting that from the later stage of excavation of the lower bench to the early stage of excavation of the rock pillar, i.e. from about day 575 to day 630, the arch settlement decreased. This can be attributed to the unloading that was caused by excavating a large amount of rock mass, which caused the bottom of the tunnel to uplifting; as a result of this, the cumulative settlement was reduced. As the construction progressed to the 12th stage, the monitoring points were damaged due to installation of the vault’s secondary support. The final monitoring values of the arch settlement and the horizontal convergence were 18.9 mm and 9.2 mm, respectively.
Monitoring the displacement of a tunnel is necessary during its construction. Therefore, two adjacent monitoring sections DK68+290 and DK68+300 were selected to be used as control. The arch settlements of DK68+290 and DK68+300 were 14.2 mm and 12.1 mm, and the horizontal convergences of these two sections were 11.5 mm and 8.5 mm, respectively. Table 5 has shown the proportions of the tunnel displacement for the three monitoring sections at different stages during construction. Significant differences in the tunnel displacements were identified during the different stages of construction. The arch settlements during the excavation of TH and UB accounted for 35.1–54.0% and 21.6–35.2% percent of the total arch settlements, respectively. It can be seen that the arch settlements were mainly caused by the excavation of TH and UB. The horizontal convergences mainly occurred during the excavation of UB, MB and LB, the proportions of which were 30.6–42.3%, 17.8–31.5% and 14.3–26.8%, respectively. The Arch settlements and the horizontal convergences were small during the other excavation stages. In general, for the large tunnel displacements during the excavation of TH, UB, MB and LB, the risks during the tunnel’s construction were higher. Therefore, it is necessary to strengthen the construction management and site monitoring in order to ensure the safety of the aforementioned construction stages.

3.2. Internal Displacement of the Surrounding Rock

Tunnel excavation can cause stress redistribution of the surrounding rock. When the stress is greater than the bearing capacity of the surrounding rock, the surrounding rock mass will enter a plastic state and produce microcracks. The propagation and coalescence of microcracks will make the physical and mechanical properties of surrounding rock change obviously, such as the decrease of strength and elastic modulus, and cause obvious internal displacement, which is usually called the damage of surrounding rock. Therefore, the range of damage of surrounding rock can be obtained by monitoring the internal displacement of the surrounding rock. Figure 13 has shown the curve of the duration of the internal displacement at the crown that was monitored by the multi-point extensometers. δ 1 δ 5 represent the relative displacement between Monitoring Points 1–5 and the orifice, respectively. The following steps were used to analyze the damage of surrounding rock: (1) Special time points were selected using the following rules: ① the time point at which the initial displacement rate was slow (Time Point 1). ② The time point when the displacement began to mutate (Time Point 2). ③ The critical time point when the displacement began to change slowly after mutation (Time Point 3). ④ The critical time point at which the displacement increment between two adjacent monitoring points started to change suddenly (Time Point 4). ⑤ The time point when the displacement of each monitoring point began to converge (Time Point 5). ⑥ The cut-off time of the monitoring (Time Point 6). (2) According to the displacement data that was selected from the above time points, curves of the displacement at the special time points vs. depth were drawn, as shown in Figure 14. (3) A fixed point in space was found, that is, the dense point in the Figure 14. Within the depth range corresponding to this point, the deformation of the surrounding rock was obvious, and the damage of the surrounding rock was more serious. It can be considered that the distance between this point and the orifice is the range of damage of surrounding rock. The same method was used to obtain the range of damage of the surrounding rock at the spandrel and haunch of the tunnel. Table 6 has shown the range of damage of surrounding rock at different positions.
It can be seen from Table 6, that the range of damage of surrounding rock in this project is well controlled, and the maximum value is 8.1 m at the crown. Moreover, the range of damage of surrounding rock generally displays a trend of crown > spandrel > haunch. Research into the range of damage of surrounding rock is of great significance when designing a super-span tunnel’s support structure. In order to avoid the slipping of anchoring end, the design length of the anchor cables and bolts were long enough to penetrate through the range of damage of surrounding rock. The tunnel displacements were controlled within 20 mm, which indicated that the support design was successful.

3.3. Contact Pressure between the Surrounding Rock and the Primary Supports

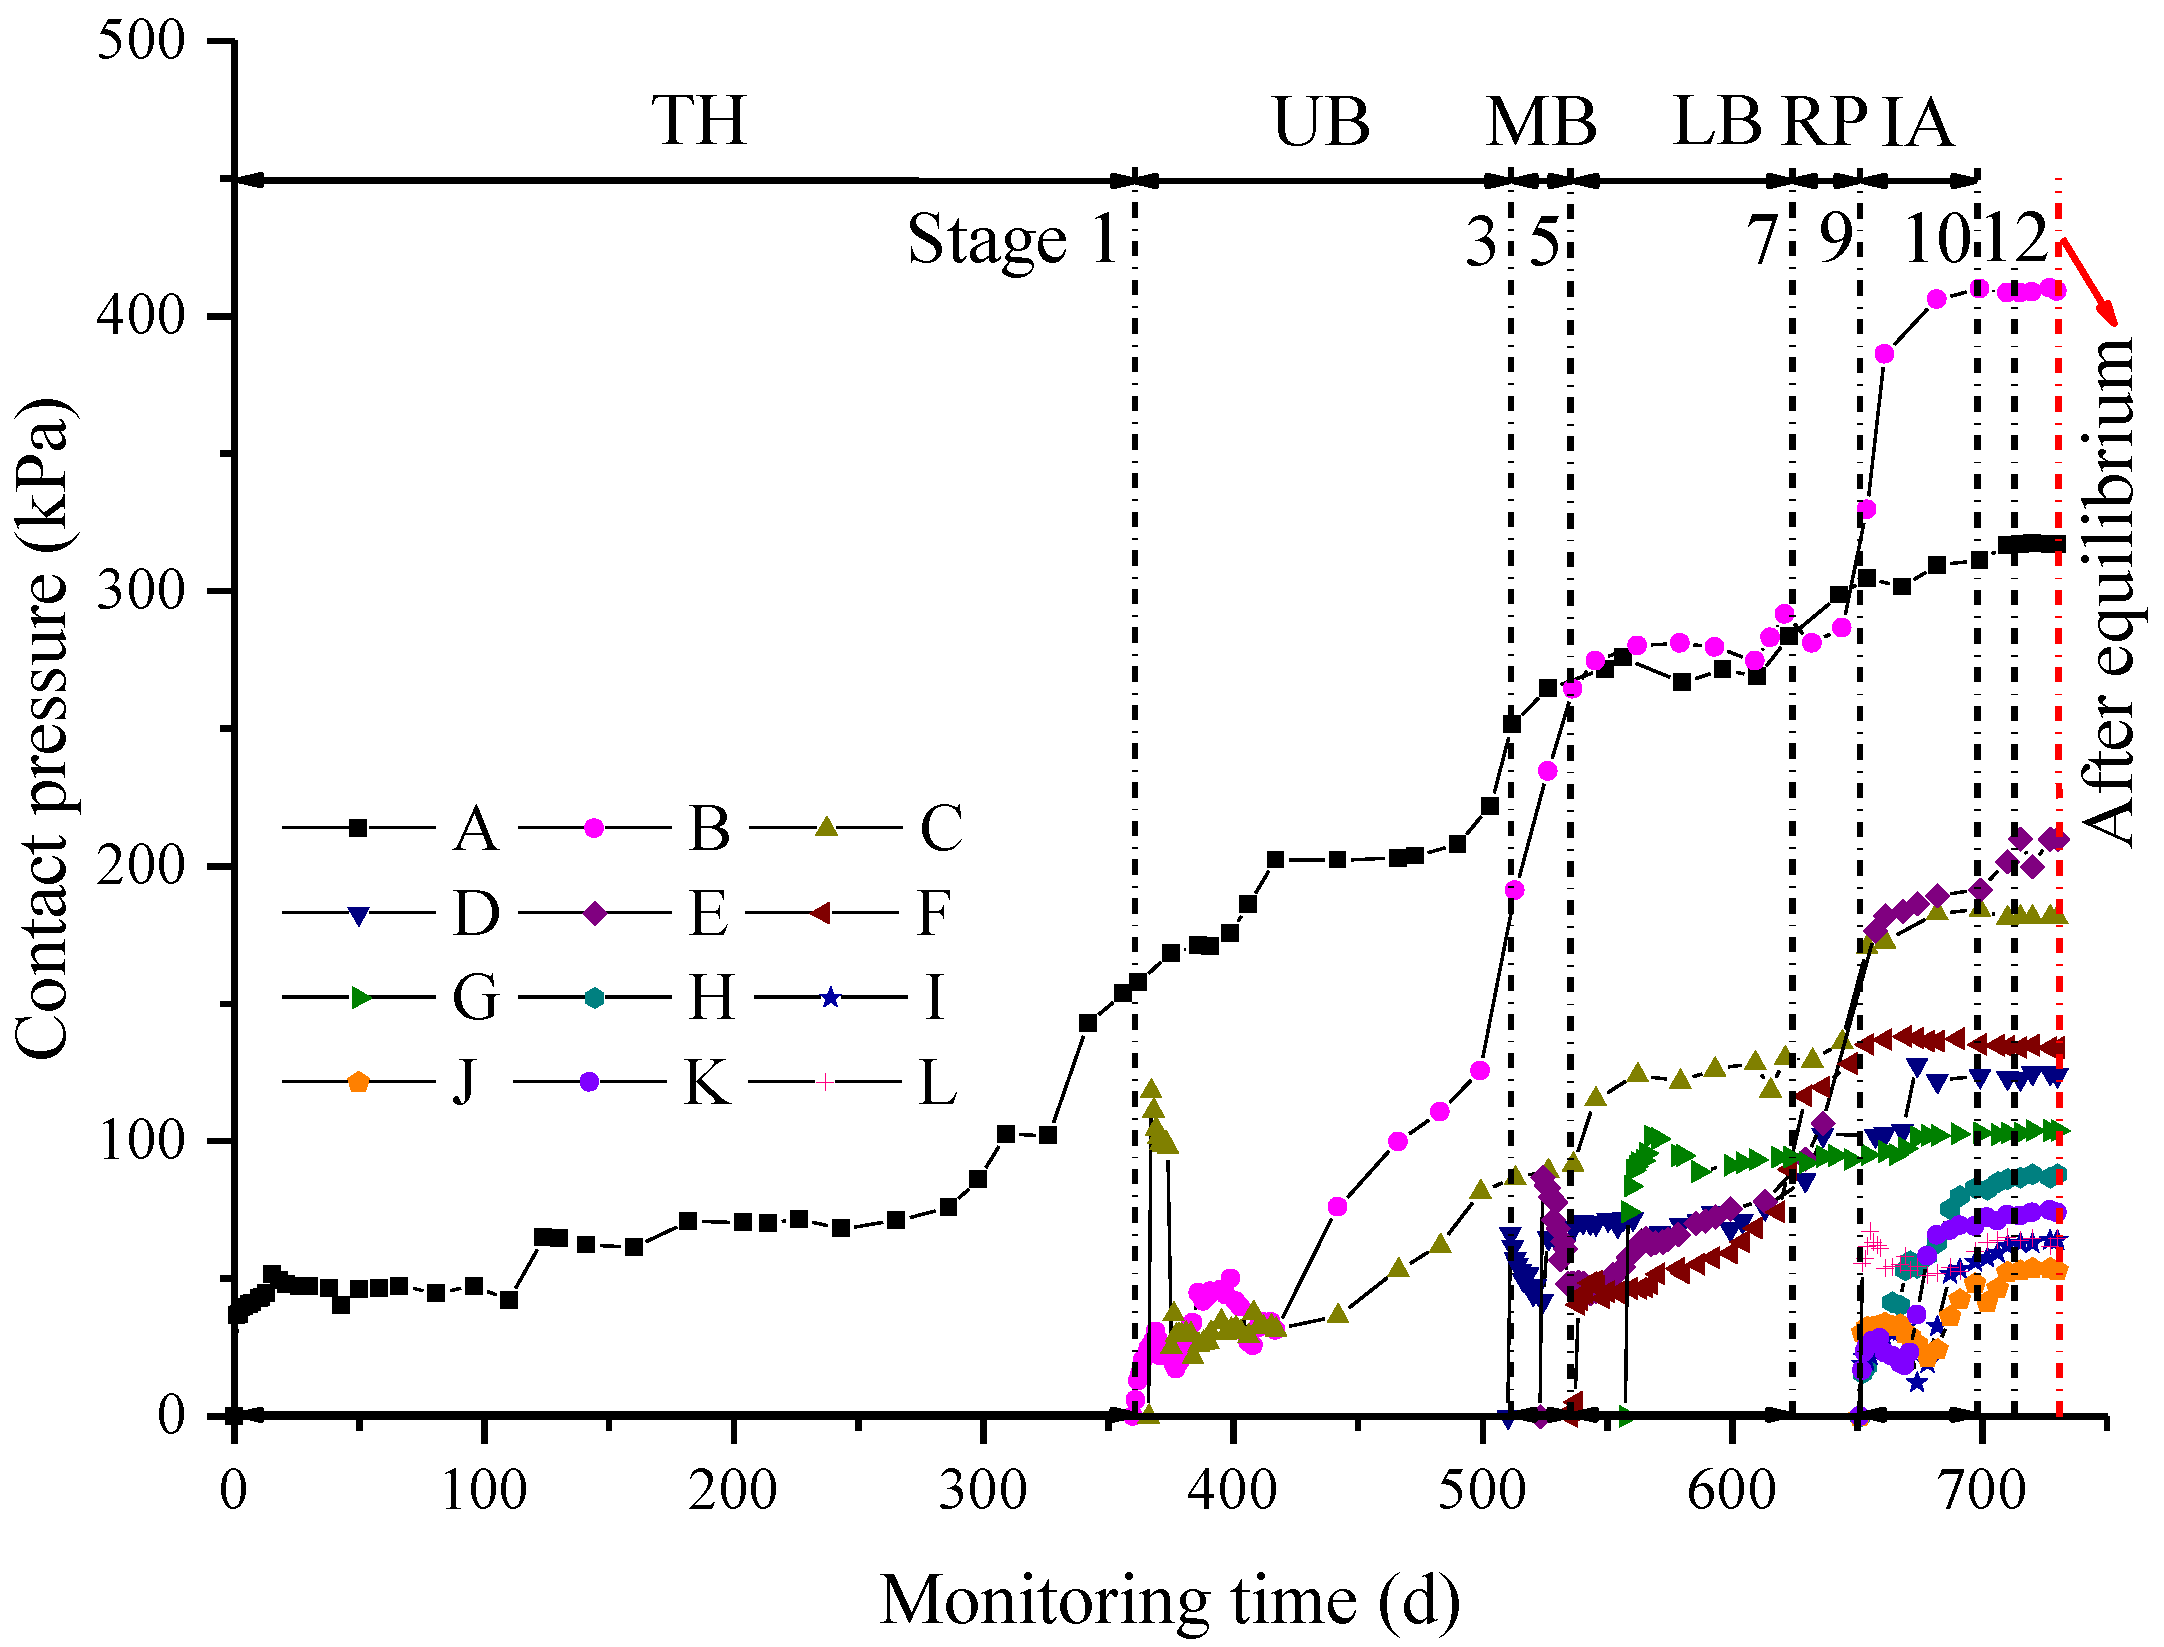
Figure 15 has shown the duration curve of the contact pressures between the surrounding rock and the primary supports for section DK68+295. It can be seen that for each newly installed monitoring element, the monitored values of the pressures increased rapidly in the first 30 days. In general, the increase of the pressures were obviously related to the stage of the excavation. After the excavation of UB, MB and LB, the monitoring values of the installed monitoring points reached 46.8–70.0%, 23.1–85.7% and 82.4–96.1% of the corresponding final values, respectively. The excavation of the upper part of the tunnel can be considered to be the main element in the formation of the pressures. In addition, it can be seen that the pressures were basically stable when the second supports were installed.
The final distribution of the contact pressure between the surrounding rock and the primary supports has been shown in Figure 16. It can be seen that there were obvious spatial differences in the distribution of the pressures. Specifically speaking, the pressures of the crown, spandrel and haunch were obviously greater than that of the arch springing and the inverted arch. The maximum pressure occurred in the left spandrel which displayed a value of 408.9 kPa. In addition, the monitored values of the inverted arch did not exceed 100 kPa. It can be seen that the loads acting on the shotcrete were relatively small.

3.4. Internal Force in the Four Bar Lattice Girders

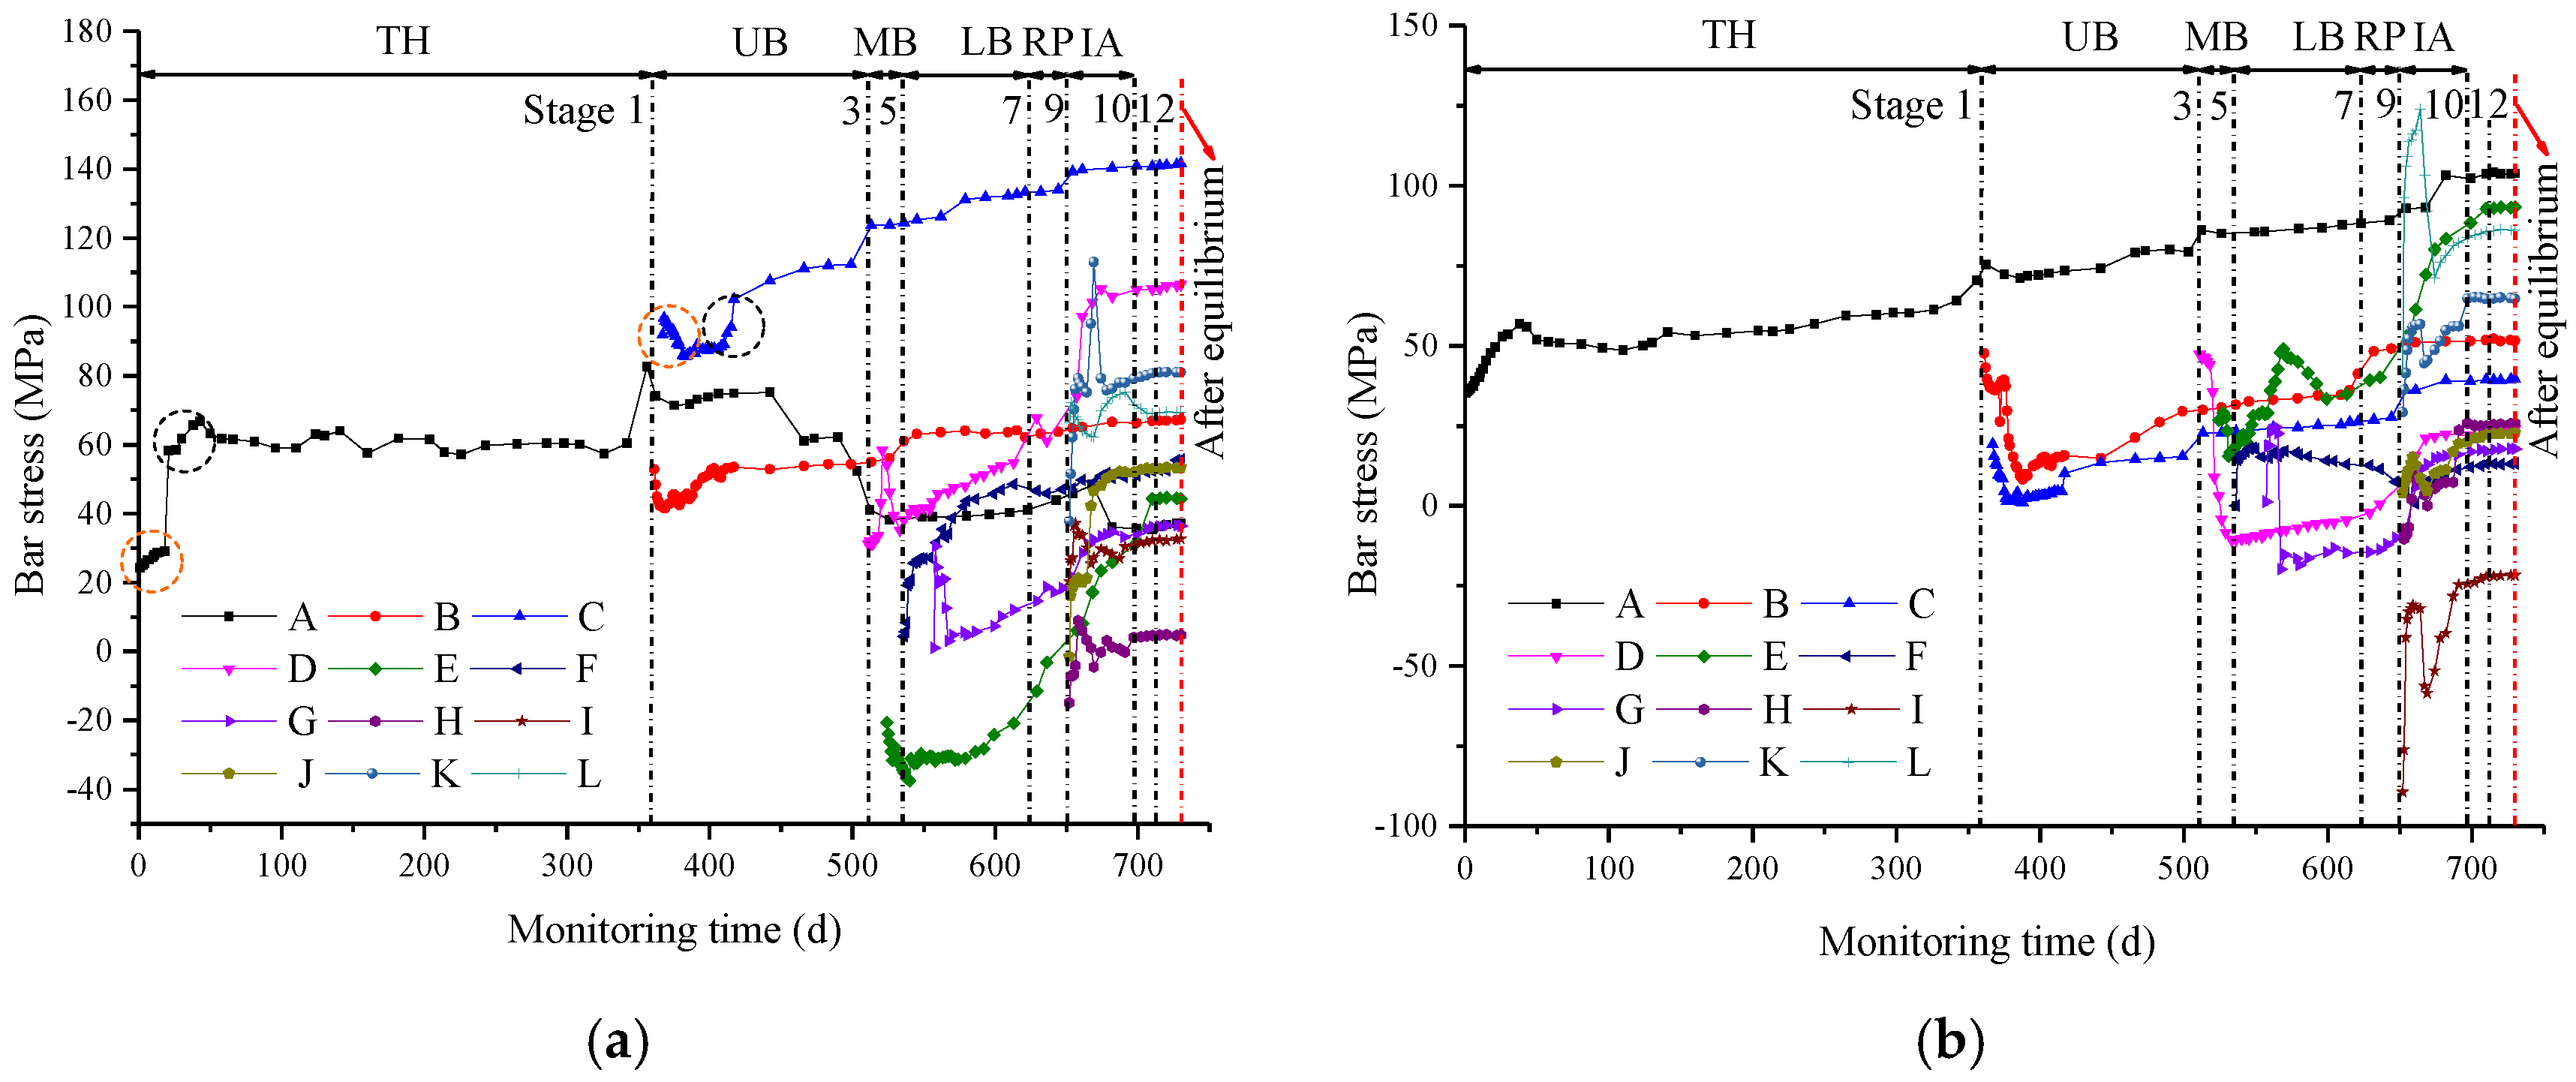
Figure 17 has presented the dynamic evolution of the internal forces in the four bar lattice girders. Compression was defined as being positive and tension was defined as being negative, and the same definition has been applied below. For the vault monitoring points (i.e., monitoring points A–G), the stresses in the four bar lattice girders reached a higher level at the initial stage, and then either increased or sharply decreased in the first 30 days; as shown in Figure 17a, the part marked by the orange circles. This phenomenon was common on the inner side and outer side of the four bar lattice girders. This showed that the four bar lattice girders play a certain load bearing role after installation, and the rapid deformation of the surrounding rock caused a sharp adjustment of the stresses of them. After a brief period of stability, the stresses of the four bar lattice girders experienced a sharp adjustment again, as shown in Figure 17a, the part marked by black circles. This phenomenon can be attributed to the extrusion deformation of the four bar lattice girders that was caused by the construction of the prestressed anchor cables and bolts. The extrusion effect was more evident closer to the anchor plate; therefore this phenomenon was more noticeable on the inner side of the four bar lattice girders than on the outer side. As the excavation continued, the four bar lattice girders showed a characteristic of the compressive stresses increasing or the tensile stresses decreasing. For the monitoring points of the inverted arch (i.e., Monitoring Points H–L), the stress decreased after a rapid initial increase. This was the result of the construction of the secondary support of the inverted arch which exerted a downward load on the primary support of the inverted arch, thus offsetting part of its convergence deformation. As the construction continued, the change rule of the inverted arch’s monitoring points was similar to that of the vault’s monitoring points. When the construction had been completed, the values of all the monitoring points almost stopped increasing. At this time, the state of the four bar lattice girders could be considered stable.
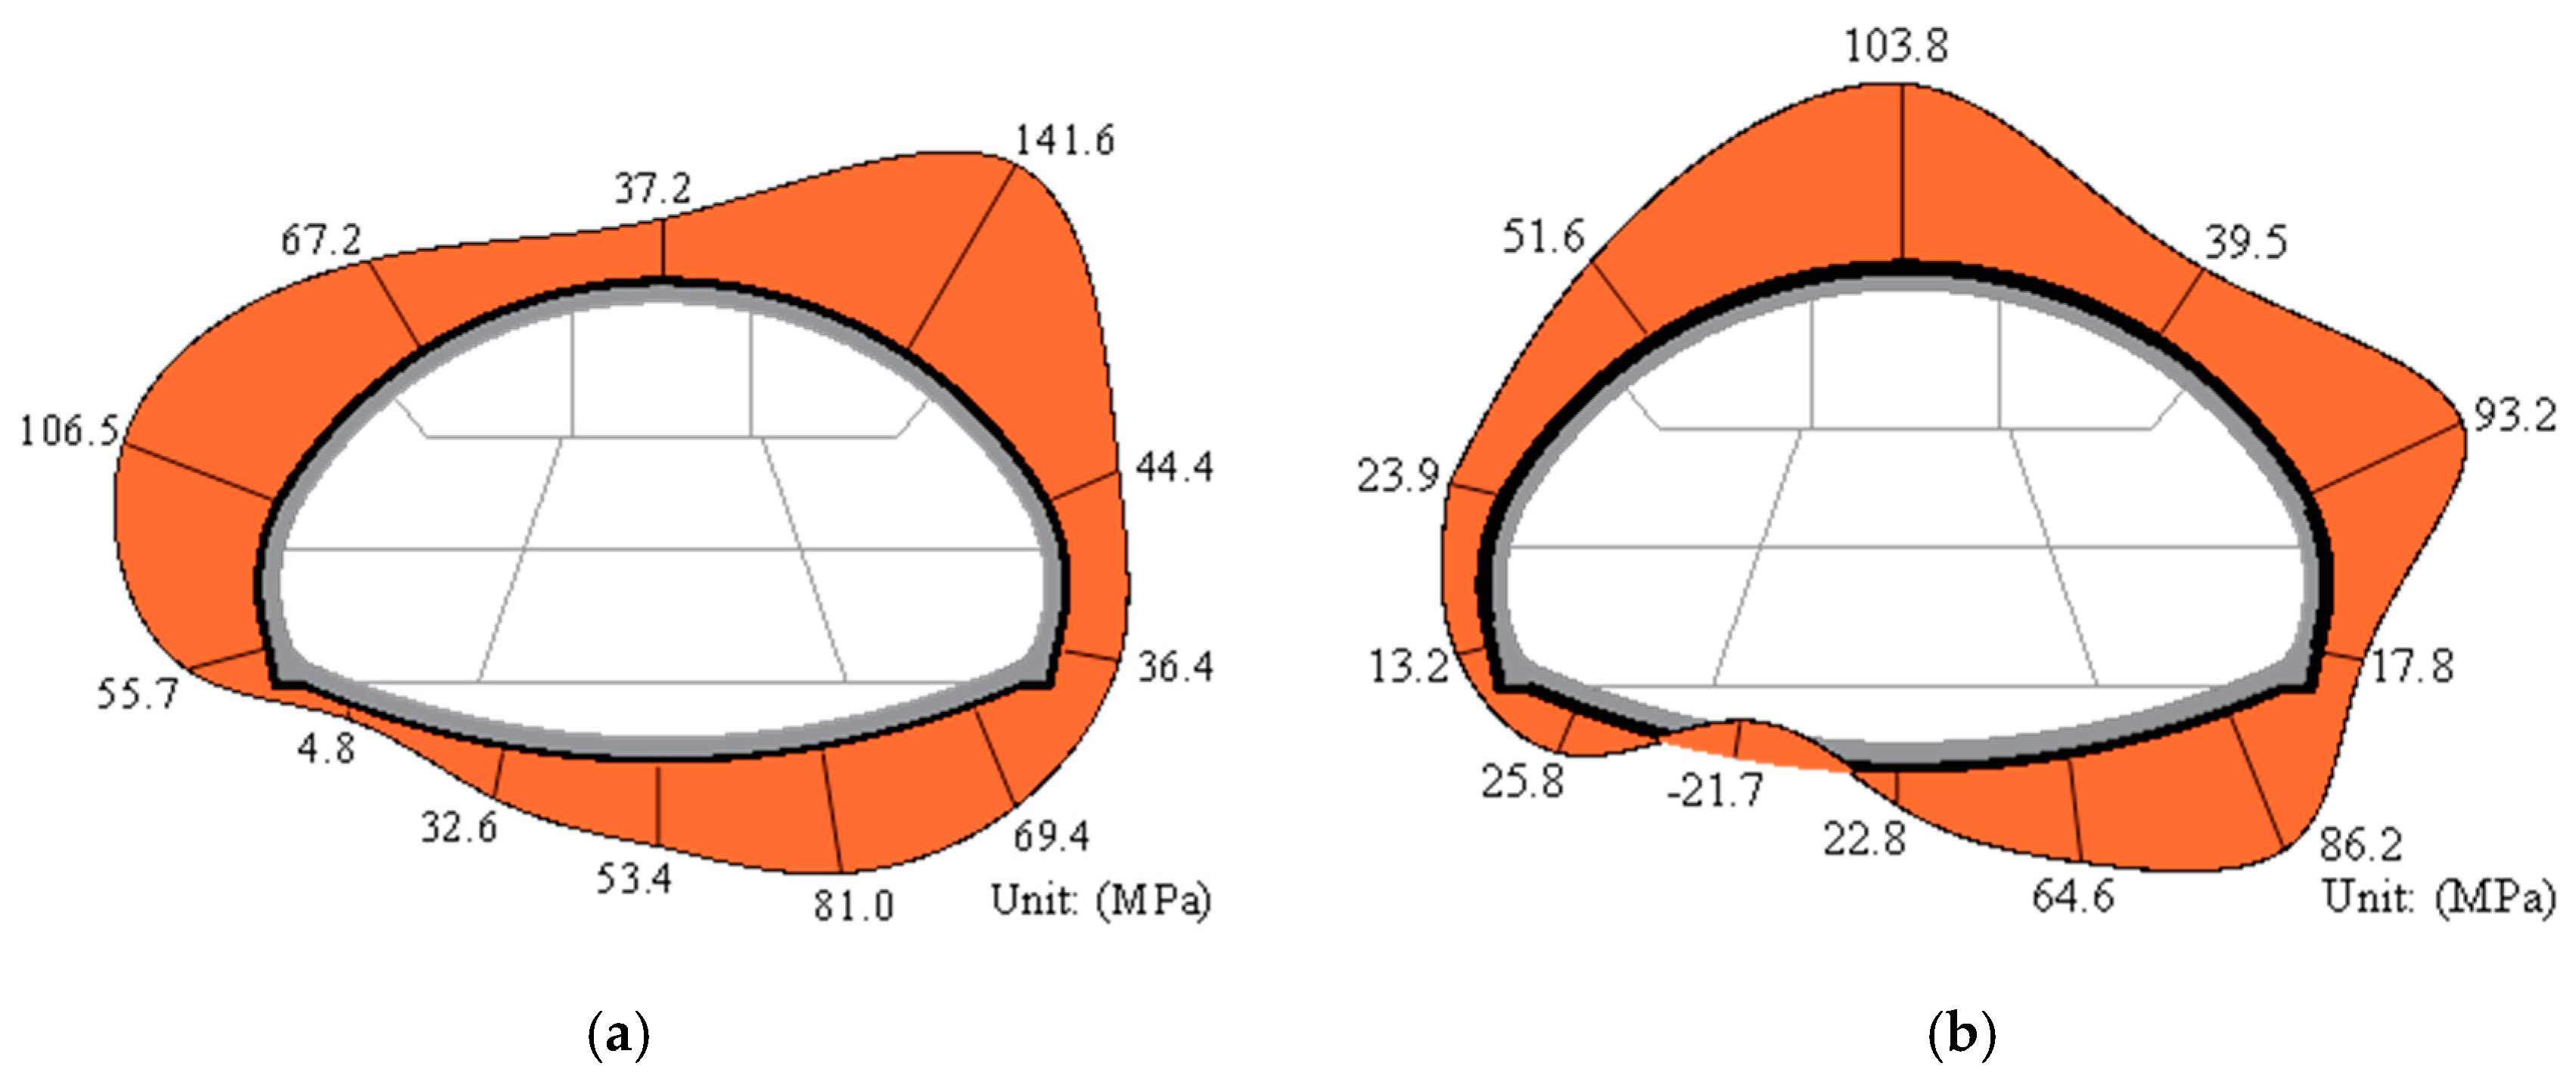
Figure 18 has shown the final distribution of the stresses on the inner and outer sides of the four bar lattice girders. It can be seen that the maximum and minimum values of the stress on the inner side of the four bar lattice girders occurred at the Monitoring Points C and H, with corresponding values of 141.6 MPa and 4.8 MPa, respectively. The maximum and minimum values of the stress on the outer side of the four bar lattice girders appeared at Monitoring Points A and F, with corresponding values of 103.8 MPa and 13.2 MPa, respectively. Except for Monitoring Point J in Figure 18b, the other monitoring points in the four bar lattice girders were in a state of compression.

3.5. Axial Force in the Anchor Cables

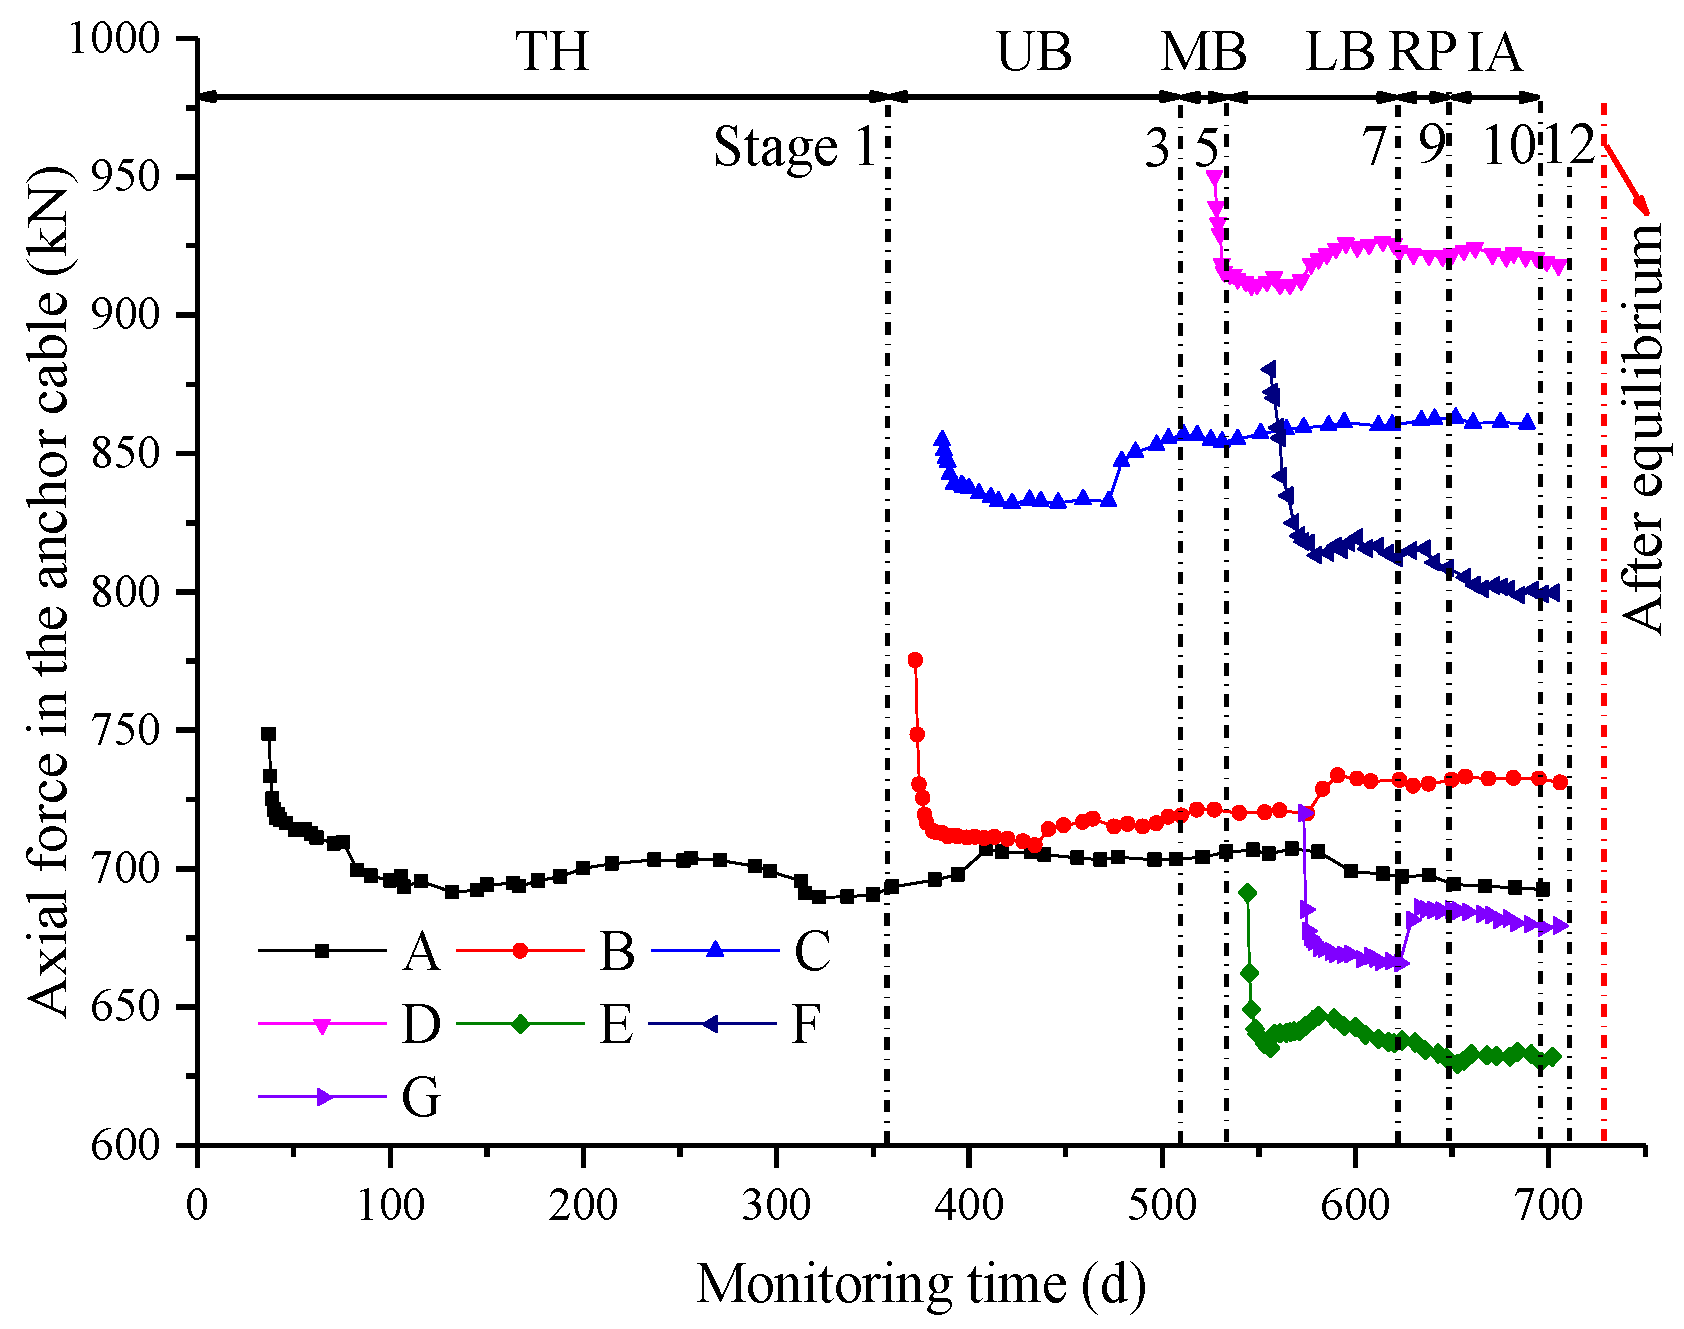
Figure 19 has shown the time history diagram of the axial forces in the anchor cables. It can be seen that the axial forces displayed a rapid drop within the first five days after tensioning. This means that the anchor cables suffered a prestress loss, with the values accounting for between 1.8–7.6% of the initial tensile forces. Moreover, the average prestress loss after the first day was about 44% of that after the first five days. The prestress losses of the anchor cables after the first five days were mainly caused by compaction of the rock; the rate of the prestress losses then decreased gradually. The subsequent excavation resulted in a rise in the axial forces in anchor cables, which aimed to restrain the convergence of the surrounding rock that was caused by excavation disturbance. The axial forces in the anchor cables finally reached a stable state. The prestress loss rate of the anchor cable at Monitoring Point F was highest, with a value of 9.2%.
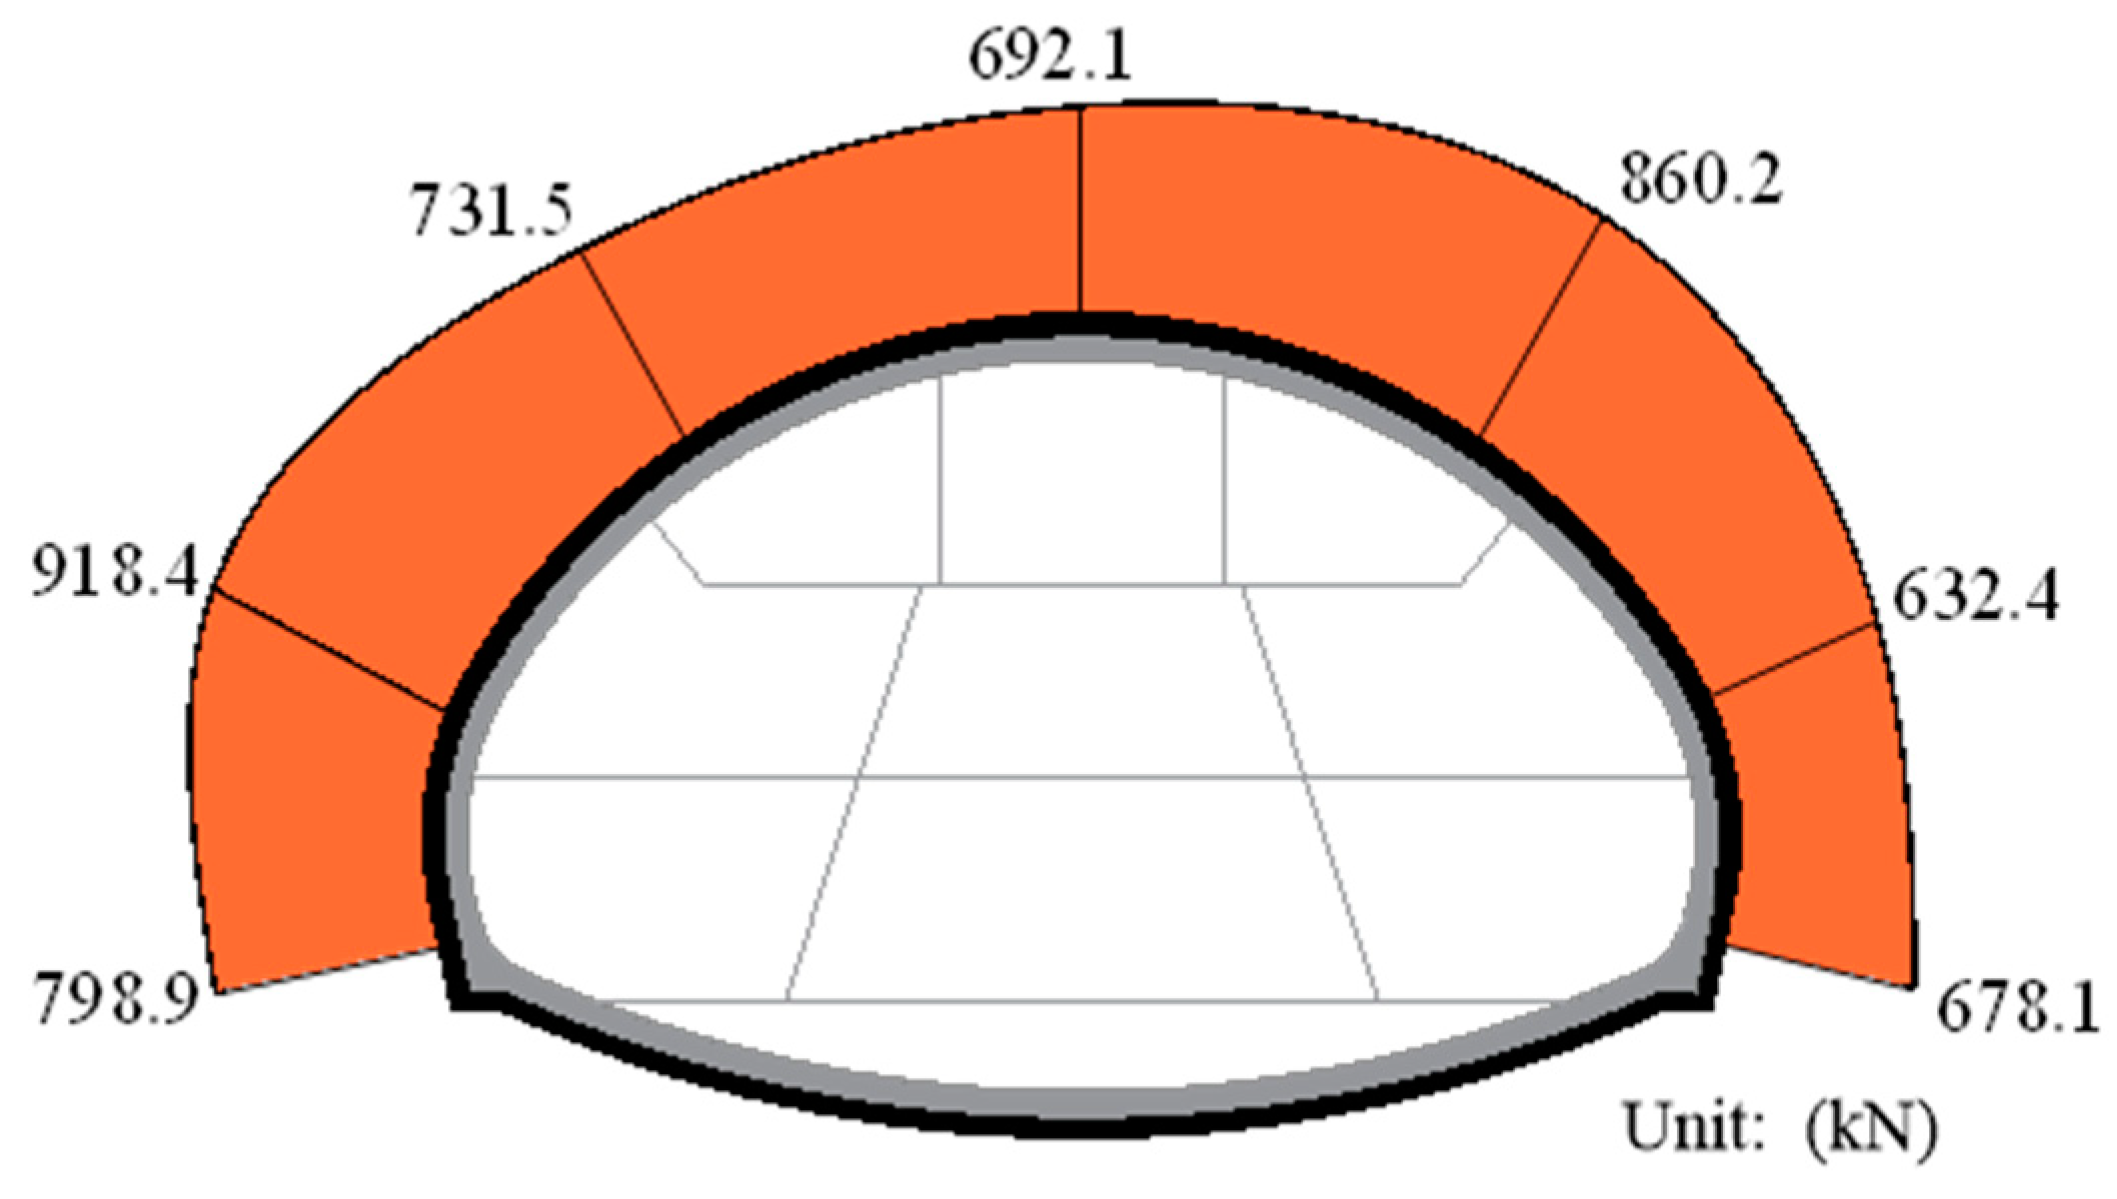
Figure 20 has shown the final distribution of the axial forces in the anchor cables. It can be seen that the distribution of the axial forces in the anchor cables were relatively uniform. The maximum and minimum axial forces were at Monitoring Points D and E, with the corresponding values of 918.4 kN and 632.4 kN, respectively. The design value of the axial force in the monitored anchor cable is 700 kN. It can be seen that except for Monitoring Point E, the monitoring values of the other measuring points reached more than 98% of the design value. In addition, the anchor cable consisted of 7 strands of steel wire with a yield strength of 1550 MPa and a cross-sectional area of 140 mm2. It could be calculated that the axial forces in the anchor cables accounted for 41.6–60.4% of the yield load, which shows that the anchor cables were not only exerting their load bearing capacity, but also possessed a sufficient safety factor.

3.6. Axial Force in the Anchor Bolts

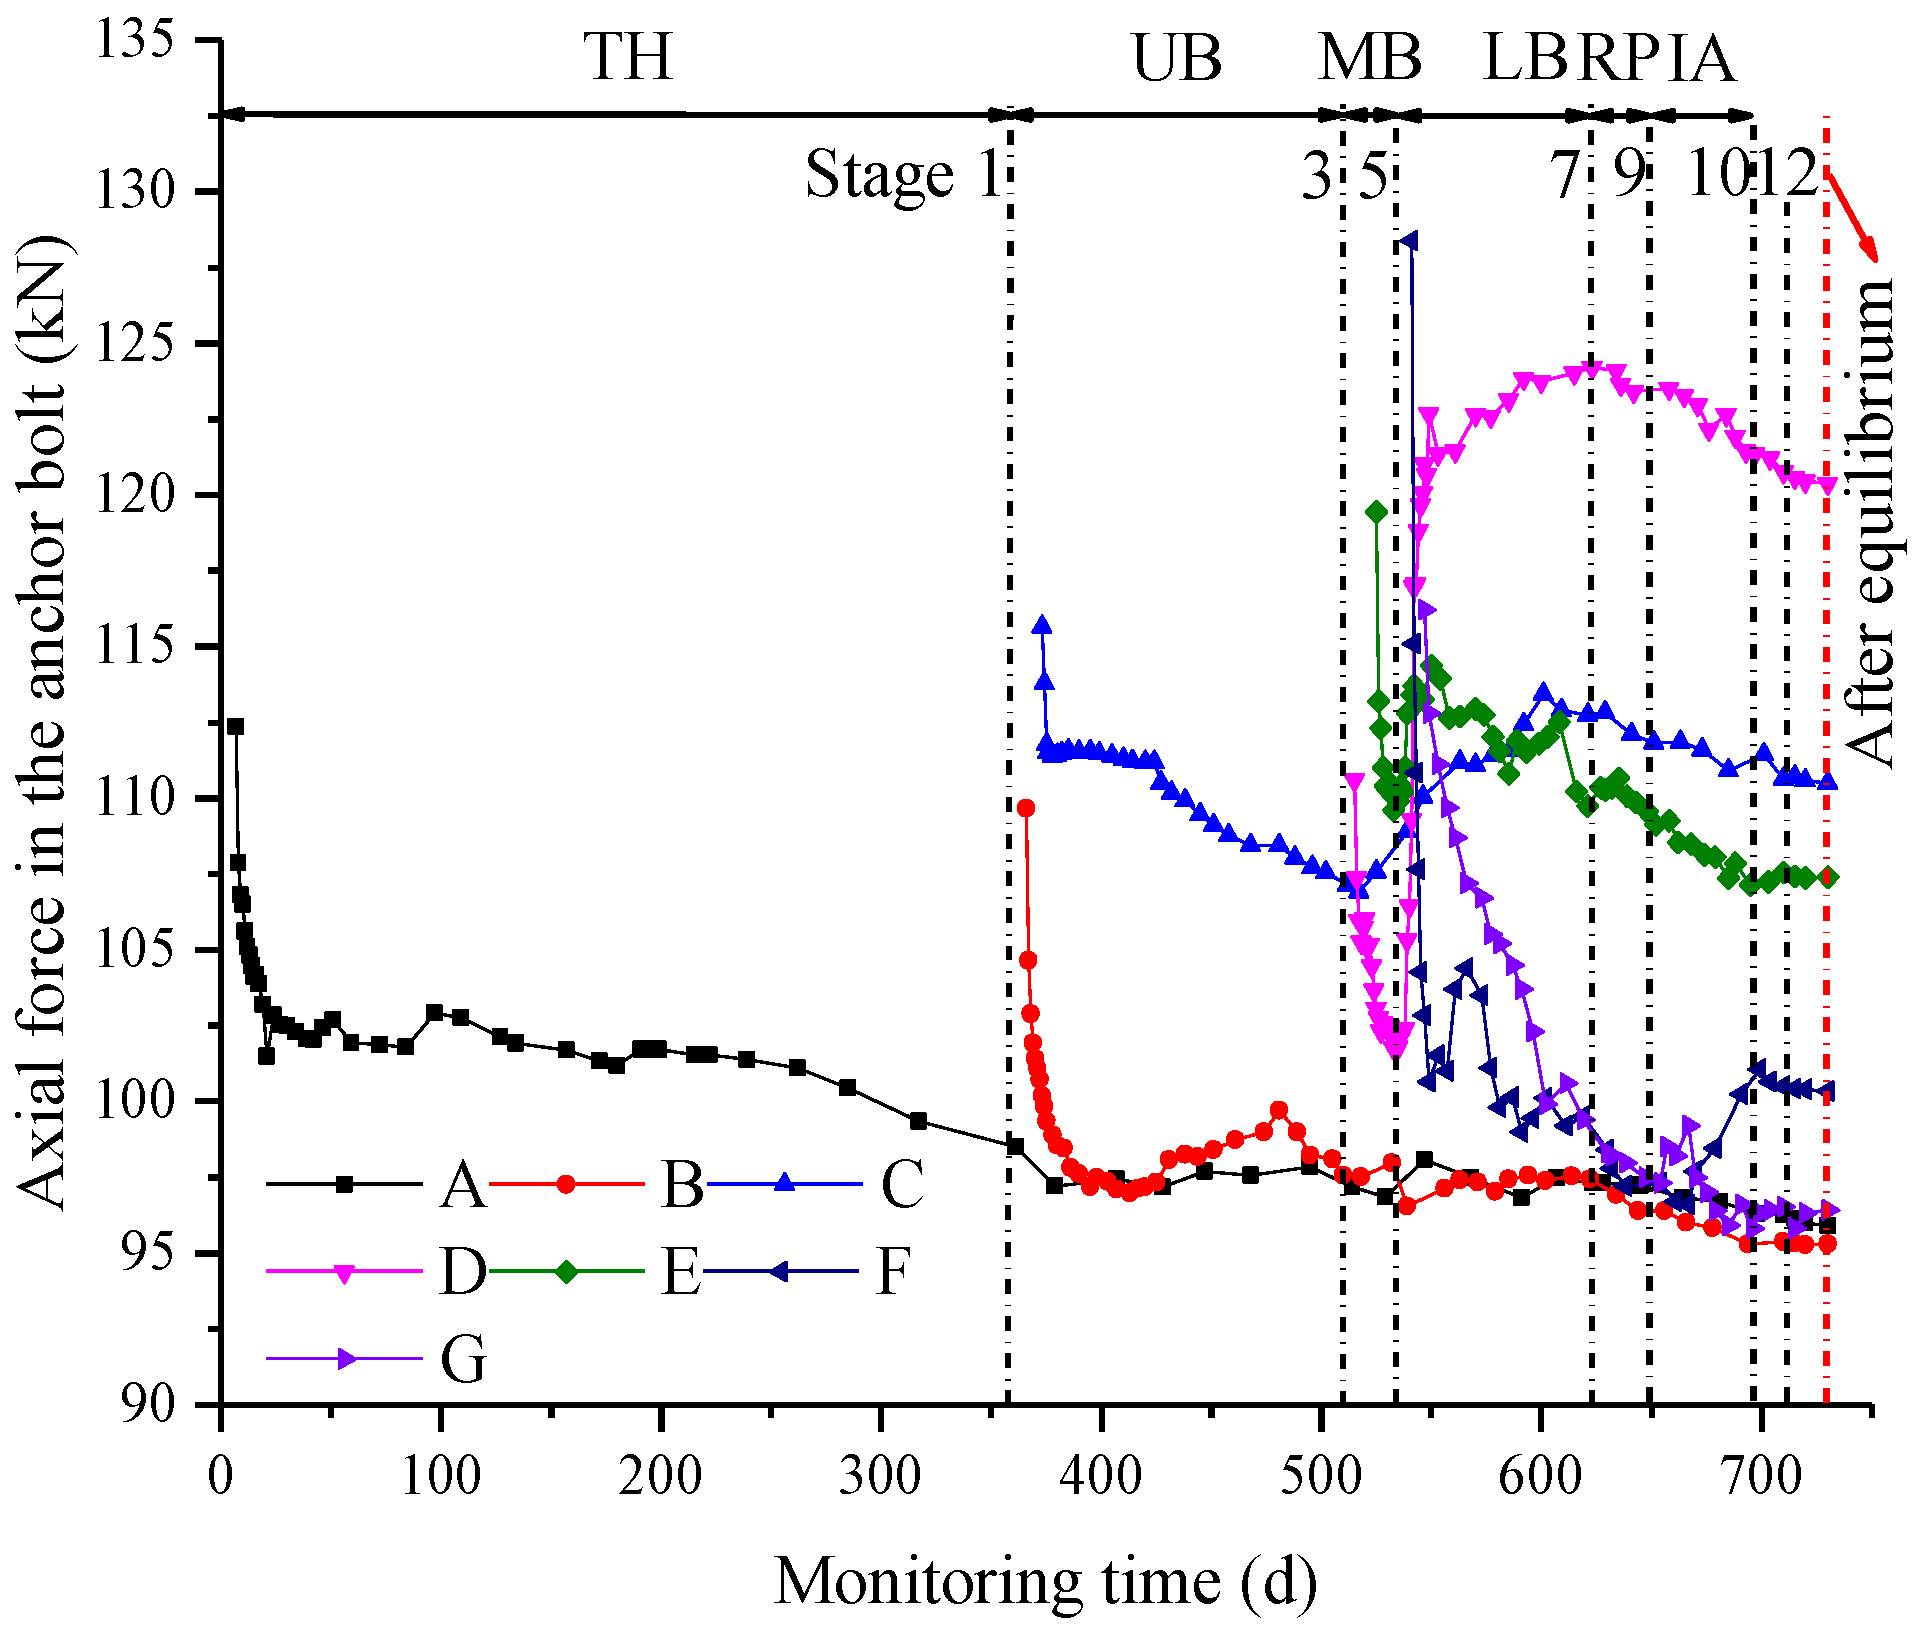
Figure 21 has shown the evolution of the axial forces at the end of the anchor bolts. In the same manner as the anchor cables, the anchor bolts also experienced a rapid drop in the axial forces in the initial installation period caused by the compaction of the rock, with the values accounting for 3.6–14.8% of the initial tensile forces. This process lasted for about 15 days, about three times longer than that of the anchor cables. This can be attributed to the relatively smaller prestress of the anchor bolts and the relatively larger excavation disturbance of the rock surrounding the anchor bolts extending the compaction time of the rock. Apart from the anchor bolts at the Monitoring Points A and B, the axial forces of the other anchor bolts were obviously affected by the subsequent excavation, and the monitoring values had obvious fluctuations. After the completion of the excavation, the axial forces in anchor bolts were stable.
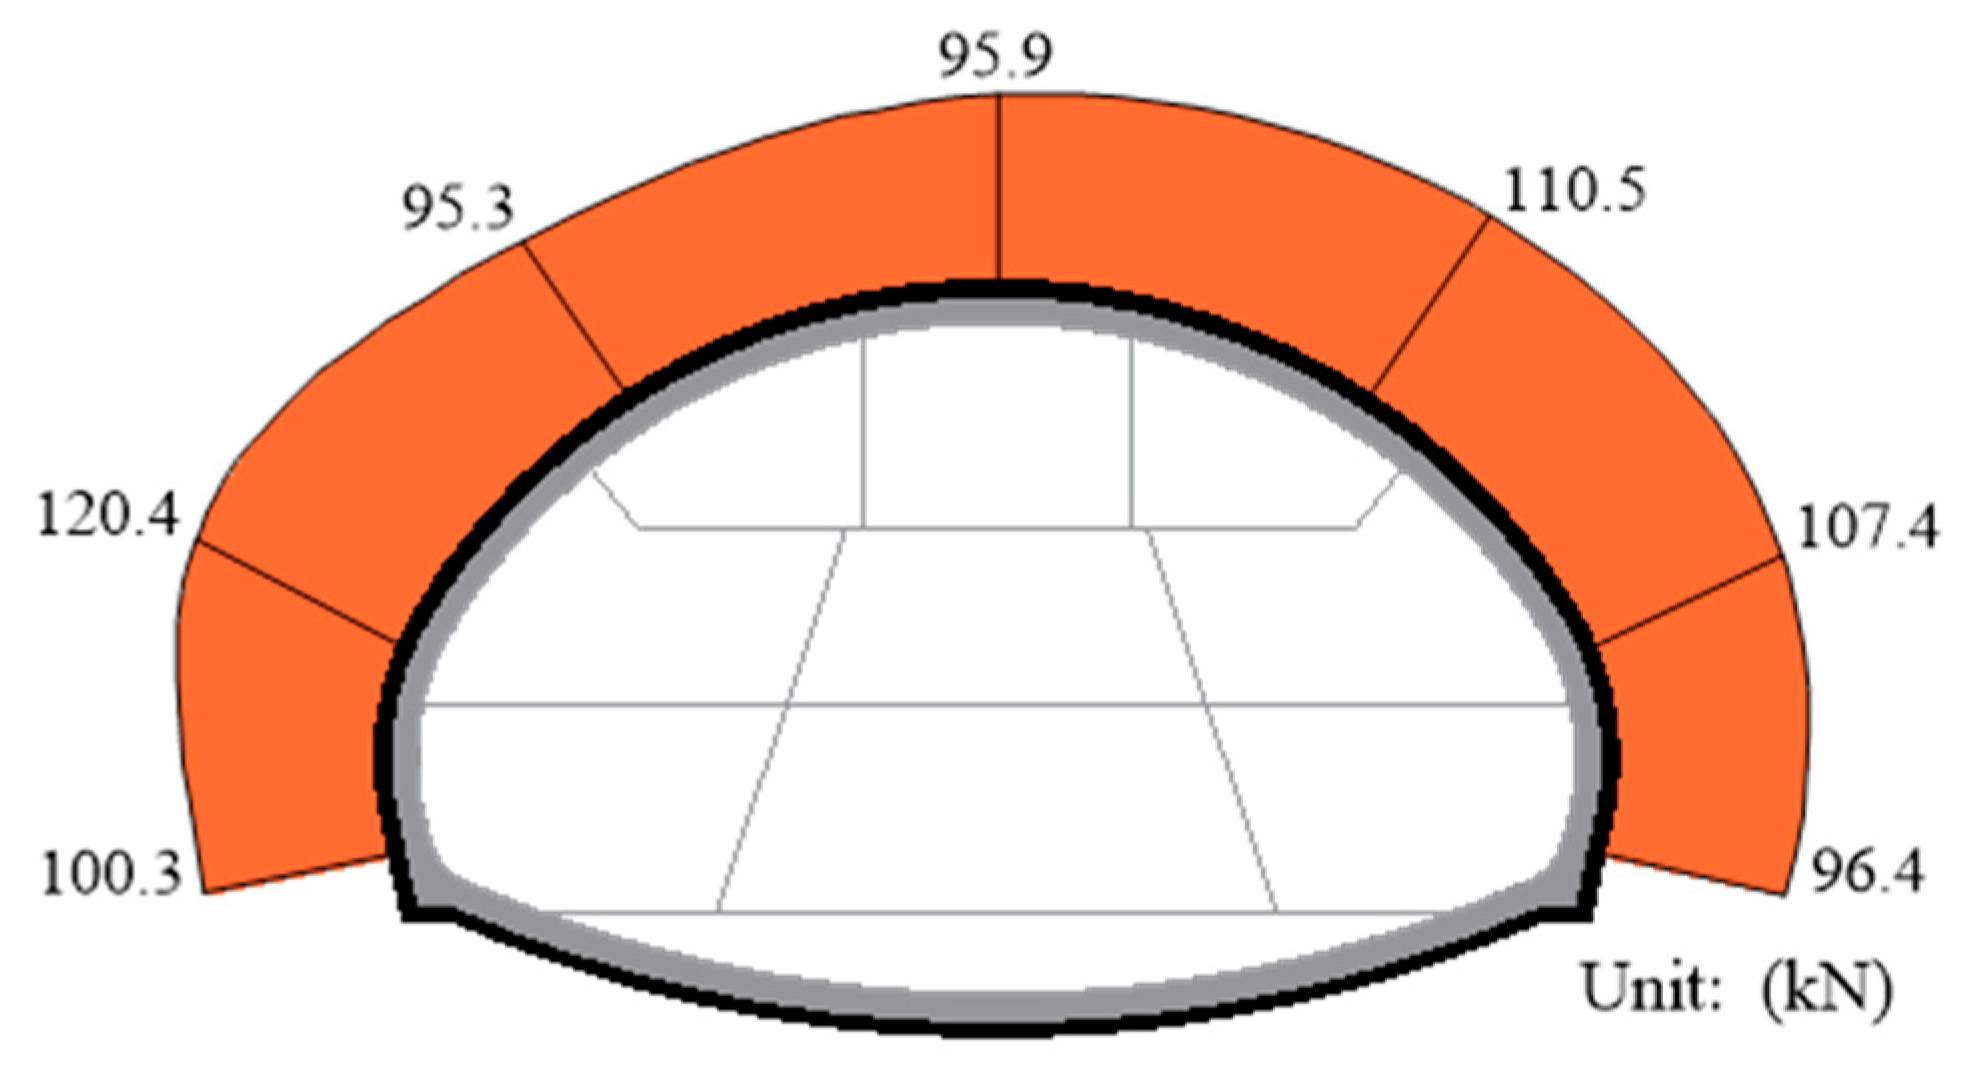
Figure 22 has shown the distribution of the axial forces at the end of the anchor bolts. The axial forces of the anchor bolts reached 95% of the design value. The maximum axial force in the anchor bolt was 120.4 kN at the left haunch, and the minimum value was 95.3 kN at the left spandrel. The yield load of the anchor bolts was 159 kN; therefore it could be seen that the axial forces in the anchor bolts reached 60.0–75.7% of the yield load, indicating that they had a higher utilization rate than the anchor cables.

3.7. Contact Pressure between the Primary and Secondary Supports

Figure 23 has shown the time-history curve of the contact pressures between the primary and secondary supports. For the seven monitoring points at the tunnel vault, the change laws of the contact pressures were closely related to the construction processes. After the concrete of the vault’s secondary support has been poured, the contact pressures increased sharply with the rapid increase of the concrete’s strength and stiffness. The existence of the model board trolleys improved the rigidity of the secondary support, when they were detached, the contact pressures decreased slightly due to the reduction in the rigidity. As the strength of the concrete continued to slowly increase, the contact pressures slowly increased and finally reached a stable state. In general, the change laws of concrete pressures at the above-mentioned monitoring points could be summed up as “sharp increase-slight decrease-slow increase-basically stable”. For the five monitoring points at the bottom of the tunnel, the change laws of the contact pressures were similar to that of the monitoring points of the tunnel’s vault, but there were some differences. Within five days after the concrete of the vault’s secondary support has been poured, the contact pressures of the inverted arch increased by 2.3% to 10.2%. This was because the loads on the upper part of the tunnel were transferred down to the inverted arch after the secondary support was closed. In general, the development of the contact pressures were mainly concentrated within the first seven days after the installation of the secondary supports of the vault and the inverted arch, which could reach more than 52% of the final values.
The final distribution of the contact pressures between the primary and secondary supports have been plotted and shown in Figure 24. Overall, the contact pressures had a tendency to gradually decrease from the upper part to the lower part of the tunnel. The maximum value appeared at the crown, reaching 135.1 kPa, followed by the left haunch, with a value of 115.6 kPa. Compared with the contact pressure between the surrounding rock and the primary supports, it can be seen that the contact pressure between the primary and secondary supports was much lower than the contact pressure between the surrounding rock and the primary supports. Moreover, the maximum contact pressure between the primary and secondary supports was only 32.9% of the maximum contact pressure between the surrounding rock and the primary supports. Therefore, for super-span tunnels, the main function of the secondary support is as a safety reserve.

3.8. Internal Force in the Secondary Supports

Figure 25 has shown the time history curves of the stresses in the concrete of the secondary supports.
The monitoring data showed that internal stresses were rapidly generated in the concrete within 48 hours after the concrete had been poured. The internal stresses mainly manifested as compressive stress, e.g., the compressive stress of Monitoring Point G on the inner side and Monitoring Point E on the outer side reached −4.3 MPa and −8.5 MPa after 48 h, respectively; however, tensile stress also appeared at a few monitoring points. The stresses at this stage were mainly temperature stresses, which were caused by the large amount of hydration heat generated by the concrete solidifying. The temperature stresses peaked around the second day after the concrete had been poured and then gradually attenuated. With the continuous solidification of the concrete, the stiffness of the secondary support rapidly increased; therefore the load on the secondary support also rapidly increased. At this time, the stress state of the concrete either showed a rapid decrease in the tensile stresses or a rapid increase in the compressive stresses. This stage lasted between 3–5 days, at which point most of the monitoring points in the tensile state had been completely converted to a compressive state, and the temperature stresses had basically disappeared. After the model board trolley had been dismantled, the concrete stresses experienced a slow increase over 10–20 days. After the concrete stresses reached a stable state, except for the stress of Monitoring Point K on the inner side being a tensile stress, with a value of 0.7 MPa, the stresses of the other monitoring points were compressive stresses. In general, the stresses on the outer side of the concrete of the secondary supports were greater than that on the inner side of the concrete of the secondary supports. The compressive stress of Monitoring Point A on the outer side was the largest, with a value of 8.4 MPa, and this was far lower than the compressive strength of the concrete.
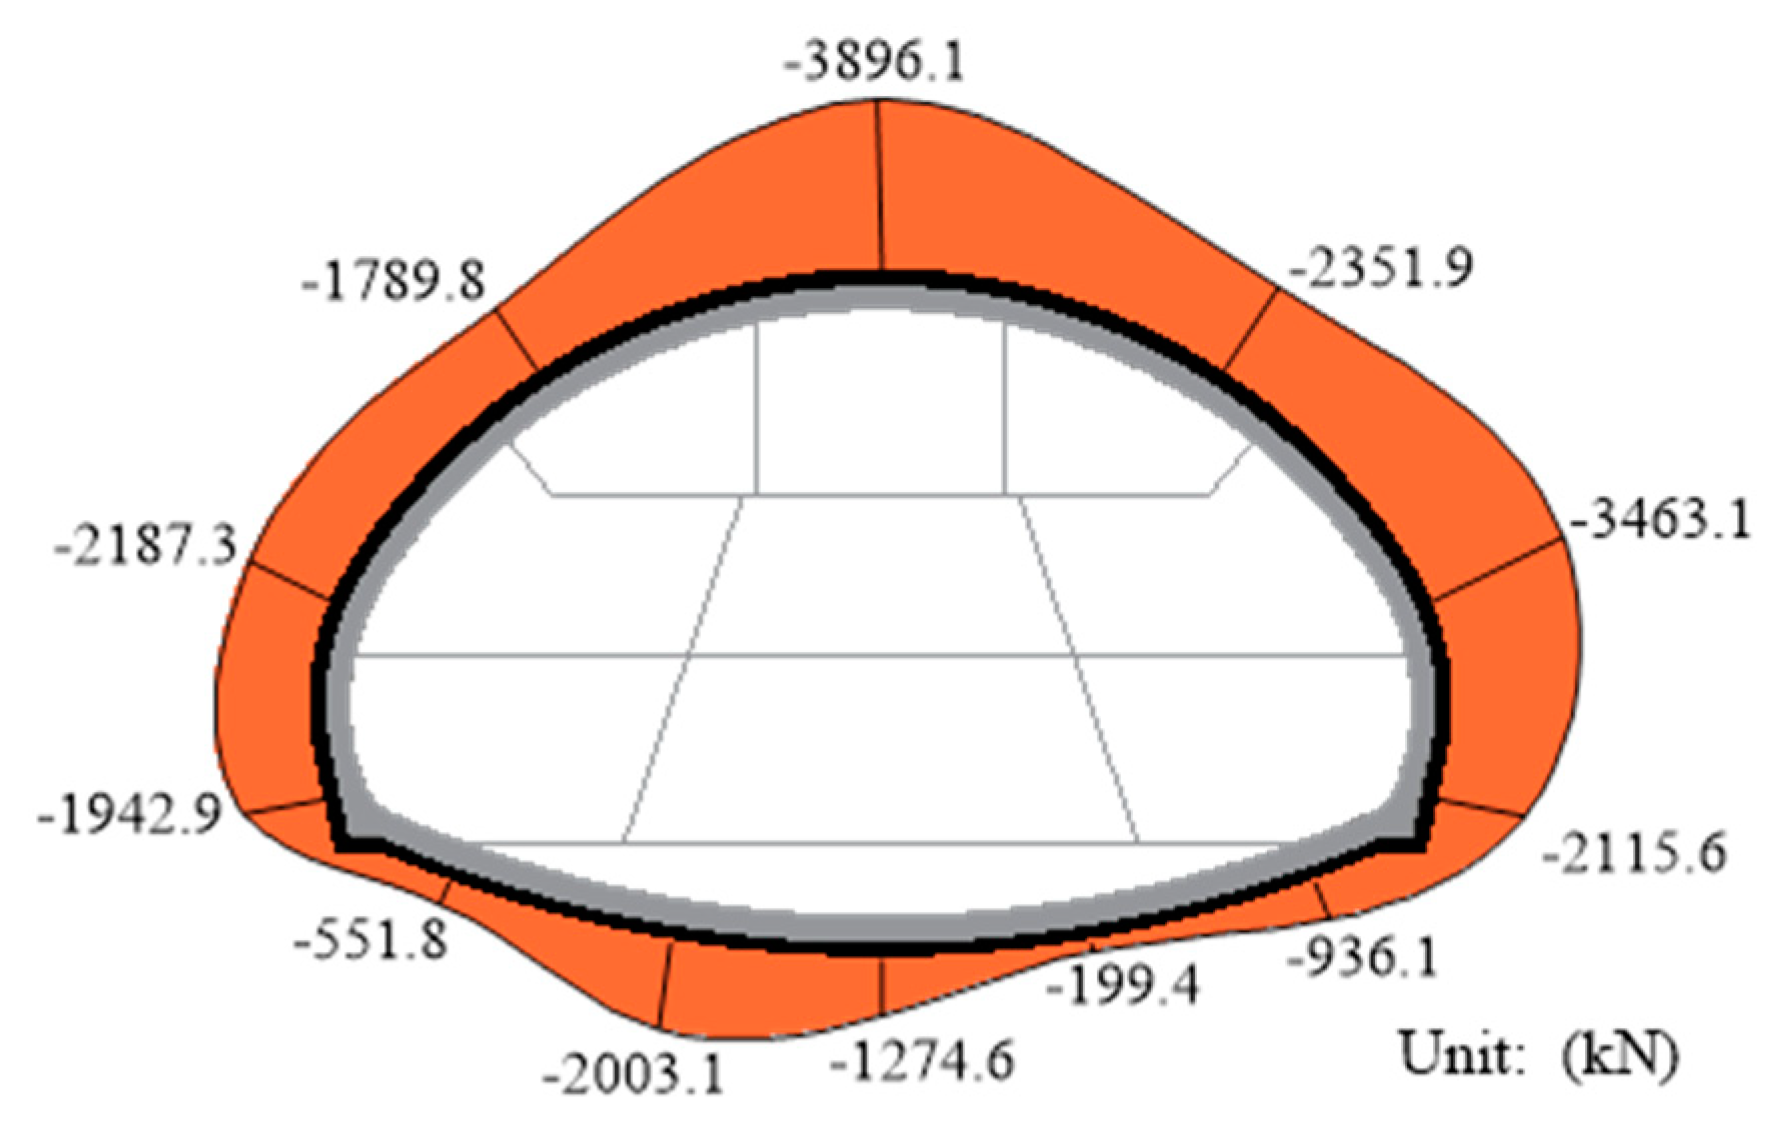
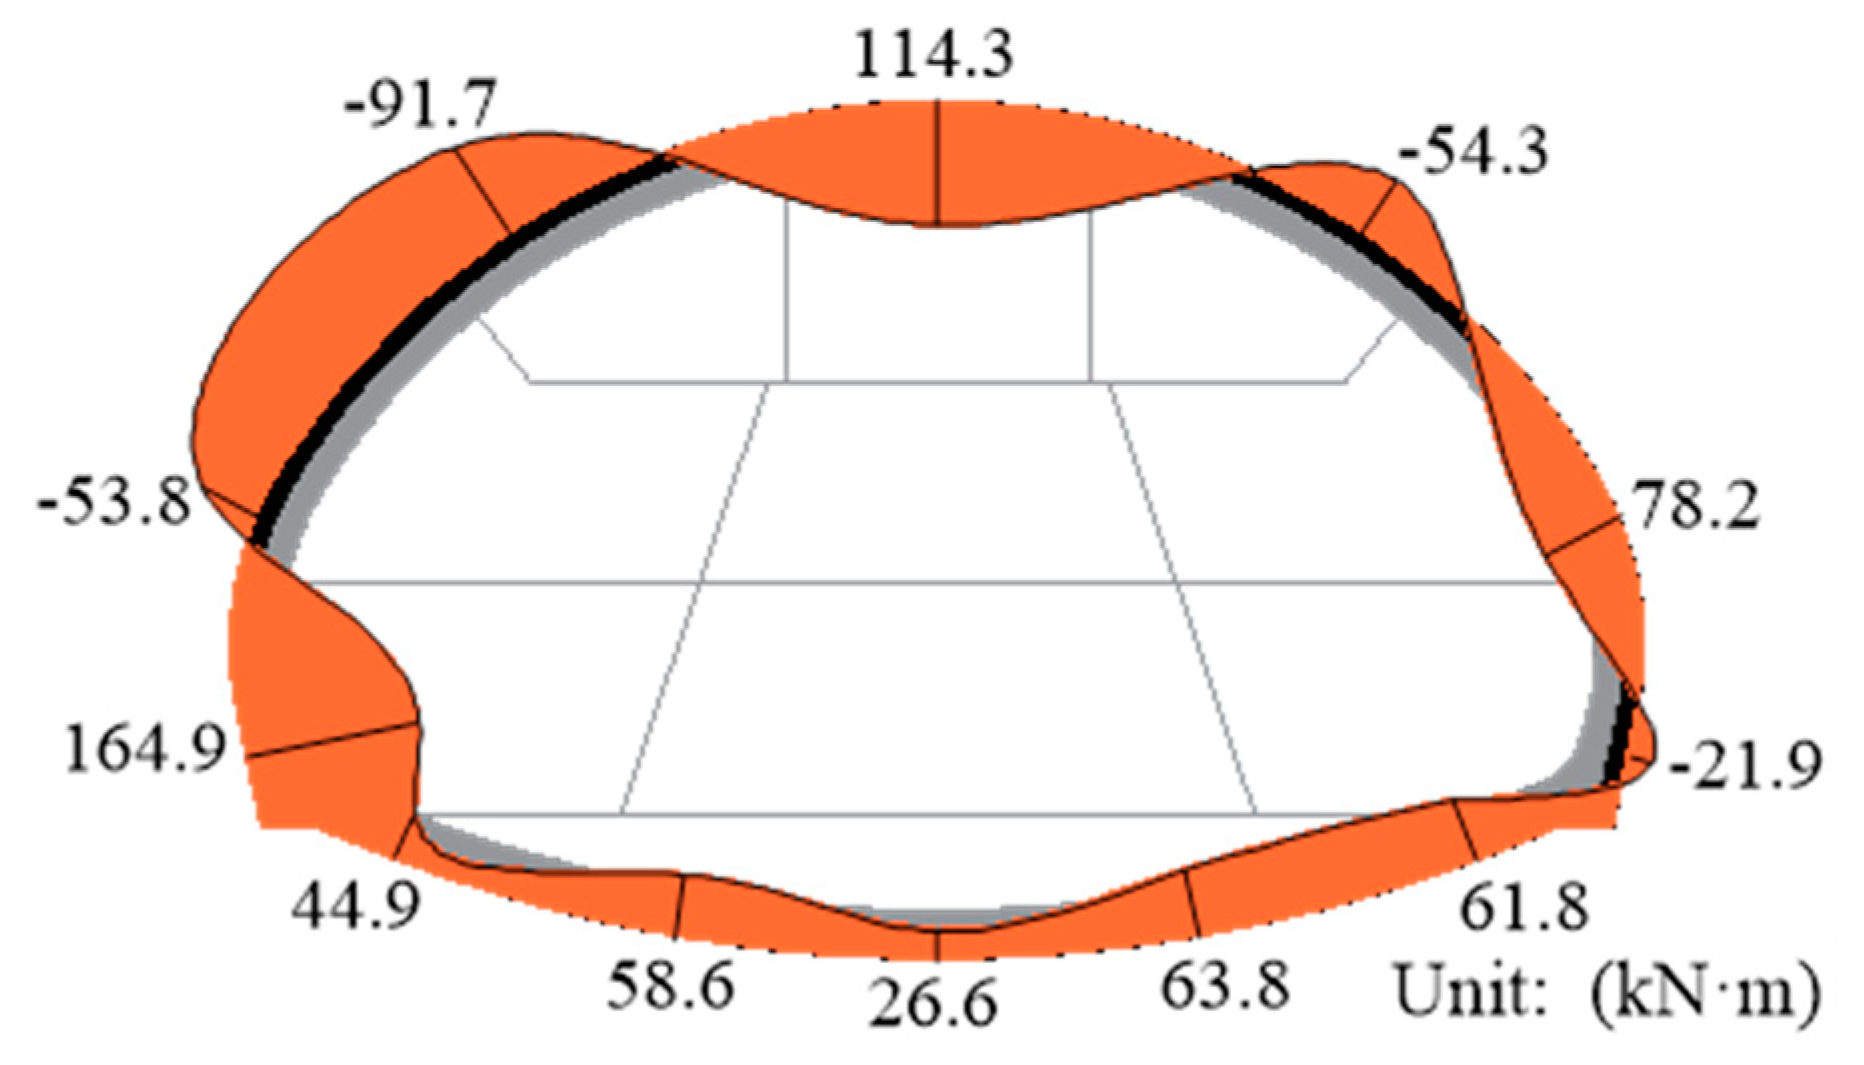
The axial forces and bending moments of the secondary supports were calculated according to the internal stresses, as shown in Figure 26 and Figure 27.
As can be seen from Figure 26, the maximum value of the axial forces of the secondary supports was 3896.1 kN at the crown. The distribution of the axial forces along the tunnel’s section was relatively larger at the top and relatively smaller at the bottom. It can be seen from Figure 27, that the maximum bending moment occurred at the left arch springing, with values of 164.9 kN·m; followed by the crown and left spandrel, with values of 114.3 kN·m and 91.7 kN·m, respectively. Through a comprehensive analysis of the axial forces and bending moments, the tunnel crown could be considered to be the most unfavorable position.

4. Conclusions

This paper has presented a case study of the construction of a super-span high-speed railway tunnel. The monitoring methods that were in this project and the corresponding data have been systematically introduced. The key results that were obtained from this study can be summarized as follows:
(1)
The internal displacement of the rock surrounding the tunnel increased greatly at the very beginning of the excavation. After stabilization, the internal displacements of the surrounding rock within 13 m from the orifice were significantly greater than that of the surrounding rock within 13–25 m from the orifice.
(2)
By using the analysis method of the special time points combined with the deformation increments at different depths, the critical range of damage of the surrounding rock was obtained. The ranges of the damage of the surrounding rock at different positions were controlled to within 9 m. The range of the damage of the surrounding rock at the tunnel’s crown was greater than that at the tunnel’s spandrel, which was even greater than that at the haunch of the tunnel.
(3)
For the larger range of the damage of the surrounding rock at the tunnel’s crown, anchor cables with larger prestresses were used to limit its development. The axial forces in the anchor bolts and the anchor cables showed a rapid drop at the beginning of the installation, which is 3.6–14.8% and 1.8–7.6% in this project, respectively. This needed to be considered during the tensioning process. The final axial forces in the anchor bolts and the anchor cables accounted for 60.0–75.7% and 41.6–60.4% of the corresponding yield loads, respectively, which not only exerted a load-bearing capacity but also retained a sufficient safety factor. The density of the anchor cables therefore could be reduced appropriately in order to coordinate the utilization of the anchor bolts and the anchor cables.
(4)
For the super-span tunnel constructed using the bench method, the excavation of the upper part of the tunnel was the main stage of the development of the contact pressures between the surrounding rock and the primary supports. In addition, the contact pressures between the surrounding rock and the primary supports at different locations were significantly different. In this project, the contact pressures between the surrounding rock and the primary supports at the crown, spandrel and haunch of the tunnel were obviously greater than that at the arch springing and the inverted arch, which means that the utilization rate of supports’ performance in different spatial positions was different. In order to ensure that the supporting structures were in uniform load-bearing conditions, they could be suitably strengthened in places where the loads were greater, and weakened where the loads were smaller.
(5)
The secondary supports not only served as a structure to provide a sufficient safety margin but also bear certain loads during construction as well as during long-term periods of operation of the super-span transition section. The contact pressures between the primary and secondary supports rapidly increased within one week after the construction of the secondary supports, which could reach more than 15% of the stable values. The distribution characteristics of the contact pressure between the primary and secondary supports was similar to that of the contact pressure between the surrounding rock and the primary supports, and the maximum value appeared at the tunnel crown, a value of only 135.1 kPa. By analyzing the axial forces and bending moments at the different positions of the secondary supports, it was found that the tunnel crown was the most unfavorable position.

Author Contributions

Conceptualization, D.L. and D.Z.; data curation, D.L. and Q.F.; formal analysis, D.L. and J.L.; investigation, D.L. and A.L.; methodology, D.L. and Q.L.; validation, D.L. and D.Z.; writing—original draft preparation, D.L.; writing—review and editing, D.L. and Z.S. All authors have read and agree to the published version of the manuscript.

Funding

This research was funded by Chinese National Natural Science Foundation, grant number 51738002 and National Key Research and Development Programs of China, grant number 2017YFC0805401.

Conflicts of Interest

The authors declare no conflict of interest. The funders had no role in the design of the study; in the collection, analyses, or interpretation of data; in the writing of the manuscript, or in the decision to publish the results.

References

  1. Liu, D.P.; Zhang, D.L.; Fang, Q.; Sun, Z.Y.; Cao, L.Q.; Li, A. Displacement characteristics of shallow-buried large-section loess tunnel with different types of pre-supports: A case study of New Badaling tunnel. Appl. Sci. 2020, 10, 195. [Google Scholar] [CrossRef] [Green Version]
  2. Li, P.F.; Zhao, Y.; Zhou, X.J. Displacement characteristics of high-speed railway tunnel construction in loess ground by using multi-step excavation method. Tunn. Undergr. Space Technol. 2016, 51, 41–55. [Google Scholar] [CrossRef]
  3. Shi, C.H.; Cao, C.Y.; Lei, M.F. Construction technology for a shallow-buried underwater interchange tunnel with a large span. Tunn. Undergr. Space Technol. 2017, 70, 317–329. [Google Scholar] [CrossRef]
  4. Luo, Y.B.; Chen, J.X.; Gao, S.T.; Deng, X.H.; Diao, P.S. Stability analysis of super-large-section tunnel in loess ground considering water infiltration caused by irrigation. Environ. Earth Sci. 2017, 76, 763. [Google Scholar] [CrossRef]
  5. Shang, Y.L.; Du, S.J.; Han, T.Y.; Shao, B.A. Case study on deformation control of upper-soft and lower-hard large span tunnel station using combined control technology and monitoring demonstration. Sains Malays. 2017, 46, 2091–2099. [Google Scholar] [CrossRef]
  6. Warren, C.D.; Mortimore, R.N. Chalk engineering geology-Channel Tunnel Rail Link and North Downs Tunnel. Q. J. Eng. Geol. Hydrogeol. 2003, 36, 17–34. [Google Scholar] [CrossRef]
  7. Kunikane, Y.; Kawabata, N.; Yamada, T.; Shimoda, A. Influence of stationary vehicles on backlayering characteristics of fire plume in a large cross section tunnel. JSME Int. J. B -Fluid T. 2006, 49, 594–600. [Google Scholar] [CrossRef] [Green Version]
  8. Haruyama, K.; Teramoto, S.; Taira, K. Construction of large cross-section double-tier Metropolitan Inter-city Highway (Ken-O–Do) Ome Tunnel by NATM. Tunn. Undergr. Space Technol. 2005, 20, 111–119. [Google Scholar] [CrossRef]
  9. Salcher, M.; Bertuzzi, R. Results of pull tests of rock bolts and cable bolts in Sydney sandstone and shale. Tunn. Undergr. Space Technol. 2018, 74, 60–70. [Google Scholar] [CrossRef]
  10. Feng, J.M.; Yan, C.W.; Ye, L.; Ding, X.Q.; Zhang, J.R.; Li, Z.L. Evaluation of installation timing of initial ground support for large-span tunnel in hard rock. Tunn. Undergr. Space Technol. 2019, 93, 103087. [Google Scholar] [CrossRef]
  11. Wu, Y.X.; Lin, W.; Qi, A. Design and applications of a new supporting method for the small tunnel sheds. Ing. Sismica 2017, 34, 49–63. [Google Scholar]
  12. Jia, P.J.; Zhao, W.; Chen, Y.; Li, S.G.; Han, J.Y.; Dong, J.C. A case study on the application of the steel tube slab structure in construction of a subway station. Appl. Sci. 2018, 8, 1437. [Google Scholar] [CrossRef] [Green Version]
  13. Sadaghiani, M.H.; Dadizadeh, S. Study on the effect of a new construction method for a large span metro underground station in Tabriz-Iran. Tunn. Undergr. Space Technol. 2010, 25, 63–69. [Google Scholar] [CrossRef]
  14. Mori, K.; Abe, Y. Large rectangular cross-section tunneling by the multi-micro shield tunneling (MMST) method. Tunn. Undergr. Space Technol. 2005, 20, 129–141. [Google Scholar] [CrossRef]
  15. Sharifzadeh, M.; Kolivand, F.; Ghorbani, M.; Yasrobi, S. Design of sequential excavation method for large span urban tunnels in soft ground-Niayesh tunnel. Tunn. Undergr. Space Technol. 2013, 35, 178–188. [Google Scholar] [CrossRef]
  16. Tonon, F. Sequential excavation, NATM and ADECO: What they have in common and how they differ. Tunn. Undergr. Space Technol. 2010, 25, 245–265. [Google Scholar] [CrossRef]
  17. He, P.; Li, S.C.; Li, L.P.; Zhang, Q.Q.; Xu, F.; Chen, Y.J. Discontinuous deformation analysis of super section tunnel surrounding rock stability based on joint distribution simulation. Comput. Geotech. 2017, 91, 218–229. [Google Scholar] [CrossRef]
  18. Verma, H.K.; Samadhiya, N.K.; Singh, M.; Goel, R.K.; Singh, P.K. Blast induced rock mass damage around tunnels. Tunn. Undergr. Space Technol. 2018, 71, 149–158. [Google Scholar] [CrossRef]
  19. Molladavoodi, H. Study of ground response curve (GRC) based on a damage model. Arch. Min. Sci. 2013, 58, 655–672. [Google Scholar]
  20. Zhang, D.L.; Fang, Q.; Hou, Y.J.; Li, P.F.; Wong, L.N.Y. Protection of buildings against damages as a result of adjacent large-span tunneling in shallowly buried soft ground. J. Geotech. Geoenviron. Eng. 2013, 139, 903–913. [Google Scholar] [CrossRef]
Figure 1. Map of Beijing-Zhangjiakou high-speed railway.
Applsci 10 05182 g001
Figure 2. The main structure of the Badaling Great Wall station.
Applsci 10 05182 g002
Figure 3. The layout and cross section of the super-span tunnel.
Applsci 10 05182 g003
Figure 4. Longitudinal geological profile of the project area.
Applsci 10 05182 g004
Figure 5. Support pattern and excavation process for Section 5-5.
Applsci 10 05182 g005
Figure 6. Layout of the multi-point extensometers.
Applsci 10 05182 g006
Figure 7. Layout of the earth pressure cells.
Applsci 10 05182 g007
Figure 8. Layout of the ring dynamometers.
Applsci 10 05182 g008
Figure 9. Layout of the steel strain gauges.
Applsci 10 05182 g009
Figure 10. Layout of the concrete strain gauges.
Applsci 10 05182 g010
Figure 11. Layout of the monitoring points.
Applsci 10 05182 g011
Figure 12. Curves of the tunnel displacement over time.
Applsci 10 05182 g012
Figure 13. Internal displacement duration curve.
Applsci 10 05182 g013
Figure 14. Curves of the displacement at the special time points vs. depth.
Applsci 10 05182 g014
Figure 15. Curves of the contact pressure between the surrounding rock and the primary supports over time.
Applsci 10 05182 g015
Figure 16. The final distribution of the contact pressure between the surrounding rock and the primary supports.
Applsci 10 05182 g016
Figure 17. Time history plots of the internal forces in the four bar lattice girders: (a) inner side; (b) outer side.
Applsci 10 05182 g017
Figure 18. Final distribution of the internal forces in the four bar lattice girders: (a) inner side; (b) outer side.
Applsci 10 05182 g018
Figure 19. Time history diagram of the axial forces in the anchor cables.
Applsci 10 05182 g019
Figure 20. Final distribution of the axial forces in the cables.
Applsci 10 05182 g020
Figure 21. Evolution of the axial forces at the end of the anchor bolts.
Applsci 10 05182 g021
Figure 22. Final distribution of the axial forces at the end of the anchor bolts.
Applsci 10 05182 g022
Figure 23. Time history plots of the contact pressures between the primary and secondary supports.
Applsci 10 05182 g023
Figure 24. Final distribution of the contact pressures between the primary and secondary supports.
Applsci 10 05182 g024
Figure 25. Time history curves of the stresses in the concrete of the secondary supports: (a) inner side; (b) outer side.
Applsci 10 05182 g025
Figure 26. Final distribution of the axial forces of the secondary supports.
Applsci 10 05182 g026
Figure 27. Final distribution of the bending moments of the secondary supports.
Applsci 10 05182 g027
Table 1. Typical examples of super-span tunnels in China.
NameLocationSpan
(m)
Height
(m)
Excavation Area
(m2)
Geological
Condition
Excavation
Method
Longtoushan tunnelGuangdong province21.513.6229.4weakly weathered graniteboth side drift method
Zengjiaping No.1 tunnelYunnan province20.612.6240.0limestone and marlboth side drift method
Hanjialing tunnelLiaoning province22.515.5273.3shale and limestonebench method
Gongbei tunnelGuangdong province18.750.8330.2silt and sandy pebblefreeze-sealing pipe roofmethod
Fenghuangshan tunnelYunnan province26.117.3363.5weakly weathered basalt and tuffboth side drift method
Hongtudi station of Chongqing metro line 6Chongqing municipality25.922.0375.8moderately weathered sandy mudstoneboth side drift method
Xinkaotang tunnelFujian province30.317.0396.1completely weathered graniteboth side drift method
Linjiangmen station of Chongqing Metro Line 2Chongqing municipality23.020.6421.0sandstone and sandy mudstoneboth side drift method
Liantang tunnelGuangdong province30.0118.41428.5slightly weathered sandstoneboth side drift method
Table 2. The typical physical and mechanical properties of the surrounding rock.
Specific Weight (kN/m3)Elastic Modulus (GPa)Poisson’s RatioCohesion (MPa)Friction Angle (°)
Tuff breccia27.011.30.300.840.2
Granite26.325.90.241.751.3
Monzonitic granite27.221.50.231.550.8
Table 3. Relationship between the basic quality (BQ) system and the quality (Q) System.
Grade IGrade IIGrade IIIGrade IVGrade V
Value(Very Good)(Good)(Fair)(Poor)(Very Poor)
BQ>550451–550351–450251–350<250
Q>4010–404–101–4<1
Table 4. Detailed parameters of the tunnel support for Section 5-5.
Tunnel Support TypeSpecific ParametersInstallation Area
temporary supportfiberglass anchorΦ25 mm, L = 4 m, 1 m × 1 m (longitudinal and circumferential spaced)sidewalls of Drift 1
steel supportNo.16 I-shaped steel, 0.8 m longitudinal spacedsidewalls of Drift 1
shotcretethickness: 8 cm, concrete type: C30sidewalls of Drift 1
primary supportprestressed anchor boltΦ32 mm, L = 11 m, 0.8 m × 1.2 m (longitudinal and circumferential spacing), 100 kN pretensionvault
prestressed anchor cable 1Φ15.2 mm × 7 steel stranded wires, L = 25 m, 700 kN pretensionvault
prestressed anchor cable 2Φ15.2 mm × 5 steel stranded wires, L = 25 m, 500 kN pretensionvault
steel ribΦ22 mm four bars lattice girders, 0.8 m longitudinal spacedwhole section
shotcrete of vault(1) thickness: 5 cm, concrete type: C30, containing nano-silica and fiber concrete
(2) thickness: 18.2 cm, concrete type: C30, containing fiber concrete
(3) thickness: 11.8 cm, concrete type: C30
vault
shotcrete of inverted archthickness: 25 cm, concrete type: C30inverted arch
secondary supportform working concretethickness: 60 cm, concrete type: C35, Φ28 mm main reinforcement, 0.2 m longitudinal spacedwhole section
Table 5. Proportion of the tunnel displacement in the different construction stages.
Displacement ParameterMonitoring
Section
Construction Stage
Stage
1
Stage
2–3
Stage
4–5
Stage
6–7
Stage
8–9
Stage
10–11
Settlement Proportion (%)DK68+29035.129.911.69.33.810.3
DK68+29554.021.610.75.71.76.3
DK68+30041.435.27.111.03.22.1
Convergence Proportion (%)DK68+29042.321.719.77.78.6
DK68+29538.617.826.88.97.9
DK68+30030.631.514.34.119.5
Table 6. Damage range of the surrounding rock at different positions.
Monitoring Position
CrownLeft SpandrelRight SpandrelLeft HaunchRight Haunch
Damage Range (m)8.17.47.26.56.9