Abstract
Visual complexity, as an attribute of images related to human perception, has been widely studied in computer science and psychology. In conventional studies, the research objects have been limited to the traditional two-dimensional (2D) patterns or images. Therefore, if depth information is introduced into this scenario, how will it affect our perception of visual complexity of an image? To answer this question, we developed an experimental virtual reality system that enables control and display of three-dimensional (3D) visual stimuli. In this study, we aimed to investigate the effect of depth information on visual complexity perception by comparing 2D and 3D displays of the same stimuli. We scanned three textures with different characteristics to create the experimental stimuli and recruited 25 participants for the experiment. The results showed that depth information significantly increased the visual complexity perception of the texture images. Moreover, depth information had different degrees of impact on visual complexity for different textures. The higher the maximum depth introduced in the 3D image, the more significant the increase in visual complexity perception. The experimental virtual reality system used in this study also provides a feasible experimental tool for future experiments.
1. Introduction
Visual complexity is one of the subjective impressions associated with visual information of stimuli and plays an important role in human perception and recognition of patterns and images. The study of visual complexity is significant for visual understanding and aesthetic evaluation. It is useful in many applications, such as image segmentation, content-based image retrieval, and user interface design. It has been shown that visual complexity also affects human emotions, memory, and active movement [1]. However, it is challenging to describe human sensitivity to perception of visual complexity quantitatively. The definition of visual complexity also varies according to the research field and application [2,3,4].
In the field of computer science, researchers have attempted to describe, measure, and model image complexity based on mathematical and computational approaches, such as information theory [5], spatial information [6], visual attention [7], independent component analysis [8], and machine learning [9,10,11]. Computer scientists are usually interested in the objective description of image complexity rather than the subjective perception of visual complexity. In the field of psychology, researchers are more interested in exploring attentional models and identifying factors that affect visual complexity perception [12,13,14,15]. Previously, several studies have attempted to correlate the computational measures and the perception of visual complexity [16,17,18]. Quantitative analyses have been conducted to investigate the relationship between the perception of visual complexity and the factors influencing it [19,20].
The stimuli and target images used in previous studies of visual complexity perception include abstract patterns [14,21], outline images and hieroglyphs [22], texture images [23,24,25], grayscale images [26], paintings [16,19,20], webpages [27,28], and real-world images [8,13,18]. Thus, in conventional studies of visual complexity perception, the research objects have been limited to two-dimensional (2D) images. Due to the rapid development of technologies such as three-dimensional (3D) measurement, range imaging, and stereoscopic display, users now have more opportunities to appreciate 3D or RGB-depth (RGB-D) images that convey depth information. In this study, we aimed to explore how depth information affects visual complexity perception. It should be noted that the depth information we introduced in this study refers to spatial changes in depth on the continuous image surface. Structural complexity in 3D modeling lies outside the scope of this study.
Virtual reality (VR) technology has been widely used as a research tool in psychological studies of visual perception over the last few decades [29,30]. One of the advantages of VR in psychological experiments is that it can display visual stimuli with controlled parameters in 3D. The impression of depth can be reproduced by presenting binocular vision cues using a head-mounted display (HMD) [31]. VR technology also provides an immersive environment for studies on multimodal sensory interactions [32,33,34].
In this study, we constructed a VR system and applied it to investigate the visual complexity perceptions of texture images in 2D and 3D conditions. One of the reasons we chose textures as the stimuli in this study is that the properties of textures are more accessible and easier to manipulate than natural images [35]. Moreover, the visual perception of textures can be represented in a lower feature space. Three to five textural features have been commonly used to describe perceptual dimensions of textures [24,25,36,37]. We scanned three textures with different visual complexities from physical objects using photogrammetry. We investigated the relationship between visual complexity perception and depth information, and found that depth information is essential in the visual complexity perception of 3D textures.
2. Materials and Methods
2.1. Participants
Twenty-five college students participated in the experiment. The ages of the participants ranged from 19 to 22 years (M = 19.88, SD = ±0.67). All participants had normal or corrected-to-normal vision and none of them had participated in any similar study previously. All participants provided written informed consent before taking part in the experiment. The experiment was conducted in accordance with relevant guidelines and regulations. The study was conducted in accordance with the Declaration of Helsinki, and the study protocol was approved by the Ethics Committee of the National Institute of Technology, Gunma College (project identification code: H28-2, date of approval: 11 July 2016).
2.2. Stimuli
In this study, we selected three textures with different characteristics as the stimuli for the experiment. These textures and their characteristics were as follows:
- Door (a Japanese room divider consists of sheets on a lattice frame): High regularity, high directionality, low roughness, low density, high depth variation, and expected to have medium visual complexity.
- Dot (truncated domes): High regularity, medium directionality, low roughness, low density, low depth variation, and expected to have low visual complexity.
- Stone (stone wall): low regularity, medium directionality, high roughness, high density, high depth variation, and expected to have high visual complexity.
The texture images were scanned in 3D from real objects using photogrammetry (Agisoft Metashape, Version 1.5.0 build 7492, Agisoft LLC, St. Petersburg, Russia, 2018). Outliers in the scanned 3D models were manually removed. The 3D texture images were then normalized in a 100 × 100 × 100 mm bounding box while retaining their original aspect ratios. The corresponding 2D textures were obtained by parallel projection of the 3D textures. The resolution of the 2D and 3D textures was down sampled to 512 × 512 pixels.
The three texture stimuli used in the experiments are shown in Figure 1.
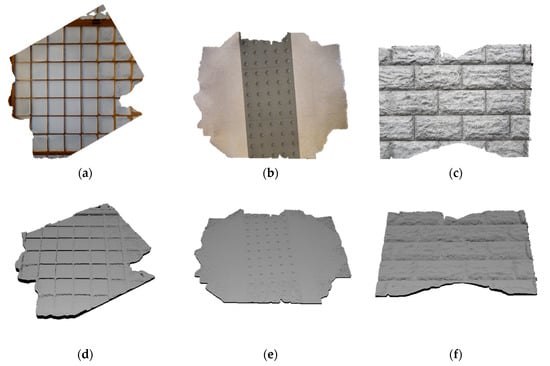
Figure 1.
Texture stimuli used in the experiments. (a) Texture of door; (b) texture of dot; (c) texture of stone; (d) 3D surface of door; (e) 3D surface of dot; (f) 3D surface of stone.
2.3. Apparatus
The VR experimental environment was built using Unity and displayed on an HTC VIVE pro HMD (HTC Corporation, New Taipei City, Taiwan) (resolution: 2880 × 1600 pixels combined; field of view: 110 degrees; refresh rate: 90 Hz). The 3D rendering was performed on a personal computer (PC) with the following specifications: Intel i7-6700HQ CPU, 8 GB of RAM, and NVIDIA GeForce GTX 1070 8 GB.
The experimental system had the following functions:
- Select and display the textures.
- Switch between 2D and 3D textures.
- Change the size of the textures.
- Change the depth of the 3D textures.
- Change the initial position of the textures.
- Change the background color.
- Move the observation position.
In our experiment, functions (3) to (7) were set to fixed values. The background color was set to RGB = (89, 89, 89). The shader was disabled in Unity. Figure 2 shows the experimental system used in this study.
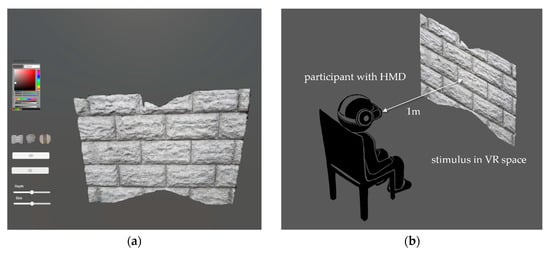
Figure 2.
Virtual reality experimental system. (a) Parameter setup established by the experimenter before the experiments. (b) Experimental setup.
2.4. Procedure
The participants were seated on a chair built for the experiment and wore an HMD. Before the experiment, we orally confirmed that each participant could correctly perceive stereoscopic vision. The texture stimuli were presented in front of the participant at a distance of 1.00 m in the VR space. It subtended 53.13 degrees of visual angle horizontally and vertically. The distance was set as the most comfortable distance at which a participant could properly observe the stimuli according to the results of a preliminary experiment involving five participants. The participants who participated in the preliminary experiment did not participate in the present experiment. First, the participants were asked to view all the six textures once. Then, they were asked to observe each texture again and rate its visual complexity based on their perception, on a 7-point Likert scale ranging from 1 (very simple) to 7 (very complex). The duration of exposure of the stimuli and the participant’s response time were not limited. The stimuli were presented randomly. After the experiment, the participants were asked to describe the characteristics of the stimuli which they used for determining the visual complexity for each stimulus. Multiple answers were allowed.
2.5. Statistical Analysis
In order to analyze each parameter statistically, we used two-way, repeated-measures analysis of variance (ANOVA) on depth (depth level: 2D, 3D) and texture (door, dot, stone). The main effect and interaction effect of each parameter was computed by a repeated-measure function in the IBM SPSS Statistics (V.26, IBM, Armonk, New York, USA, 2019). A post-hoc test was performed by using pairwise comparisons with Bonferroni correction. Additionally, we calculated the mean (M) and standard deviation (SD) of the data. Mauchly’s sphericity test was performed to validate the results of the ANOVA. As shown in Table 1 and Table 2, we considered differences to be statistically significant for p < 0.05, and highly significant for p < 0.01. The effect sizes shown in Table 2 were estimated by using Cohen’s d.

Table 1.
A summary of statistical analysis on the complexity differences of textures.
Table 2.
Pairwise comparison for interaction between the depth and texture factors corrected by a Bonferroni adjustment.
3. Results
Table 3 shows the mean and standard deviation of the visual complexity score for each texture. We analyzed the relationship between texture and depth in determining visual complexity using two-way, repeated-measures ANOVA.
Table 3.
Descriptive statistics for the perceived visual complexity of each texture.
The analysis of the differences in the perceived complexity of the textures revealed significant key impacts of depth (F(1, 24) = 22.41, p < 0.001, partial η2 = 0.48) and texture (F(1.58, 38) = 10, p = 0.001, partial η2 = 0.29), and a significant interaction between depth and texture (F(2, 48) = 5.13, p = 0.01, partial η2 = 0.18) (Table 1).
This indicated that the characteristics of the texture and depth information affected visual complexity perception. Further, depth information had different degrees of impact on visual complexity perception for different textures.
We indicated the pairwise comparison for interaction between the depth and texture factors, corrected using a Bonferroni adjustment. As shown in Table 2, there was a statistically significant difference between the complexity scores for each texture in 2D and 3D. The results revealed that the participants seemed to recognize the complexity in the 3D textures more (M = 3.67, SD = ±1.54) than in the 2D textures (M = 2.61, SD = ±0.94) ((t(74) = 4.732, p < 0.001, Cohen’s d = 0.546)).
Figure 3 shows the result of the pairwise comparison for mean complexity between 2D and 3D textures. For all textures, the mean complexity scores in 3D were significantly higher than those in 2D.
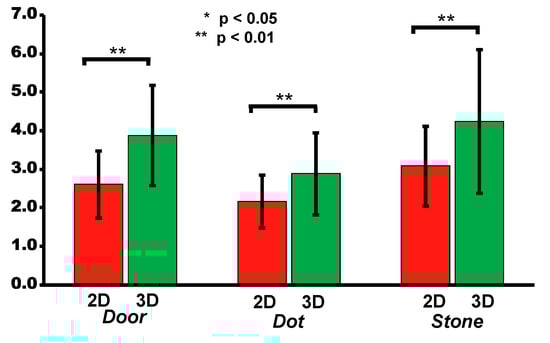
Figure 3.
Pairwise comparison for mean complexity scores between 2D and 3D textures. Error bars indicate SD (Standard deviation). * means p < 0.05, ** means p < 0.01.
In our results, for door, a significant difference (p < 0.001, Cohen’s d = 0.934) was observed between the complexity scores in 2D (M = 2.60, SD = ±0.866) and 3D (M = 3.88, SD = ±1.301). For dot, a significant difference (p = 0.001, Cohen’s d = 0.769) was observed between the complexity scores in 2D (M = 2.16, SD = ±0.688) and 3D (M = 2.88, SD = ±1.054). For stone, a significant difference (p < 0.001, Cohen’s d = 0.863) was observed between the complexity scores in 2D (M = 3.08, SD = ±1.038) and 3D (M = 4.24, SD = ±1.855).
4. Discussion
The experimental results revealed that both texture characteristics and depth information, had significant impacts on the evaluation of visual complexity in a VR space. Depth, roughness, three-dimensionality, directionality, regularity, and understandability of the textures were the factors that most influenced the visual complexity perception, as found by analyzing the participants’ responses to the questionnaire given after the experiment.
We compared the visual complexity of three sets of texture images under 2D and 3D conditions. All three sets of texture images indicated greater visual complexity by approximately one score under 3D conditions. This may have been due to the introduction of additional depth information in the 3D textures, which implied that the amount of information in a 3D texture was greater than that in its corresponding 2D texture, thereby resulting in increased visual complexity perception.
It is worth noting that the understandability of a texture has been considered to be a major factor affecting visual complexity [24,25]. Understandability represents how easily a participant can comprehend a particular stimulus. Textures with higher understandability usually have lower perceived visual complexity. When additional depth information is introduced to a 3D texture, the additional information may help the participants to comprehend the texture more easily, thereby reducing the visual complexity of the 3D texture. However, the experimental results did not support this hypothesis. This may be because of the characteristics of the texture stimuli which we selected for the experiment. The understandability of these texture stimuli was relatively high, and the additional depth information did not significantly improve the understandability. We plan to conduct more experiments on other texture stimuli in the future in order to explore this further.
The experimental results also revealed that textures with higher complexity had higher standard deviations, and 3D textures with depth information had higher standard deviations than 2D textures, as shown in Figure 3. This can also be attributed to additional depth information provided in 3D textures. The additional depth cues might have resulted in more factors that affect visual complexity, making it more difficult for participants to obtain consistent results in evaluation of complexity.
Furthermore, the experimental results shown in Table 3 indicate that the mean difference between the complexity of a texture in 2D and 3D was proportional to the maximum depth of its 3D image (door: maximum depth = 21.07 mm, dot: maximum depth = 7.89 mm, stone: maximum depth = 18.01 mm). There was a significant interaction between the depth and texture in visual complexity perception. This indicates that for different textures, depth information had different effects on perception of visual complexity. In the future, we aim to perform more experiments to verify whether the interaction between depth and texture in visual complexity perception is caused by the characteristics of different textures (directionality, density, regularity, etc.) or is only related to the maximum depth of a texture.
5. Conclusions
In this study, we conducted an assessment of visual complexity perception for three sets of texture stimuli with different characteristics and analyzed the effect of depth information on visual complexity. The experiment was carried out in a VR space with real-world scanned texture stimuli. The results showed that depth information significantly increased visual complexity perception for the texture images. This indicates that along with the RGB information about the texture, depth information also has an essential impact on the perception of visual complexity. This study suggests that in the case of visual perception and analysis, it is necessary to consider the factor of depth information.
Virtual reality has been successfully used as an experimental tool in many psychological experiments [29,30]. The VR system and experimental protocol in this study demonstrated their potential for studies of visual complexity with 3D stimuli. In future studies, we will make full use of the advantages of virtual reality technology in 3D stimulus presentation, parameter control, and real-time interaction, and conduct visual complexity experiments on more real-world scanned or synthetic stimuli.
Author Contributions
Conceptualization, L.L. and W.C.; methodology, L.L. and W.C.; software, T.Y.; validation, L.L. and W.C.; formal analysis, L.L. and W.C.; investigation, L.L. and W.C.; resources, L.L. and W.C.; data curation, L.L. and W.C.; writing—original draft preparation, L.L.; writing—review and editing, L.L. and W.C.; visualization, L.L. and W.C.; supervision, W.C.; project administration, W.C.; funding acquisition, L.L. and W.C. All authors have read and agreed to the published version of the manuscript.
Funding
This research was supported by JSPS KAKENHI, grant number 18K11594, and the Research Promotion Program (Ritsumeikan University, Japan).
Conflicts of Interest
The authors declare no conflict of interest.
References
- Tuch, A.N.; Bargas-Avila, J.A.; Opwis, K.; Wilhelm, F.H. Visual complexity of websites: Effects on users’ experience, physiology, performance, and memory. Int. J. Hum. Comput. Stud. 2009, 67, 703–715. [Google Scholar] [CrossRef]
- Kolmogorov, A.N. Three approaches to the quantitative definition of information. Int. J. Comput. Math. 1968, 2, 157–168. [Google Scholar] [CrossRef]
- Snodgrass, J.G.; Vanderwart, M. A standardized set of 260 pictures: Norms for name agreement, image agreement, familiarity, and visual complexity. J. Exp. Psychol. Hum. Learn. Mem. 1980, 6, 174–215. [Google Scholar] [CrossRef]
- Heaps, C.; Handel, S. Similarity and features of natural textures. J. Exp. Psychol. Hum. Percept. Perform. 1999, 25, 299–320. [Google Scholar] [CrossRef]
- Rigau, J.; Feixas, M.; Sbert, M. An information-theoretic framework for image complexity. In Proceedings of the First Eurographics conference on Computational Aesthetics in Graphics, Visualization and Imaging, Girona, Spain, 18–20 May 2005; Neumann, L., Sbert, M., Gooch, B., Purgathofer, W., Eds.; Eurographics Association: Goslar, Germany, 2005; pp. 177–184. [Google Scholar]
- Yu, H.; Winkler, S. Image complexity and spatial information. In Proceedings of the 2013 Fifth International Workshop on Quality of Multimedia Experience (QoMEX), Klagenfurt am Wörthersee, Austria, 3–5 July 2013; pp. 12–17. [Google Scholar]
- Da Silva, M.P.; Courboulay, V.; Estraillier, P. Image complexity measure based on visual attention. In Proceedings of the 18th IEEE International Conference on Image Processing, Brussels, Belgium, 11–14 September 2011; pp. 3281–3284. [Google Scholar]
- Perkiö, J.; Hyvärinen, A. Modelling image complexity by independent component analysis, with application to content-based image retrieval. In Artificial Neural Networks–ICANN 2009; Springer: Berlin/Heidelberg, Germany, 2009; pp. 704–714. [Google Scholar]
- Machado, P.; Romero, J.; Nadal, M.; Santos, A.; Correia, J.; Carballal, A. Computerized measures of visual complexity. Acta Psychol. 2015, 160, 43–57. [Google Scholar] [CrossRef]
- Fernandez-Lozano, C.; Carballal, A.; Machado, P.; Santos, A.; Romero, J. Visual complexity modelling based on image features fusion of multiple kernels. PeerJ 2019, 18, e7075, PMID:31346494; PMCID:PMC6642794. [Google Scholar] [CrossRef]
- Saraee, E.; Jalal, M.; Betke, M. Visual complexity analysis using deep intermediate-layer features. Comput. Vis Image Underst. 2020, 195. [Google Scholar] [CrossRef]
- Oliva, A.; Mack, M.L.; Shrestha, M. Identifying the Perceptual Dimensions of Visual Complexity of Scenes. In Proceedings of the 26th Annual Meeting of the Cognitive Science Society, Chicago, IL, USA, 4–7 August 2004. [Google Scholar]
- Ciocca, G.; Corchs, S.; Gasparini, F.; Bricolo, E.; Tebano, R. Does color influence image complexity perception? In Fifth IAPR Computational Color Imaging Workshop (CCIW’15); Volume 9016 of Lecture Notes in Computer Science; Springer: Berlin/Heidelberg, Germany, 2015; pp. 139–148. [Google Scholar]
- Palumbo, L.; Ogden, R.; Makin, A.D.J.; Bertamini, M. Examining visual complexity and its influence on perceived duration. J. Vis. 2014, 14, 3. [Google Scholar] [CrossRef]
- Nadal, M.; Munar, E.; Marty, G.; Cela-conde, C.J. Visual Complexity and Beauty Appreciation: Explaining the Divergence of Results. Empir. Stud. Arts 2010, 28, 173–191. [Google Scholar] [CrossRef]
- Cardaci, M.; Gesù, V.D.; Petrou, M.; Tabacchi, M.E. A fuzzy approach to the evaluation of image complexity. Fuzzy Set. Syst. 2009, 160, 1474–1484. [Google Scholar] [CrossRef]
- Joshi, D.; Datta, R.; Fedorovskaya, E.; Luong, Q.T.; Wang, J.Z.; Li, J.; Luo, J.B. Aesthetics and emotions in images: A computational perspective. IEEE Signal Process Mag. 2011, 28, 94–115. [Google Scholar] [CrossRef]
- Corchs, S.E.; Ciocca, G.; Bricolo, E.; Gasparini, F. Predicting complexity perception of real world images. PLoS ONE 2016, 11, e0157986. [Google Scholar] [CrossRef] [PubMed]
- Guo, X.; Kurita, T.; Asano, C.M.; Asano, A. Visual complexity assessment of painting images, image processing (ICIP). In Proceedings of the 20th IEEE International Conference on Image Processing, Melbourne, VIC, Australia, 15–18 September 2013; pp. 388–392. [Google Scholar]
- Guo, X.; Qian, Y.; Li, L.; Asano, A. Assessment model for perceived visual complexity of painting images. Knowl.-Based Syst. 2018, 159, 110–119. [Google Scholar] [CrossRef]
- Gartus, A.; Leder, H. Predicting perceived visual complexity of abstract patterns using computational measures: The influence of mirror symmetry on complexity perception. PLoS ONE 2017, 12, e0185276. [Google Scholar] [CrossRef] [PubMed]
- Chikhman, V.; Bondarko, V.; Danilova, M.; Goluzina, A.; Shelepin, Y. Complexity of images: Experimental and computational estimates compared. Perception 2012, 41, 631–647. [Google Scholar] [CrossRef]
- Ciocca, G.; Corchs, S.; Gasparini, F. Complexity Perception of Texture Images. In New Trends in Image Analysis and Processing—ICIAP 2015 Workshops (ICIAP 2015); Lecture Notes in Computer Science; Murino, V., Puppo, E., Sona, D., Cristani, M., Sansone, C., Eds.; Springer: Cham, Switzerland, 2015; Volume 9281. [Google Scholar]
- Guo, X.; Asano, C.M.; Asano, A.; Kurita, T.; Li, L. Analysis of texture characteristics associated with visual complexity perception. Opt. Rev. 2012, 19, 306–314. [Google Scholar] [CrossRef]
- Guo, X.; Asano, C.M.; Asano, A.; Kurita, T. Modeling the Perception of Visual Complexity in Texture Images. Int. J. Affect. Eng. 2013, 12, 223–231. [Google Scholar] [CrossRef]
- Zanette, D.H. Quantifying the complexity of black-and-white images. PLoS ONE 2018, 13, e0207879. [Google Scholar] [CrossRef]
- Michailidou, E. ViCRAM: Visual complexity rankings and accessibility metrics. ACM SIGACCESS Access. Comput. 2016, 24–27. [Google Scholar] [CrossRef]
- Miniukovich, A.; Angeli, A.D. Quantification of interface visual complexity. In Proceedings of the International Working Conference on Advanced Visual Interfaces (AVI 2014), Como, Italy, 27–30 May 2014; pp. 153–160. [Google Scholar]
- Wilson, C.; Soranzo, A. The use of virtual reality in psychology: A case study in visual perception. Comput. Math. Methods Med. 2015, 151702. [Google Scholar] [CrossRef]
- Menshikova, G.; Bayakovski, Y.; Luniakova, E.; Pestun, M.; Zakharkin, D. Virtual Reality Technology for the Visual Perception Study. In Transactions on Computational Science XIX; Lecture Notes in Computer Science; Gavrilova, M.L., Tan, C.J.K., Konushin, A., Eds.; Springer: Berlin/Heidelberg, Germany, 2013; Volume 7870. [Google Scholar]
- Jamiy, F.E.; Marsh, R. Survey on depth perception in head mounted displays: Distance estimation in virtual reality, augmented reality, and mixed reality. IET Image Process. 2019, 13, 707–712. [Google Scholar] [CrossRef]
- Bohil, C.J.; Alicea, B.; Biocca, F.A. Virtual reality in neuroscience research and therapy. Nat. Rev. Neurosci. 2011, 12, 752–762. [Google Scholar] [CrossRef] [PubMed]
- Keshavarz, B.; Hettinger, L.J.; Vena, D.; Campos, J.L. Combined effects of auditory and visual cues on the perception of vection. Exp. Brain Res. 2014, 232, 827–836. [Google Scholar] [CrossRef] [PubMed]
- Choi, W.; Lee, J.; Li, L. Analysis of Three-Dimensional Circular Tracking Movements Based on Temporo-Spatial Parameters in Polar Coordinates. Appl. Sci. 2020, 10, 621. [Google Scholar] [CrossRef]
- Li, L.; Asano, A.; Asano, C.M.; Okajima, K. Statistical quantification of the effects of viewing distance on texture perception. J. Opt. Soc. Am. A 2013, 30, 1394–1403. [Google Scholar] [CrossRef]
- Rao, A.R.; Lohse, G.L. Towards a texture naming system: Identifying relevant dimensions of texture. Vis. Res. 1996, 36, 1649–1669. [Google Scholar]
- Cho, R.Y.; Yang, V.; Hallett, P.E. Reliability and dimensionality of judgments of visually textured materials. Percept. Psychophys. 2000, 62, 735–752. [Google Scholar] [CrossRef]


© 2020 by the authors. Licensee MDPI, Basel, Switzerland. This article is an open access article distributed under the terms and conditions of the Creative Commons Attribution (CC BY) license (http://creativecommons.org/licenses/by/4.0/).