Article

Assessment of Pohang Earthquake-Induced Liquefaction at Youngil-Man Port Using the UBCSAND2 Model

1
Department of Civil Engineering, Kyungpook National University, 80 Daehakro, Bukgu, Daegu 41566, Korea
2
School of Architecture, Civil, Environment and Energy, Kyungpook National University, 80 Daehakro, Bukgu, Daegu 41566, Korea
*
Author to whom correspondence should be addressed.
Appl. Sci. 2020, 10(16), 5424; https://doi.org/10.3390/app10165424
Submission received: 29 June 2020 / Revised: 29 July 2020 / Accepted: 4 August 2020 / Published: 5 August 2020
(This article belongs to the Section Civil Engineering)

Abstract

:
The practical constitutive model UBCSAND2, which combines two-mobilized planes—a maximum shear stress plane and a horizontal plane within a framework of classical plasticity approach—is used to incorporate shear-induced effects in both loading and unloading as well as principal stress rotation effects. UBCSAND2 was calibrated by capturing cyclic direct simple shear (CDSS) test results of Pohang sand, which was collected from liquefied paddy fields due to the 2017 Pohang earthquake (Mw = 5.4) in South Korea. The model procedure focuses on simple shear condition because it best simulates field conditions under earthquake loading. The calibrated UBCSAND2 model is then used to assess the liquefaction-induced damages that occurred at the quay wall and backfill layer in Youngil-man port near the epicenter of the Pohang earthquake. The numerical results show that liquefaction mostly occurred in silty sand layers, in which the excess pore pressure ratio reached almost one. The estimated displacements of the quay wall and the predicted settlement of reclaimed area obtained from the analysis were in good agreement with those obtained from field measurements.

1. Introduction

Earthquake-induced liquefaction is one of the primary causes of major damages to geotechnical structures under saturated soil conditions. Since the 1950s, very complex soil nonlinear models have been analytically developed to predict the phenomenon [1]. However, to date a reliable prediction of liquefaction-resulted displacements that developed in the plasticity formulation has still been challenging. Beaty and Perlea [2] pointed out these challenges should be considered when choosing and applying a constitutive model for a finite element analysis to predict liquefaction, which include: (i) adequate capture of cyclic soil element responses such as shear stress–strain curve, effective stress path, generation of pore pressure, (ii) best fit in the relationship between cyclic stress ratio (CSR = τxy/σy) and number of cycles to liquefaction (Nliq) obtained from laboratory test results and predictions, (iii) reasonable agreement of the calibrations to the empirical relationships (i.e., field test data) for liquefaction triggering, (iv) transparent input parameters based on the realistic properties of soils (e.g., relative density Dr), and (v) robust application to many elements analysis via back analysis of case histories. Following this, the fully coupled effective stress model is considered to be the most sophisticated class of continuum models of liquefaction [2]. Another one of the conventional models that has been widely used in earthquake engineering applications (e.g., dams, bridges, buildings, and ports) is the UBCSAND model. A major advantage of this model is its relative simplicity in predicting plasticity formulation. Additionally, it can accurately predict the onset of dynamic induced liquefaction in calibration from cyclic direct simple shear (CDSS) tests [3], verification from centrifuge tests [4,5], or practical engineering applications [3,6,7]. Many versions of the UBCSAND model have been developed over two decades, and the UBCSAND v.904aR model [3] is the most widely used version, as it includes important modifications to more accurately estimate the seismic behavior of sand. Beaty [5] indicated some limitations of the UBCSAND v.904aR model, however, which include: (i) elastic unloading until shear stress reversal, (ii) omission of the effects of principal stress rotation, (iii) simplification of post-liquefaction volumetric strains due to the re-consolidation process, and (iv) single assessment of stress reversals on horizontal (or 45°) planes [5,8]. Consequently, Park [8] proposed a two-mobilized planes model (i.e., UBCSAND2 model), which could significantly improve these drawbacks, except the limitation (iii). The model was calibrated by a series of CDSS tests, and validated by sloping-ground centrifuge tests on Fraser river sand, in which there was a good agreement between the numerical results obtained from the UBCSAND2 model and the experimental results. Therefore, the UBCSAND2 model is a promising tool to predict seismic-induced liquefaction.
Korea had been recognized as safe from the threat of earthquakes until the recent Pohang earthquake, which hit the city of Pohang, Gyeongsangbuk-do with a magnitude of 5.4 on 2017 November 17. Near the epicenter, several damages induced by soil–structure interaction were observed, such as building collapses, sand blows, ground cracks, lateral spreading, and ground settlements were observed by solely visiting sites after the earthquake [9,10]. In particular, there are two important reclaimed sites at Youngil-man port and Pohang port, which are mainly composed of backfill material and a caisson-type quay wall to prevent reclaimed area from the sea. These backfill materials are extremely sensitive to liquefaction caused by dynamic loading; however, liquefaction occurred only at Youngil-man port [11,12] based on observation. Most researchers [13,14] analyzed liquefaction in Pohang using one-dimensional soil column analysis, which used the equivalent linear method based on standard penetration test (SPT) or cone penetration test (CPT) data. In this method, total stress is used, and the generation of pore water pressure is omitted. Therefore, there is an argument over the resulting displacements obtained from this method due to its oversimplifications, and it is often performed to identify regions with high potential of liquefaction by computing safety factor for liquefaction (FS) or liquefaction potential index (LPI). Only a few researchers conducted analyses of the effective stress to assess liquefaction at Pohang. Ahn et al. [15] performed an effective stress nonlinear site responses analysis to estimate the generation of pore pressure and the significant reduction in effective stress, which are the two key criteria in evaluating liquefaction. Kim et al. [11] carried out an effective stress analysis of the Pohang earthquake-induced quay wall and backfill displacement at Youngil-man port using a multiple simple shear mechanism [16,17] to predict the nonlinear stress–strain behavior of soil under seismic loading. In this model, the requirements of some additional input parameters other than soil materials are needed to predict excess pore water during shaking, for example, four unrealistic parameters S1, w1, p1, and p2 relating to type of materials [16,17]. Lee et al. [12] also extended the analysis of Kim et al. [10] in two drainage conditions (drained and undrained) during the shaking and post-shaking periods. In the analysis of Ahn et al. [15], Kim et al. [11], and Lee et al. [12], pore pressure changes were predicted by an independent pore pressure generator, and they did not relate to the volumetric strains produced by the soil skeletons. Hence, they can be classified as the partially coupled or loosely coupled effective stress analysis [2]. In addition, neither calibrations from experimental results nor parametric studies for the constitutive model prior to the application of the Youngil-man port case study were conducted in these studies. Therefore, it is essential to carry out a fully coupled effective stress analysis using a state-of-the-art approach, such as UBCSAND2, to more accurately model earthquake-induced liquefaction.
In this study, the UBCSAND2 constitutive model was used to precisely predict the liquefaction characteristics and displacements due to dynamic loading. First, the model was calibrated with the ejected Pohang sand in loose and dense states under vertical effective stress of 100 and 200 kPa, respectively. Then, a two-dimensional effective stress analysis using the UBCSAND2 model was performed to investigate damages that occurred at the quay wall of Youngil-man port during the Pohang earthquake (Mw = 5.4) on 15 November 2017. The settlement and horizontal displacement at the top of the quay wall and ground settlement of reclaimed area from the numerical results were compared to the field observations after the Pohang earthquake.

2. Methodology

2.1. UBCSAND2 Constitutive Model

Byrne and co-workers [3,18,19] developed a simple constitutive model called UBCSAND to analyze soil liquefaction problems. The UBCSAND stress–strain model modifies the Mohr–Coulomb model to capture the plastic strains that occur at all stages of loading. Based on that, the UBCSAND2 model has been continuously developed by Park [8,20] to better model the observed behavior of sand and to account for the effects of principal stress rotation (PSR) or initial horizontal stress states K0 (= σxx/σyy), and plastic unloading. The formulation of the model is briefly summarized below.
In the UBCSAND2 model, the fluid (including air and water) in the pores of the sand is the constraint in the skeleton if drainage is restricted. This leads to the generation of pore pressure or liquefaction. Upon providing input parameters of the soil skeleton, drainage conditions, and bulk modulus of the pore fluid (Bf), the seismic behavior of sand can be predicted [3,8]. Thus, UBCSAND2 is considered to be a fully coupled effective stress analysis.

2.1.1. Elastic Response

The elastic response is assumed to be isotropic and composed from shear modulus Ge and bulk modulus Be. It is also a function of mean effective stress as follows:
B e = k B e · P a · ( σ m P a ) n e
G e = k G e · P a · ( σ m P a ) m e
where keB and keG are the elastic bulk and shear modulus number, respectively. ne and me are the stress exponent for Be and Ge (approximately 0.5 for both), respectively. Pa is the atmospheric pressure (approximately 100 kPa). σ′m is the mean effective stress.

2.1.2. Yield Surface

UBCSAND2 model is formulated in the framework of classical elasto-plasticity, in which yield locus comprises the two-mobilized plane: (i) maximum shear stress plane and (ii) horizontal plane in the stress space of shear stress τ and effective normal stress σ′ as shown in Figure 1. The failure state line is the yield locus with the highest stress ratio that corresponds with the Mohr–Coulomb failure line (represented by a slope of sin ϕf). The line with slope of sin ϕcv is the yield locus with a stress ratio that corresponds to the phase transformation from failure state to residual state of sand (represented by a slope of sin ϕcv). Yield loci for both planes fi are specified in the same way as follows:
f i = t i σ m · s i n ϕ m i
where i indicates the maximum shear plane (i = 1) or the horizontal plane (i = 2), ti is the shear stress acting on each mobilized plane (i.e., t1 = τ = (σxσy)/2, t2 = τxy), σ′m is the mean effective stress (i.e., (σx + σy)/2), and ϕmi is the friction angle mobilized on each plane.
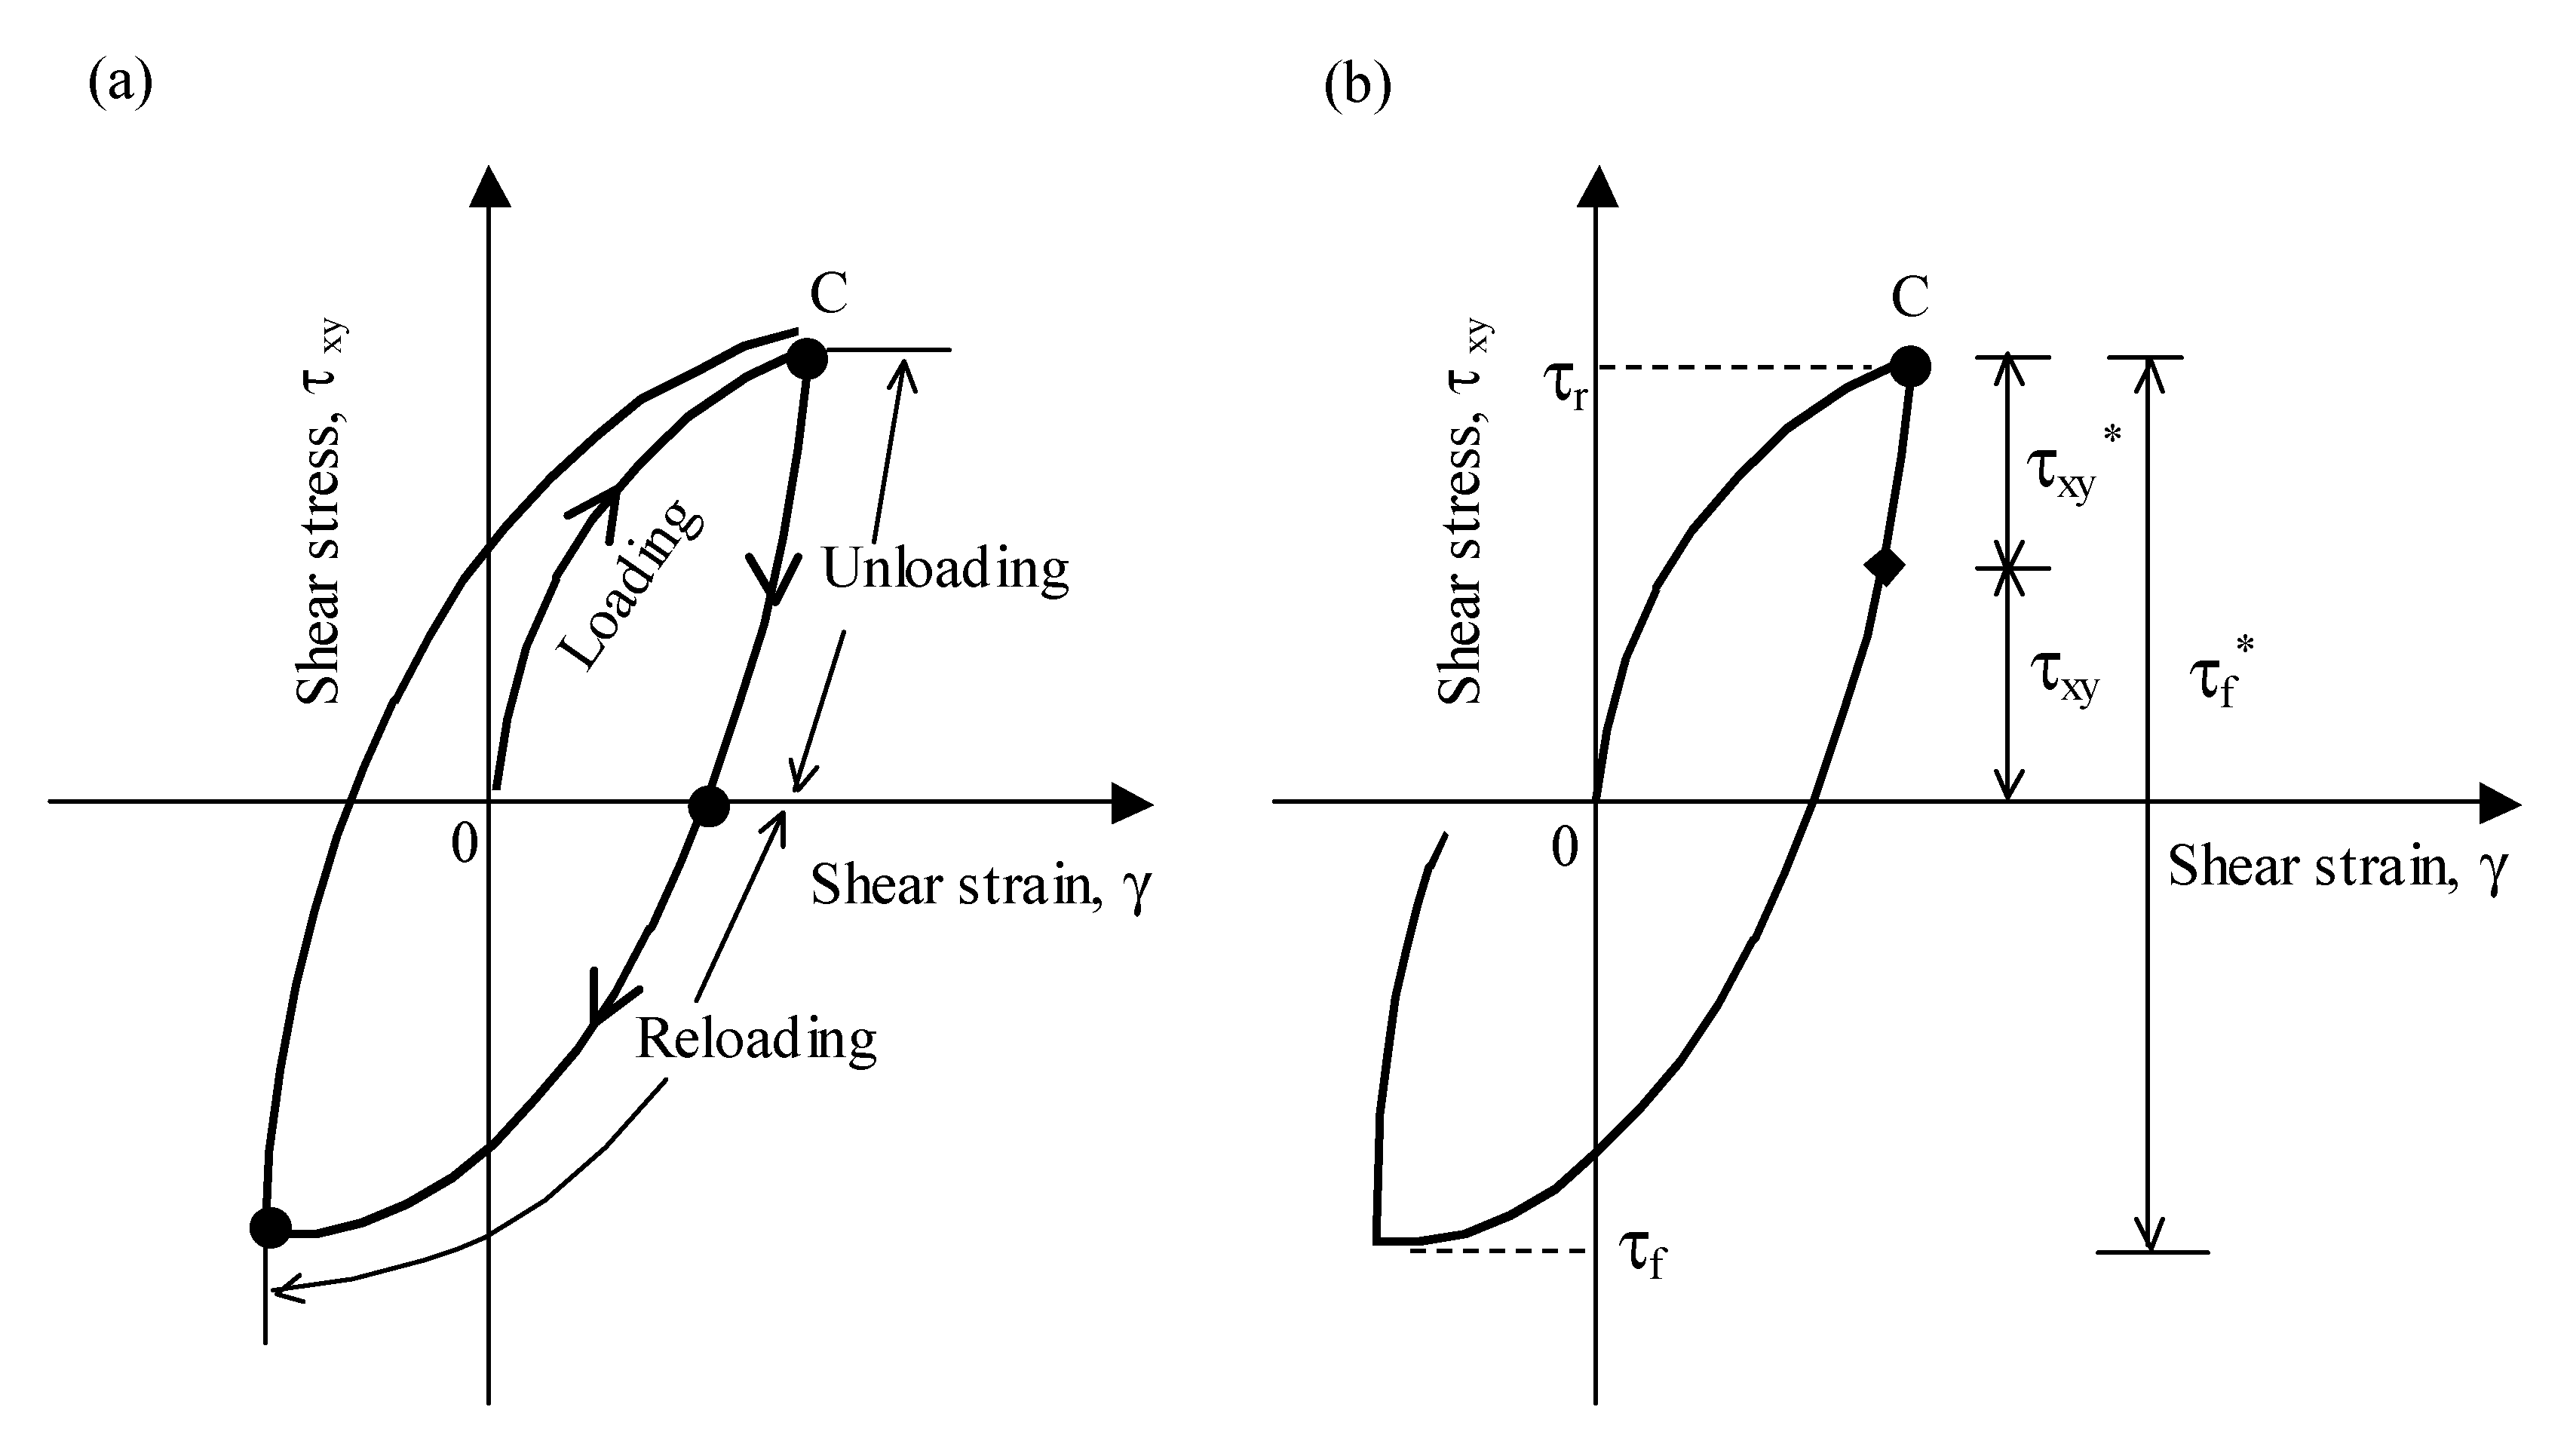
In the UBCSAND2 model, both maximum shear stress and horizontal plane work at the same time for loading when only the horizontal plane is triggered upon unloading. Therefore, the modification of shear stress ratio is essential to account for the contribution of each plane to the plastic deformation as shown in Figure 2. First, the initial yield locus is located at the stress reversal point C as shown Figure 2 and the yield locus enters into unloading phase until the shear stress changes signs, or reversal occurs. At this time, the mobilized shear stress and shear stress at failure are modified to calculate the plastic shear modulus. (i.e., τ *xy = τrτxy for unloading and τ *xy = τr + τxy for reloading and τ *f = τr + τf, where τr is the shear stress at failure).
The stress ratio on each mobilized plane ηi is expressed as follows:
η i = t i σ m = s i n ϕ m i

2.1.3. Hardening and Flow Rule on Maximum Shear Stress Plane

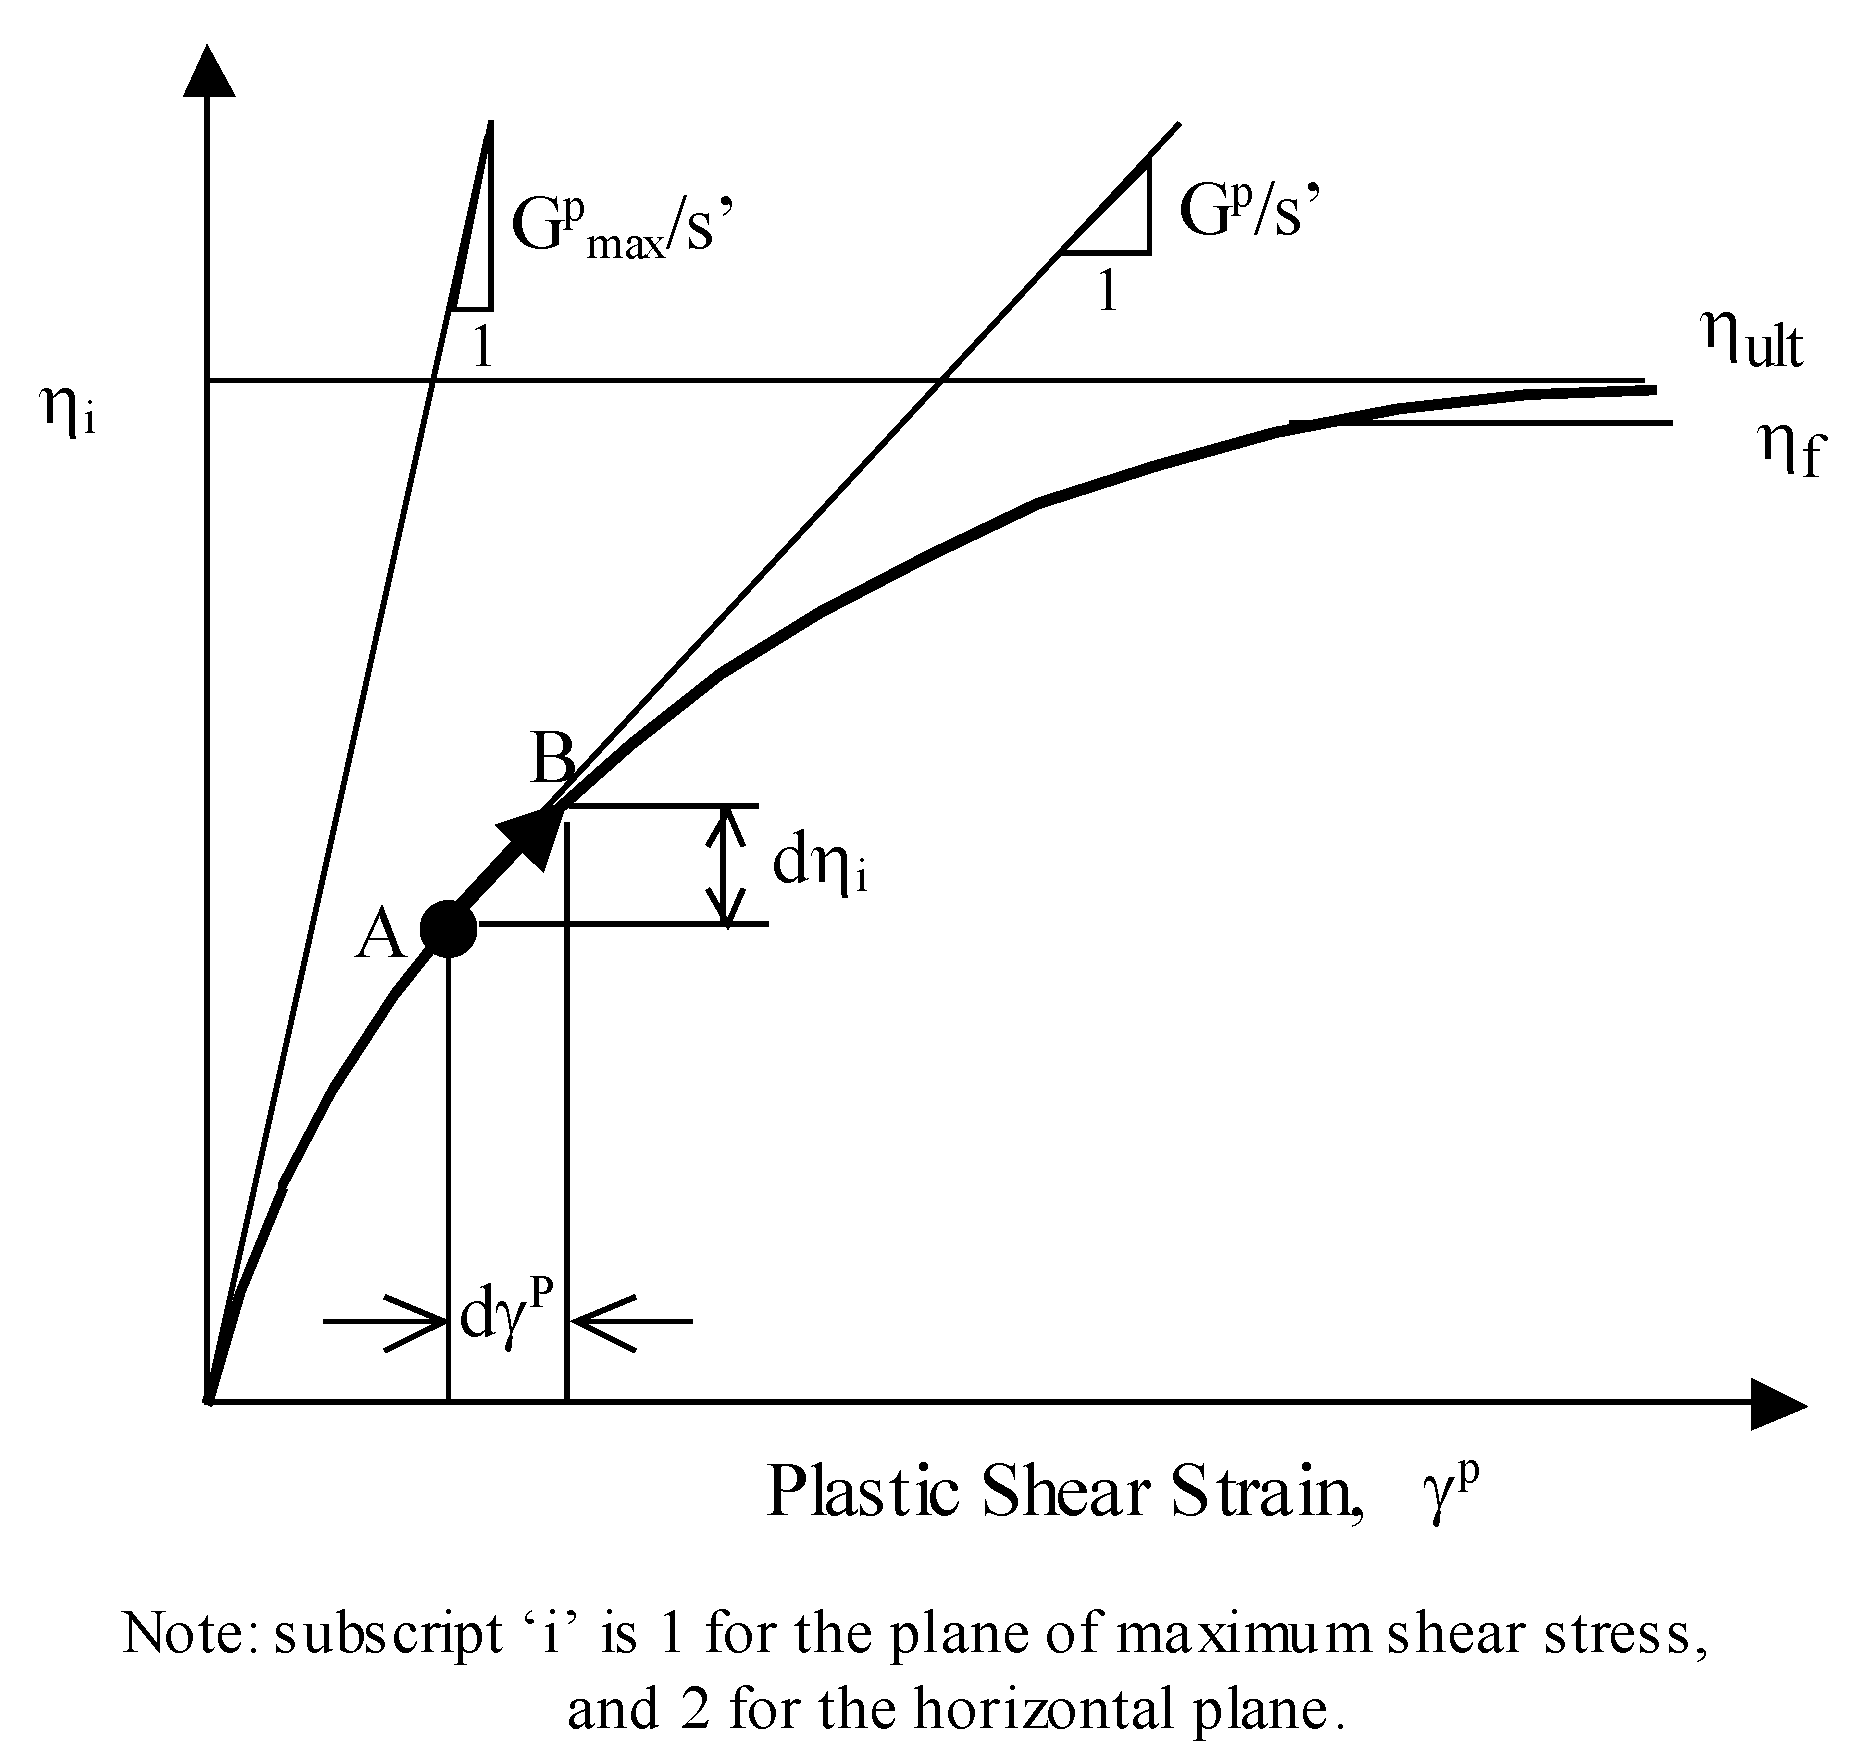
When the yield locus moves from A to B in Figure 1, it induces a plastic shear strain increment dγp1 related to the shear stress ratio η1. It is assumed that the relationship of stress ratio η1 and plastic strain γp1 is a hyperbolic curve, which is controlled by plastic shear modulus Gp1 as shown in Figure 3. This correlation can be expressed as follows:
d γ 1 p = 1 G 1 p / σ m d η 1
where dγp1 is the plastic shear strain increment, Gp1 is the plastic shear modulus, dη1 is the stress ratio increment.
Gp1 is the plastic shear modulus and given by
G 1 p = G m a x p · ( 1 η 1 η f R f ) 2
where η1 is the stress ratio at failure (= sin ϕf), Rf is the failure ratio for the hyperbolic relationship (= ηf/ηult). Rf varies from 0.6 to 1.0 and decreases with increasing relative density. Gpmax is the plastic modulus at η = 0 and can be expressed as follows:
G m a x p = k G p · P a · ( σ m P a ) n p
where kpG is the plastic shear modulus number. np is the stress exponent for Gpmax (approximately 0.4).
Herein, the position of the yield locus dϕm1 can be calculated as follows:
d ϕ m 1 = ( G 1 p σ m ) d γ 1 p
The flow rule acting on maximum shear stress plane, which is obtained from the well-known Rowe stress-dilatancy theory [21], is given as follows:
d ε v 1 p | d γ 1 p | = sin ψ 1 = ( η 1 sin ϕ c v )
where dεv1p is the plastic volumetric strain increment, ϕcv is the friction angle at constant volume, η1 is the current stress ratio, and ψ1 is the dilatancy angle.

2.1.4. Hardening Rule and Flow Rule on the Horizontal Plane

For loading phase, the hardening rule and flow rule are similar for both maximum shear stress and horizontal planes. The only difference is the stress ratio η.
Upon loading, plastic deformation is controlled by conditions on the horizontal plane, in which consistence condition of its yield surface is derived from Equation (3) as follows:
d f 2 = t 2 σ m · s i n ϕ m 2 G 2 p · d γ 2 p = 0
The plastic shear modulus Gp2 of the horizontal plane for unloading phase is expressed as follows:
G 2 p = G m a x p · ( 1 η 2 * η f * R f ) 2 = G m a x p · ( 1 τ x y * τ f * R f ) 2
where η * and ηf * are modified stress ratios based on modified shear stresses τ *xy and τ *f as shown in Figure 2.

2.1.5. Hardening of Stress-Dilatancy

In order to account for reducing volumetric strains with number of cycles (volumetric hardening), it is necessary to either change the stress-dilatancy equation (e.g., state-dependent dilatancy) or stiffen the plastic shear modulus. Hence, the stress-dilatancy relationship in Equation (9) is modified by the multiplication to a cyclic hardener as the following expression:
d ε v i p | d γ i p | = sin ψ m i · H c
H c = exp ( C h ε v i p γ )
C h = 8.33 ( D r ) 2 5.0 D r + 2.2292
where Ch is a cyclic hardening parameter that varies with relative density. From experimental data of Silver and Seed [22] on crystal silica sand, and Sriskandakumar [23] on Fraser river sand, the value of Ch can be expressed as in Equation (14). Additionally, γ is the current shear strain.

2.2. UBCSAND2 Calibration for Undrained CDSS Tests on Pohang Sand

After the Pohang earthquake, many sand boils occurred in the paddy fields near the epicenter. The ejected sands from these sand boils were collected and tested by a series of undrained CDSS tests [24]. These results were used to calibrate the element response of the UBCSAND2 model. The samples were reconstituted with an air-pluviation method into loose (Dr = 40%) and dense (Dr = 80%) states under vertical effective stresses of 100 and 200 kPa, respectively. Symmetrical and non-symmetrical loading (i.e., α = τsta/σy0 = 0, and α > 0) were applied in the CDSS tests to investigate the effects of initial shear stress on the cyclic resistance of sand.
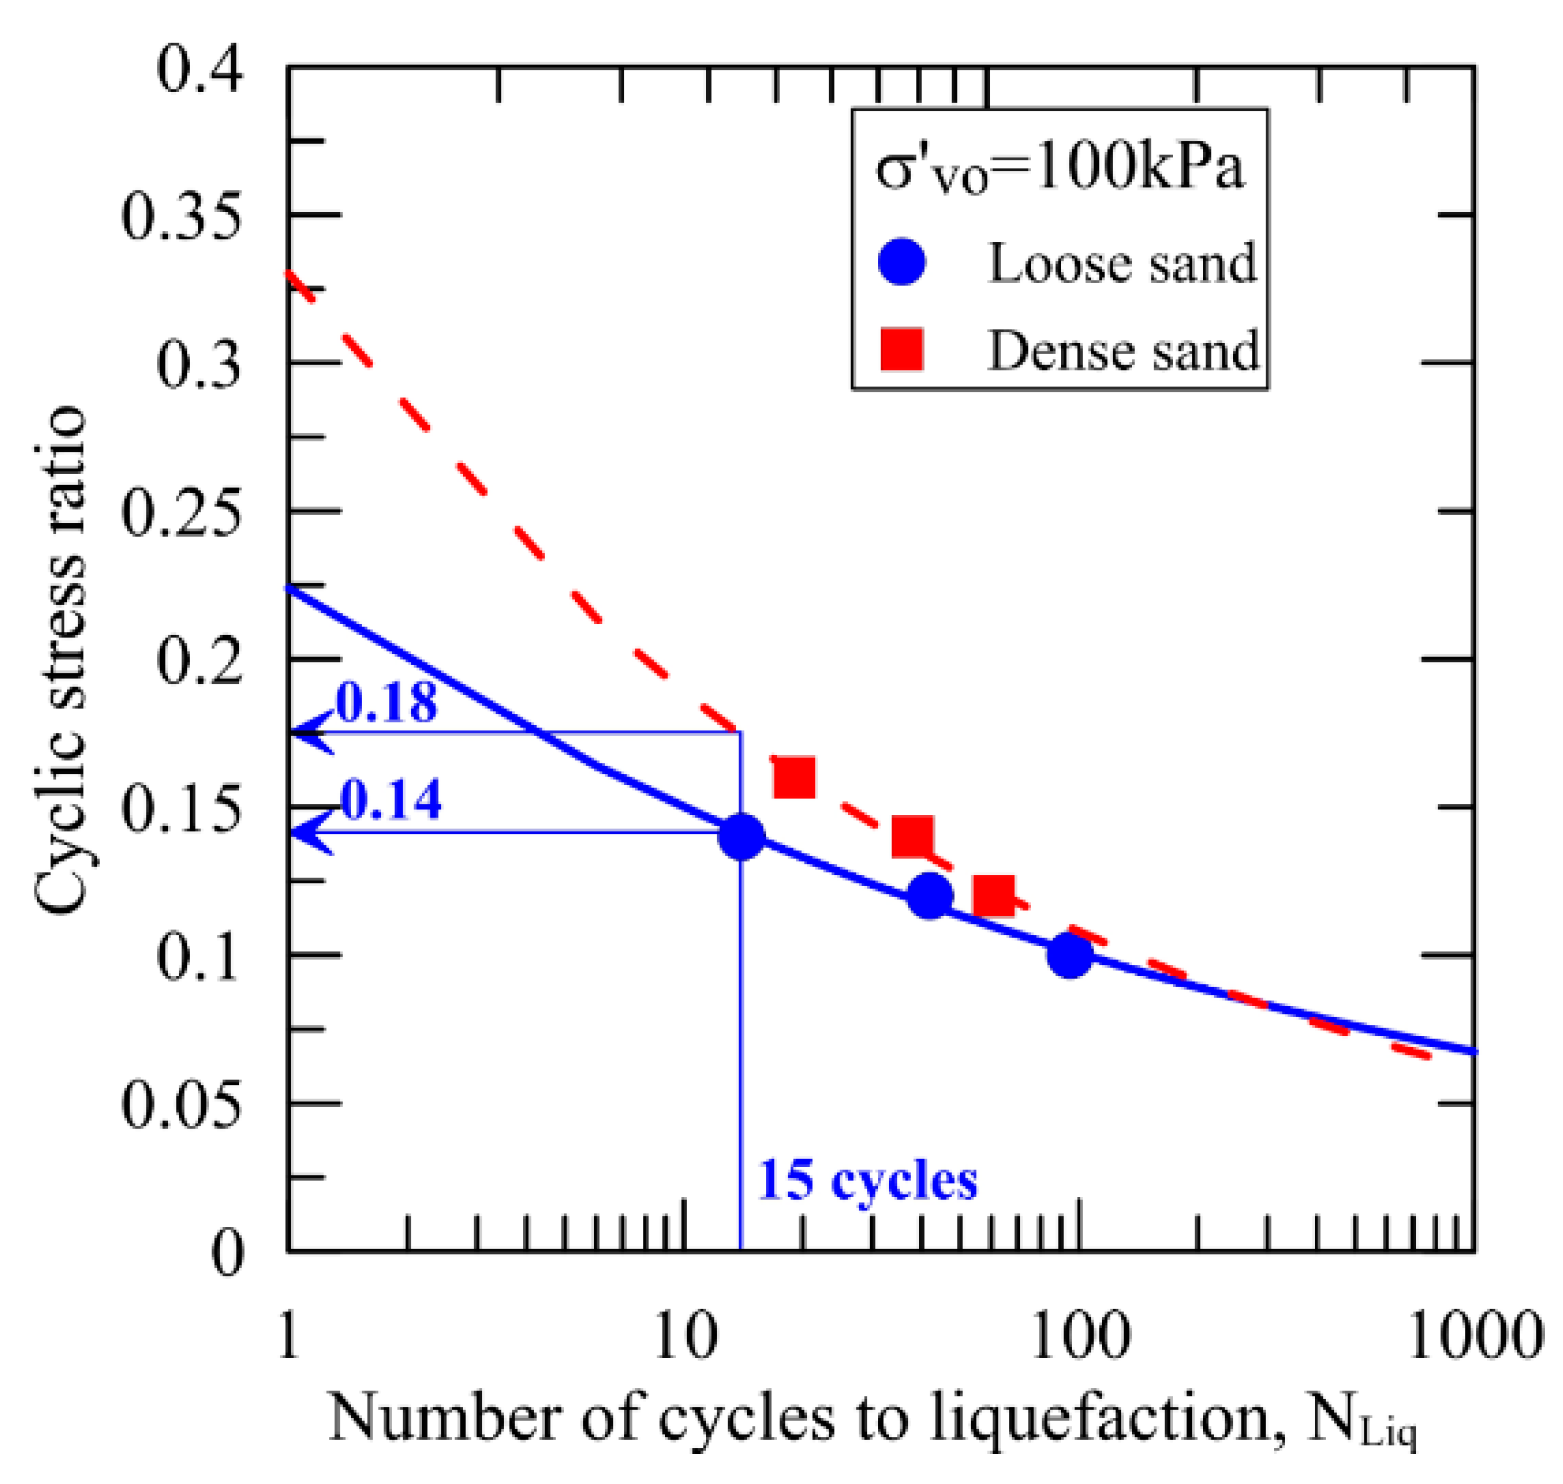
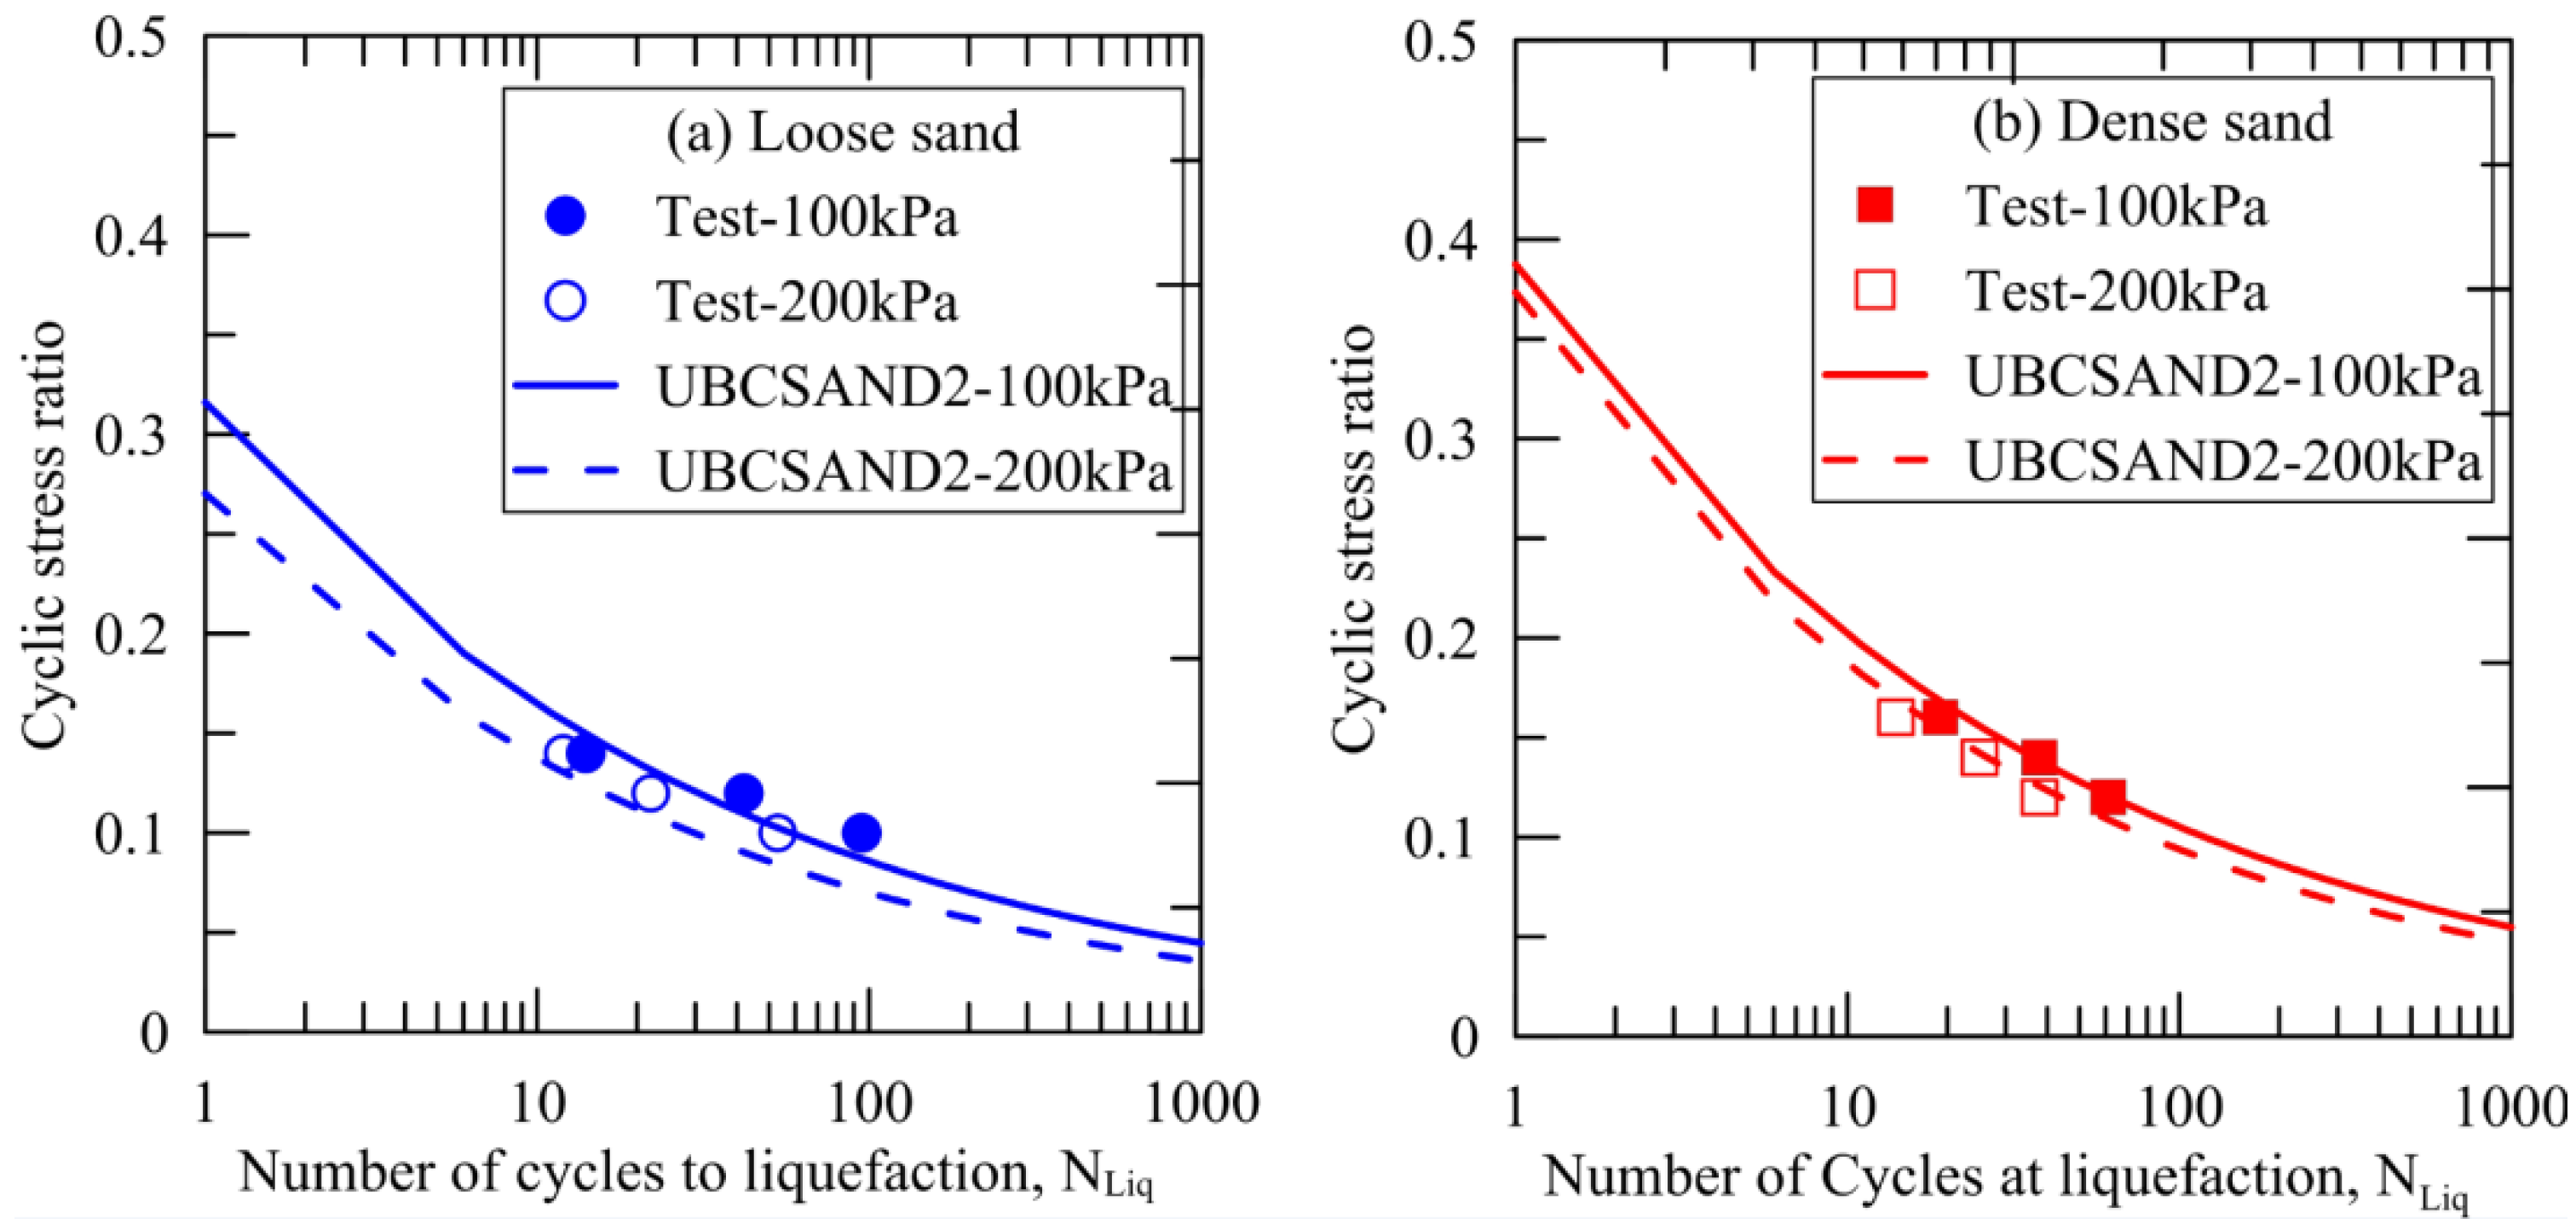
Figure 4 shows the experimental results for the relationship of cyclic stress ratio (CSR) and number of cycles to liquefaction (Nliq) of Pohang sand in both loose and dense states under a vertical effective stress (σv0) of 100 kPa. At Nliq = 15, if the relative density of sand increased from 40% to 80%, then the resistance of liquefaction increased by approximately 28.6% (from 0.14 to 0.18). Based on the SPT base clean-sand curve from a workshop of the National Center for Earthquake Research (NCEER) summarized by Youd et al. [25], the corrected SPT values N1(60) of 12.5 and 16.5 were inferred from a CSR of 0.14 and 0.18 at σv0 = 100 kPa, respectively.
From Figure 4, two corrected SPT blow counts N1(60) = 12.5 for loose sand and N1(60) = 16.5 for dense sand were used to calibrate the UBCSAND2 model. The generic input parameters of the UBCSAND2 model are the same as those that were used in the commercial version v.904aR [3], which is shown in Table 1. We note that the UBCSAND2 model has an additional input parameter corresponding to the cyclic hardening parameter Ch, which is a function of relative density Dr based on the experiment results of Fraser river sand. A detailed description of this parameter was previously presented. The calibration parameters were calculated identically to the generic parameters for both loose and dense sand, to match the laboratory data. It is interesting that providing only corrected SPT blow counts N1(60) as the input parameters of UBCSAND2, and the bulk modulus of water, a predictive model of liquefaction can be achieved.
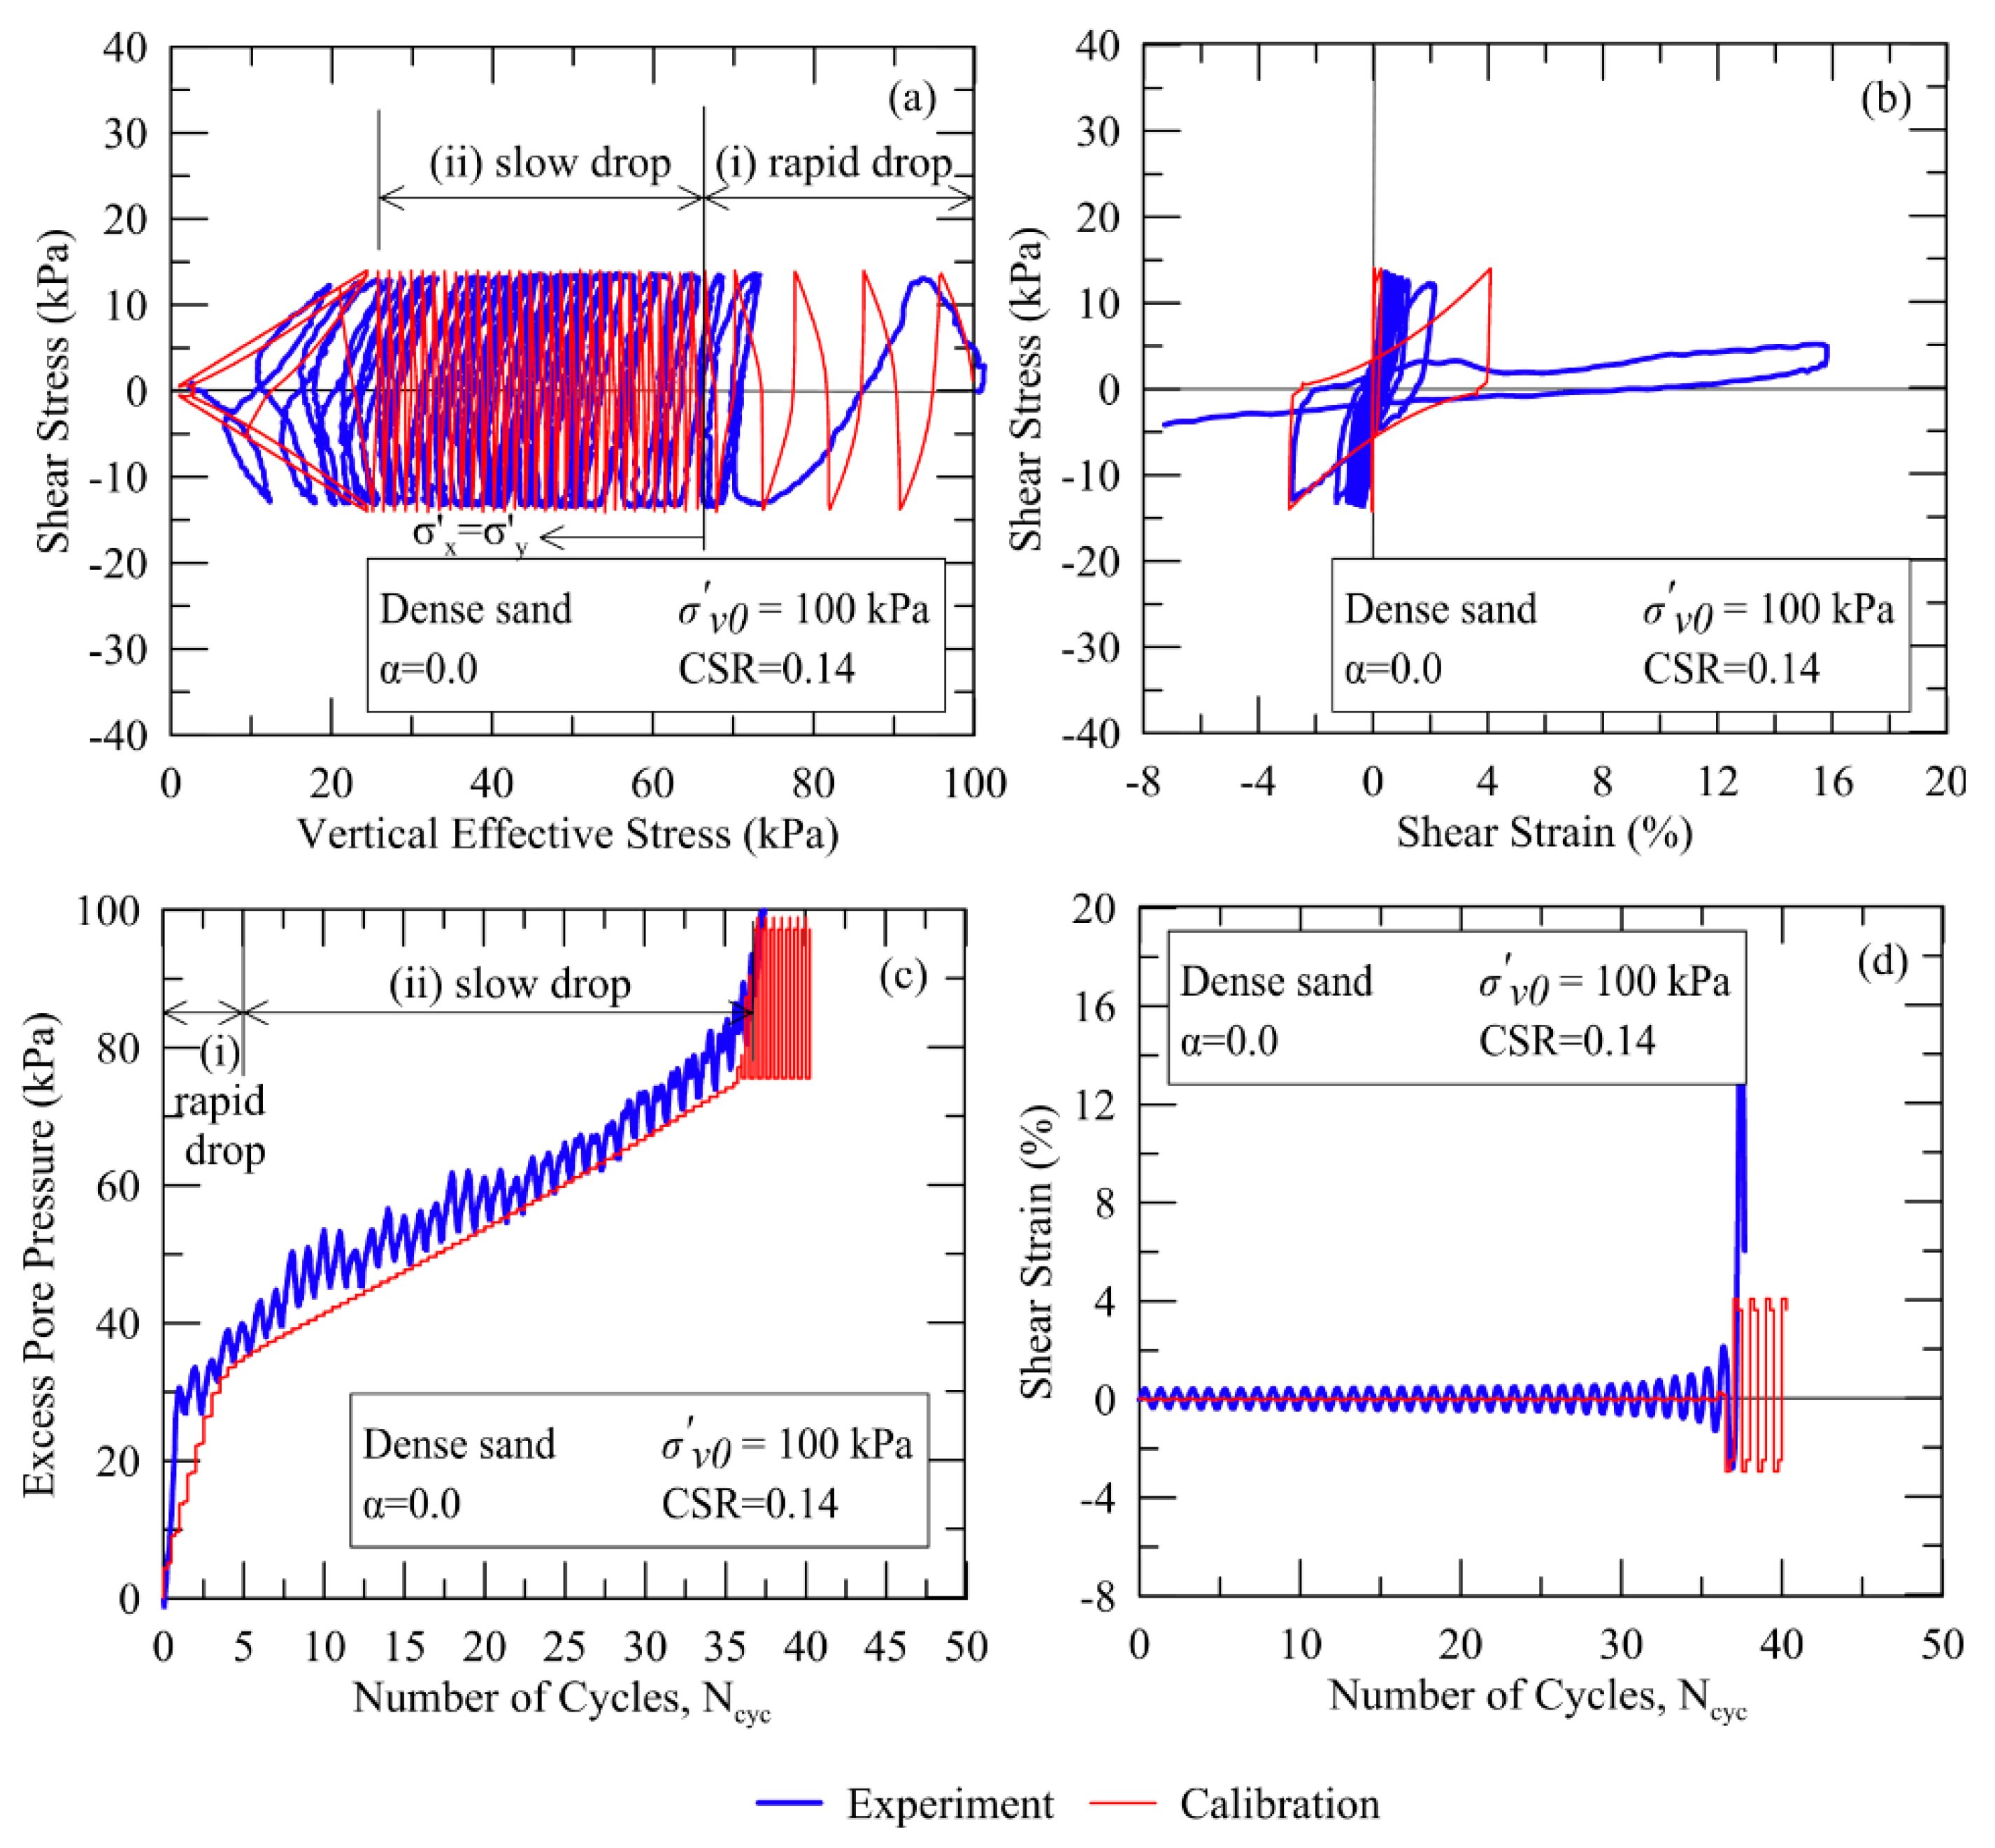
Figure 5 and Figure 6 show the comparison results between the laboratory tests and the calibrated UBCSAND2 model for loose and dense Pohang sand with σv0 = 100 kPa, CSR = 0.14, and α = 0 (i.e., without initial static shear stress), respectively. The predictions are generally in good agreement with the measurements in terms of effective stress path (i.e., vertical effective stress versus shear stress), shear stress–strain curve, pore water pressure generation, and shear strain versus number of cycles. In the effective stress path, there are two distinct phases: (i) rapid effective drop for the initial three cycles of loose sand and five cycles of dense sand, and (ii) slow effective stress drop for 10 cycles of loose sand and 32 cycles of dense sand. This leads to a rapid rise in pore pressure of up to 35–45% the initial vertical effective stress during three cycles and five cycles for loose and dense sand, respectively. Herein, the effect of PSR is accounted for in the model, in which both the maximum shear stress plane and horizontal plane participate in the generation of plastic shear strains. This effect gradually reduces as the direction of the principal stress rotates, and it vanishes when σx = σy (i.e., at three cycles for loose sand and four cycles for dense sand). In other words, during phase (i), the two planes work together due to PSR, and then only the maximum plane works in phase (ii) for the remaining cycles because no more PSR occurs.
The typical comparisons between the undrained CDSS test results and calibrated UBCSAND2 model considering the initial static shear stress bias (i.e., α = τsta/σy0 > 0) are shown in Figure 7 and Figure 8. The level of the initial static shear stress ratio α is defined as the ratio of the driving initial static shear stress, τsta, to the initial vertical effective stress, σy0 (i.e., α = τsta/σy0). This kind of effect is varied in the soil elements beneath the slope. The predictions generally give a reasonable representation for stress reversal patterns, including an accumulating pattern of shear strain.
Figure 9 compares the CSRNliq curves from the CDSS tests and UBCSAND2-calibrated results for Pohang sand in loose and dense states with σv0 = 100 and 200 kPa, respectively. There is a good agreement between the trend line from the UBCSAND2-clibrated results and CDSS test results. The effect of confining stress on CSR is also shown, in which the increase of the vertical effective stress from 100 to 200 kPa results in the decrease of CSR for both density states of Pohang sand. However, this effect is more significant in loose sand compared to that in dense sand.
From the calibration results for the undrained CDSS tests on Pohang sand, the generic input parameters of the UBCSAND2 model depicted in Table 1 are used to numerically assess the liquefaction from the Pohang earthquake in the next section.

2.3. Assessment of Pohang Earthquake-Induced Liquefaction at Youngil-Man Port Using the UBCSAND2 Model

2.3.1. Study Area and Ground Motion of the Pohang Earthquake

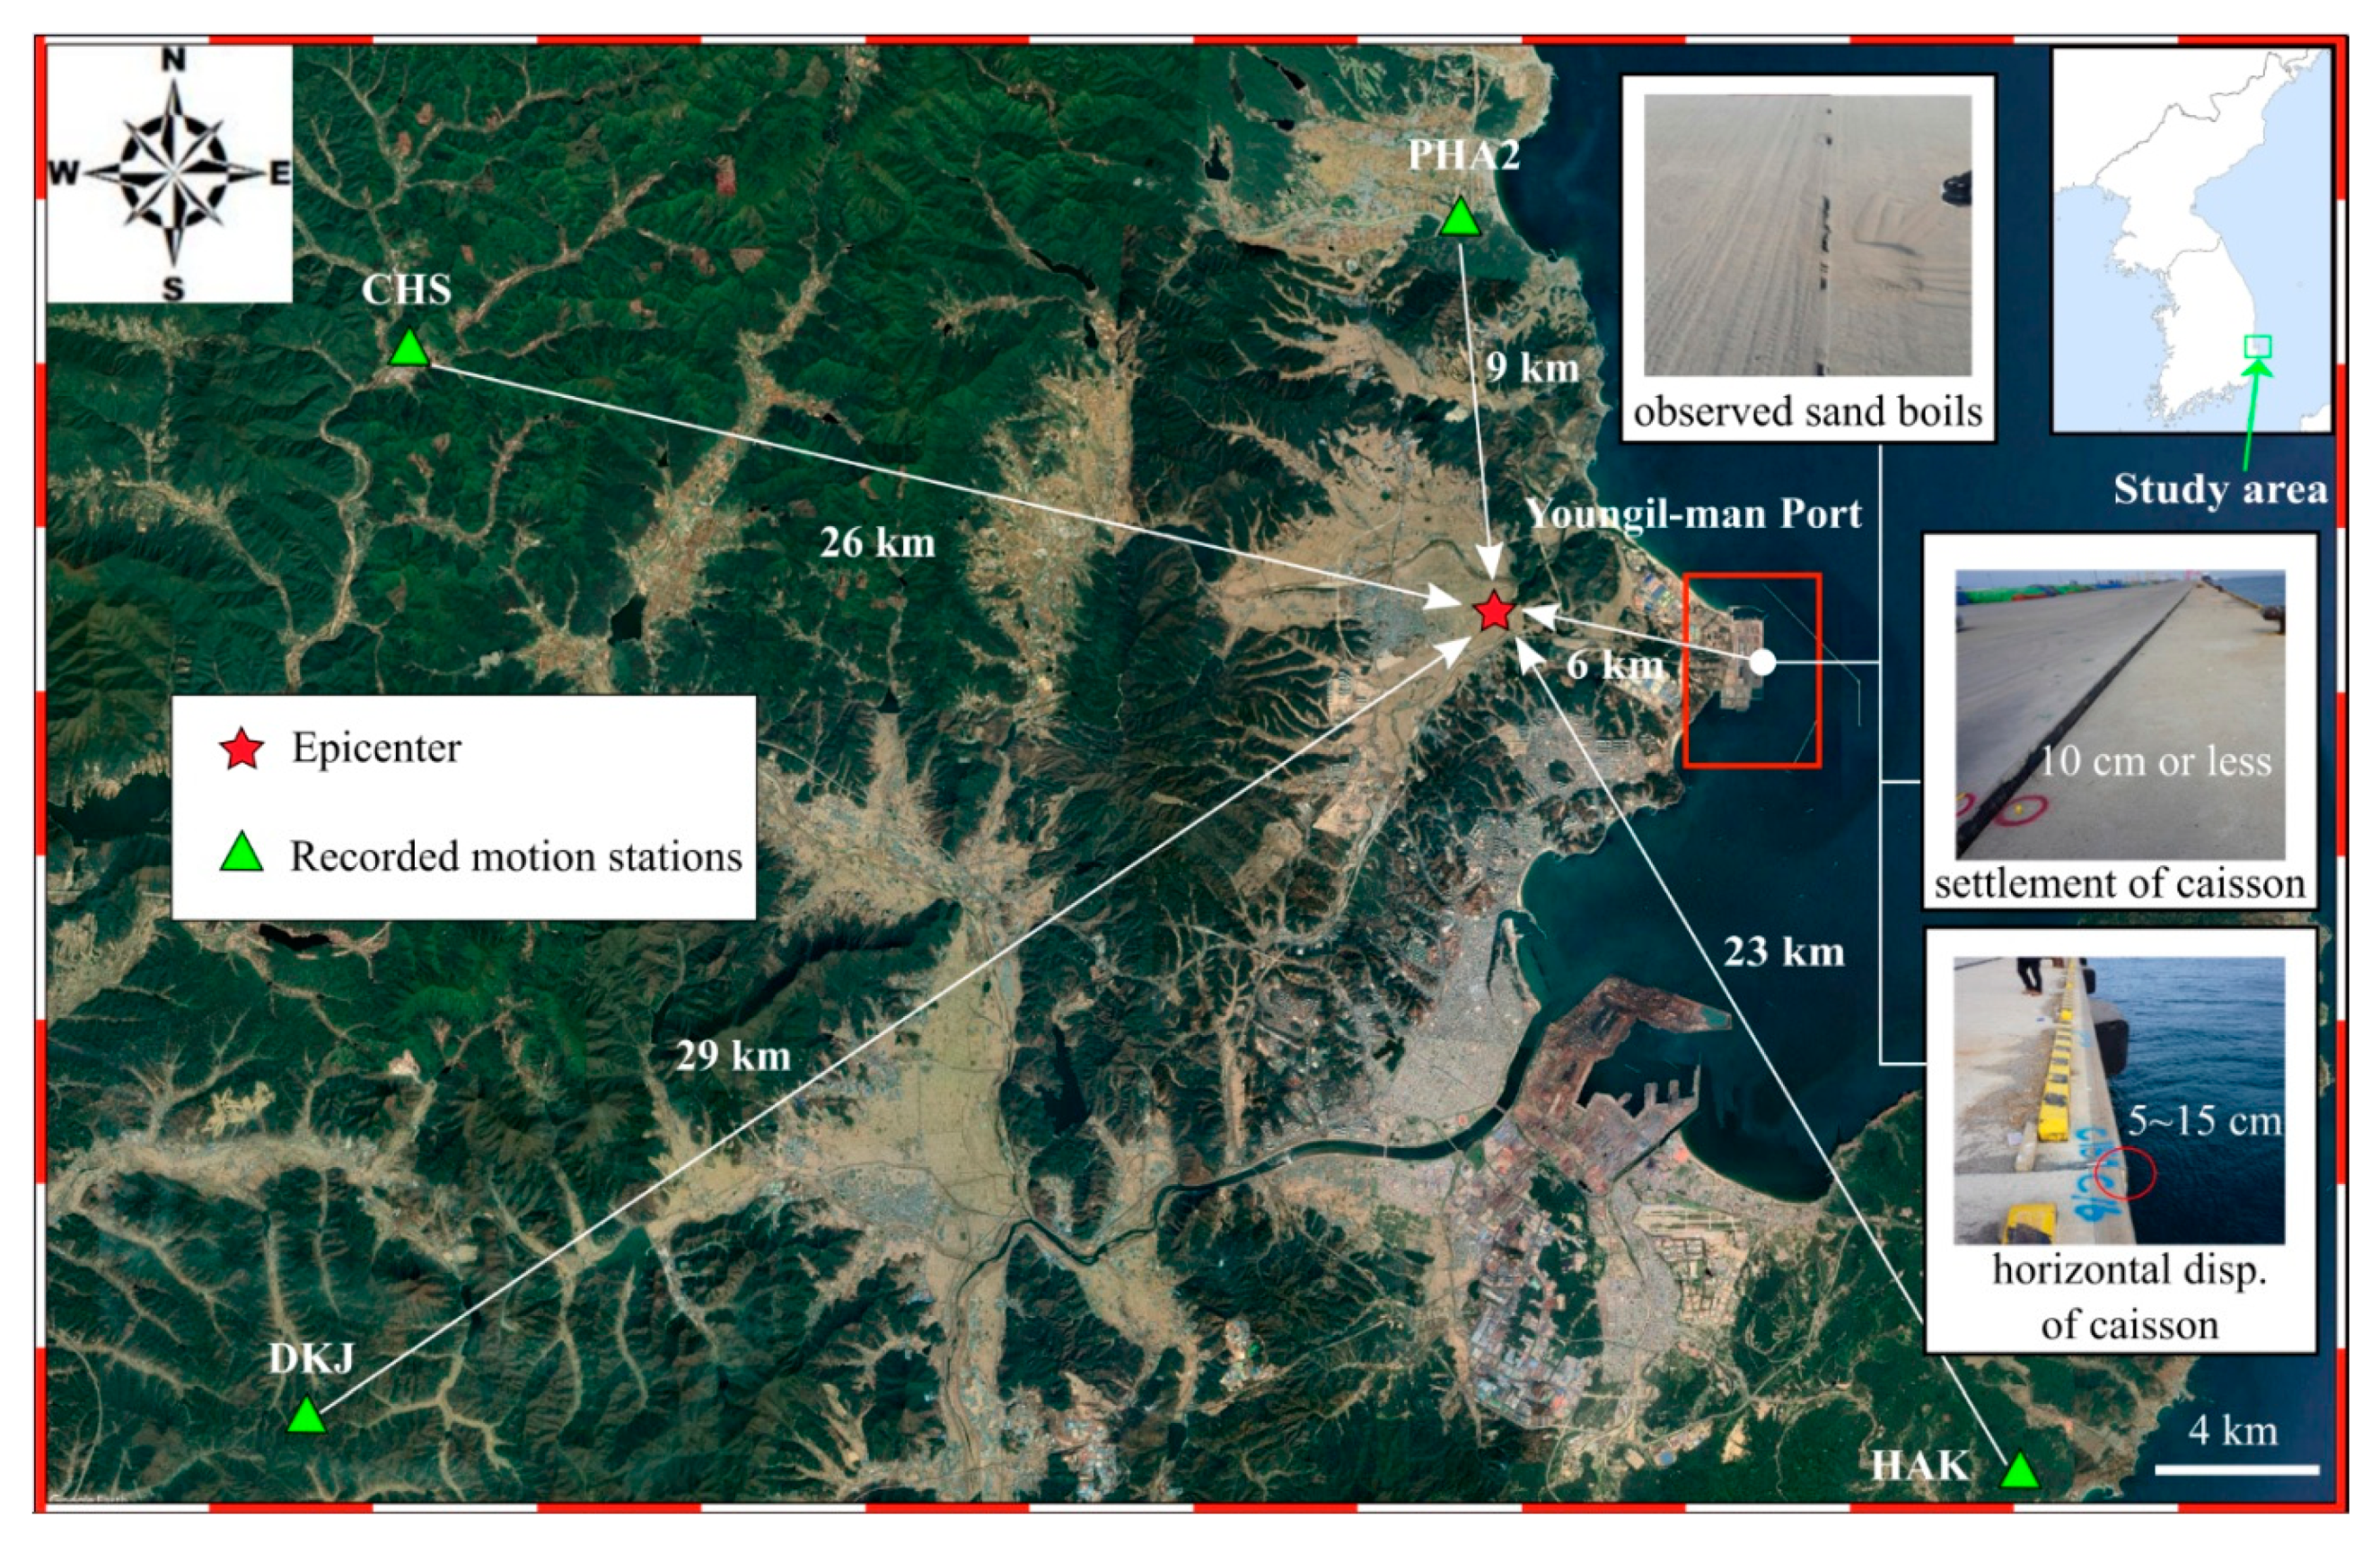
The Pohang earthquake occurred on 15 November 2017, causing damage to the caisson-type quay wall structures and reclaimed area at the Youngil-man port, which is located about 6 km from the epicenter, as shown in Figure 10. After the earthquake, Kim et al. [11] conducted a field study and indicated that the settlement of reclaimed area was approximately 10–20 cm, the caisson horizontal displacement was in a range of 5–15 cm, and the caisson settlement was less than 10 cm. Additionally, many sand boils could be found in this area, as shown in Figure 10.
During the Pohang earthquake, ground motions were recorded at four stations—PHA2, CHS, DKJ, and HAK—with distances from the epicenter of 9, 26, 29, and 23 km, respectively, as shown in Figure 10. The seismic motions were obtained from the National Earthquake Comprehensive Information Center [26]. Table 2 summarizes the information from the four selected stations: peak ground acceleration (PGA)—north–south (NS), east–west (EW), and up–down (UD)—locations, distances from epicenter, and soil classifications. The site condition in Pohang is classified as SB based on the Korea Building Code [27]. This means that an average shear wave velocity for the ground of up to a depth of 30 m (i.e., Vs30) is 760–1500 m/s. We note that the horizontal peak accelerations in the EW and UD directions were significantly lower than those recorded in the NS direction for all of stations. Furthermore, the peak accelerations decreased remarkably when the stations’ distances from the epicenter increased.
From Figure 10, the observed site (i.e., Youngil-man port) locates nearly 6 km from the epicenter, which is closer than all the recording stations. However, there is no seismic instruments available in this area because they are only installed in the rock formation that is visible on the surface (i.e., outcrop). If near-field effects are considered, the ground motions should be modified based on distances from the epicenter to the selected station, and the observed site. This kind of modification requires a modern and complex model based on fault rupture surfaces, geometries, and energy radiation distributions. For example, the Southern California Earthquake Center Broadband Platform (SCEC-BPP) was successfully used to address the near-field effects of the 1971 San Fernando earthquake-induced damages in Lower and Upper San Fernando dams [28,29]. For the Pohang earthquake, neither reliable research nor available data have been performed to study the near-field effects to the recorded PGAs. Therefore, this study applied a simple method to scale the PGAs from the available data provided by the National Earthquake Comprehensive Information Center [26]. A relationship between recorded PGAs and distances from the epicenter of different recording stations was established in Figure 11. Based on the logarithm curve, the PGA of 0.350 g at Youngil-man port was obtained. Then, the acceleration-time history recorded at PHA2 station was scaled up to 0.35 g and it is considered as the target earthquake given as outcrop motion at the observed site.
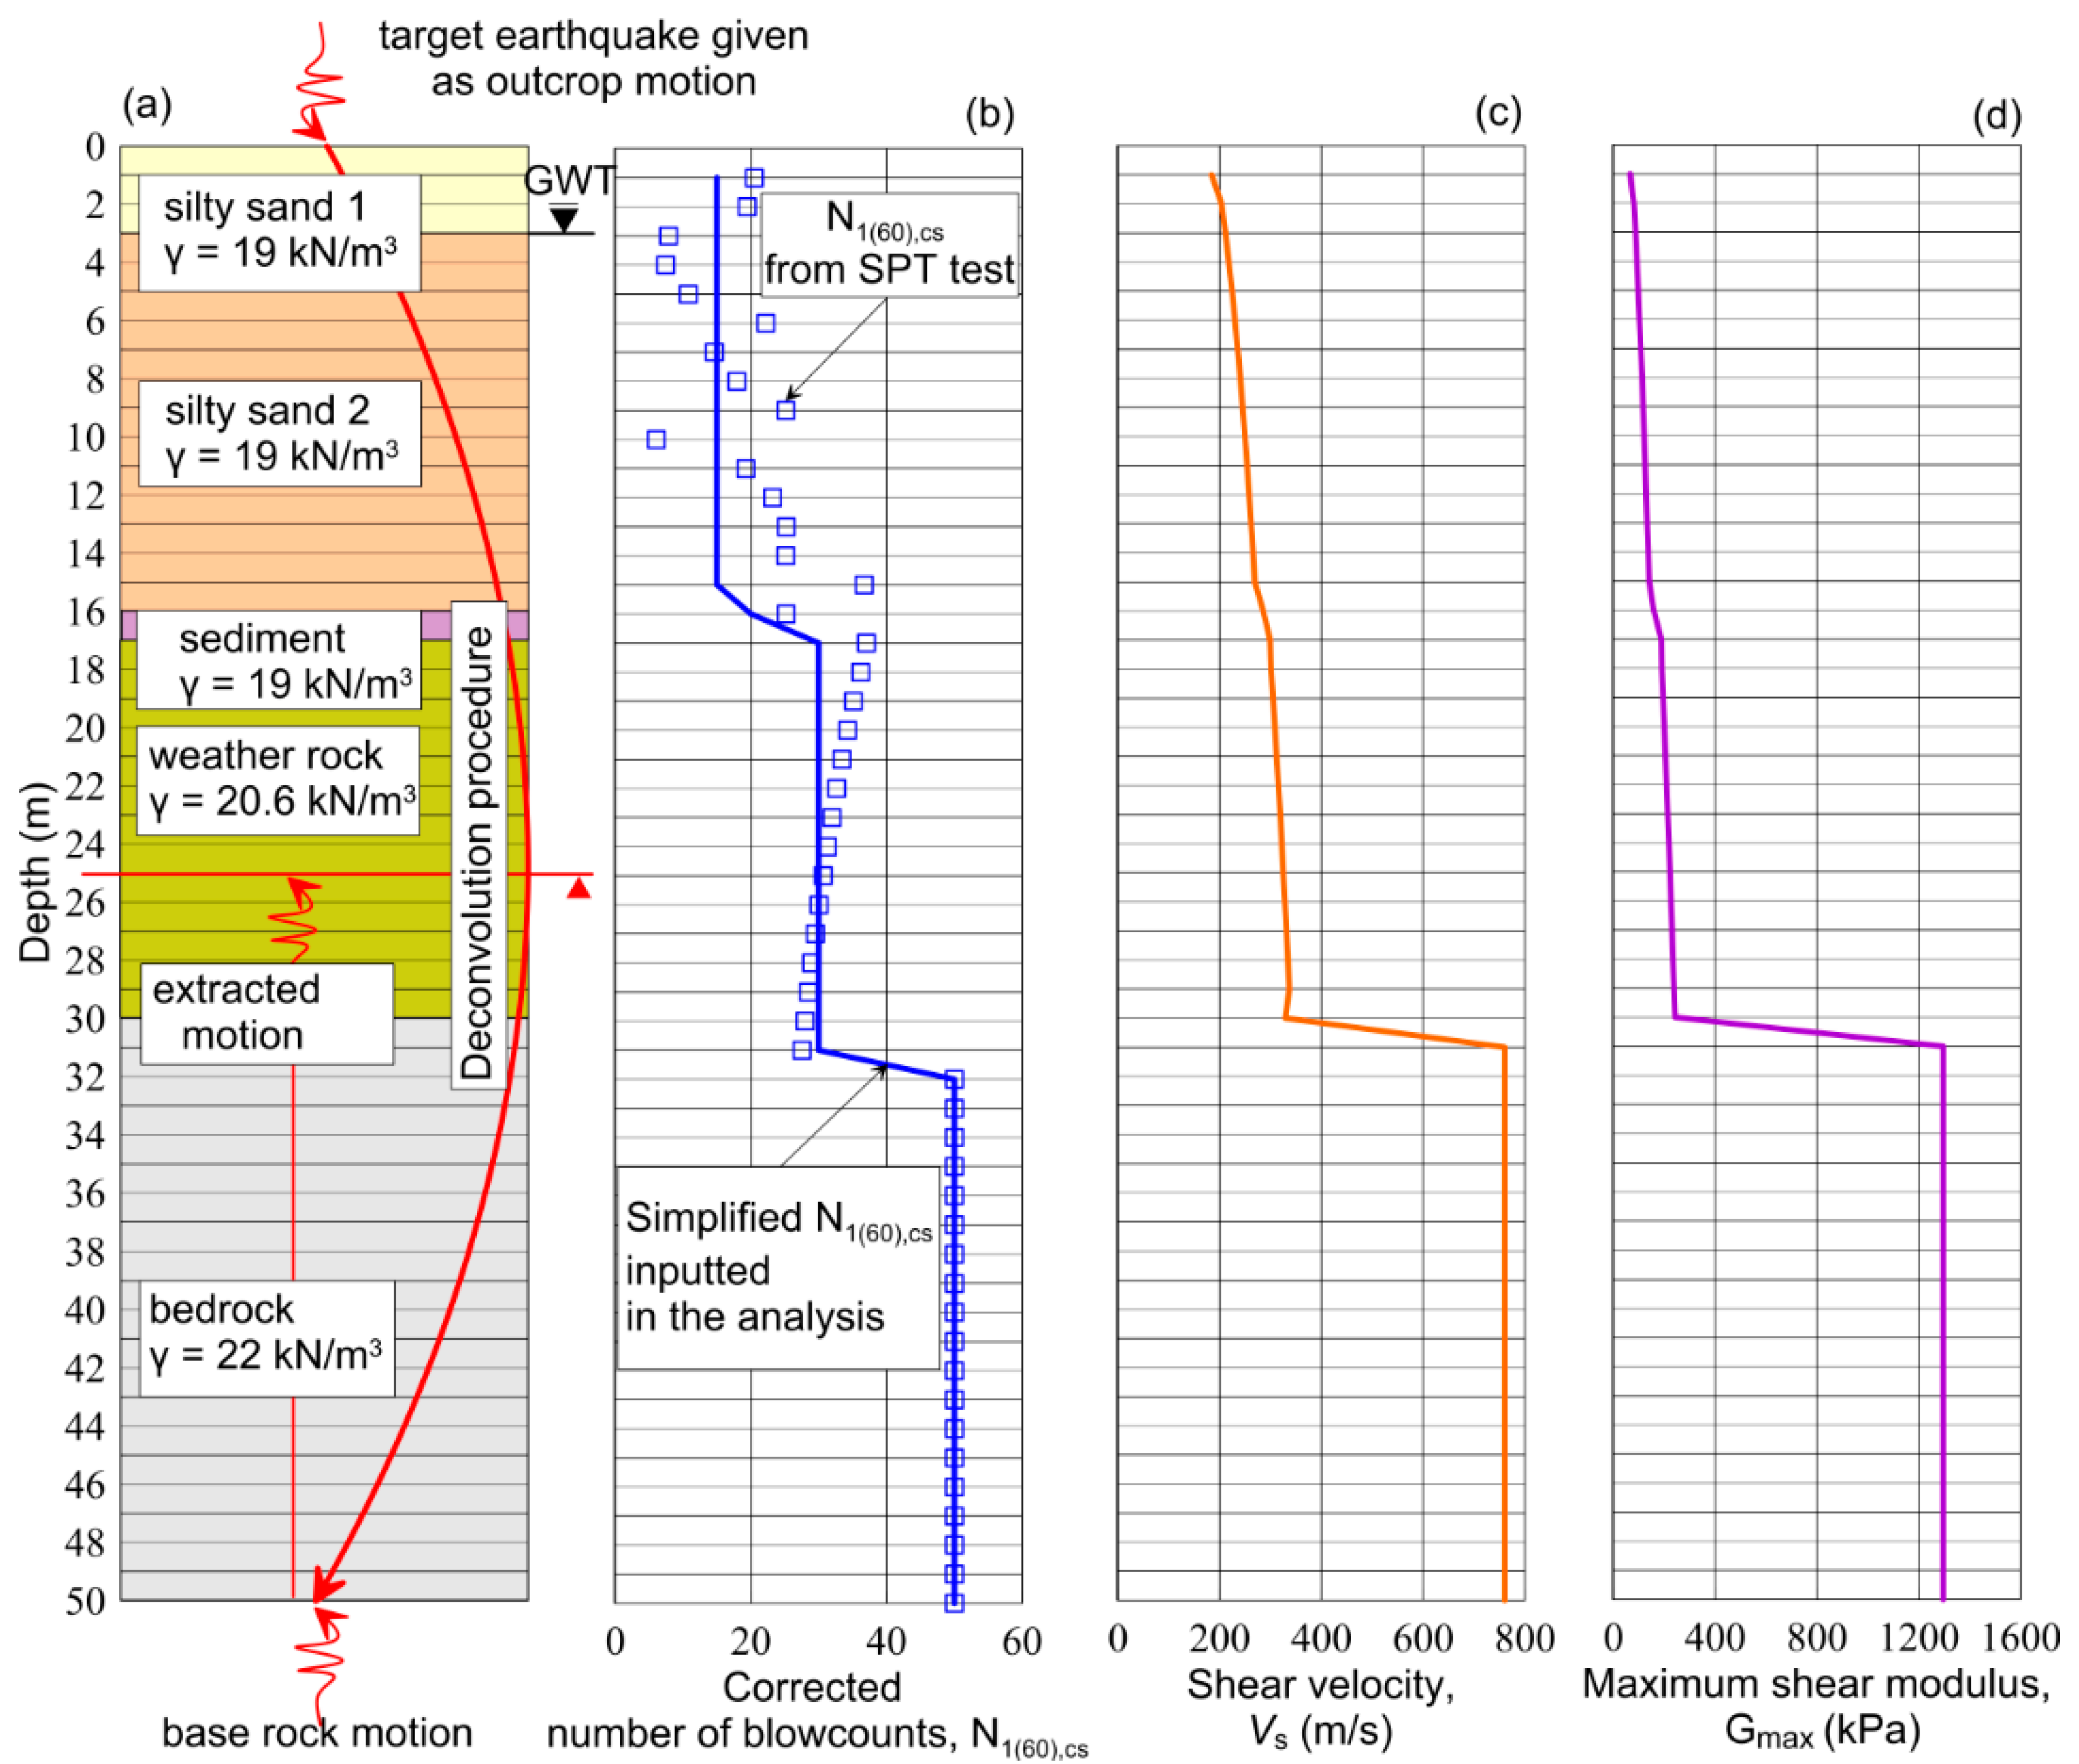
For FLAC analyses [30], the seismic input must be applied at the base of the model while the target earthquake at Youngil-man port is the outcrop motion. The appropriate input motion at depth can be computed through a deconvolution analysis using the one-dimensional (1-D) wave propagation code such as the equivalent-linear program PROSHAKE [31] as shown in Figure 12. A typical soil profile at the observed site up to 50 m of depth is presented in Figure 12a, in which the data is obtained from Kim et al. [11] and Lee et al. [12]. Under a depth of 30 m, the bedrock is primarily distributed up to 500 m of depth as the report of Lee et al. [32] and Kang et al. [9]. Additionally, the corrected N1(60),cs is calculated from the data provided by the Integrated DB Center of National Geotechnical Information [33]. To simply the input parameters for both PROSHAKE and FLAC analysis (i.e., N1(60),cs), Kim et al. [11] and Lee et al. [12] calculated the corresponding N1(60),cs values of sandy soil layers by the experimental works of Mun [34] and Park et al. [35] in relation to the liquefied soils due to the Pohang earthquake. The calculation procedure for the N1(60),cs value was based on a method proposed by Mortia et al. [36] and Iai et al. [37]. The sediment and weather rock layer are assumed as N1(60),cs = 20 and N1(60),cs = 30, respectively. Although the bedrock is very hard for the SPT test, it can be assumed as N1(60),cs = 50 for the equivalent-linear analysis. From Figure 12b, there is a reasonable agreement between the corrected N1(60),cs from SPT test and the simplification. Based on the simplified N1(60),cs, the maximum shear modulus Gmax can be determined by the empirical function proposed by Seed et al. [38] as in Equations (15) and (16). If shear modulus Gmax and unit weight γ are inputted, shear wave velocity Vs would be automatically calculated by PROSHAKE software. It can be seen that Vs is varied in the ranges 180–270 m/s for silty sand, 285 m/s for sediment, 300–330 m/s for weather rock, and 760 m/s for bedrock layer.
G m a x = 21 , 7 · K 2 m a x · P a · ( σ m / P a ) 0.5
K 2 m a x = 20 · N 1 ( 60 ) , C S 0.333
where Gmax is maximum shear modulus, K2max is shear modulus number, Pa is atmospheric pressure (≈100 kPa), σ′m is mean effective stress, N1(60),cs is corrected SPT number of blow counts.
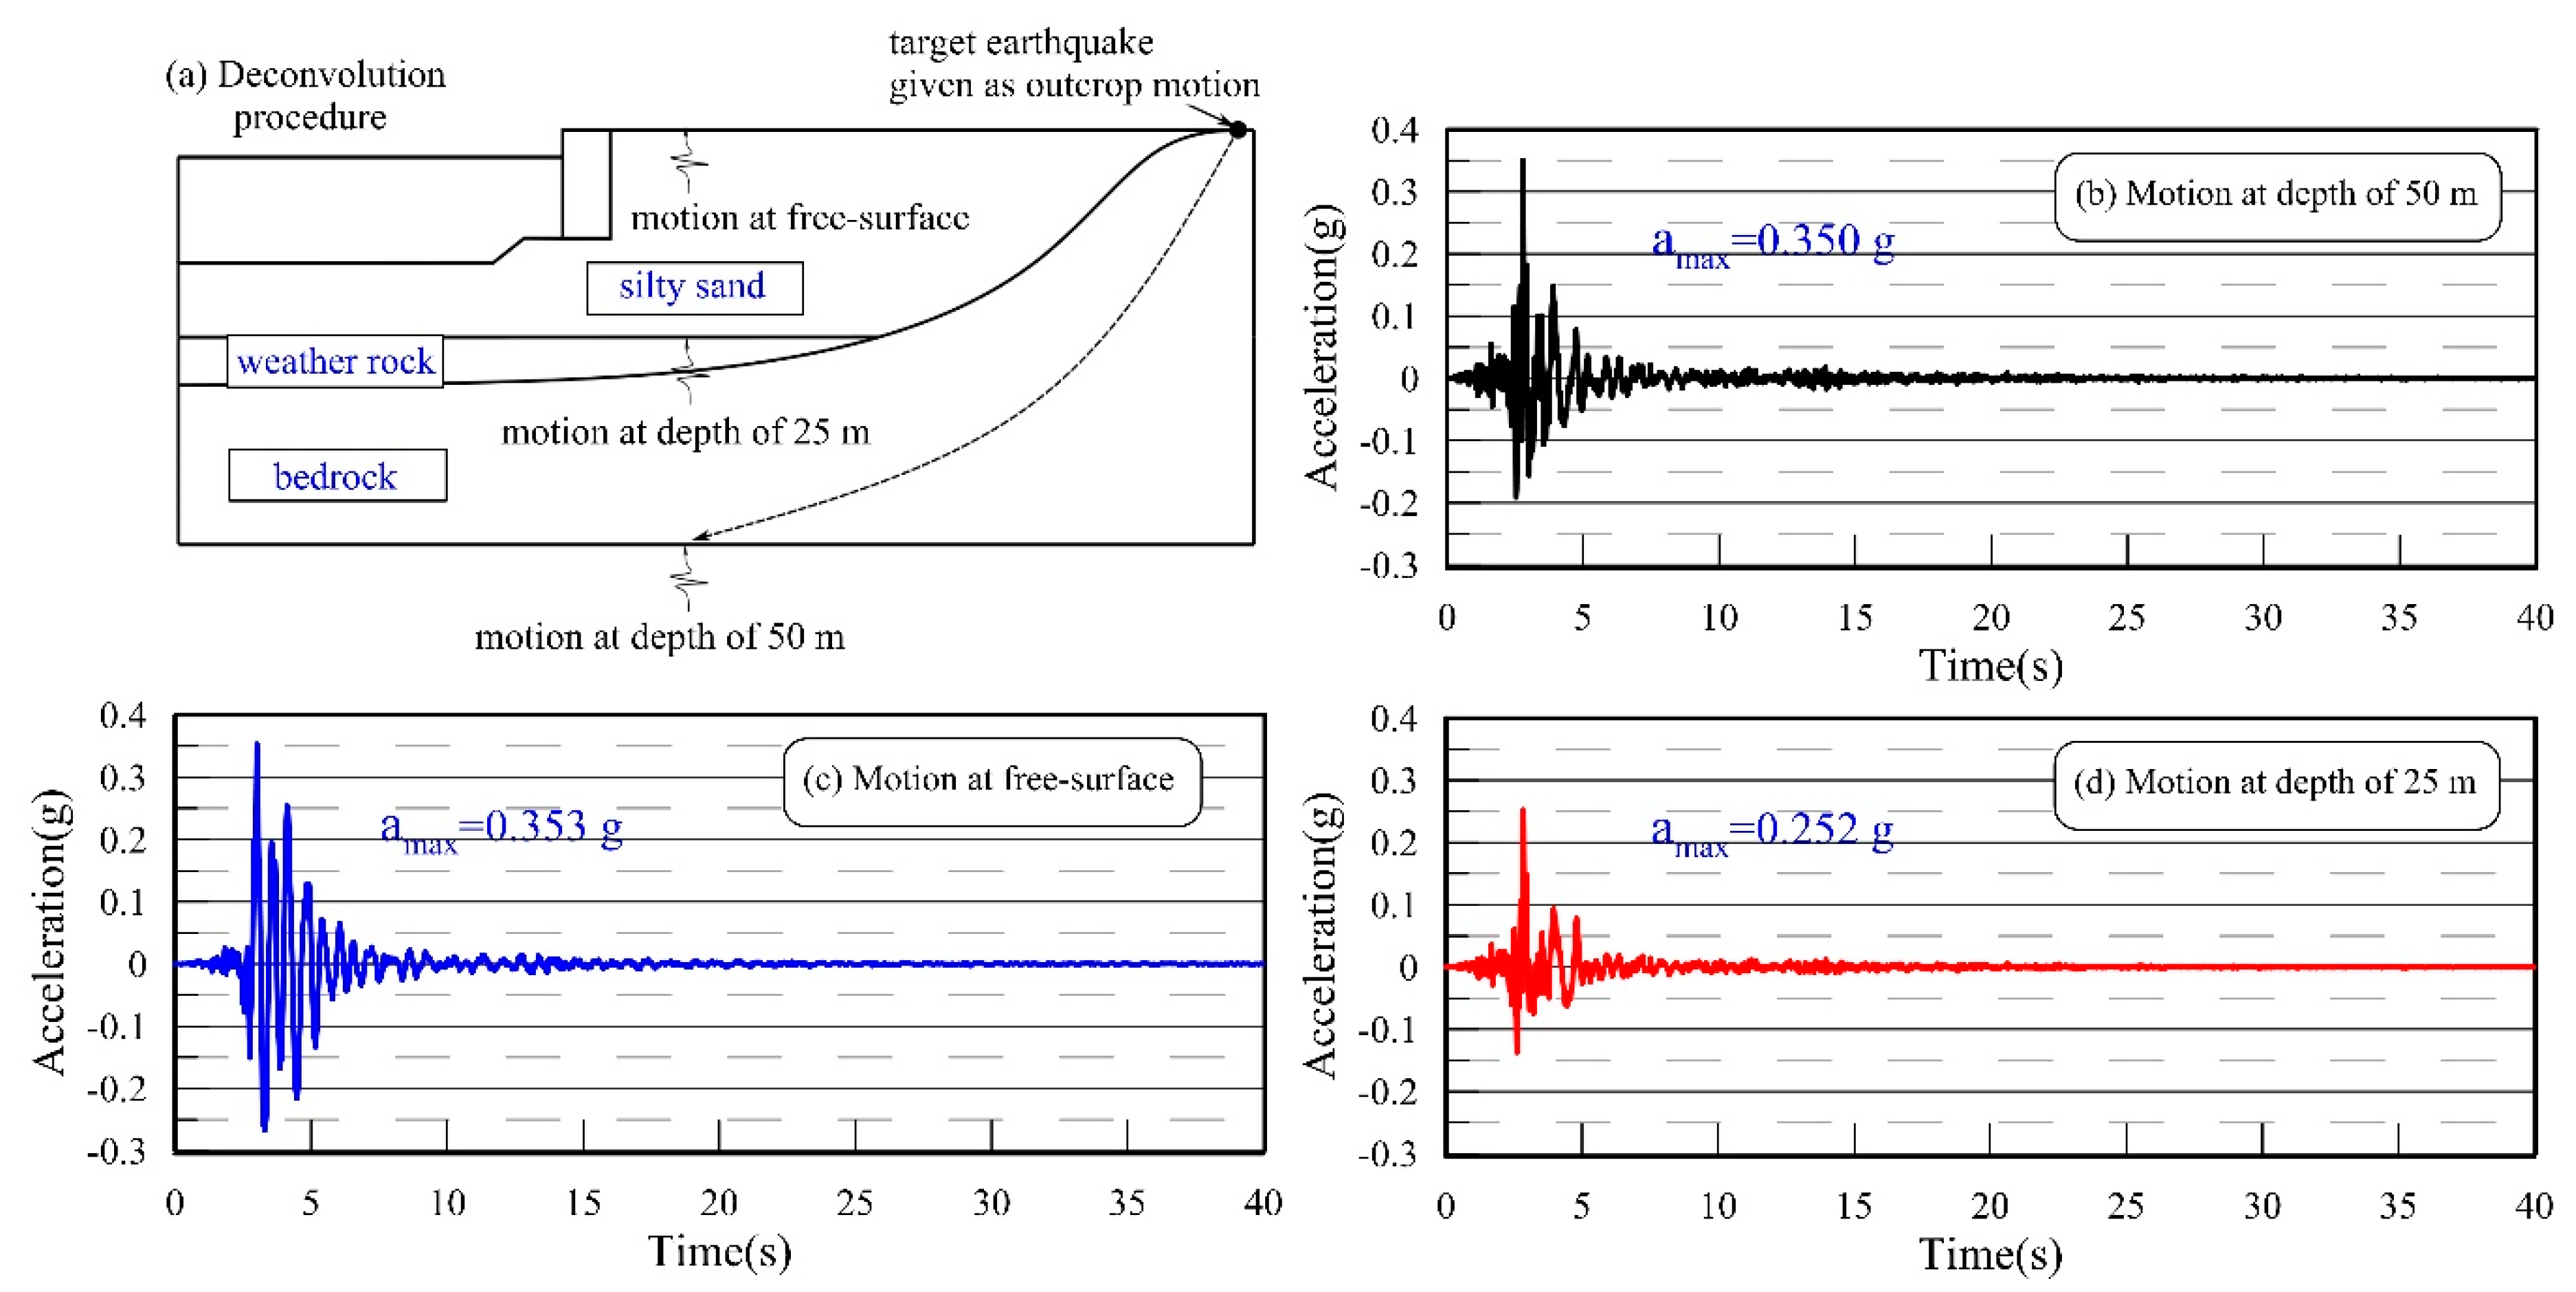
Figure 13 presents the numerical results obtained from the 1-D equivalent-linear analysis in PROSHAKE. By the application of deconvolution procedure as shown in Figure 13a, the outcrop motion at surface is inputted at the base at a depth of 50 m. Then, the wave propagation would be generated to the above layers depending on their properties. Three ground motions at the depth of 50 m, 25 m, and free-surface are extracted for the comparison as shown in Figure 13b–d. Although the PGA at the free-surface is nearly the same as PGA at the base, however, there is a significantly higher acceleration pulse at the ground surface. At the depth of 25 m, the maximum acceleration is approximately 0.252 g, in which the seismic energy applied at the base reduced almost 30%.
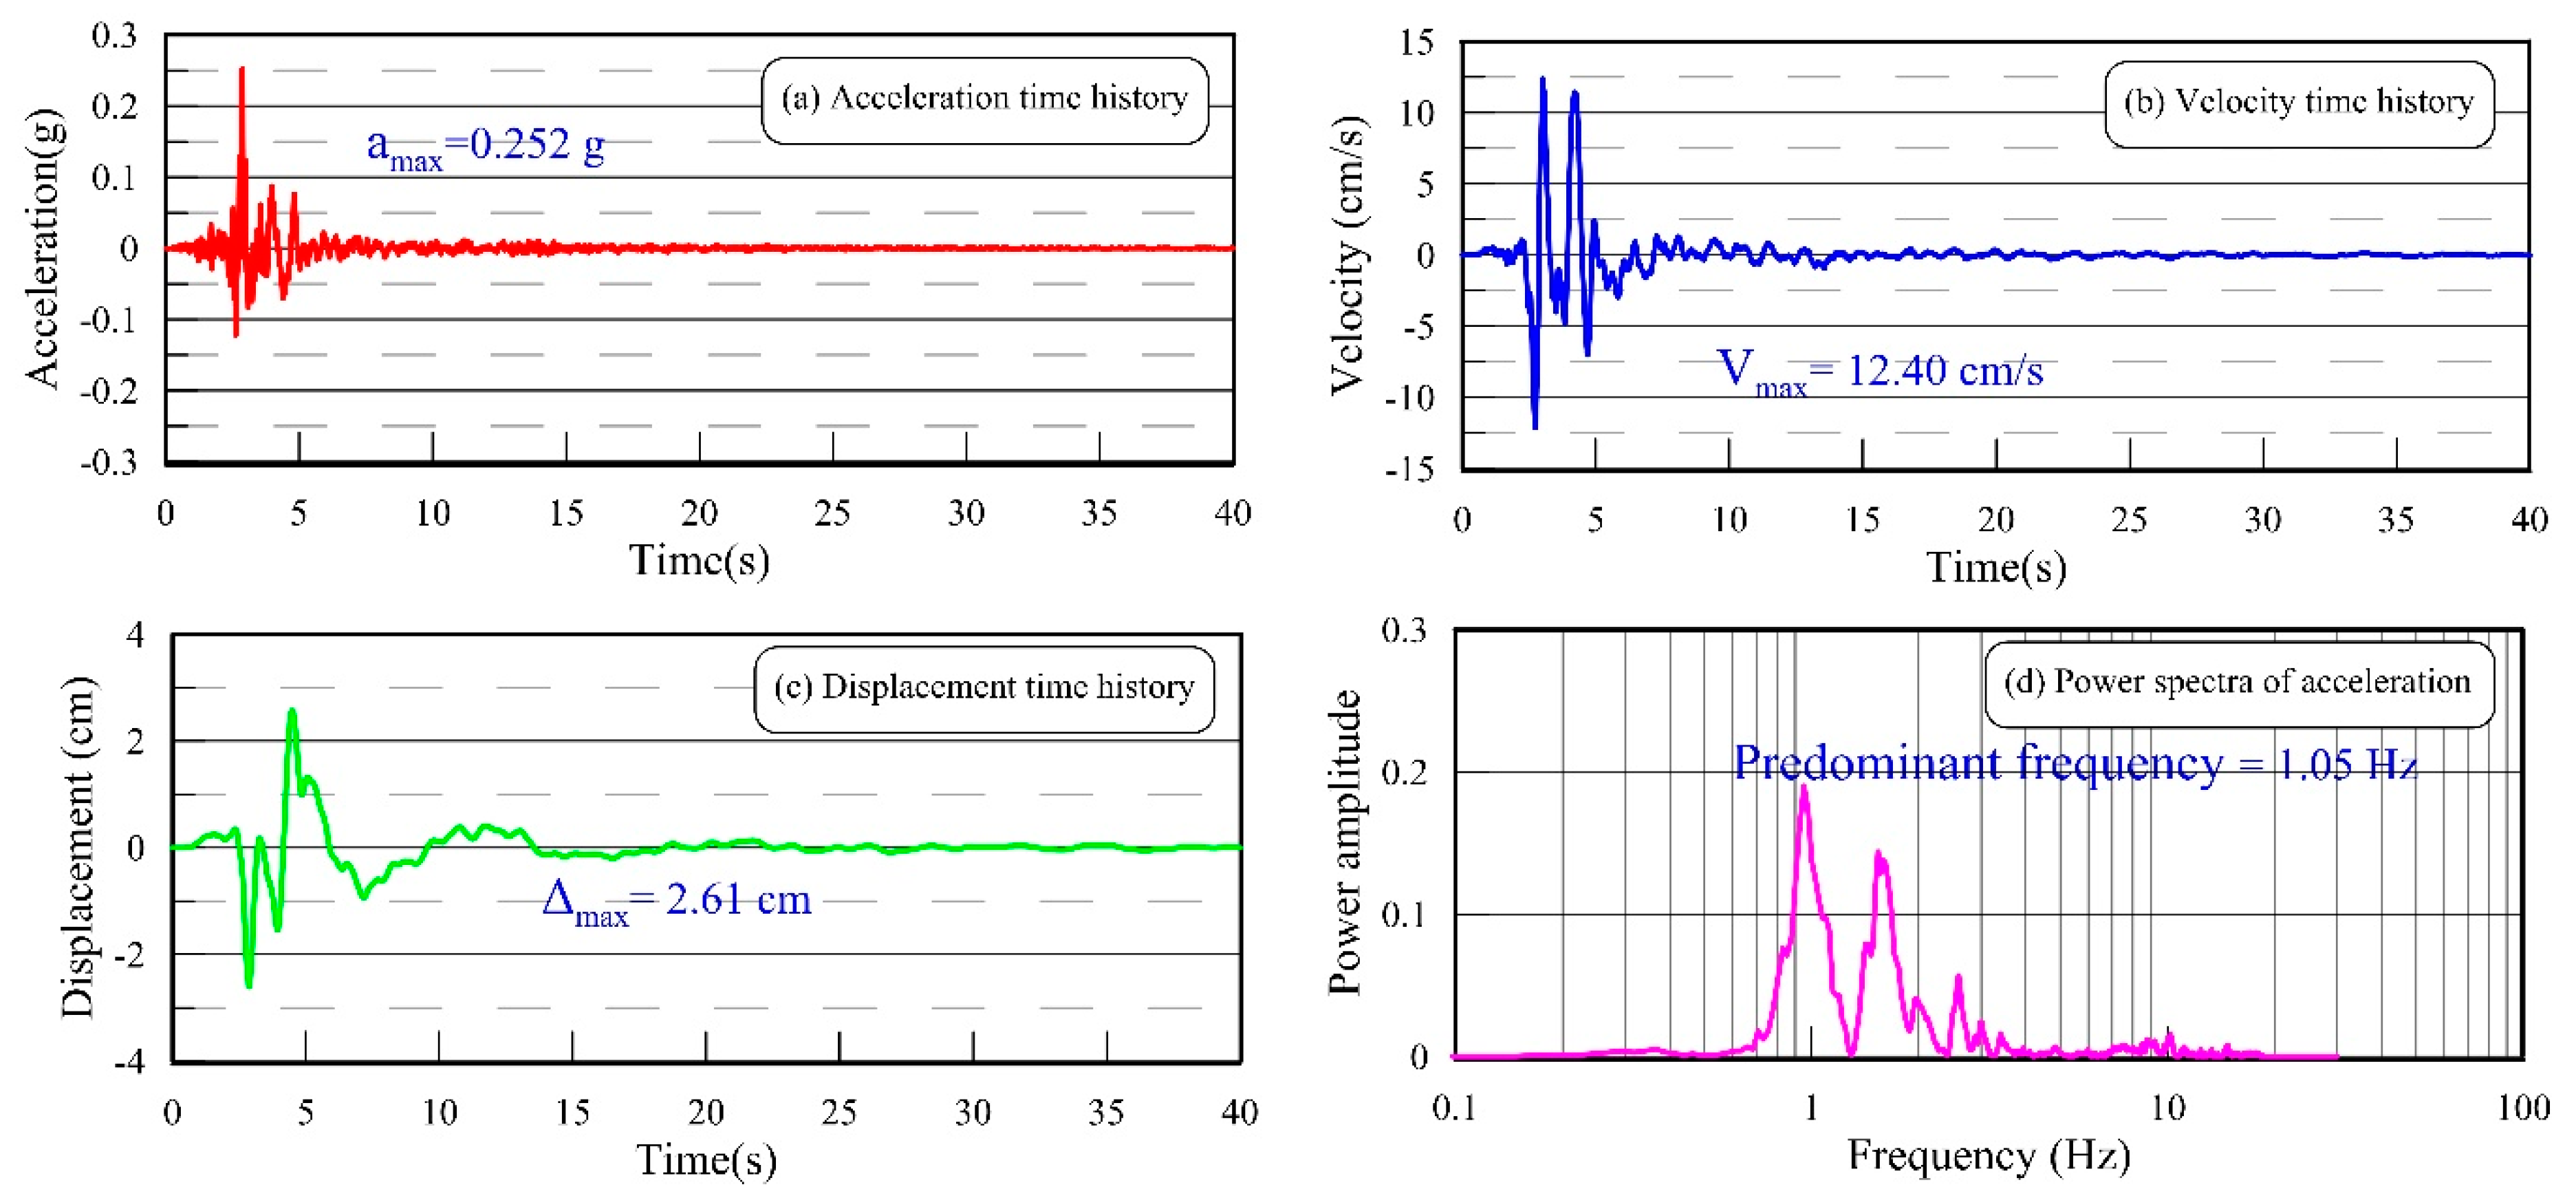
The extracted ground motion at the depth of 25 m is selected as the input ground motion for FLAC analysis in the next section. Figure 14 depicts the acceleration-time history, velocity-time history, displacement-time history, and power spectrum of the acceleration of the Pohang earthquake, respectively. The acceleration was extracted to approximately 40 s, filtered to 20 Hz, and corrected by a baseline drift. Then, it was implemented in the numerical analysis to assess the Pohang earthquake-induced liquefaction at Youngil-man port.

2.3.2. Numerical Modeling

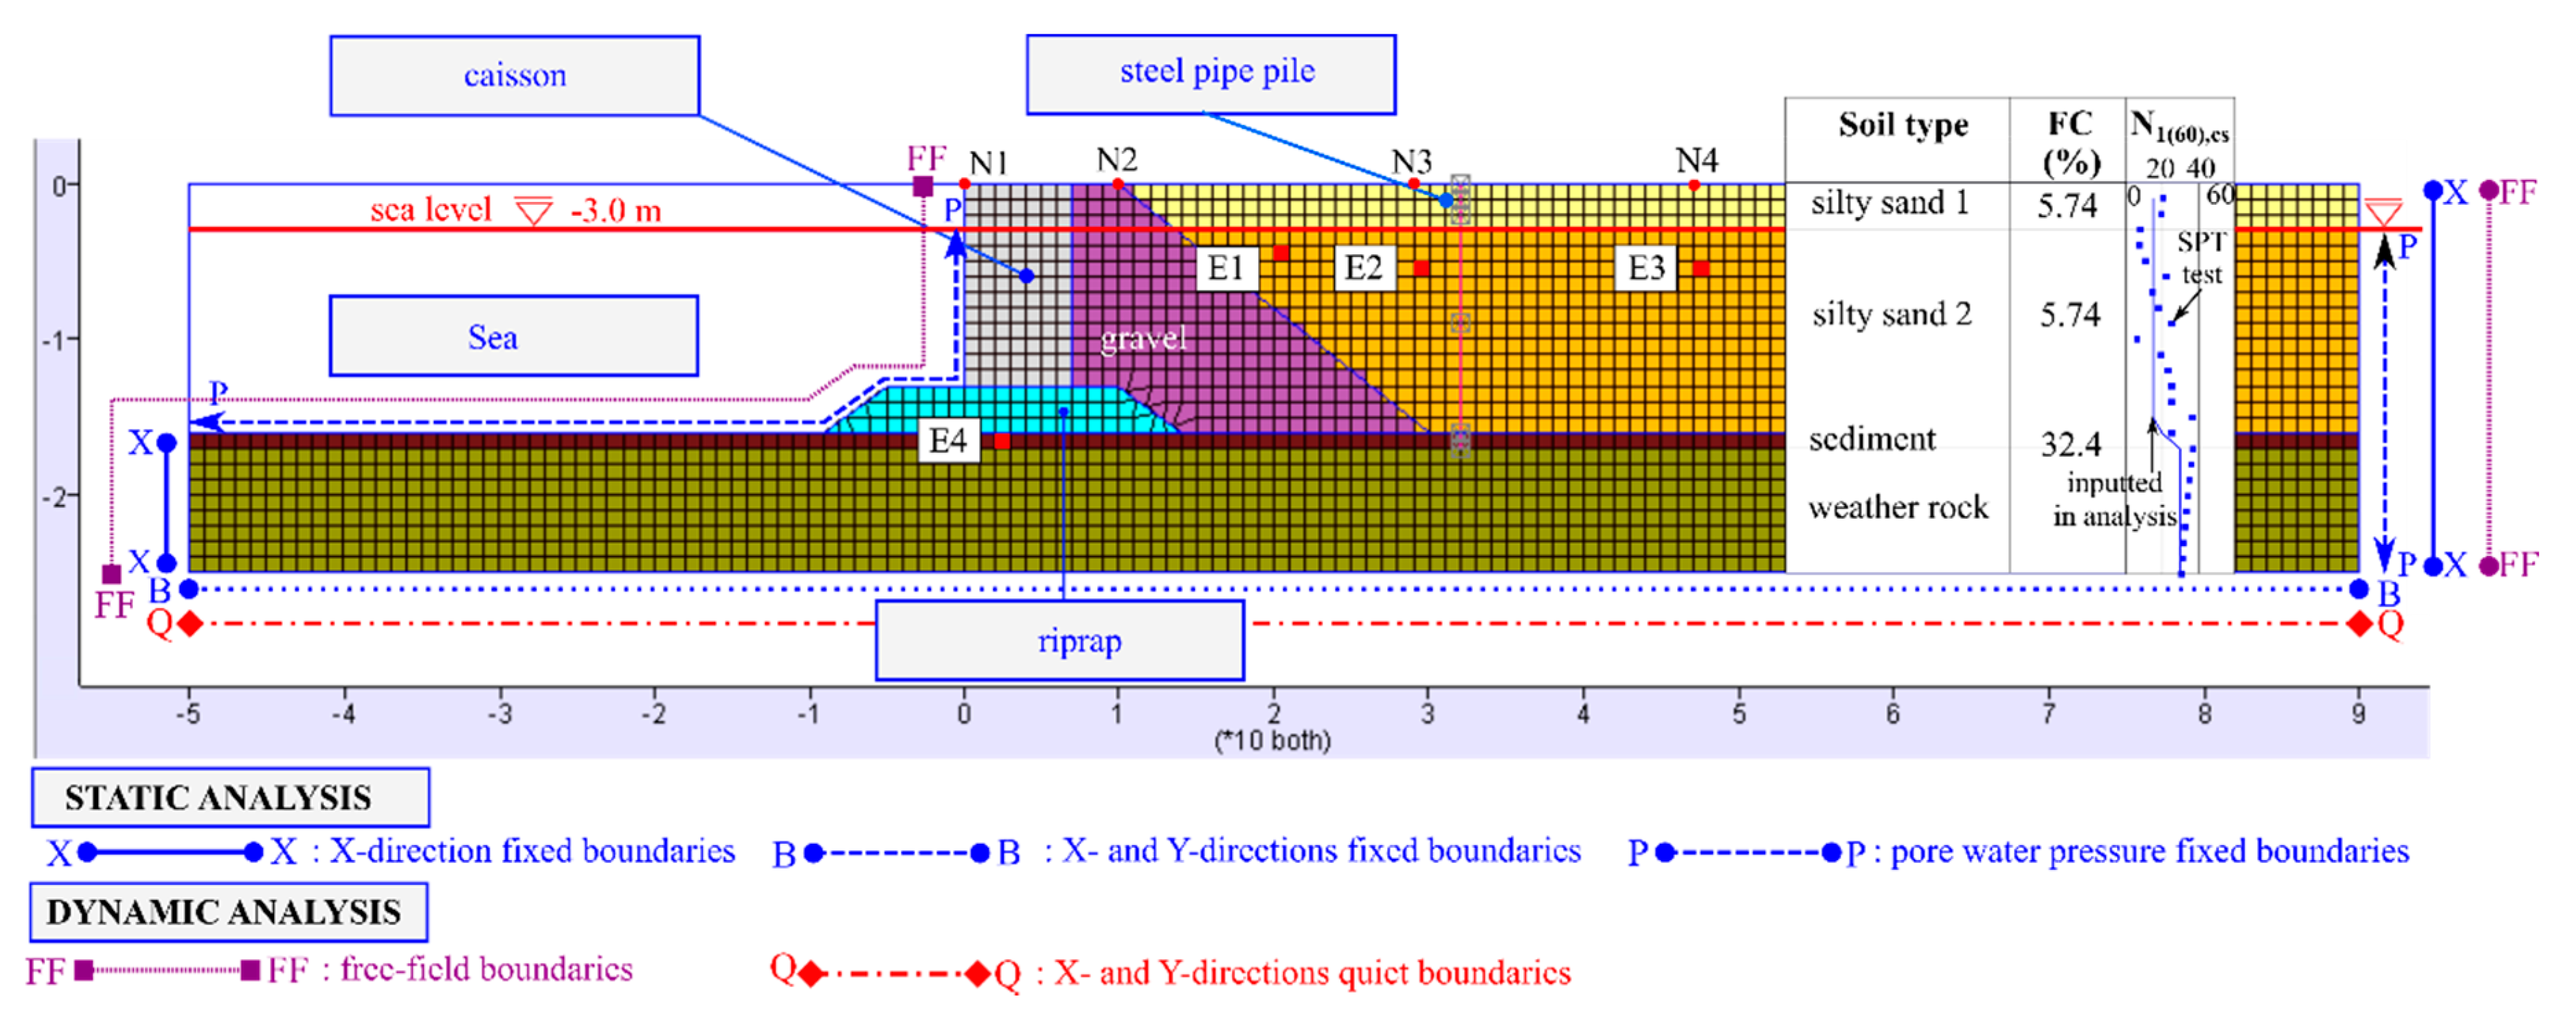
Figure 15 presents the representative cross section of Youngil-man port, which is in the north-south direction and was created using the FLAC2D program [30]. It was mostly built from gravel as a backfill material near the quay wall, and silty sandy soil for the reclaimed area. These layers are extremely sensitive to liquefaction under earthquake motion. Lee et al. [32] and Kang et al. [9] indicated that the bedrock of the Pohang basin, including the observed area, is approximately 500 m deep, and the mudstone is primarily distributed below a depth of 20 m up to the bedrock. In the case of Youngil-man port, the foundation soils include a thin thickness of sedimentary layer mainly from silty-like soil, and weathered rock is below the sedimentary layer [12]. In addition, a row of steel pipe piles, with a diameter of 600 mm, was installed at the depth of the sedimentary layers in order to reduce displacements if a failure occurs at the quay wall. Nodes N1, N2, N3, and N4 in Figure 15 depict the positions of the output nodes for the displacement predictions of the caisson, landfill ground behind the quay wall, and wave transmission checking. Similarly, elements E1, E2, E3, and E4 are used for the extraction of pore pressure generation and reduction in effective stress when liquefaction occurs.
Material properties: Table 3 shows the input parameters implemented in the numerical analysis. In this study, two silty sand layers in the reclaimed region were considered as the liquefiable soil layers, in which a reasonable N1(60) value of 15 was determined to be the best input into the numerical analysis using the UBCSAND2 model. All of the generic parameters required in the UBCSAND2 model in Table 1 can be calculated directly via the single N1(60) value. The perfectly plastic Mohr–Coulomb model was assigned for non-liquefiable soil layers such as sediment, gravel, weather rock, and riprap. The elastic materials of concrete and steel were selected for the caisson-type quay wall and the steel pipe pile, respectively.
Element size: The mesh size of the analysis was selected to be Δl = 1 m in order to ensure accurate wave transmission, and is based on the material properties in Table 3. Silty sand 1,2 has the lowest shear-wave speed Cs, for an elastic shear modulus kGe and a density ρ, which can be calculated as follows:
C s = k G e ρ = 21.7 × 20 × N 1 ( 60 ) 0.333 × P a × ( σ m / P a ) γ d / 10 = 237.24   ( m / s )
Then, the maximum frequency transmitted in the largest zone in FLAC must be higher than the maximum frequency of the input motion [30].
f = C s 10 · Δ l = 23.72   ( H z ) > 20   ( H z )
From Equation (18), it can be seen that the selected mesh size of 1 × 1 m can transfer the seismic wave in an accurate way when the earthquake motion is applied at the base of the numerical analysis.
Boundary conditions for static analysis: During the static analysis, both the horizontal and vertical directions were fixed against the movement at the base of the model. Two sides of the model allowed for vertical movements, but were laterally fixed to prevent horizontal movements. At the bottom, a free pore pressure condition was assigned to allow for changes in pore pressure, but it restricted flow across the boundary. The left and right sides applied pore pressure below the level of −3.00 m relative to the ground surface, which was the maximum sea level rise. Steady-state seepage analysis was then performed to develop the initial phreatic surface.
Boundary conditions for seismic analysis: A quiet boundary condition in the x- and y-directions was applied to the bottom of the model to minimize the reflection of outward propagating waves back into the model and does not allow the necessary energy radiation [30,39,40]. Along the side boundaries of the grid should not be assigned as the quiet boundaries because the wave energy can leak out of the sides. Alternatively, free-field boundaries can be used in this situation [30]. During the seismic analysis, the side boundary zones were assigned to be elastic elements with appropriate stiffness (three columns of elements on each side) to prevent free-field boundary conditions from element distortions and increase the spurious reflections off the boundary. This kind of technique can minimize wave reflections if dynamic loading is applied to the model boundaries [30]. To achieve dynamic loading at the base, the ground motions were transformed to equivalent shear waves (i.e., horizontal motion) for the weathered rock layer as follows:
σ s = 2 · ( ρ · C s ) · ν s
where σs is the applied shear stress, ρ is the mass density, Cs is the velocity of the s-wave propagation through medium, and νs is the input velocity.
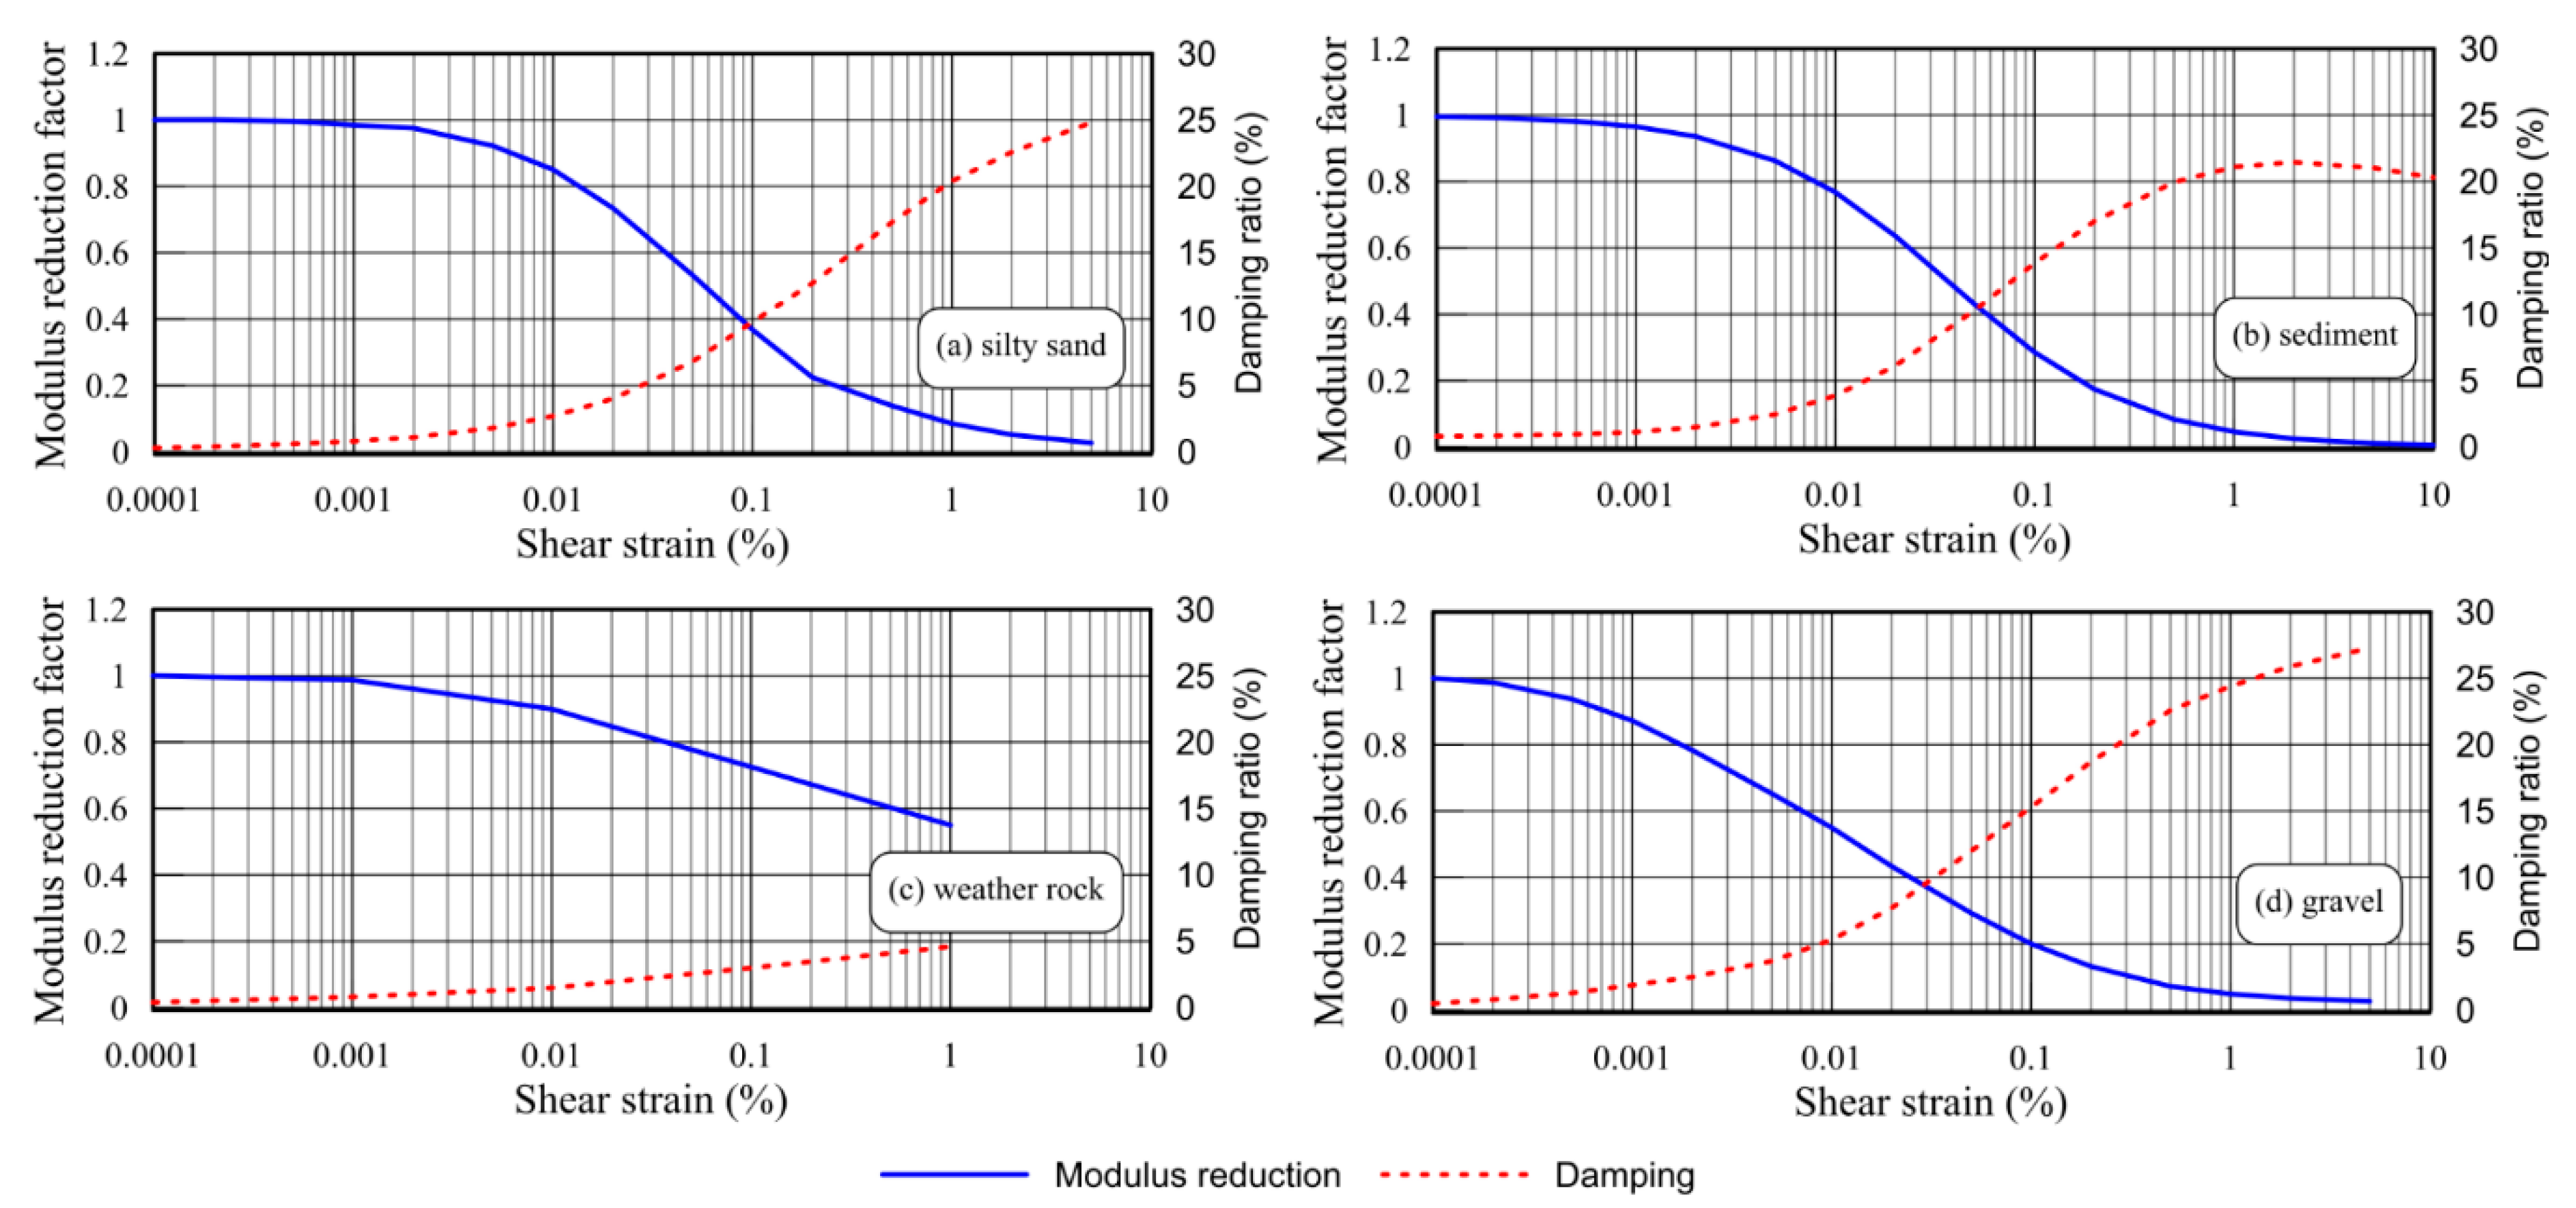
Viscous damping: Rayleigh damping was used for the seismic analysis in FLAC. The predominant frequency of the ground motions (= 1.05 Hz, as in Figure 14d) was considered as the center of frequency in the analysis. The numerical results obtained from the equivalent linear analysis using PROSHAKE software were extracted for silty sand, sediment, weather rock, and gravel as shown in Figure 16. The selected layer corresponds to the maximum shear strain, which is approximately 0.03% for silty sand, 0.01% for sediment, 0.01% for weather rock, and 0.01% for gravel. Then, the damping ratio and modulus reduction ratio (G/Gmax) are inferred from the curves in Figure 16 for each soil type with the equivalent uniform strain (about 50% of maximum shear strain) [30]. As a result, the damping ratio is taken as 5% for silty sand, 4% for sediment, 2% for weather rock, and 5% for gravel. Whereas, the modulus reduction factor is selected as 0.7 for silty sand, 0.78 for sediment, 0.9 for weather rock, and 0.58 for gravel.

3. Results and Discussion

3.1. Pre-Earthquake Stress Conditions

Figure 17 shows the stress state just before the start of the earthquake. In the reclaimed region behind the steel pipe piles, the initial horizontal stress and initial shear stress ratios are mostly around 0.5 (Jaky’s lateral earth pressure coefficient K0 = 1 − sin ϕ′ ≈ 0.5 for sand [41]) and 0.0, respectively. Near the quay wall, K0 is in the range of 0.2–0.4, and α ranges from 0.05 to approximately 0.1. Although there are higher values of K0 ≈ 1.0 and α ≈ 0.15 at other locations, such as at the base of the quay wall (i.e., riprap), soils in these areas are considered to be non-liquefiable materials. Thus, their contributions to liquefaction are minimal. The predictions for the static state are reasonable for the realistic conditions of the Youngil-man port before the earthquake occurred.

3.2. Excess Pore Water Pressure

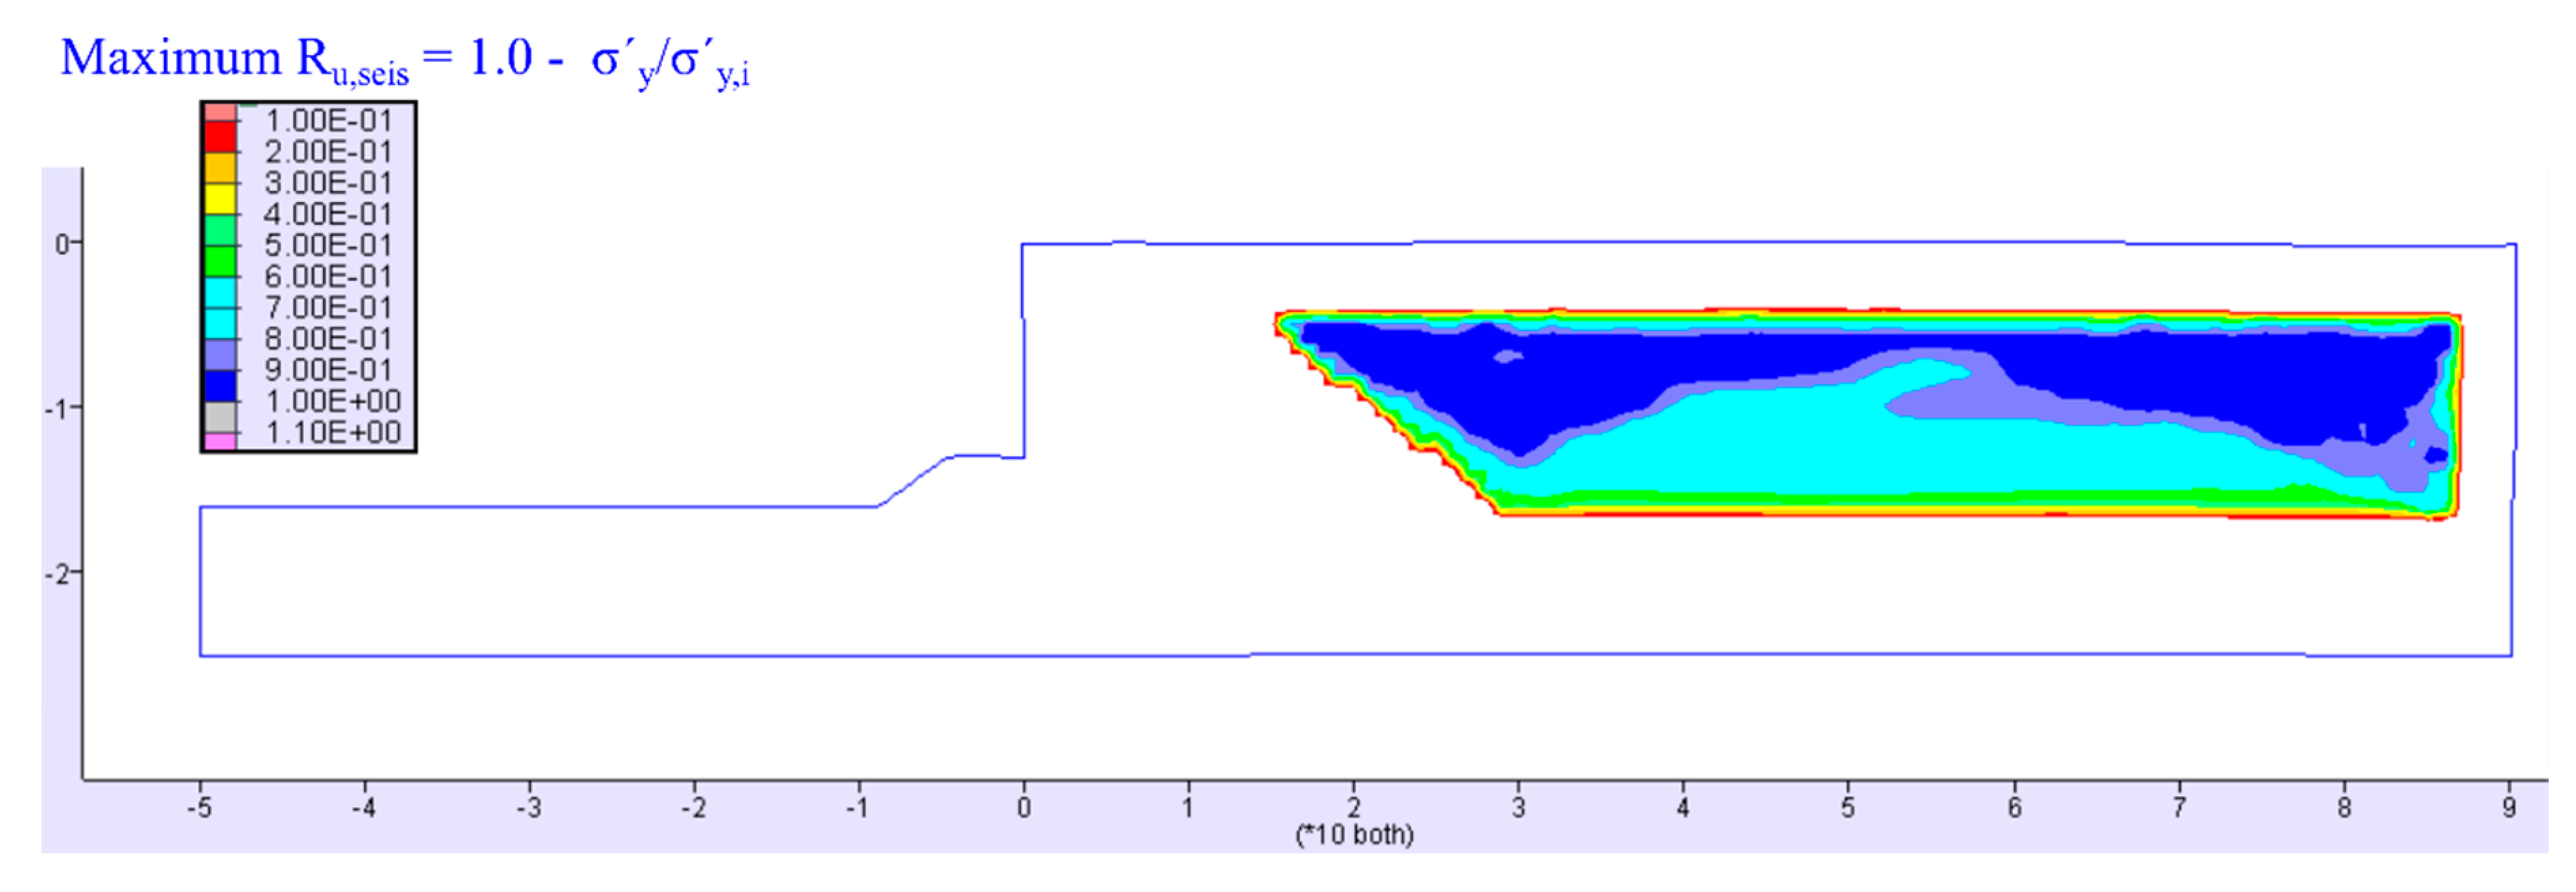
Figure 18 presents the maximum of the excess pore water pressure ratio Ru,seis contours at the end of the earthquake. This value is the ratio of the pore water pressure seismically generated and the initial vertical effective stress, which differs from the commonly used ratio of the current pore pressure and total vertical effective stress (ru = u/σy). Beaty and Byrne [3] suggested that the value of Ru,seis can be determined as follows:
R u , s e i s = 1.0 σ y σ y , i = Δ u c y c l i c σ y , i
where σ′y is the current vertical effective stress, σ′y,i is the initial (pre-earthquake) vertical effective stress, and Δucyclic is the cyclically induced change in pore pressure.
Based on the contours of Ru,seis in Figure 18, the soils are mainly liquefied in the second silty sand layer, which is more significant in the far field and near the quay wall.
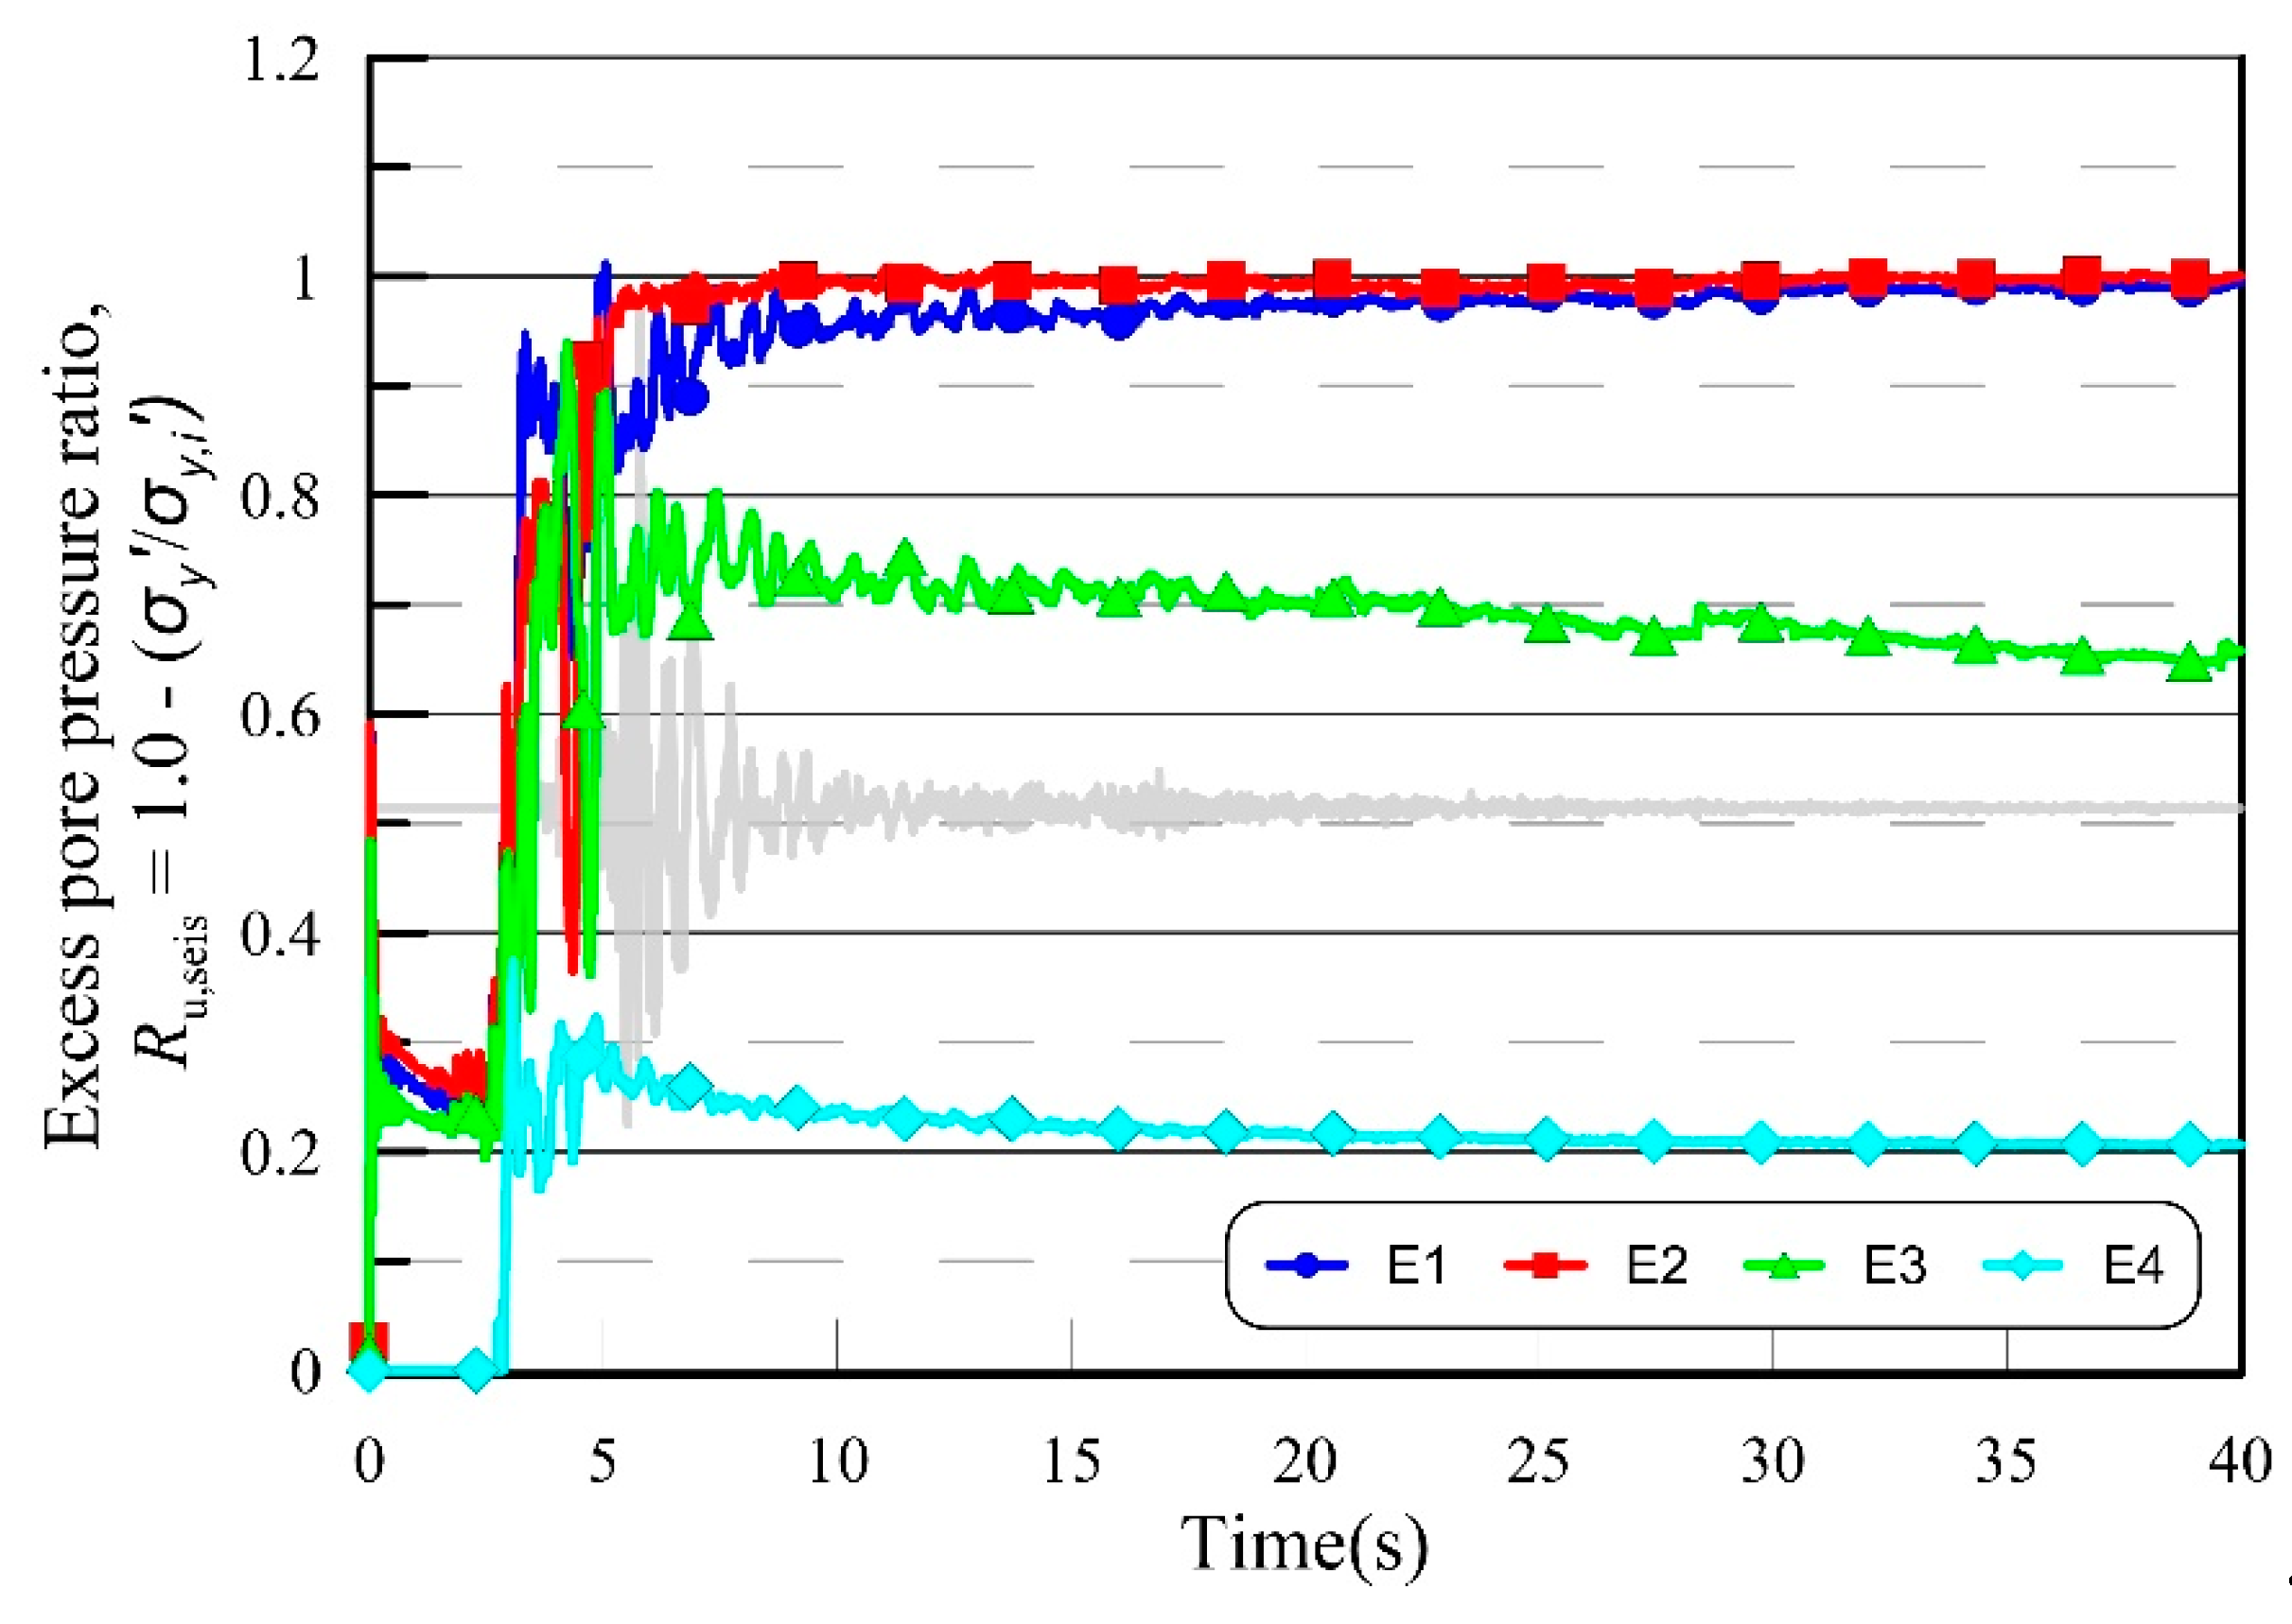
Figure 19 presents the excess pore water pressure generation during the earthquake of observed elements in Figure 15. Elements E1, E2, and E3 are defined as the liquefied second silty sand layer, and they are assigned by the UBCSAND2 model. Element E4 is considered as non-liquefied soil and is assigned by the Mohr–Coulomb model. It is clear that elements E1 and E2 reach a peak value of Ru,seis ≈ 1.0, in which liquefaction occurs in these elements. Although element E3 firstly generated to the peak value of Ru,seis = 0.9, however, it decreased slightly to nearly 0.6 at the end of the shaking. In contrast, the peak Ru,seis of element E4 is approximately 0.4, in which no liquefaction occurs in this element.

3.3. Displacements

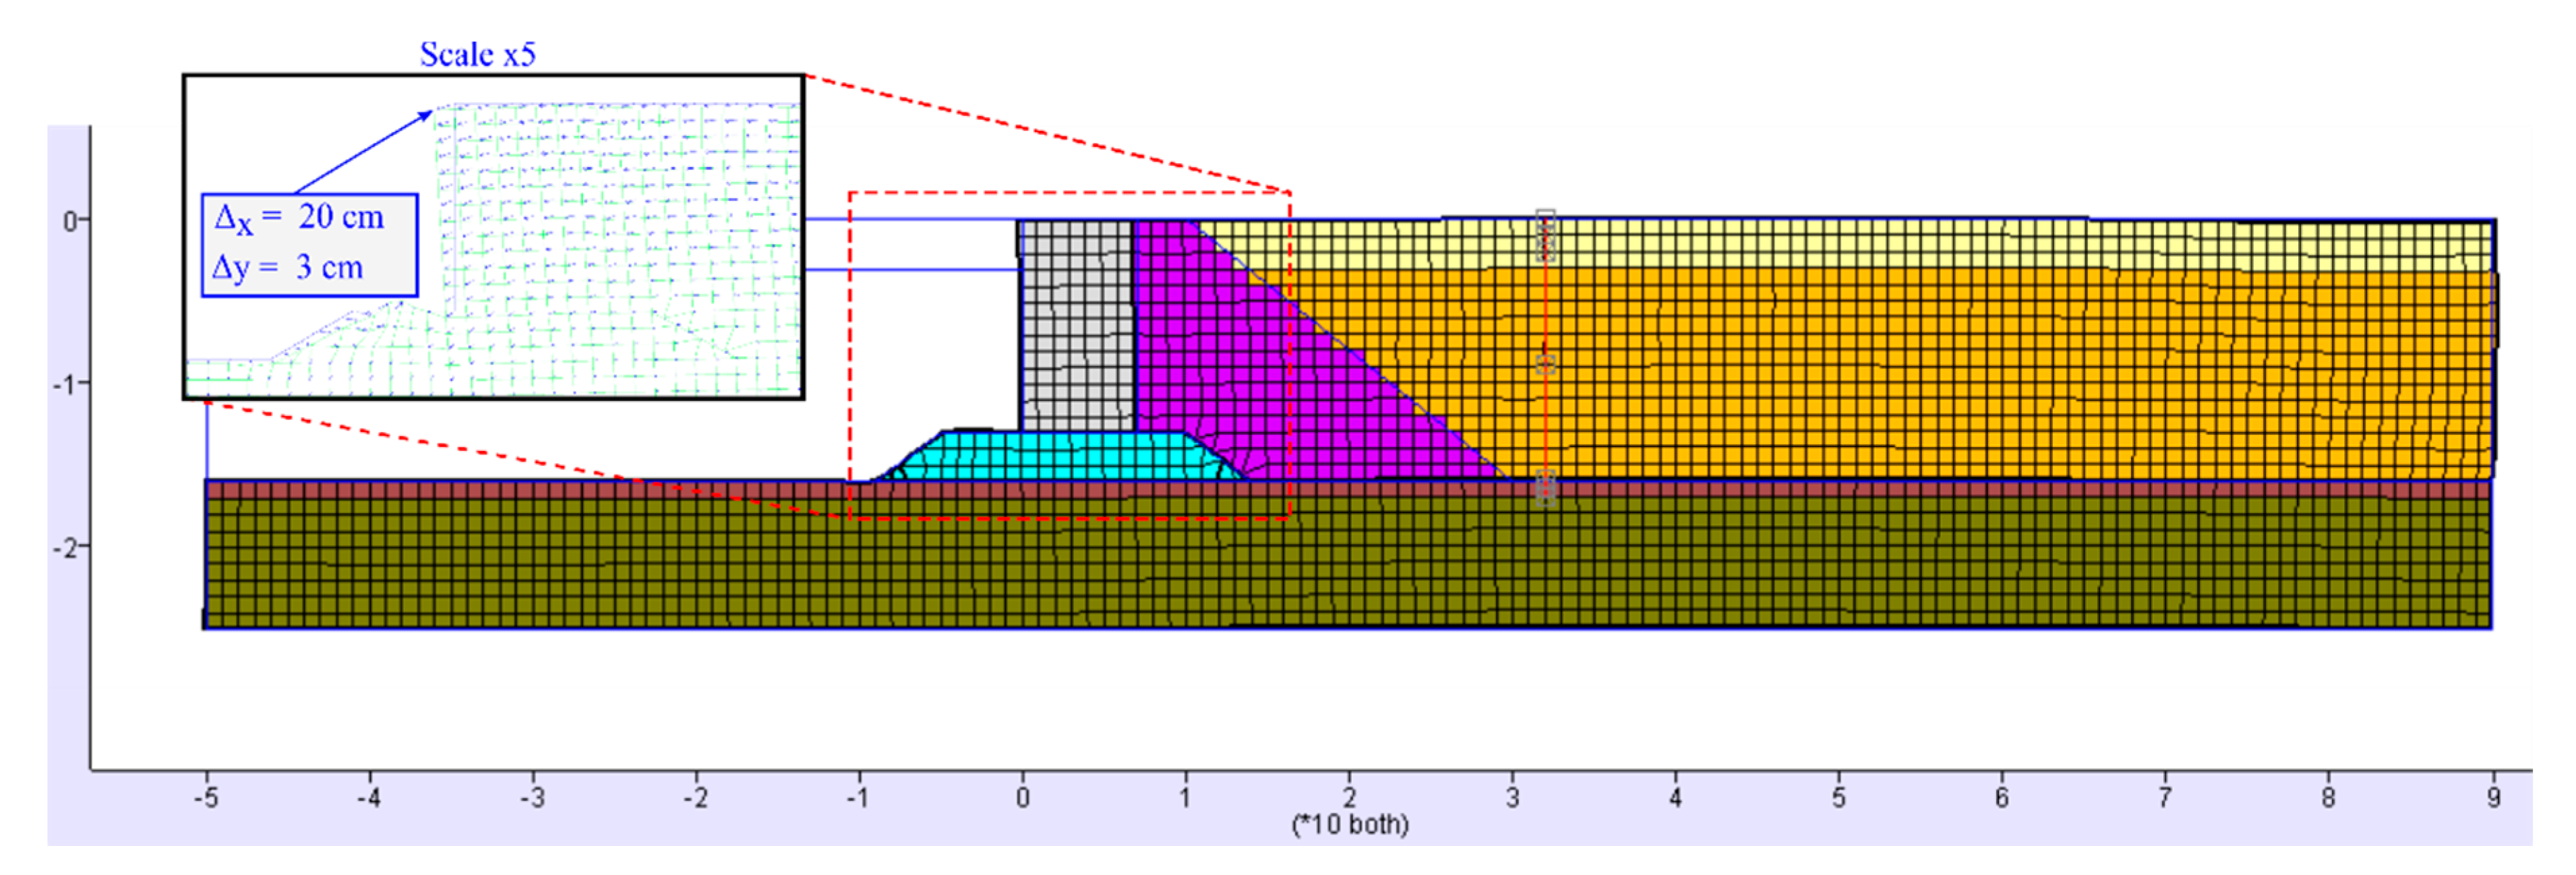
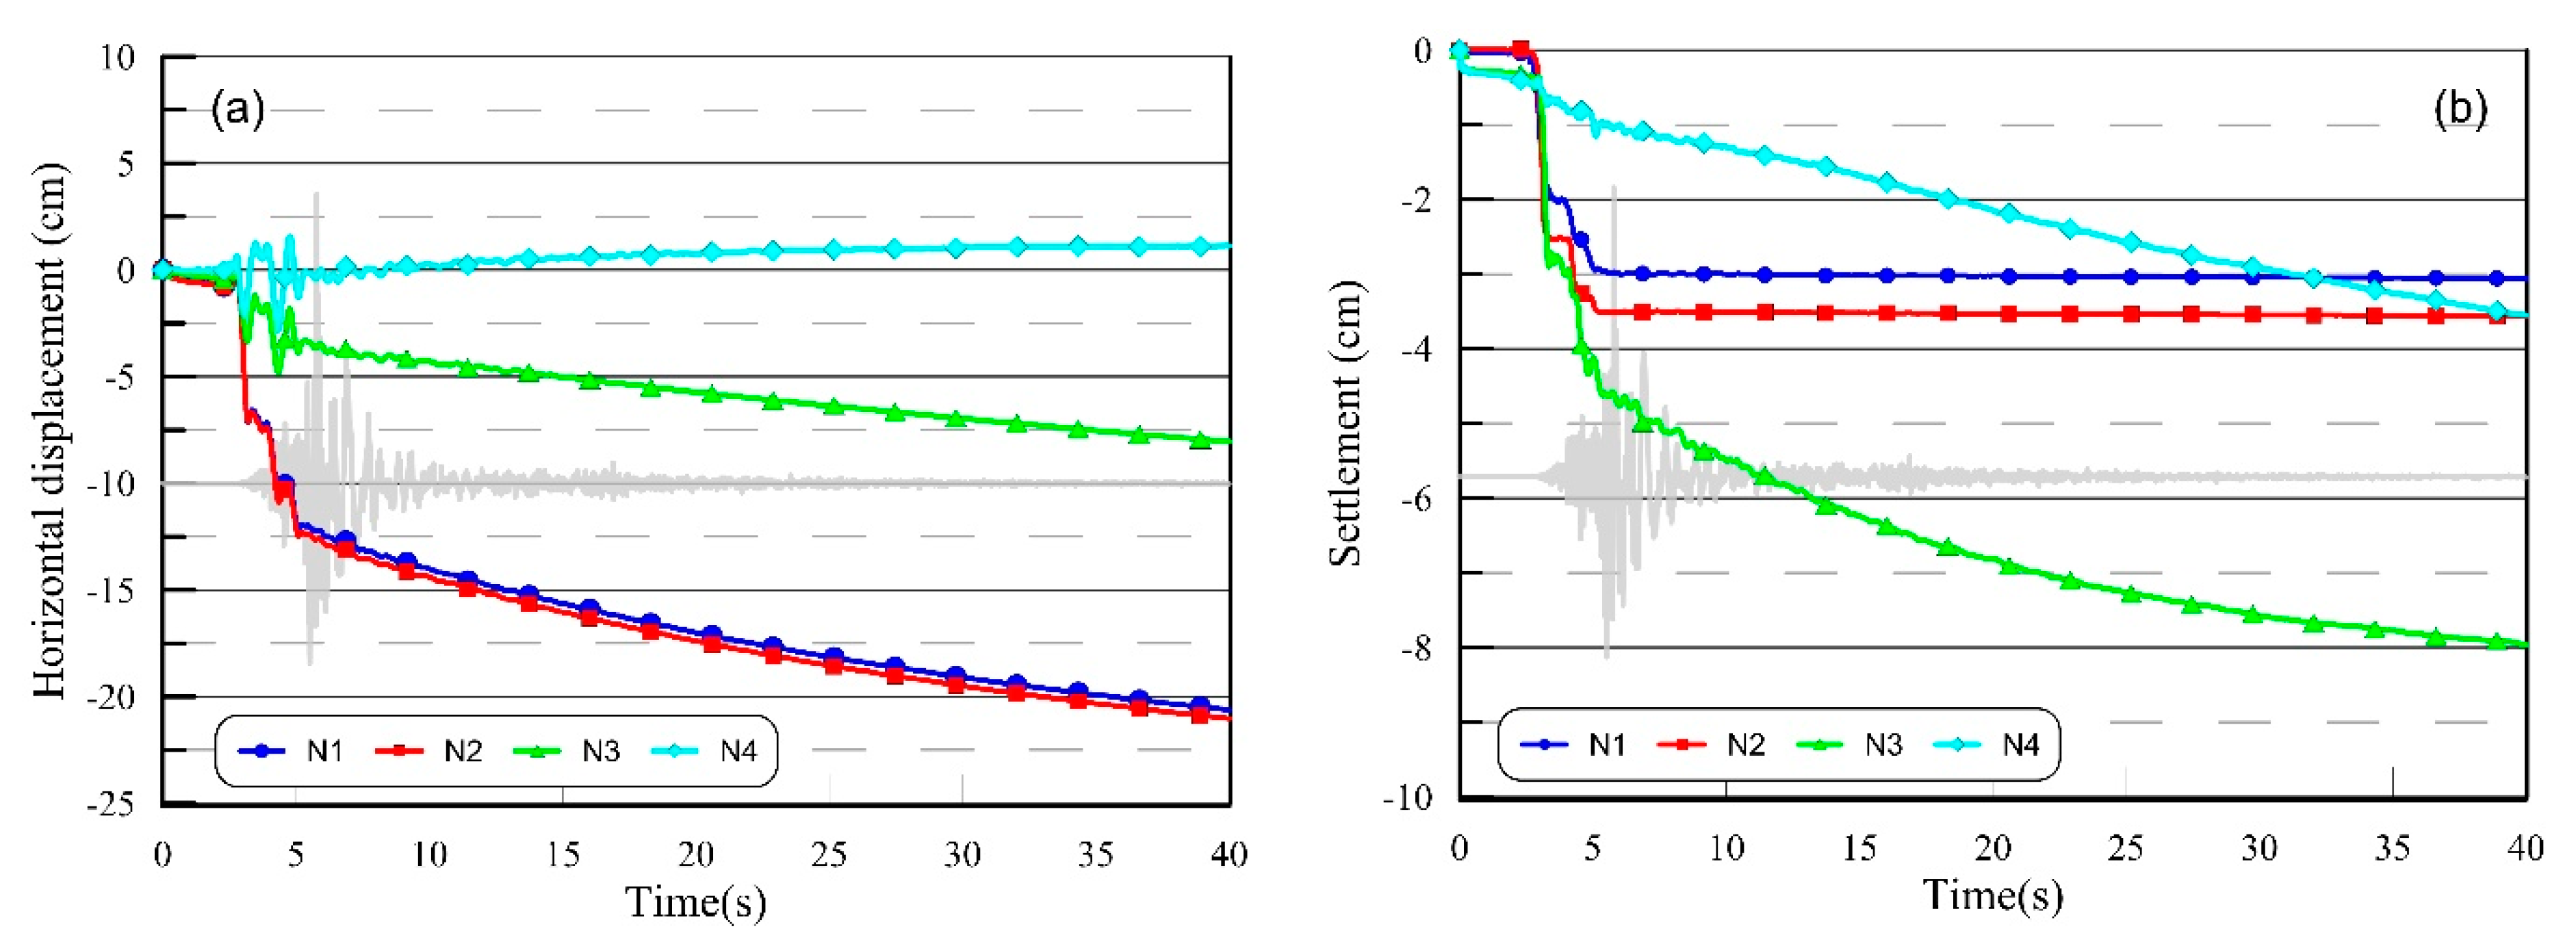
Figure 20 shows the deformed mesh of the analysis at the end of shaking. An enlargement around the quay wall is scaled up by five times to easily identify displacements. It can be seen that the top of the quay wall moved horizontally approximately 20 cm toward the ocean and settled nearly 3 cm from its starting point, which is in agreement with the observations where the wall displacements are reported to be 5–15 cm horizontally and less than 10 cm vertically [11]. It follows from this figure that the deformation of the foundation (i.e., riprap layer) leads to displacements of the quay wall. The slippage in the interface beneath the quay wall may not be the reason for the quay wall displacements, and it is mainly due to deformation in the foundation. A detail displacement description of the observed nodes (set in Figure 15) is shown in Figure 21. It can be seen that the horizontal displacements of nodes N1 and N2 are quite similar, which are around 20 cm. However, the settlement of node N2 is slightly higher than that of node N1. The settlement predictions of nodes N3 and N4 are approximately 8 and 4 cm, respectively. When nodes N1, N2, and N3 move horizontally toward the ocean (approximately 20 cm for nodes N1 and N2 and 8 cm for node N3), node N4 deforms to the right side of the model by around 2 cm. It is noticed that the displacements of soil behind the steel pipe piles (represented by node N4) are reduced compared to those of the soil in front of the row of steel piles (represented by nodes N1, N2, and N3).

3.4. Shear Stress–Strain and Acceleration

Figure 22 illustrates the maximum shear strain contours at the end of the earthquake. Two shear bands are localized near the quay wall and the far field of the model. Near the quay wall, the shear band would be extended to the top of the quay wall due to the significant displacements of the caisson. Due to the free-field boundary conditions, the right side of the model was not constrained nor tied with a rigid body to fix the horizontal displacement. Therefore, many significant shear bands are localized in this region.
Figure 23 depicts the shear stress–strain response during the earthquake of the observed elements in Figure 15. When maximum shear strain produced by the Mohr–Coulomb model is approximately 0.03% in element E4, the significantly higher ones generated by the UBCSAND2 model in elements E1, E2, and E3 are 0.35%, 0.2%, and 0.5%, respectively. Additionally, the effect of initial static shear stress (i.e., α > 0) can be addressed in the stress–strain responses of elements E1, E2, and E3 as shown in Figure 23a–c. This initial shear stress produced a constant bias in the cyclic shear load of the soil elements assigned by the UBCSAND2 model. In the regions behind the steel pipe piles represented by element E3, in which the α value is approximately zero, the symmetrical response of shear stress is in a range of (−30, 30) kPa. Whereas, the non-symmetrically mobilized shear stress of elements E1 with α ≈ 0.075 and E2 with α ≈ 0.05, are in the range of (−15, 25) and (−10, 15) kPa, respectively.
Figure 24 shows the comparison between the input ground motions and transmission motions in the analysis. The observed nodes were set in Figure 15. In this study, the recorded acceleration-time history of the Pohang earthquake was extracted to 40 s, filtered to 20 Hz, and baseline drifted. Then, a transformation of the corrected velocity motion to shear stress motion was made to be applicable to the quiet boundary condition in FLAC, as in Equation (19). Therefore, it is essential to check the wave transmission during shaking. At the bottom of the observed nodes, there are slight differences in the acceleration-time histories comparing the input ground motion. It can be said that the transformation from velocity history to shear stress history was successfully implemented. In dynamic analysis, it is important to consider the effect of velocity doubling at the model base and at the top of the model. If elastic materials are defined for the model and run in an un-damped analysis, the velocity-doubling effect would occur in the free surface [30]. In other words, the velocity at the top is double the velocity at the base for un-damped elastic materials. In this study, Rayleigh damping was used for the dynamic analysis, in which there is a small amplification of the velocity wave at the free surface compared to the base, indicating that the base is within the range of velocity. The trend of this effect is depicted in Figure 24b–d. It is interesting that the velocities at the top of the model for nodes N3 and N4 are approximately 25% higher than those at the base, when only 5% of the difference is presented for node N2. This may be due to the very high stiffness of the gravel preventing wave transmission from the base to the top surface of node N2.

4. Conclusions

Since the widespread damages on geotechnical structures caused by liquefaction during the Pohang earthquake, the understanding of the mechanism and more accurate predictions of liquefaction-induced displacements using state-of-the-art numerical tools have played crucial roles in the design stages for practical engineering applications. In this study, a robustly practical model called UBCSAND2, in which two-mobilized planes (i.e., the maximum shear plane and horizontal plane) simultaneously participate in plastic strain generation, addresses the conventional effects in the element CDSS test: rotation of principal stress and plastic unloading.
The UBCSAND2 model was calibrated by a series of CDSS tests. There is a good agreement between the experimental and estimated results either in variations of CSRNliq curves or in terms of stress path, shear stress–shear strain, and pore pressure generation under different density states (Dr), confining stress (σ′v), and initial static shear stress (α) conditions. The generic parameters of the model were chosen to assess the liquefaction that occurred at Youngil-man port, Pohang, Korea.
The quay wall in the region of Pohang in South Korea was numerically simulated to demonstrate capabilities of the UBCSAND2 model in predicting the mechanical behavior of liquefied soils. According to the numerical results, liquefaction mostly occurred in silty sand layers when the excess pore water pressure generated almost 85−95% of initial vertical effective stress. The displacements at the top of the quay wall from liquefaction phenomenon were approximately 20 and 3 cm, respectively, when the settlements of reclaimed area behind the quay wall varied nearly from 4 to 8 cm. These numerical results obtained from the analysis are extremely similar to that observed by solely visiting the sites after the Pohang earthquake. The mechanism of excess pore water pressure generation, shear band expansion, shear stress–strain response, and transmission waves obtained from the numerical analysis have provided a full understanding of the liquefaction phenomenon that occurred in Youngil-man port.

Author Contributions

Conceptualization, N.-P.D. and S.-S.P.; methodology, N.-P.D. and S.-S.P.; software, N.-P.D. and S.-S.P.; validation, N.-P.D., S.-S.P. and D.-E.L.; formal analysis, N.-P.D. and S.-S.P.; investigation, N.-P.D. and S.-S.P.; resources, S.-S.P. and N.-P.D.; data curation, S.-S.P. and N.-P.D.; writing—original draft preparation, N.-P.D. and S.-S.P.; writing—review and editing, N.-P.D., S.-S.P. and D.-E.L.; visualization, N.-P.D. and S.-S.P.; supervision, S.-S.P.; project administration, S.-S.P. and D.-E.L.; funding acquisition, S.-S.P. and D.-E.L. All authors have read and agreed to the published version of the manuscript.

Funding

This work was supported by the National Research Foundation of Korea (NRF) grant funded by the Korea government (MSIT) (No. NRF-2018R1A5A1025137).

Conflicts of Interest

The authors declare no conflict of interest.

References

  1. Aubry, D.; Modaresi, H. Seismic wave propagation in soils including non-linear and pore pressure effects. In Recent Advances in Earthquake Engineering and Structural Dynamics; Ouest éditions: Nantes, France, 1992; pp. 209–224. [Google Scholar]
  2. Beaty, M.H.; Perlea, V.G. Several observations on advanced analyses with liquefiable materials. In Proceedings of the 31st Annual USSD Conference and 21st Conference on Century Dam Design-Advances and Adaptations, San Diego, CA, USA, 11–15 April 2011; pp. 1369–1397. [Google Scholar]
  3. Beaty, M.H.; Byrne, P.M. UBCSAND constitutive model version 904aR. Itasca UDM Web Site 2011, 1–69. [Google Scholar]
  4. Byrne, P.M.; Park, S.S.; Beaty, M.; Sharp, M.; Gonzalez, L.; Abdoun, T. Numerical modeling of liquefaction and comparison with centrifuge tests. Can. Geotech. J. 2004, 41, 193–211. [Google Scholar] [CrossRef]
  5. Beaty, M.H. Application of UBCSAND to the LEAP centrifuge experiments. Soil Dyn. Earthq. Eng. 2018, 104, 143–153. [Google Scholar] [CrossRef]
  6. Yang, D.; Naesgaard, E.; Byrne, P.M.; Adalier, K.; Abdoun, T. Numerical model verification calibration of George Massey Tunnel using centrifuge models. Can. Geotech. J. 2004, 41, 921–942. [Google Scholar] [CrossRef] [Green Version]
  7. Seid-Karbasi, M.; Byrne, P.M. Seismic liquefaction, lateral spreading, and flow slides: A numerical investigation into void redistribution. Can. Geotech. J. 2007, 44, 873–890. [Google Scholar] [CrossRef]
  8. Park, S.S. A Two Mobilized-Plane Model and Its Application for Soil Liquefaction Analysis. Ph.D. Thesis, University of British Columbia, Vancouver, BC, Canada, 2005. Available online: https://open.library.ubc.ca/cIRcle/collections/ubctheses/831/items/1.0063362 (accessed on 20 April 2020).
  9. Kang, S.; Kim, B.; Bae, S.; Lee, H.; Kim, M. Earthquake-induced ground deformations in the low-seismicity region: A case of the 2017 M5.4 Pohang, South Korea, earthquake. Earthq. Spectra 2019, 35, 1235–1260. [Google Scholar] [CrossRef]
  10. Choi, J.H.; Ko, K.; Gihm, Y.S.; Cho, C.S.; Lee, H.; Song, S.G.; Bang, E.S.; Lee, H.J.; Bae, H.K.; Kim, S.W.; et al. Surface Deformations and Rupture Processes Associated with the 2017 Mw 5.4 Pohang, Korea, Earthquake. Bull. Seismol. Soc. Am. 2019, 109, 756–769. [Google Scholar] [CrossRef]
  11. Kim, S.; Hwang, W.K.; Kim, T.H.; Kang, G.C. A case study on earthquake-induced deformation of quay wall and backfill in Pohang by 2D-effective stress analysis. J. Korean Geotech. Soc. 2019, 35, 15–27. (In Korean) [Google Scholar] [CrossRef]
  12. Lee, H.J.; Kang, G.C.; Hwang, W.K.; Lee, M.S.; Kim, T.H. Behavior Analysis on Earthquake-Induced Deformation of Quay Wall and Apron in Ground at Youngilman Port Considering Drainage Condition Using FEM Analysis. J. Korean Soc. Coast. Ocean Eng. 2019, 31, 386–394. (In Korean) [Google Scholar] [CrossRef] [Green Version]
  13. Baek, W.H.; Choi, J.S.; Ahn, J.K. Liquefaction Hazard Map Based on in Pohang Under Based on Earthquake Scenarios. J. Earthq. Eng. Soc. Korea 2018, 22, 219–224. (In Korean) [Google Scholar] [CrossRef]
  14. Jeong, M.S. Investigation and analysis of Pohang earthquake in relation to geotechnical earthquake engineering. In Proceedings of the Symposium on characteristics of Pohang Earthquake and Countermeasures for Geotechnical Structure, Seoul, Korea, 7 February 2018; Available online: http://www.ksce.or.kr/not/Default.asp?page=1&bidx=48219&sfield=&gtxt=&gbn=13&bcat=&ctop=MN0099&htop=MN0031&ptop=MN0031&idx=&bgbn=R (accessed on 23 September 2019). (In Korean).
  15. Ahn, J.K.; Baek, W.H.; Choi, J.S.; Kwak, D.Y. Investigation of Pohang Earthquake Liquefaction Using 1D Effective-Stress Site Response Analysis. J. Korean Geotech. Soc. 2018, 34, 37–49. (In Korean) [Google Scholar] [CrossRef]
  16. Iai, S.; Matsunaga, Y.; Kameoka, T. Strain Space Plasticity Model for Cyclic Mobility. Soils Found. 1992, 32, 1–15. [Google Scholar] [CrossRef] [Green Version]
  17. Iai, S.; Matsunaga, Y.; Kameoka, T. Analysis of Undrained Cyclic behavior of Sand under Anisotropic Consolidation. Soils Found. 1992, 32, 16–20. [Google Scholar] [CrossRef]
  18. Puebla, H.; Byrne, P.M.; Phillips, R. Analysis of CANLEX liquefaction embankments: Prototype and centrifuge models. Can. Geotech. J. 1997, 34, 641–657. [Google Scholar] [CrossRef]
  19. Beaty, M.; Byrne, P.M. An Effective Stress Model for Predicting Liquefaction Behaviour of Sand. Geotechnical Earthquake Engineering and Soil Dynamics III; Dakoulas, P., Yegian, M., Holtz, R., Eds.; ASCE, Geotechnical Special Publication: Seattle, DC, USA, 1998; pp. 766–777. [Google Scholar]
  20. Park, S.S.; Byrne, P.M. Practical constitutive model for soil liquefaction. In Proceedings of the 9th International Symposium on Numerical Models in Geomechanics (NUMOG IX), Ottawa, ON, Canada, 25–27 August 2004; pp. 181–186. [Google Scholar]
  21. Rowe, P.W. The stress-dilatancy relation for static equilibrium of an assembly of particles in contact. Proc. R. Soc. Lond. Math. Phys. Sci. Ser. A 1962, 269, 500–557. [Google Scholar]
  22. Silver, M.L.; Seed, H.B. Volume changes in sands during cyclic loading. J. Soil Mech. Found. Div. 1971, 97, 1171–1182. [Google Scholar]
  23. Sriskandakumar, S. Cyclic Loading Response of Fraser River Sand for Validation of Numerical Models Simulating Centrifuge Tests. Master’s Thesis, University of British Columbia, Vancouver, BC, Canada, 2004. Available online: https://open.library.ubc.ca/cIRcle/collections/ubctheses/831/items/1.0063399 (accessed on 15 April 2020).
  24. Nong, Z. Liquefaction Characteristics of Nakdong River Sand Using Cyclic Triaxial and Simple Shear Tests. Ph.D. Thesis, Kyungpook National University, Daegu, South Korea, 2020. Available online: https://dcollection.knu.ac.kr (accessed on 3 June 2020).
  25. Youd, T.L.; Idriss, I.M. Liquefaction resistance of soils: Summary report from the 1996 NCEER and 1998 NCEER/NSF workshops on evaluation of liquefaction resistance of soils. J. Geotech. Geoenvironmental Eng. 2001, 127, 297–313. [Google Scholar] [CrossRef] [Green Version]
  26. National Earthquake Comprehensive Information System (NECIS). Available online: http://necis.kma.go.kr/ (accessed on 23 September 2019). (In Korean).
  27. Korea Building Code; Architectural Institute of Korea: Seoul, Korea, 2016; Available online: http://aikkbc.or.kr (accessed on 6 May 2020).
  28. Dreger, D.; Beroza, G.C.; Day, S.M.; Goulet, C.A.; Jordan, T.H.; Spudich, P.A.; Stewart, J.P. Validation of the SCEC Broadband Platform V14.2 Simulation Methods Using Pseudospectral Acceleration Data. Seismol. Res. Lett. 2015, 86, 1. [Google Scholar] [CrossRef]
  29. Chowdhury, K.H. Evaluation of the State of Practice Regarding Nonlinear Seismic Deformation Analyses of Embankment Dams Subject to Soil Liquefaction Based on Case Histories. Ph.D. Thesis, University of California, Berkeley, CA, USA, 2018. Available online: https://escholarship.org/uc/item/4515d2j1 (accessed on 20 May 2020).
  30. Itasca Consulting Group Inc. Minneapolis, Minnesota. FLAC–Fast Lagrangian Analysis of Continua, Version 7.0, Software. 2011. Available online: https://www.itascacg.com/software/flac (accessed on 30 March 2020).
  31. EduPro Civil Systems, Inc. Sammamish, Washington DC, 2018. ProShake, Version 2.0, Software. Available online: http://www.proshake.com/PS2.0Educational.html (accessed on 8 June 2020).
  32. Lee, J.; Hwang, J.; Son, M.; Son, B.S.; Oh, J.; Lee, H. Mineral Compositions and Distribution in the Drilling Cores from the Miocene Pohang Basin, Korea. J. Miner. Soc. Korea 2017, 30, 113–126. [Google Scholar] [CrossRef]
  33. Integrated DB Center of National Geotechnical Information. 2015, SPT Database. Available online: http://www.geoinfo.or.kr (accessed on 15 May 2015).
  34. Mun, G.Y. A Study on the Effect of Relative Density and Particle Size Distribution on the Liquefaction Resistance Strength of Sand in Pohang Liquefaction Region. Master’s Thesis, Pusan National University, Pusan, Korea, 2018. [Google Scholar]
  35. Park, S.S.; Nong, Z.; Choi, S.G.; Moon, H.D. Liquefaction Resistance of Pohang Sand. J. Korean Geotech. Soc. 2018, 34, 5–17. (In Korean) [Google Scholar] [CrossRef]
  36. Morita, T.; Iai, S.; Liu, H.; Ichii, K.; Sato, Y. Simplified Method to Determine Parameter of FLIP. In Technical Note of the Port and Harbor Research Institutive; Japan Ministry of Transport: Chiyoda, Tokyo, Japan, 1997. [Google Scholar]
  37. Iai, S. Seismic Design Guidelines for Port Structures; A.A. Balkema Publishers: Lisse, The Netherlands; Abingdon, UK; Exton, PA, USA; Tokyo, Japan, 2000. [Google Scholar]
  38. Seed, H.B.; Wong, R.T.; Idriss, I.M.; Tokimatsu, K. Moduli and damping factors for dynamic analyses of cohesionless soils. J. Geotech. Eng. 1986, 112, 1016–1032. [Google Scholar] [CrossRef]
  39. Lysmer, J.; Kuhlemeyer, R.L. Finite dynamic model for infinite media. J. Eng. Mech. Div. 1969, 95, 859–878. [Google Scholar]
  40. Roesset, J.M.; Ettouney, M.M. Transmitting boundaries: A comparison. Int. J. Numer. Anal. Methods Geomech. 1977, 1, 151–176. [Google Scholar] [CrossRef]
  41. Jaky, J. The coefficient of earth pressure at rest. J. Soc. Hung. Archit. Eng. 1993, 30, 647–666. [Google Scholar]
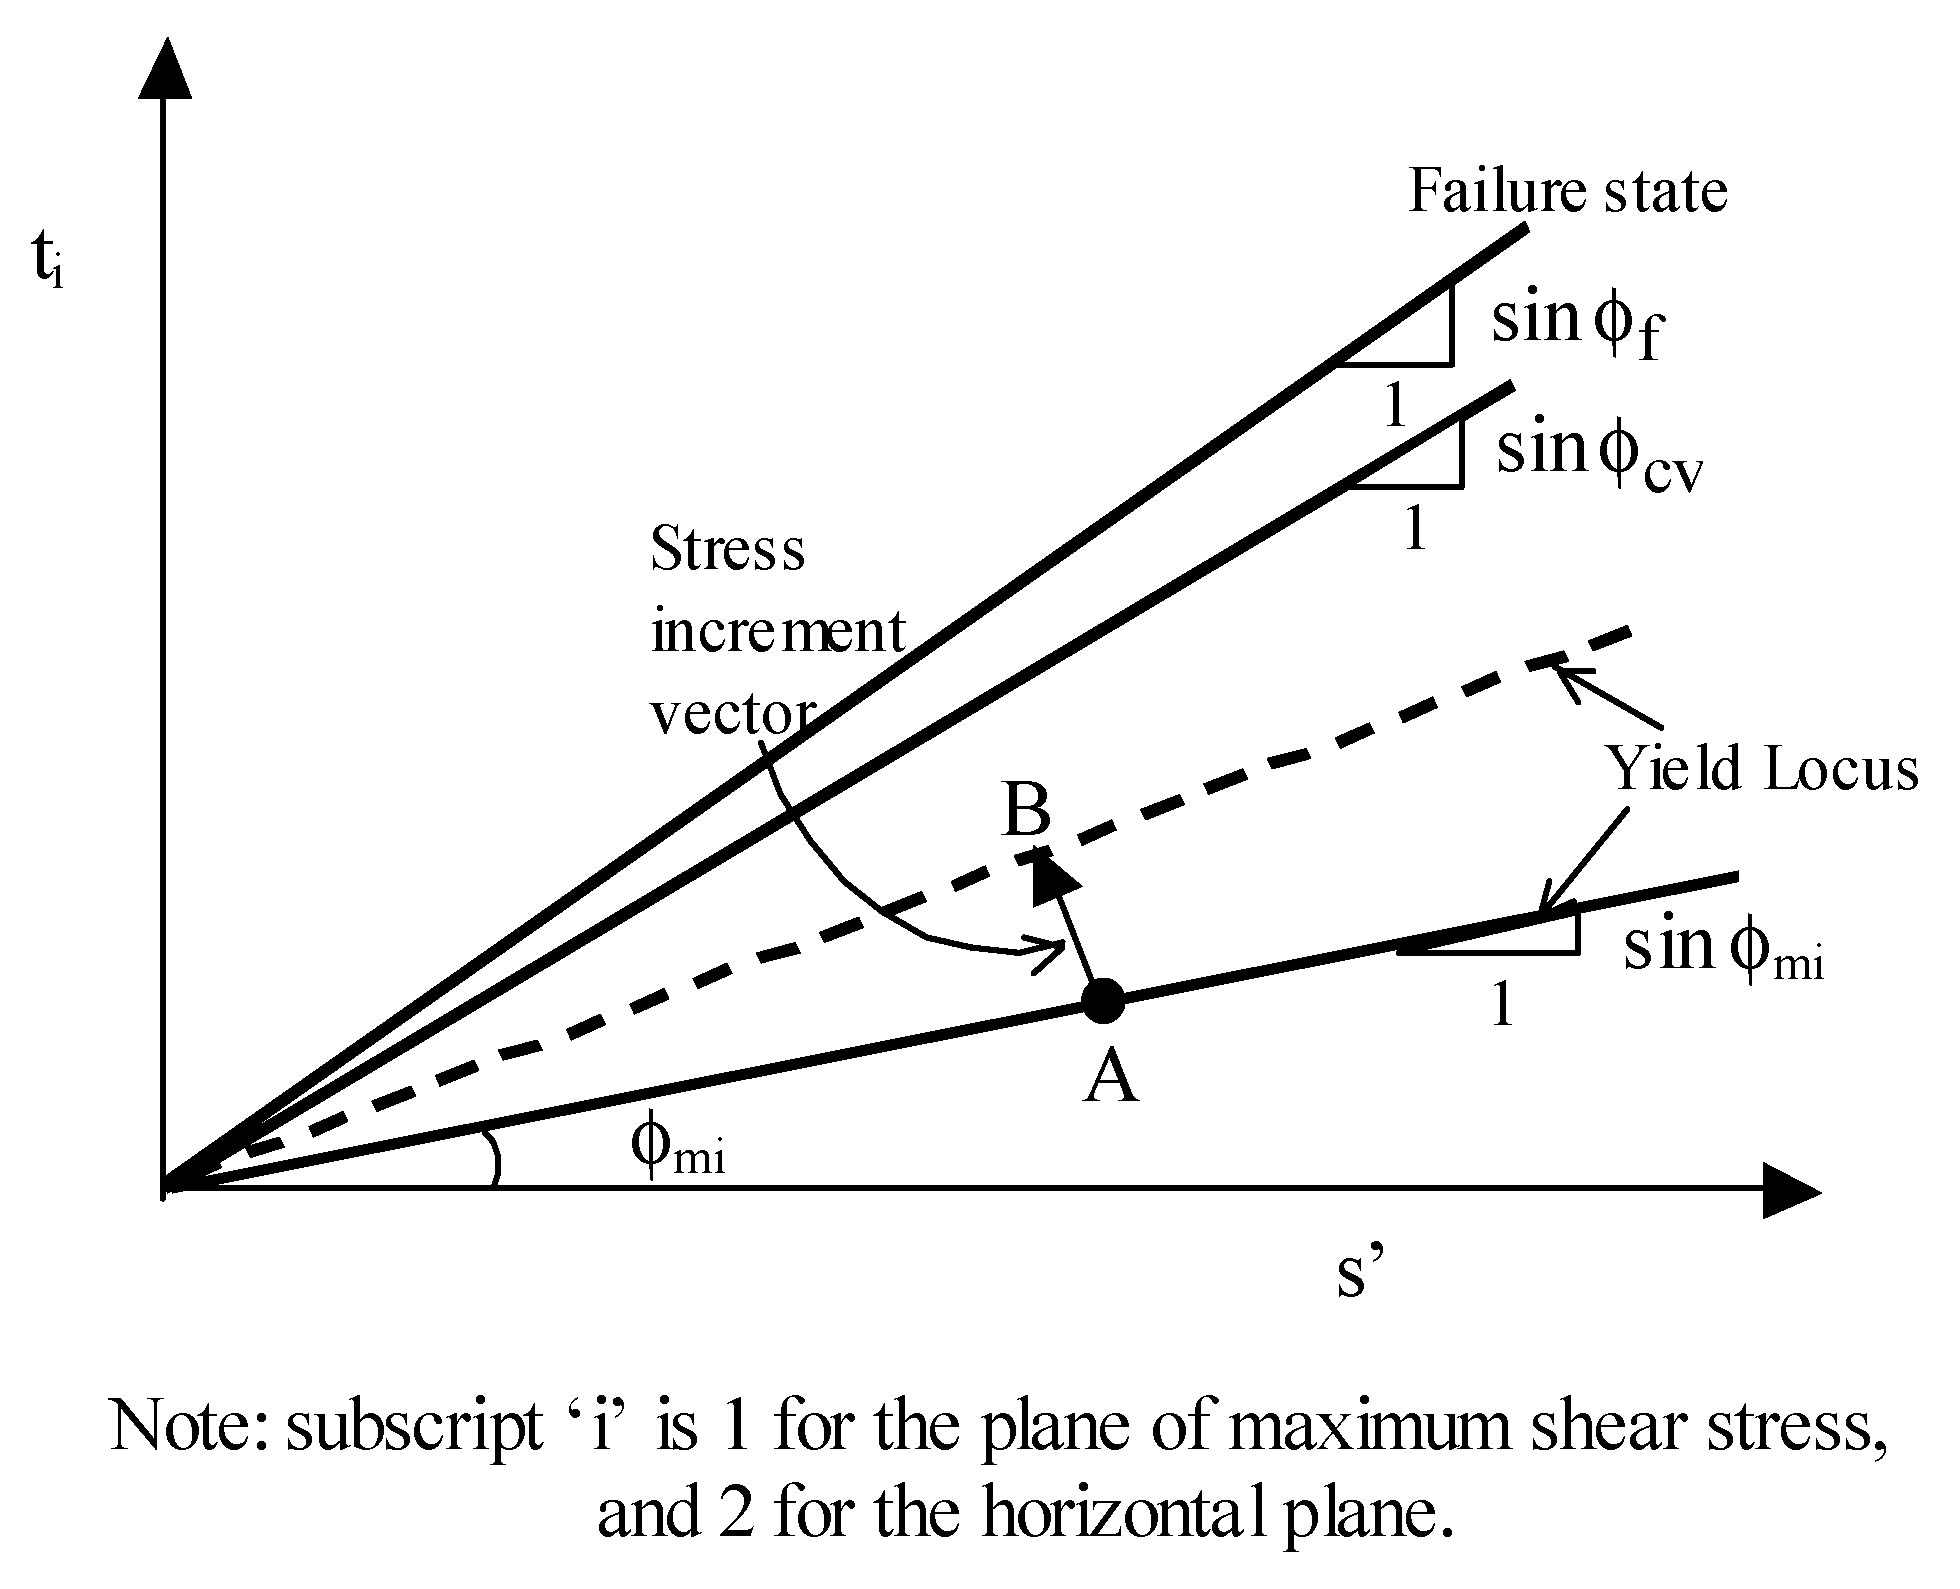
Figure 1. Yield locus of the UBCSAND2 model.
Applsci 10 05424 g001
Figure 2. (a) Schematic of shear stress–strain relationship, and (b) modified shear stress during unloading and reloading.
Applsci 10 05424 g002
Figure 3. Hardening rule of the UBCSAND2 model.
Applsci 10 05424 g003
Figure 4. Relationship of number of cycles to liquefaction (Nliq) and cyclic stress ratio (CSR) from cyclic direct simple shear (CDSS) test results under σv0 = 100 kPa.
Applsci 10 05424 g004
Figure 5. Comparison of the UBCSAND2 model for loose Pohang sand and laboratory CDSS test at CSR = 0.14, σv0 = 100 kPa, and α = 0.0 in the variations of (a) stress path, (b) shear stress–strain curve, (c) excess pore water pressure generation, (d) shear strain and number of cycles to liquefaction.
Applsci 10 05424 g005
Figure 6. Comparison of the UBCSAND2 model for dense Pohang sand and laboratory CDSS test at CSR = 0.14, σv0 = 100 kPa, and α = 0.0 in the variations of (a) stress path, (b) shear stress–strain curve, (c) excess pore water pressure generation, (d) shear strain and number of cycles to liquefaction.
Applsci 10 05424 g006
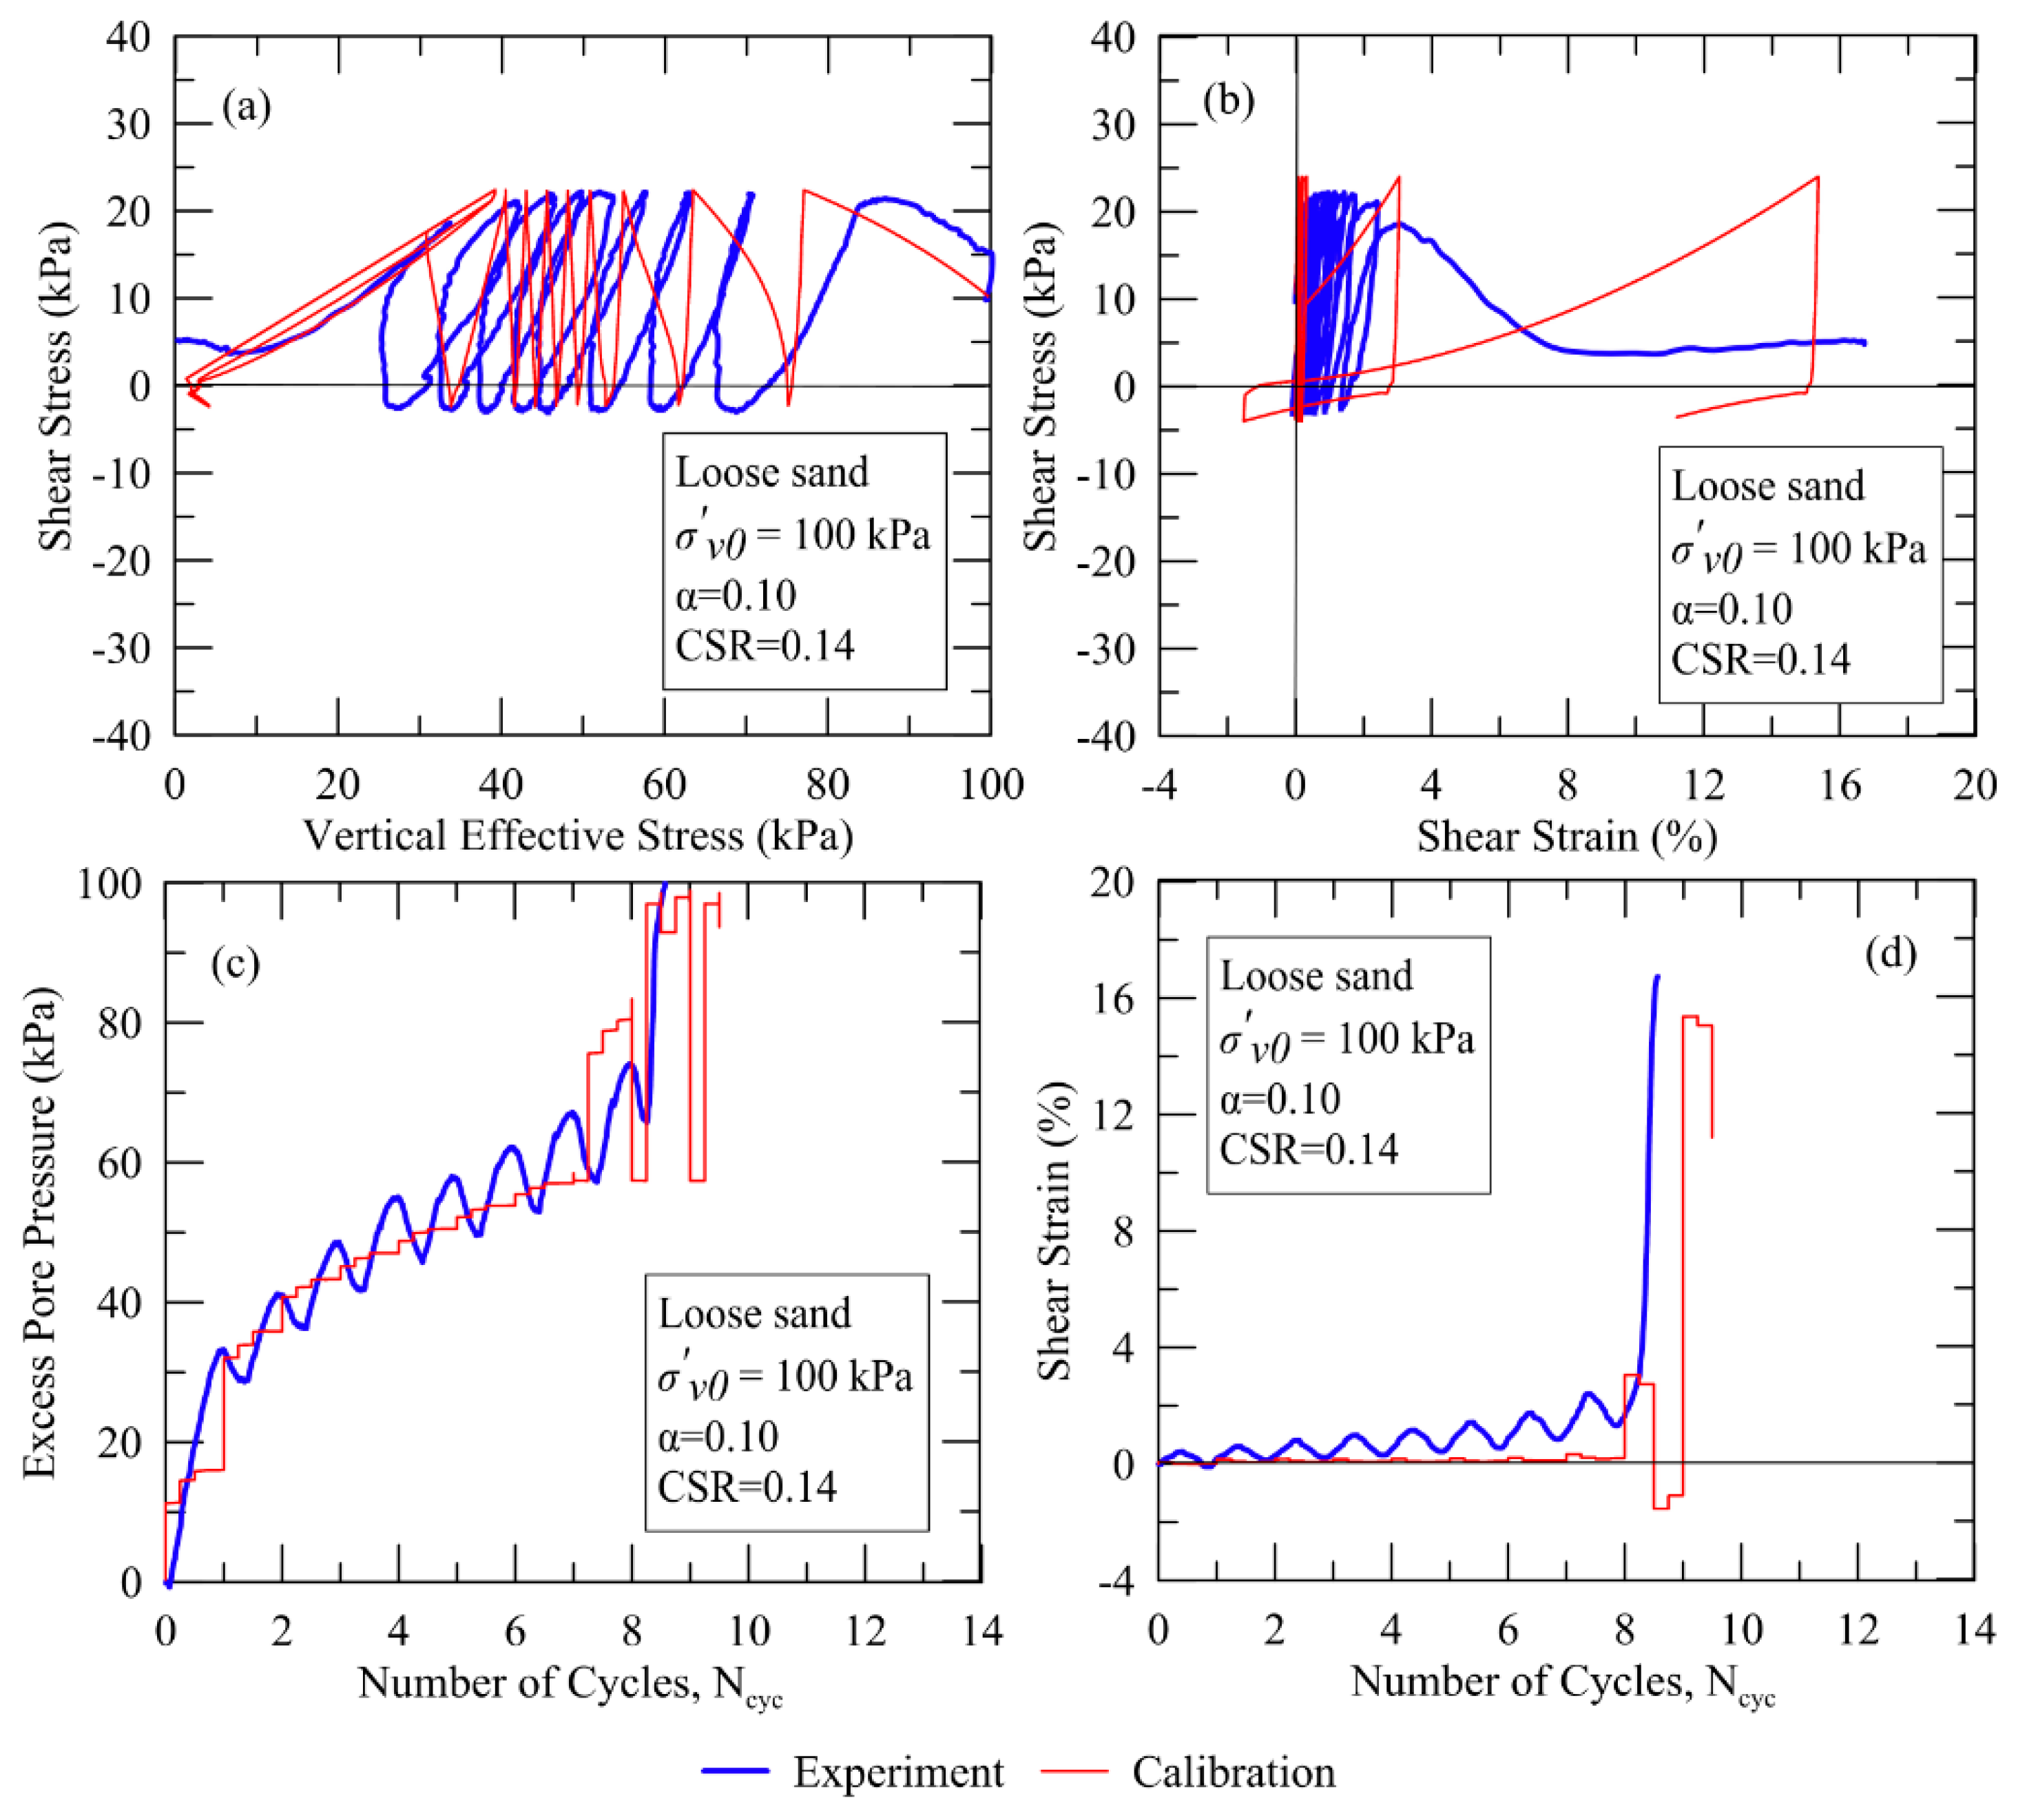
Figure 7. Comparison of the UBCSAND2 model for loose Pohang sand and laboratory CDSS test at CSR = 0.14, σv0 = 100 kPa, and α = 0.1 in the variations of (a) stress path, (b) shear stress–strain curve, (c) excess pore water pressure generation, (d) shear strain and number of cycles to liquefaction.
Applsci 10 05424 g007
Figure 8. Comparison of the UBCSAND2 model for dense Pohang sand and laboratory CDSS test at CSR = 0.14, σv0 = 100 kPa, and α = 0.1 in the variations of (a) stress path, (b) shear stress–strain curve, (c) excess pore water pressure generation, (d) shear strain and number of cycles to liquefaction.
Applsci 10 05424 g008
Figure 9. CSRNliq curves obtained from the UBCSAND2 model for Pohang sand and laboratory CDSS tests.
Applsci 10 05424 g009
Figure 10. Locations of the Youngil-man port, liquefaction observations, and seismic motion recording stations relative to the epicenter of the 2017 Pohang earthquake.
Applsci 10 05424 g010
Figure 11. Estimated peak ground acceleration (PGA) at Youngil-man port from the relationship between recorded PGAs and distances from the epicenter of different recording stations.
Applsci 10 05424 g011
Figure 12. One-dimensional analysis considering deconvolution procedure at Youngil-man port conducted in PROSHAKE: (a) soil layers and its distribution, (b) standard penetration test (SPT) profile, (c) shear velocity (Vs) profile, and (d) maximum shear modulus (Gmax) profile along the depth.
Applsci 10 05424 g012
Figure 13. Extracted ground motions considering deconvolution procedure at Youngil-man port conducted in PROSHAKE: (a) locations of the extracted motions, (b) motion at depth of 50 m, (c) motion at free-surface, and (c) motion at a depth of 25 m.
Applsci 10 05424 g013
Figure 14. Information of Pohang earthquake’s ground motion at Youngil-man port extracted and compiled from the equivalent analysis (PROSHAKE) at 25 m: (a) acceleration-time history, (b) velocity–time history, (c) displacement–time history, and (d) power spectra of acceleration.
Applsci 10 05424 g014
Figure 15. Youngil-man port cross section for FLAC modeling and analysis (dimension unit in meters).
Applsci 10 05424 g015
Figure 16. Modulus reduction and damping ratio curves for (a) silty sand, (b) sediment, (c) weather rock, and (d) gravel obtained from PROSHAKE analysis.
Applsci 10 05424 g016
Figure 17. Initial stress state at the start of the earthquake. (a) Initial horizontal stress ratio (K0 = σ′x/σ′y) contours (dimension unit in meters); (b) initial static shear stress ratio (α = τxy/σ′y) contours (dimension unit in meters).
Applsci 10 05424 g017aApplsci 10 05424 g017b
Figure 18. Maximum excess pore water pressure ratio (Ru,seis = 1.0 − σ′y/σ′y,i) contours at the end of shaking (dimension unit in meters).
Applsci 10 05424 g018
Figure 19. Excess pore pressure ratio generated during shaking (Ru,seis).
Applsci 10 05424 g019
Figure 20. Displacement at the end of shaking (dimension unit in meters).
Applsci 10 05424 g020
Figure 21. (a) Horizontal displacement (positive values are to the right side, and negative values are to the left side), and (b) settlement of the observed nodes in the analysis.
Applsci 10 05424 g021
Figure 22. Maximum shear strain at the end of shaking contours (scale up to 10%, dimension unit in meters).
Applsci 10 05424 g022
Figure 23. Shear stress–strain relationship of the observed elements in the analysis: (a) element E1, (b) element E2, (c) element E3, and (d) element E4.
Applsci 10 05424 g023
Figure 24. Acceleration responses of the observed nodes in the analysis: (a) input motion, (b) node N2, (c) node N3, and (d) node N4.
Applsci 10 05424 g024
Table 1. Input parameters of the UBCSAND2 model for Pohang sand by CDSS tests.
ParametersGeneric ParametersCalibration
FunctionValuesLooseDense
(N1)60Normalized, corrected SPT blow countsVaries12.5016.50
CDrCorrelation factor between (N1)60 and DrConstant4646
DrRelative density[(N1)60/CDr]0.50.530.61
ϕcvConstant volume friction angle33°33.0033.00
ϕfPeak friction angleϕcv + (N1)60/10 + max(0, ((N1)60 − 15)/5)34.2534.95
kGeElastic shear modulus number21.7 × 20 × (N1)600.33310061104
kBeElastic bulk modulus number0.7 × kGe704773
kGpPlastic shear modulus numberkGe (N1)602 × 0.003 + 1005721002
meElastic shear exponent0.50.500.50
neElastic bulk exponent0.50.500.50
npPlastic shear exponent0.40.400.40
RfFailure ratiomin(1.1 × (N1)60−0.15, 0.99)0.750.72
aFactor for hfac1 calculation1.05 − 0.03 × (N1)60 + 0.04 × [(N1)60]2 − 0.000185 × [(N1)60]3 + 2.92E − 6 × [(N1)60]41.011.03
bFactor for hfac1 calculation1.0/{−0.424 − 0.259 × (N1)60 + 0.00763 × [(N1)60]2}−0.4−0.38
hfac1Factor of primary hardenerA × (σv0/Patm)b1.01/0.77 (*)1.03/0.79 (*)
hfac2Factor of secondary hardener1.01.001.00
hfac3Factor of dilation hardener1.01.001.00
anisofacFactor of anisotropic plastic response1.01.001.00
ChCyclic hardening8.33 × (Dr)2 − 5.0 × Dr + 2.22921.892.22
Note: σv0 = initial vertical effective stress, and Patm = atmospheric pressure (≈100 kPa). (*) = the numerator is the value at σv0 = 100 kPa when the denominator presents the values at σv0 = 200 kPa.
Table 2. Information of the four recording stations.
StationLocationDistance from Epicenter (km)Site ClassificationPGA (g)
ENNSEWUD
PHA2129.37080°36.19290°9SB0.2712000.2432830.140000
CHS129.08811°36.18113°26SB0.0278000.0212000.01900
DKJ129.10892°35.94675°29SB0.0483000.025000.042800
HAK129.50037°35.92955°23SB0.0364000.0267000.030300
Note: E = east, N = north, NS = north–south, EW = east–west, UD = up–down, PGA = peak ground acceleration.
Table 3. Material properties used.
Materialsγd (kN/m3)N1(60)ModelParameters for Non-Liquefied SoilsRemarks
G
(kPa)
B
(kPa)
c
(kPa)
ϕ
(deg)
k
(m/s)
ν
Silty sand 119.0015.00UBC2------Liquefied
Silty sand 219.0015.00UBC2------Liquefied
Sediment19.0020.00M-C1.43 × 1053.72 × 1050.0030.01 × 10−50.33Non-liquefied
Weathered rock20.6050.00M-C2.85 × 1057.43 × 1050.0030.01 × 10−40.25Non-liquefied
Riprap18.0050.00M-C2.49 × 1056.49 × 1050.0040.01 × 10−10.33Non-liquefied
Gravel20.0050.00M-C7.22 × 1057.22 × 1050.0033.01 × 10−40.33Non-liquefied
Concrete23.00-elastic1.00 × 1071.67 × 107---0.25Elastic
Steel pipe pile78.5-elasticE = 2.1 × 10⁸ kPa, ν = 0.2, A = 0.01671 m2, I = 7.3 × 10⁻⁵ m4, D = 1.884 mElastic
Note: γd = dry unit weight of, N1(60) = corrected SPT number of blow counts, G = shear modulus, B = bulk modulus, c = cohesion, ϕ = friction angle, k = hydraulic conductivity, ν = Poisson’s ratio, UBC2 = UBCSAND2 model, M-C = Mohr–Coulomb model, E = Young’s modulus, A = area of cross-section, I = inertia moment, and D = perimeter.