Abstract
Frosting and fogging of automobile windshields is a common problem that emerges in daily driving. It is important and essential to quickly and completely defrost the windshield for safety purposes. In this study, a three-dimensional mathematical model was applied to investigate the flow distribution and flow characteristics on the windshield of a medium-size Model N800 truck. The simulation results were first compared with experimental data. The results showed that the simulation model could reliably predict the defrosting performance on the windshield. This model was then used to optimize the design of the defrosting duct that comprised the main part of the defroster. It was found that the guide plate and outlet position of the defrosting duct were the two major factors affecting the defrosting performance. Therefore, the guide plate was first optimized and the defrosting performance was analyzed. The results showed that the average pressure loss dropped by 21.56%, while the defrosting efficiency at the front white zone was improved to 89%. The position of the outlet of the airflow was further studied. The results showed that the defrosting efficiency at the front zone could be further improved to 99%.
1. Introduction
Frosting and fogging of automobile windshields are major problems that commonly occur in vehicles during daily driving. If a vehicle has a poor defrosting capability, the front windshield’s occlusion will interfere with the driver’s line of sight and could lead to a potential accident [1]. It is important to comprehensively understand the structure of the defroster system to test its capacity to defrost the front windshield and side window.
In automobile defrosting systems, the heated air of the air conditioning system defrosts the automobile windshield through the defrosting duct. Air passing through the defrosting air duct inevitably causes the distribution of air on the windshield [2]. Therefore, it is necessary to study the air flow distribution and velocity distribution on the windshield of the defrosting duct, reasonably distribute the air flow in the defrosting duct, and achieve the best windshield defrosting efficiency.
Computational fluid dynamics (CFD) techniques allow researchers to use mathematical models to simulate real systems and hence reduce the experimental cost in laboratory tests [3]. AbdulNour et al. [4] used the CFD general-purpose software package Fluent/UNS to numerically evaluate the defrosting performance of a vehicle. The velocity field of the defroster near the windshield was quantified, and the defrosting performance of the windshield was predicted accordingly. Aroussi et al. [5] performed a relative assessment of fluid flow, heat transfer, and defrost modes. YueYang et al. [6] focused on the process of condensation and defogging in the cabin of a truck model. Where the outside heat dissipation and internal air conditioning system were considered together, it was found that the mass flow rate, inlet, temperature, and humidity could influence the dewing film thickness directly at the windshield. Sugano et al. [7] proposed a three-dimensional (3D) airflow analysis model and verified it using experimental data. This model was used to predict defrosting performance under different working conditions. AbdulNour et al. [8] conducted a numerical simulation of the surface flow of a defroster and windshield to simultaneously obtain the direction and value of the airflow velocity. Taro Ono et al. [9] performed a transient numerical simulation of the interior of a vehicle and analyzed the relationship between its performance and air supply temperature and flow. A control strategy for the air temperature and flow distribution is derived by considering the transient and steady-state conditions.
There have been many other valuable contributions to these studies in the literature. Kitada et al. [10] used the CFD software Star-CD to numerically simulate the defogging performance of transient vehicles. Liu et al. [11] presented a method to solve condensation problems by using a CFD method. It was found that proper exhaust port location helped reduce the risk of frost. However, the specific parameters were not described, so this study optimized the position of the exhaust port and the geometric parameters to make the defrost effect more obvious. Kai et al. [12] proposed a new condensation model for CFD simulation. Compared with the existing condensation model, this model had higher accuracy. Karim et al. [13] improved the defrosting performance of automotive windshields by adjusting their defroster duct structures. Xu et al. [14] conducted a joint numerical simulation of a blown air duct. By adding a guide vane in front of the inlet of the blown air duct and changing the cross-sectional area of the inlet surfaces of the four air outlets, they optimized the air volume and flow rate of the blown air duct exit for uniformity and noise reduction. Yang et al. [15] evaluated various duct design configurations by analyzing the defrosting mass flow distribution at each outflow and observing the flow structure near the windshield and left front window. Serrano et al. [16] proposed that the condensation of the body flow produced by the mixing of airflow at different temperatures and humidity was a thermodynamic process, which proved the commercial application of CFD simulation. Li et al. [17] ensured reasonable wind division by optimizing an original blown air duct. Chen et al. [18] used CFD software to numerically simulate an automobile air conditioning duct with equal inlet areas for the balanced distribution of air volume in each duct. Li et al. [19] used the CFD method to establish a typical car air duct model with a complex structure. The main part of the air duct was analyzed in Fluent to optimize the uniformity of the air outlets of the central air duct.
However, in the above studies, the influence of the defrost duct design on the defrosting performance and the optimization of the defrost duct were rarely reported. In this study, a 3D CFD model was applied to investigate the performance of a defroster in a medium-size Model N800 truck. The inner surface of the windshield, the inner surface of the vehicle, and the air duct were integrated into a simulation domain. The pre-processing software was adopted to generate a 3D volume mesh in this calculation domain, then the appropriate calculation method and turbulence were selected for further analysis. The simulation model was first verified using the experimental data and then used to evaluate the performance of the defroster. A new structure of the defroster was proposed and its performance was compared with that of the commercial defroster design applied in the medium-size Model N800 truck.
2. Mathematical Model
2.1. Geometric Model and Computational Grid
Figure 1 shows a 3D computational domain model of a truck cabin consisting of the truck cabin body, front windshield, side windshield, and defrosting duct. Defrosting area A represents the defrosting area in front of the driver, and defrosting area B represents the total defrosting area of the windshield. The inner surface of the windshield and defrosting duct were peeled off to form a closed computing area with the vehicle body. Figure 2 shows the geometric model of the defrosting duct. The simplified geometric model was also meshed to generate 2D and 3D volumetric meshes in the computational domain. Figure 3 shows the local meshes of the defrosting duct surface.
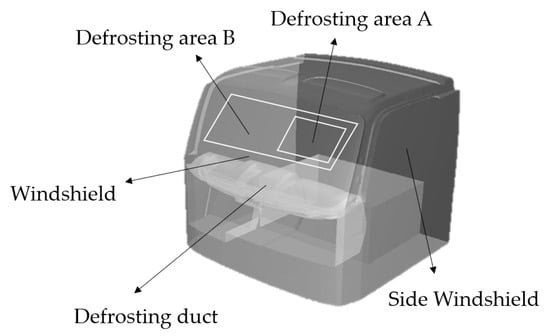
Figure 1.
Three-dimensional computation domain model of the truck cabin.
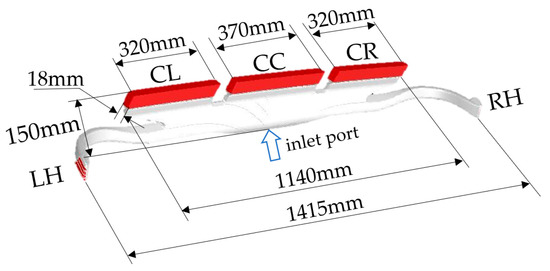
Figure 2.
A three-dimensional computational model of the defrosting duct. LH (left hand), CL (center left), CC (center center), CR (center right), RH (right hand).
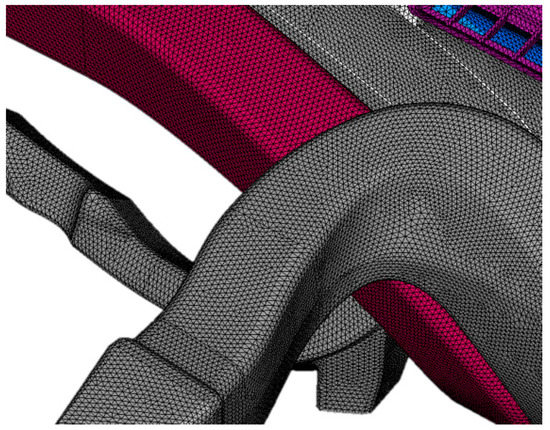
Figure 3.
Local meshes of the defrosting duct surface.
2.2. Numerical Model
2.2.1. Turbulence Model
Calculation in this study involved the steady numerical simulation of the air conditioning and defrosting duct, where the computational fluid was incompressible. The Shear Stress Transfer k-ω (SST k-ω) two-equation turbulence model was used for the numerical study. The continuity equation, momentum equation, and turbulence model are presented below:
(1) Continuity equation:
where is the component of the average velocity in the i direction (i = x, y, z), m/s.
(2) Momentum equation:
(3) k equation:
(4) ε equation:
where is the component of the average velocity in the j direction (i = x, y, z), m/s; k is the kinetic energy; ε is the dissipation; ρ is the density and is the viscosity; P is the pressure, Pa; and the constant , , , , .
2.2.2. Defrosting Model
This study used the enthalpy equation to solve the transient problem of windshield defrosting. The cyclic solution of the equation could obtain the temperature and heat flow of the windshield. In each step, the total energy from heat conduction, convection, and radiation (usually negligible) was calculated and compared with the melting heat required for the frost layer to melt. Suppose that when the total energy is the same as the heat of melting, the frost layer begins to melt. When the total energy in the grid cell is enough to melt all the frost into water, it is considered that there is no frost in the grid cell. In this study, the ice–water solid–liquid mixture was treated as a fluid, and the liquid phase fraction β was defined according to the solid temperature TS and the liquid temperature TL to determine the phase change status of each unit. This model is simplified; in the phase change process, the molten water moves slowly, and the static ice–water mixture is directly used to approximate the simulation. In this study, the heat transfer of the heating curve (Figure 4) is introduced to solve the energy Equations (7)–(10) of the temperature field to obtain the frost layer distribution on the windshield.
where H is enthalpy, J/kg; href is reference enthalpy, J/kg; Tref is reference temperature, °C; Cp is constant pressure specific heat, J/(kg·K); and ΔH is latent heat, J/kg.
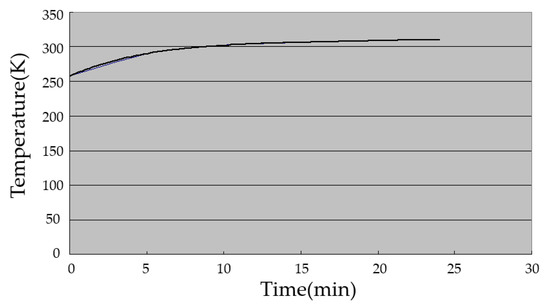
Figure 4.
HVAC heating curve of air temperature.
Define the liquid phase fraction β as:
The energy equation for the defrost model:
where v is the fluid velocity, m/s; and k1 is the thermal conductivity, W/(m·K);
where β is the liquid phase fraction, δ is a very small constant (0.001) to avoid division by 0, Am is the area constant, and ϕ is the solved turbulence (k, ε, ω, etc.).
2.3. Boundary Condition
Three boundary conditions were defined: inlet boundary, outlet boundary, and windshield surface boundary conditions. They are listed in Table 1.

Table 1.
Boundary conditions.
(1) Inlet boundary condition: the velocity inlet boundary condition (velocity-inlet) was used, and the inlet speed was determined according to the flow rate of the blown surface and the defroster duct inlet area. The inlet air temperature was introduced according to the Heating, Ventilating and Air Conditioning (HVAC) heating curve, as shown in Figure 4, and the initial temperature was 253 K. The HVAC heating curve was measured during the experiment.
(2) Outlet boundary condition: a pressure outlet (pressure-outlet) was applied. The pressure at the outlet was equal to the working pressure (101.325 kPa).
(3) Windshield surface boundary condition: the glass surface was defined as a stationary wall, and the initial temperature condition of the glass surface was 255 K. The initial thickness of frost was set to 1 mm.
3. Model Validation
Figure 5 shows a qualitative comparison between the simulation results and experimental data for a medium-size Model N800 truck. It shows that the first area to defrost was near the outlet nozzle of the defrost duct from the bottom of the windshield and generated a few defrosting spots next to the outlet nozzles. These defrosting spots gradually expanded, and the defrosting areas became larger as the defrosting continued. For comparison of the defrosting area results at 20 min, the defrosting area of the CFD simulation result accounted for 46% of the total windshield area. The defrosting area of the experiment was calculated by drawing the defrosting area diagram, and the defrosting area of the experimental results accounting for the total windshield area was about 48%. The simulated defrosting flow distribution agreed well with the experimental distributions. This indicates that the model can be used to evaluate the defrosting performance on the windshield.
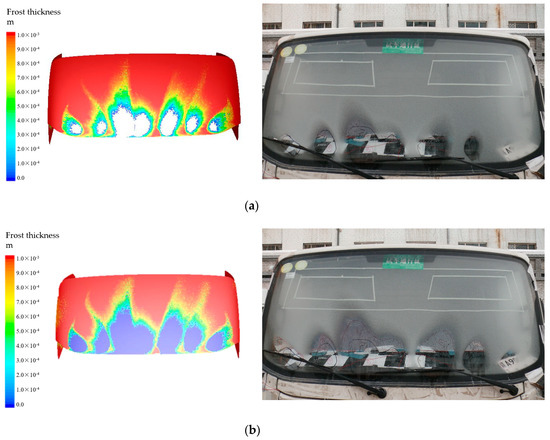
Figure 5.
Qualitative comparison of the defrost effect between the numerical results and experimental data: (a) 15 min defrosting effect; (b) 20 min defrosting effect.
4. Results and Discussion
4.1. Performance Evaluation of the Existing Defrosting Duct System
Table 2 shows the airflow distribution, outlet volume flow rate, outlet air speed, and pressure loss at the outlet of the defrost duct based on the specification of the truck. The total air volumetric flow was 250 CMH (cube meters per hour). It shows that around 48% of the air flow was from the center outlet and another 52% of the air flow was almost equally distributed to the other four outlets, with a slightly lower distribution in the side outlets. It was also found that the difference of the pressure losses of the air flow at the five outlets was very small. This indicates that the design of the defrost duct is based on the equal pressure loss method in this truck.
Table 2.
Defrosting duct calculation results.
Figure 6 shows the defrosting performance duct for 25 min, which is the test time required in the national standard (GB11555-2009). It can be seen that the defrosting performance was not ideal since the frost did not melt at the two triangle zones as highlighted in the figure (black circle). These two positions could affect the driver’s vision. These two zones were found mainly due to the low air volume flow rate and the low speed at the air outlets center left (CL) and center right (CR).
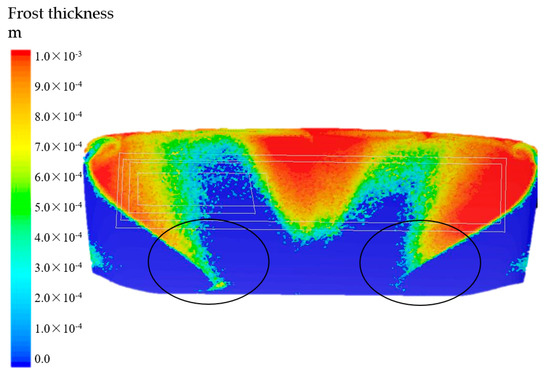
Figure 6.
Frost thickness of the windshield surface at 25 min.
4.2. Optimization of the Defrosting Air Duct
As discussed above, the poor defrosting performance was mainly due to the low air volume flow rate and air velocity at the outlet nozzle CL and CR. To improve this, the first step was to optimize the position of the guide plate in the defrost duct using the pressure loss reduction simulation. Figure 7 shows the geometry of the defrosting duct before and after optimization; in order to show the position change of the defrosting air duct deflector more clearly, Figure 7 is only a cross-sectional view of the central area of the defrosting air duct at the center thickness (outlet center center; CC), where the black line is the position of the guide plate before optimization, the yellow line is the position of guide plate after optimization, the green line is the edge line of the defrosting duct, and the blue line is the auxiliary line for modeling.
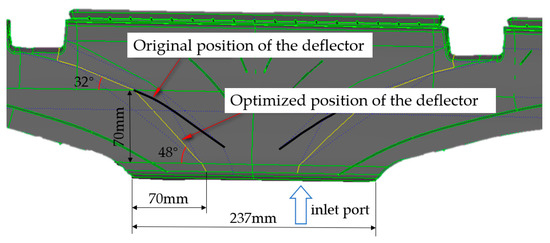
Figure 7.
Original and optimized wind duct geometry.
The position of the deflector was extended to the entrance of the defrosting air duct, which avoided the pressure loss of the original defrosting air duct at the deflector due to the gas shunt. Through continuous optimization, the angle of the deflector was finally adjusted to 48°, which avoided the generation of the vortex, making the structure of the deflector play a role in guiding the air flow, and minimizing the pressure loss caused by the vortex.
Figure 8 shows the pressure losses of the air flow in the defrosting duct before and after optimization. It shows that the pressure loss of the air flow at the outlets in the optimized defrosting duct was significantly lower than that in the original duct. The average reduction in pressure loss at each outlet nozzle was 21.56%. By comparing the positions of the guide plates in Figure 6, the optimized model could increase the air volume flow rate at the outlets, CL and CR, and hence increased the defrosting performance, as shown in Figure 8. The figure also indicates that the pressure loss at the five outlets was different, as the design was based on the minimum pressure loss method.
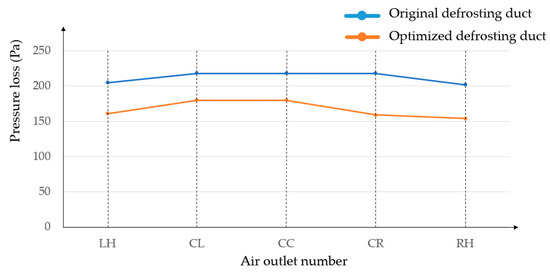
Figure 8.
Comparison of pressure loss before and after optimization.
Figure 9 shows the distribution of frost thickness on the glass surface after defrosting for 25 min in the optimized duct. It shows that 89% of the windshield was defrosted. However, the defrosting effect of the side window glass was still not ideal. After 25 min of defrosting, the defrosting area of the side window was about 80%. This may have been caused by the low air flow rate and velocity distribution of the left hand (LH) and right hand (RH) defrosting air ducts, which requires further optimization of the defrosting air duct.
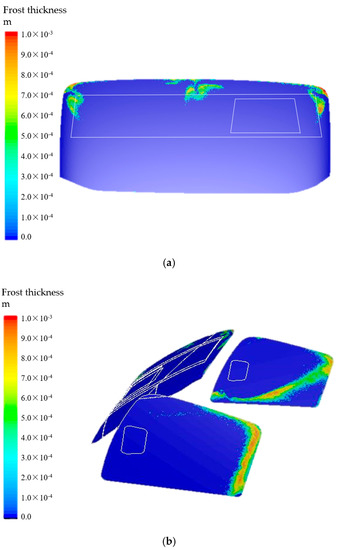
Figure 9.
Frost thickness of windshield surface at 25 min after optimization. (a) Front windshield; (b) side windshield.
In addition to the optimization of the guide plate in the defrosting duct, Figure 10 shows the further improvement of the defrosting duct by optimizing the outlet structure, which was also based on pressure drop method simulation. By changing the outlet structure of the defrost duct, the injection angle of the jet flow could be changed, affecting the air distribution on the windshield. As shown in Figure 10a,b, the optimized model increased the horizontal angle between the duct and the windshield in the middle of the defrosting duct, and changed the angle and direction of the jet flow, to improve the airflow distribution on the windshield and hence improve the defrosting performance.
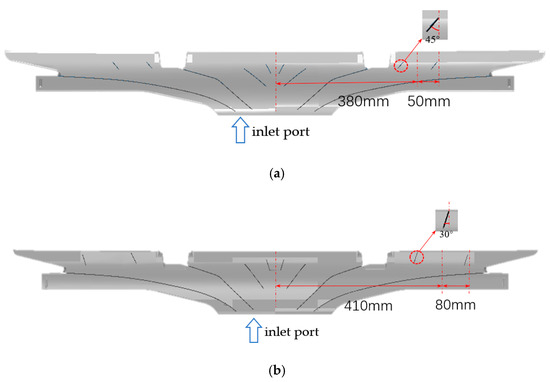
Figure 10.
Defrosting duct. (a) Original defrosting duct; (b) optimized defrosting duct.
Figure 11 shows the comparison of the velocity distribution of the frost layer before and after optimization after defrosting for 25 min. In the original duct before optimization, an obvious “V” (highlighted area in Figure 10a) shape appeared on the windshield with slow defrosting. This V shape disappeared in the optimized defrosting duct. This was mainly due to the increase in air flow distribution at the outlets CL and CR, as shown in Table 3. Air flow distribution in the CC outlet decreased from 47.9% to 37.1% while the air distribution at the CL and CR outlets increased from 13.6% to 20% and from 14.1% to 17.1%, respectively. This increase in the air flow rate at air outlets CL and CR in the optimized model improved the defrosting performance. Furthermore, the purpose of the deflector plate is to diffuse the airflow over the windshield to both sides, thus achieving better defrosting performance on each side of the windshield. The air deflector of the original model was located close to the CC air outlet, and the separation distance was close, so that the air volume of the CL and RL air outlets could not be evenly distributed on the windshield, so that the original air channel had a wind speed of less than 1.5 m/s in a V-shaped area. The optimized model made the air volume of the air outlet more uniform, and reduced the angle of the deflector to 30°, which increased the airflow velocity on the windshield, making the airflow velocity at the V-shaped area and the side windshield increase and improve the defrosting performance of the defrosting air duct, as shown in Figure 11.
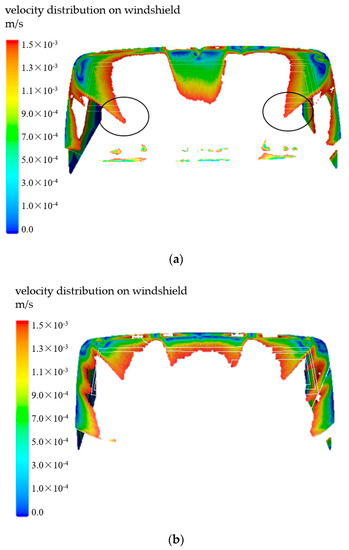
Figure 11.
Velocity distribution on the windshield surface at 25 min: (a) Original model; (b) optimized model.
Table 3.
Defrosting duct flow distribution calculation results.
Figure 12 shows the frost thickness distribution on the windshields. By reducing the angle between the deflector and the horizontal outlet, and the position of the deflector, as shown in Figure 9, the defrosting flow could be more evenly distributed on the windshield, as shown in Table 2. Therefore, the defrosting performance was improved. It is obvious that defrosting efficiency increased. Comparing Figure 9 and Figure 12, the defrosting efficiency in the field of view of the white box in Figure 8 was about 89% after 25 min defrosting, while it was 99% in Figure 11. This indicates that the change of the outlet structure further improved defrosting efficiency. This provides engineers with useful information in the modification or design of the defrosting duct in the defrosting system for the medium-size Model N800 truck and similar vehicles.
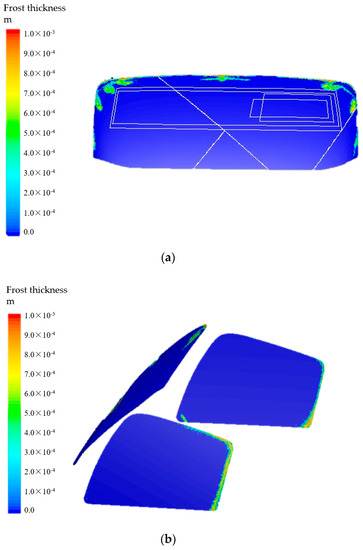
Figure 12.
Frost thickness distribution on the windshield surface at 25 min after optimization: (a) front windshield; (b) side windshield.
Through the above analysis, the main method to optimize defrosting performance was to optimize the air duct structure through engineering technology and effectively utilize the impact pressure. In order to improve the defrosting performance, the air flow and the position of the defroster outlets should be optimized according to the minimum pressure methods. This study found that the defrosting efficiency could be improved by adjusting the angle of the guide plate and air flow outlet structure. Results showed that pressure losses were reduced, and the defrosting efficiency was improved through the optimization. Although this was only tested in a mid-size truck (N800), the method can be used for all different types of vehicles.
5. Conclusions
A 3D CFD numerical method was applied to investigate the defrosting performance on the windshield of a medium-size Model N800 truck. The defrosting performance of the commercially available defrosting duct system was first analyzed and validated using experimental data. It was found that the defrosting performance of the original system could be improved in order to meet the national standard. About 50% of the air flow distribution was located in the center outlet (CC) and less air flow distribution was located at the CL and CR outlets in the standard design. This caused a frosted zone which affects the driver’s vision.
The duct pressure loss method was then applied to optimize the flow distribution on the windshields. The guide plate position in the ducting system was first optimized. The results showed that the average pressure loss over the five outlets dropped by 21.56%, and the defrosting performance was improved. The defrosting efficiency could reach 89% at the white zone which was directly blocking the driver’s vision. Furthermore, the position of the outlet structure of the defrosting duct was optimized. The results showed that the defrosting efficiency at the white zone was improved from 89% to 99% by optimizing the outlet structure of the defrosting duct.
Author Contributions
Conceptualization, X.Q. and Z.H.; methodology, X.Q.; software, L.J.; validation, W.W.; formal analysis, X.Q.; investigation, X.Q. and L.J.; resources, X.Q.; data curation, X.Q.; writing—original draft preparation, Q.X. and Z.H.; writing—review and editing, X.Q.; visualization, X.W.; supervision, X.W. and Z.H.; project administration, Z.H.; funding acquisition, Z.H. All authors have read and agreed to the published version of the manuscript.
Funding
This research received no external funding.
Conflicts of Interest
The authors declare no conflict of interest.
Abbreviations
| 2D | two-dimensional |
| 3D | three-dimensional |
| CC | center center |
| CFD | computational fluid dynamics |
| CL | center left |
| CMH | cube meters per hour |
| CR | center right |
| HVAC | heating, ventilating and air conditioning |
| LH | left hand |
| RH | right hand |
| Symbols | |
| Am | area constant [-] |
| C1 | constant [-] |
| C2 | constant [-] |
| Cμ | material constant [-] |
| Cp | constant pressure specific heat [J/(kg·K)] |
| H | enthalpy [J/kg] |
| ΔH | latent heat [J/kg] |
| href | reference enthalpy [J/kg] |
| k | kinetic energy [J] |
| k1 | thermal conductivity [W/(m·K)] |
| Tref | reference temperature [°C] |
| TL | liquid temperature [°C] |
| TS | solid temperature [°C] |
| Ui | average velocity in the i direction [m/s] |
| Uj | average velocity in the j direction [m/s] |
| v | fluid velocity [m/s] |
| Greek symbols | |
| β | liquid phase fraction [-] |
| δ | constant [-] |
| ε | dissipation energy [J] |
| ρ | density [kg/m3] |
| ϕ | solved turbulence [J] |
| σε | turbulent Prandtl number of dissipative energy [-] |
| σk | turbulent Prandtl number of kinetic energy [-] |
| νt | turbulent viscosity [m2/s] |
References
- Xiaolan, Z. Performance Analysis of Automotive Windshield Defrosting. Master’s Thesis, Shanghai Jiaotong University, Shanghai, China, 2007. [Google Scholar]
- Guoping, Y.; Huanhuan, Z.; Falong, Z. Improved design of car central air conditioning duct system based on cfd. J. Shanghai Univ. Eng. Technol. 2011, 25, 108–111. [Google Scholar]
- Zhaogang, Q.; Jiangping, C.; Wei, H. CFD Analysis and optimization of automotive air-conditioning duct system. Automob. Eng. 2005, 27, 103–106. [Google Scholar]
- AbdulNour, B.S. CFD prediction of automotive windshield defrost pattern. SAE Pap. 1999, 1, 1203. [Google Scholar]
- Aroussi, A.; Ghani, S.A.; Hassan, A.A.; AbdulNour, B. Assessing the performance of electrically heat windshield. SAE Pap. 2002. [Google Scholar] [CrossRef]
- Yue, Y.; Yuqi, H.; Jisheng, Z. Optimization of the automotive air conditioning strategy based on the study of dewing phenomenon and defogging progress. Appl. Therm. Eng. 2020, 169. [Google Scholar] [CrossRef]
- Sugano, M.; Yamada, T.; Takesue, Y.; Yasuki, T. Numerical analysis of defroster cleaning pattern: Prediction of the airflow near the windshield glass using three-dimensional analysis. JSAE Rev. 1994, 15, 269. (In Japanese) [Google Scholar]
- AbdulNour, B.S.; Foss, J.F. Computational and experimental predictions of automotive windshield flow. In Proceedings of the ASME Fluids Engineering Division Summer Meeting, Vancouver, BC, Canada, 22–26 June 1997. No. FEDSM97-3022. [Google Scholar]
- Ono, T.; Nagano, H.; Shiratori, S.; Shimano, K.; Kato, S. Analysis of defogging performance, thermal comfort, and energy saving for HVAC system optimization in passenger vehicles. E3S Web Conf. 2019, 111, 01033. [Google Scholar] [CrossRef]
- Kitada, M.; Asano, H.; Maruta, Y.; Kataoka, T.; Hirayama, S. Numerical analysis of transient defogging pattern on an automobile. SAE Pap. 2002, 1, 0223. [Google Scholar]
- Liu, J.; Aizawa, H.; Yoshino, H. CFD prediction of surface condensation on walls and its experimental validation. Build. Environ. 2004, 39, 905–911. [Google Scholar] [CrossRef]
- Kai, L.; Enlu, W.; Li, D. Numerical and experimental investigation on water vapor condensation in turbulent flue gas. Appl. Therm. Eng. 2019, 160, 114009. [Google Scholar] [CrossRef]
- Karim, J.; AbdulNour, B.S.; Wiklund, G.C. State of knowledge and current challenges in defrosting automotive windshields. SAE Pap. 2000, 23, 360–375. [Google Scholar]
- Long, X. Numerical Simulation of HVAC and the Blowing Face Duct in Vehicle Air Conditioning System. Master’s Thesis, College of Mechanical Engineering and Automation, Northeast University, Shenyang, China, 2013. [Google Scholar]
- Yang, B.; Huang, L.N.; Ren, F. Aerodynamic Design and numerical simulation analysis of a passenger car’s defrosting duct. In Proceedings of the FISITA 2012 World Automotive Congress, Beijing, China, 23 November 2012; pp. 1441–1448. [Google Scholar] [CrossRef]
- Serrano, J.; Piqueras, P.; Navarro, R.; Tarí, D.; Meano, C. Development and verification of an in-flow water condensation model for 3D-CFD simulations of humid air streams mixing. Fluids 2018, 167, 158–165. [Google Scholar] [CrossRef]
- Da, L. Application of CFD simulation technology in design of automobile blowing wind duct. Sci. Technol. Style 2011, 17, 110. [Google Scholar]
- Yanghua, C.; Ying, F. CFD numerical analysis of automotive air-conditioning duct system. J. Nanchang Univ. 2012, 36, 282–285. [Google Scholar]
- Li, F.S. Flow field analysis of hvac face-blowing duct based on CFD. Appl. Mech. Mater. 2014. [Google Scholar] [CrossRef]


© 2020 by the authors. Licensee MDPI, Basel, Switzerland. This article is an open access article distributed under the terms and conditions of the Creative Commons Attribution (CC BY) license (http://creativecommons.org/licenses/by/4.0/).