Article

Towards the Use of Novel Materials in Shipbuilding: Assessing Thermal Performances of Fire-Doors by Self-Consistent Numerical Modelling

1
Department of Engineering and Architecture, University of Trieste, I-34127 Trieste, Italy
2
Maritime Safety Research Centre, Department of Naval Architecture, Ocean and Marine Engineering, University of Strathclyde, Glasgow G4OLZ, UK
3
Faculty of Science and Technology, Free University of Bozen, I-39100 Bozen, Italy
4
Department of Chemical and Pharmaceutical Sciences, University of Trieste; I-34127 Trieste, Italy
*
Author to whom correspondence should be addressed.
Appl. Sci. 2020, 10(17), 5736; https://doi.org/10.3390/app10175736
Submission received: 30 July 2020 / Revised: 14 August 2020 / Accepted: 17 August 2020 / Published: 19 August 2020
(This article belongs to the Section Marine Science and Engineering)

Abstract

:
Nowadays, fire-doors optimization is approached by using consolidated design guidelines and traditional materials, such as rock wool. Then, selected solution is directly tested in a mandatory fire-test. Unfortunately, few pieces of information could be retrieved either if the test succeeds or fails, which makes both improvements in the design and use of innovative materials difficult. Thus, in this work, a self-consistent finite element method (FEM) analysis is developed and assessed against experimental fire-test results, highlighting the critical parameters affecting the numerical simulations. Using this tool, a new fiberglass-containing foam, with improved acoustic and mechanical properties, as compared to the rock-wool, is studied as a potential insulating material for on-board fire-doors. The assessment of the performance of the new material demonstrates that, contrary to common believe, the effective thermal insulation capacity is not necessarily the critical factor in determining the fire-resistance of a fire-door. Using the validated FEM analysis, it has been proven that the reduction of the thermal bridges originated at the door edges allows, firstly, for the attainment of a fire-door 37% thinner and 61% lighter with respect to a traditional one, and, secondly, the use of new material as insulator in fire-doors that, even if less thermally capable, could improve other properties of the door, as an example its soundproofing.

1. Introduction

The increasing demand for modern cruise ships makes the safety of passengers a crucial design issue. In this sense, the protection from fire accidents and their containment is of utmost importance. In fact, among the different safety elements, fire-doors represent a key element as they slow or stop fire propagation. Hence, the appropriate design of fire doors is of utmost importance. To assess their efficiency, the doors must be preventively subjected to the mandatory fire-test reported in the FTP Code (International Code for the application of Fire Test Procedure) [1], by exposing them to a prescribed time–temperature heating relation, depending on the fire door class. Both mechanical and thermal limits are imposed to assess the door performances in order to guarantee specific temperatures on the unexposed side of the door and to stop the smock and flame propagation [1]. The main critical parameters that affect the thermos-resistance of a fire-door are the thermal bridges originated at the door edges, the heat conduction through the door and the steel sheet thickness [2]. The thermal bridges influence both the temperatures on the unexposed side of the door and the distortions of the door as they create a high temperature gradient at the edges [2]. The steel sheets give structural strength to the door, but they convey heat by conduction, so the use of fire-resistant insulating materials is necessary in order to slow down the spread of heat and to comply with the regulations [1]. The market is now dominated by few categories of thermal insulators, such as mineral wool and extruded and expanded polystyrene [3]. For fire-proofing rock wool is the most widely used insulator on board as it presents a hard to surmount mix of cheapness and mechanical/physical properties: it has low thermal conductivity, and it is lightweight and not flammable [4]. However, the release of fibers due to damage to the doors may present environmental and health concerns [5]. Furthermore, its soundproofing performance, which is an important property in passenger ships, is relatively poor [6,7]. As a consequence, there is a strong research interest for substitute materials. Several studies investigated the thermal, acoustic and environmental performances of materials at current, scarcely used, or even in prototypal stages [3]. These unconventional products can be manufactured using natural sources, such as residues of agricultural production and processing industries. Other sources are represented by recycled products or industrial plant byproducts [3]. Following this drive towards the development and use of new materials, an innovative sustainable insulating material has been developed through a foaming process, starting from fiberglass waste and natural alginate-based gels [8]. This material is an open cell foam and shows improved soundproofing capabilities compared to rock wool, which, as stated above, makes them potentially of interest in shipbuilding. The mechanical and thermal characteristics of the foam have been analyzed in this work, including the incombustibility test in order to fully comply with the FTP Code [1].
The use of novel materials or innovative fire-door design in shipbuilding is often retarded or even precluded due to the necessity to ensure compliance with established mandatory requirements. Among these, the FTP Code compliance test is perhaps the most demanding and expensive test. The effective modelling of such a test would therefore open doors to greater innovations, as different door designs incorporating new materials could be preliminary tested by numerical methods, resulting in significant savings in time and costs.
A number of papers in the literature have indeed addressed the issue of modelling the effects of the FTP test on fire-doors, using the FEM technique [2,9,10]. These works aimed at deriving a simplified model for the description of the door behavior under a fire-test, despite the occurrence of complex phenomena [11]. Unfortunately, a perusal of the adopted experimental and calculation procedures reveals a lack of details in the assessment of the validity of the results, and the calculations appear strictly related to the specific door analyzed, precluding their general use and reproducibility of calculations, which has become a major issue [12]. Moreover, the choice of the employed physical parameters affects the results of the fitting [13].
In a preliminary study [14], the issue of modelling the FTP test has been addressed, aimed at introducing innovation in this field. Though thermal modelling, this preliminary work was still linked to the specific door investigated and the preliminary results highlighted the critical importance of thermal bridges originating at the door edges in determining the fire-resistance and thus allowed us to propose a design for a novel thinner door. Since a general, self-consistent, fully detailed, validated and ready-to-use FEM methodology for fire-door designs cannot be derived from the previous works, thus precluding the forecasting capability, which is the strength of computational methods, this work attempts to reach this challenge. Finally, the assessed FEM model developed is used to simulate the fire-test on the fire-door with the foam as an insulator. The results clearly show the potential of the foam as a substitute for the rock wool. This finding demonstrates that, with an appropriate door design, materials with poorer thermal insulating capability compared to the traditional insulator can also be used, allowing us to optimize other characteristics as, for example, soundproofing.

2. Materials and Methods

In this section test procedures used to evaluate materials properties are reported and the numerical model characteristics used to simulate the fire resistance test are explained.

2.1. Material Properties

For carbon steel (Fe 37/360), the thermal and mechanical properties needed for the numerical analysis are tabulated on the materials datasheet for room temperature (Table 1) and integrated with data available in the literature for high temperatures [15].
For the insulating materials, the temperature dependence is considered only for the thermal conductivity; the insulating material has no significant structural contribution [10], so the mechanical properties are considered constant for simplicity.
The rock wool properties, as reported in the datasheet (Table 1), are integrated with experimental measurements (see Section 2.1.2).
The foam is synthesized using a gel-route followed by a freeze-drying [16] and its properties are experimentally measured as reported in the next sections.

2.1.1. Mechanical Tests

Compression tests were performed with a Shimadzu AGS-X equipped with a 10 kN load cell. A constant compression speed of 1.3 mm min−1 was used (ASTM D1621 [17]) and the compression modulus Ec was determined from the stress–strain curves in the 3–6% deformation range. Tests were performed on five specimens with an average diameter of 19.5 mm and an average height of 17.0 mm.

2.1.2. Thermal Conductivity

Thermal conductivity (k) in the range 20–80 °C was measured with a Netzsch HFM 446 Lambda Small heat flow meter, according to the ASTM C518 [18]. Thermal conductivity at higher temperatures (≤ 200 °C) was measured using the constant heat flow method [19], using a specifically modified muffle.
The conductivity values for temperatures higher than 200 °C were calculated according to the ISO 10456:2007 [20], using the following equation:
k ( T )   =   k ref   exp   ( f T   ( T i     T ref ) )   ( W · ( m · K ) 1 ) ,
where kref is the value at the reference temperature Tref (20 °C in this case) and Ti is the temperature at which the thermal conductivity has to be found. fT is a scale factor tabulated in the standard ISO, in this study a factor for glassy materials (fT = 0.003) is adopted.

2.1.3. Incombustibility

The incombustibility test, required by the FTP Code [1], was performed according to the ISO 1182:2010 [21]. Five cylindrical samples were inserted into an oven at 750 °C while the oven/sample temperatures and persistence of possible flame were monitored.

2.2. Numerical Modelling of Fire Resistance Test

2.2.1. Fire-Proof Door Characteristics and Test Conditions

A single-leaf fire-proof marine door with a clear opening of 1200 mm and a height of 2223 mm was considered as a case study. The leaf (1248 mm wide and 2250 mm high) is made of carbon steel sheets with a thickness of 1 mm, containing the insulating material (SEAROX-SL 440, density 150 kg m−3) with a thickness of 40 mm. The insulating material was selected by the door manufacturing company due to its lightness, efficiency and proper certifications. The steel sheets were glued to the insulator by a polymer-based glue. The door frame, consisting of steel profiles with a thickness of 4 mm, was screwed on the bulkhead with a spacing of 150 mm. The door was fixed to the frame by means of three hinges on one side and a lock was arranged on the opposite side. Figure 1a exemplifies the model geometry.
In the fire-test procedure reported in the FTP Code the door was heated from ambient temperature T0 (in this case 18 °C) to 945 °C with a prescribed time–temperature relationship expressed by the following equation:
T   =   345   log 10 ( 8 t   +   1 )   +   T 0   ( ° C ) ,
where t is the time (min).
For an A-60 class door, as with that considered here, the fire test lasts 60 min. Temperatures and displacements must be monitored in five positions (Figure 1b). On the fire-unexposed side of the door the following limits are imposed:
(i)
The final temperature of each thermocouple must not exceed 180 °C above T0;
(ii)
The medium temperature of the five thermocouples must not exceed 140 °C above T0.
Moreover, only small gaps between the door and the frame are tolerated in order to ensure that no flame passes through the door (detailed procedure and limits are reported in the FTP Code [1]).

2.2.2. FEM Modelling

Fire-test modelling is performed using MSC Nastran with Patran 2017 and it is developed in a two-step analysis: firstly, a thermal investigation is carried out in order to evaluate the temperature distribution, which is then used as an input for the subsequent structural analysis. The two analyses can be considered uncoupled as the thermal distortions do not significantly affect the temperature distribution during the test [2]. Both the analyses are performed as non-linear calculations, as the materials’ properties depend on temperature.
The thermal analysis is performed by means of unsteady-state simulation which was shown to be necessary to obtain reliable fitting of the experimental results and to study the thermal evolutions (i.e., influence of the thermal bridge on fire resistance) during the fire-test [13,14]. Conversely, the structural modelling was performed using a steady-state simulation. Since the key constituent materials of the fire-door are not viscoelastic, the deformation history does not significantly influence the final deformations at the maximum temperature, which fully justifies the use of steady-state analysis in this case [10].
The model is validated on the basis of the RINA (Registro Navale Italiano—Italian Naval Register) certification [22] obtained from the FTP fire-test performed on the above quoted door.
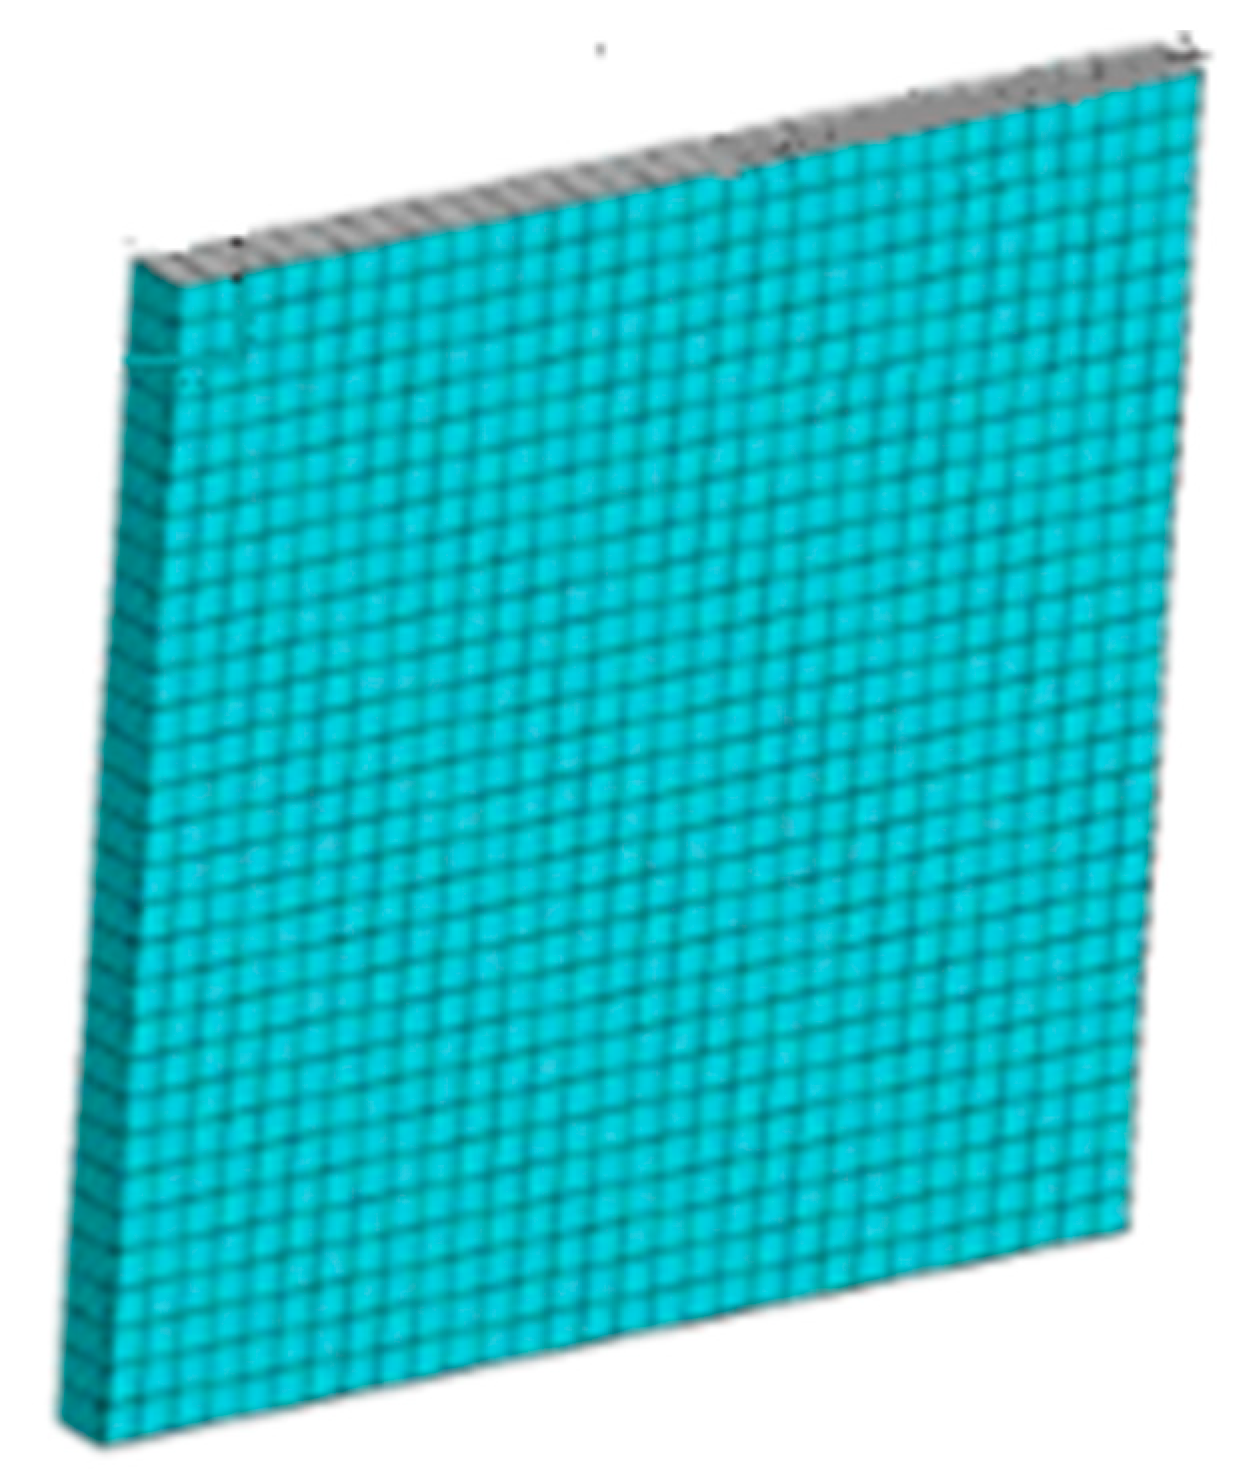
The geometry is discretized using solid elements for the insulating material, while shell elements are used for components that have thickness negligible compared to the other dimensions (e.g., door sheets, frame, bulkhead and reinforcements). Figure 2 reports an example of the door mesh.
The model was bound by fixing rotations and translations at the edges of the bulkhead, since it was welded to the test machines. R-type elements were used to model both the lock and the hinges—in particular, rigid body elements (RBE2) that are multi-point constraints (MPCs) were adopted. These connectors are rigid elements that force the nodes to have the same displacements; they provide independent degrees of freedom (DOFs) at a grid point and dependent DOFs at one or more grid points. The thermal elongation of steel was adopted for the connectors.
For the thermal analysis, radiation and convection coefficients were calculated for the fire-unexposed side of the door using the following equations [23]:
h r   =   ε   σ   ( T 2 2   +   T 0 2 ) ( T 2   +   T 0 )   ( W   ( m   K ) - 1 )
h c   =   ( N u   ·   k 0 ) / L   ( W   ( m   K ) - 1 ) ,
where T2 is the average temperature between T0 and that calculated on the fire-unexposed side without considering radiation and convection, ε is the steel emissivity, σ is the Stefan–Boltzmann constant in (W m−2 K−4), L is the height of the door in (m) (characteristic dimension) and k0 is the thermal conductivity of air in (W (m K)−1). The Nusselt number Nu is calculated for the vertical wall with turbulent and laminar flow [23] using the following equation:
Nu   =   { 0.825   +   [ ( 0.387   R a 1 6 ) / ( 1   +   ( 0.492 P r ) 9 15 ) 8 27 ] } 2
where Pr is the Prandtl number and Ra is the Rayleigh number reported in the following equations:
Pr   =   ν / α
Ra   = [ β   ( T 2     T 0 )   g   L 3 ] / ( ν   α ) ,
with ν as the kinematic viscosity of air in (m s−1), α as the thermal diffusivity of air in (m s−1), β as the volumetric expansion coefficient of air in (K−1) and g as the gravity acceleration in (m s−2). The air properties are considered at the temperature T2 [24].
An equivalent convection coefficient is then calculated according to the following equation and imposed on the door fire-unexposed side:
H   =   h r + h c   ( W   ( m   K ) - 1 )   ,
On the door fire-exposed side, radiation and convection are considered constant, whereas the temperature gradient follows the standard time–temperature relationship (Equation (2)) [1]. So, the natural convection coefficient is set to 25.0 W (m2 K)−1 [24] and it is assumed to receive uniform radiation heat flow with a view factor set to 1.0 [10], adopting the black body condition [25].
The time-step of the unsteady-state analysis is defined using an adaptive method; setting as input an initial time-step, the software automatically calculates the subsequent time-steps based on the convergence conditions. An initial time-step of 10 s is found to provide stability and accuracy of the integration process using the above quoted software.

3. Results

The results of the characterization of the foam used in this work are illustrated first as they constitute input data for the FE model. Then the attention is focused on the evaluation of the reliability of the numerical modelling of the fire-test. For this purpose, calculated boundary conditions, mesh sensitivity study and validation procedure are specifically addressed with the aim to derive self-consistent independent criteria that can assess these aspects. The self-consistent FEM model is finally used to estimate the thermal bridge effects and to simulate the fire-resistance of the door that uses the foam as insulator.

3.1. Foam Characterization

The foam (Figure 3) is composed of ground fiberglass scrap mixed with a biopolymer. It has an open cell structure with fiberglass powders incorporated inside the cell walls constituted by the biopolymer.
The foam can be synthesized with variable properties, including density, elastic compression modulus, etc. [16]. In this work, a density of 130 kg m−3 was used, slightly lower than that of the rock wool (150 kg m−3) for which an elastic compression modulus of 3.4 ± 0.1 MPa was measured (for comparison, the rock wool modulus was 1 ± 0.1 MPa). The composition was chosen to satisfy the incombustibility test imposed by the FTP Code [1]. The foam was classified as incombustible material since the average of five tests showed a weight loss of 45.6 wt % (in compliance with the FTP Code, this must be ≤ 50 wt %) and flame persistence of 1.8 s (for the FTP Code, this must be ≤ 10 s).
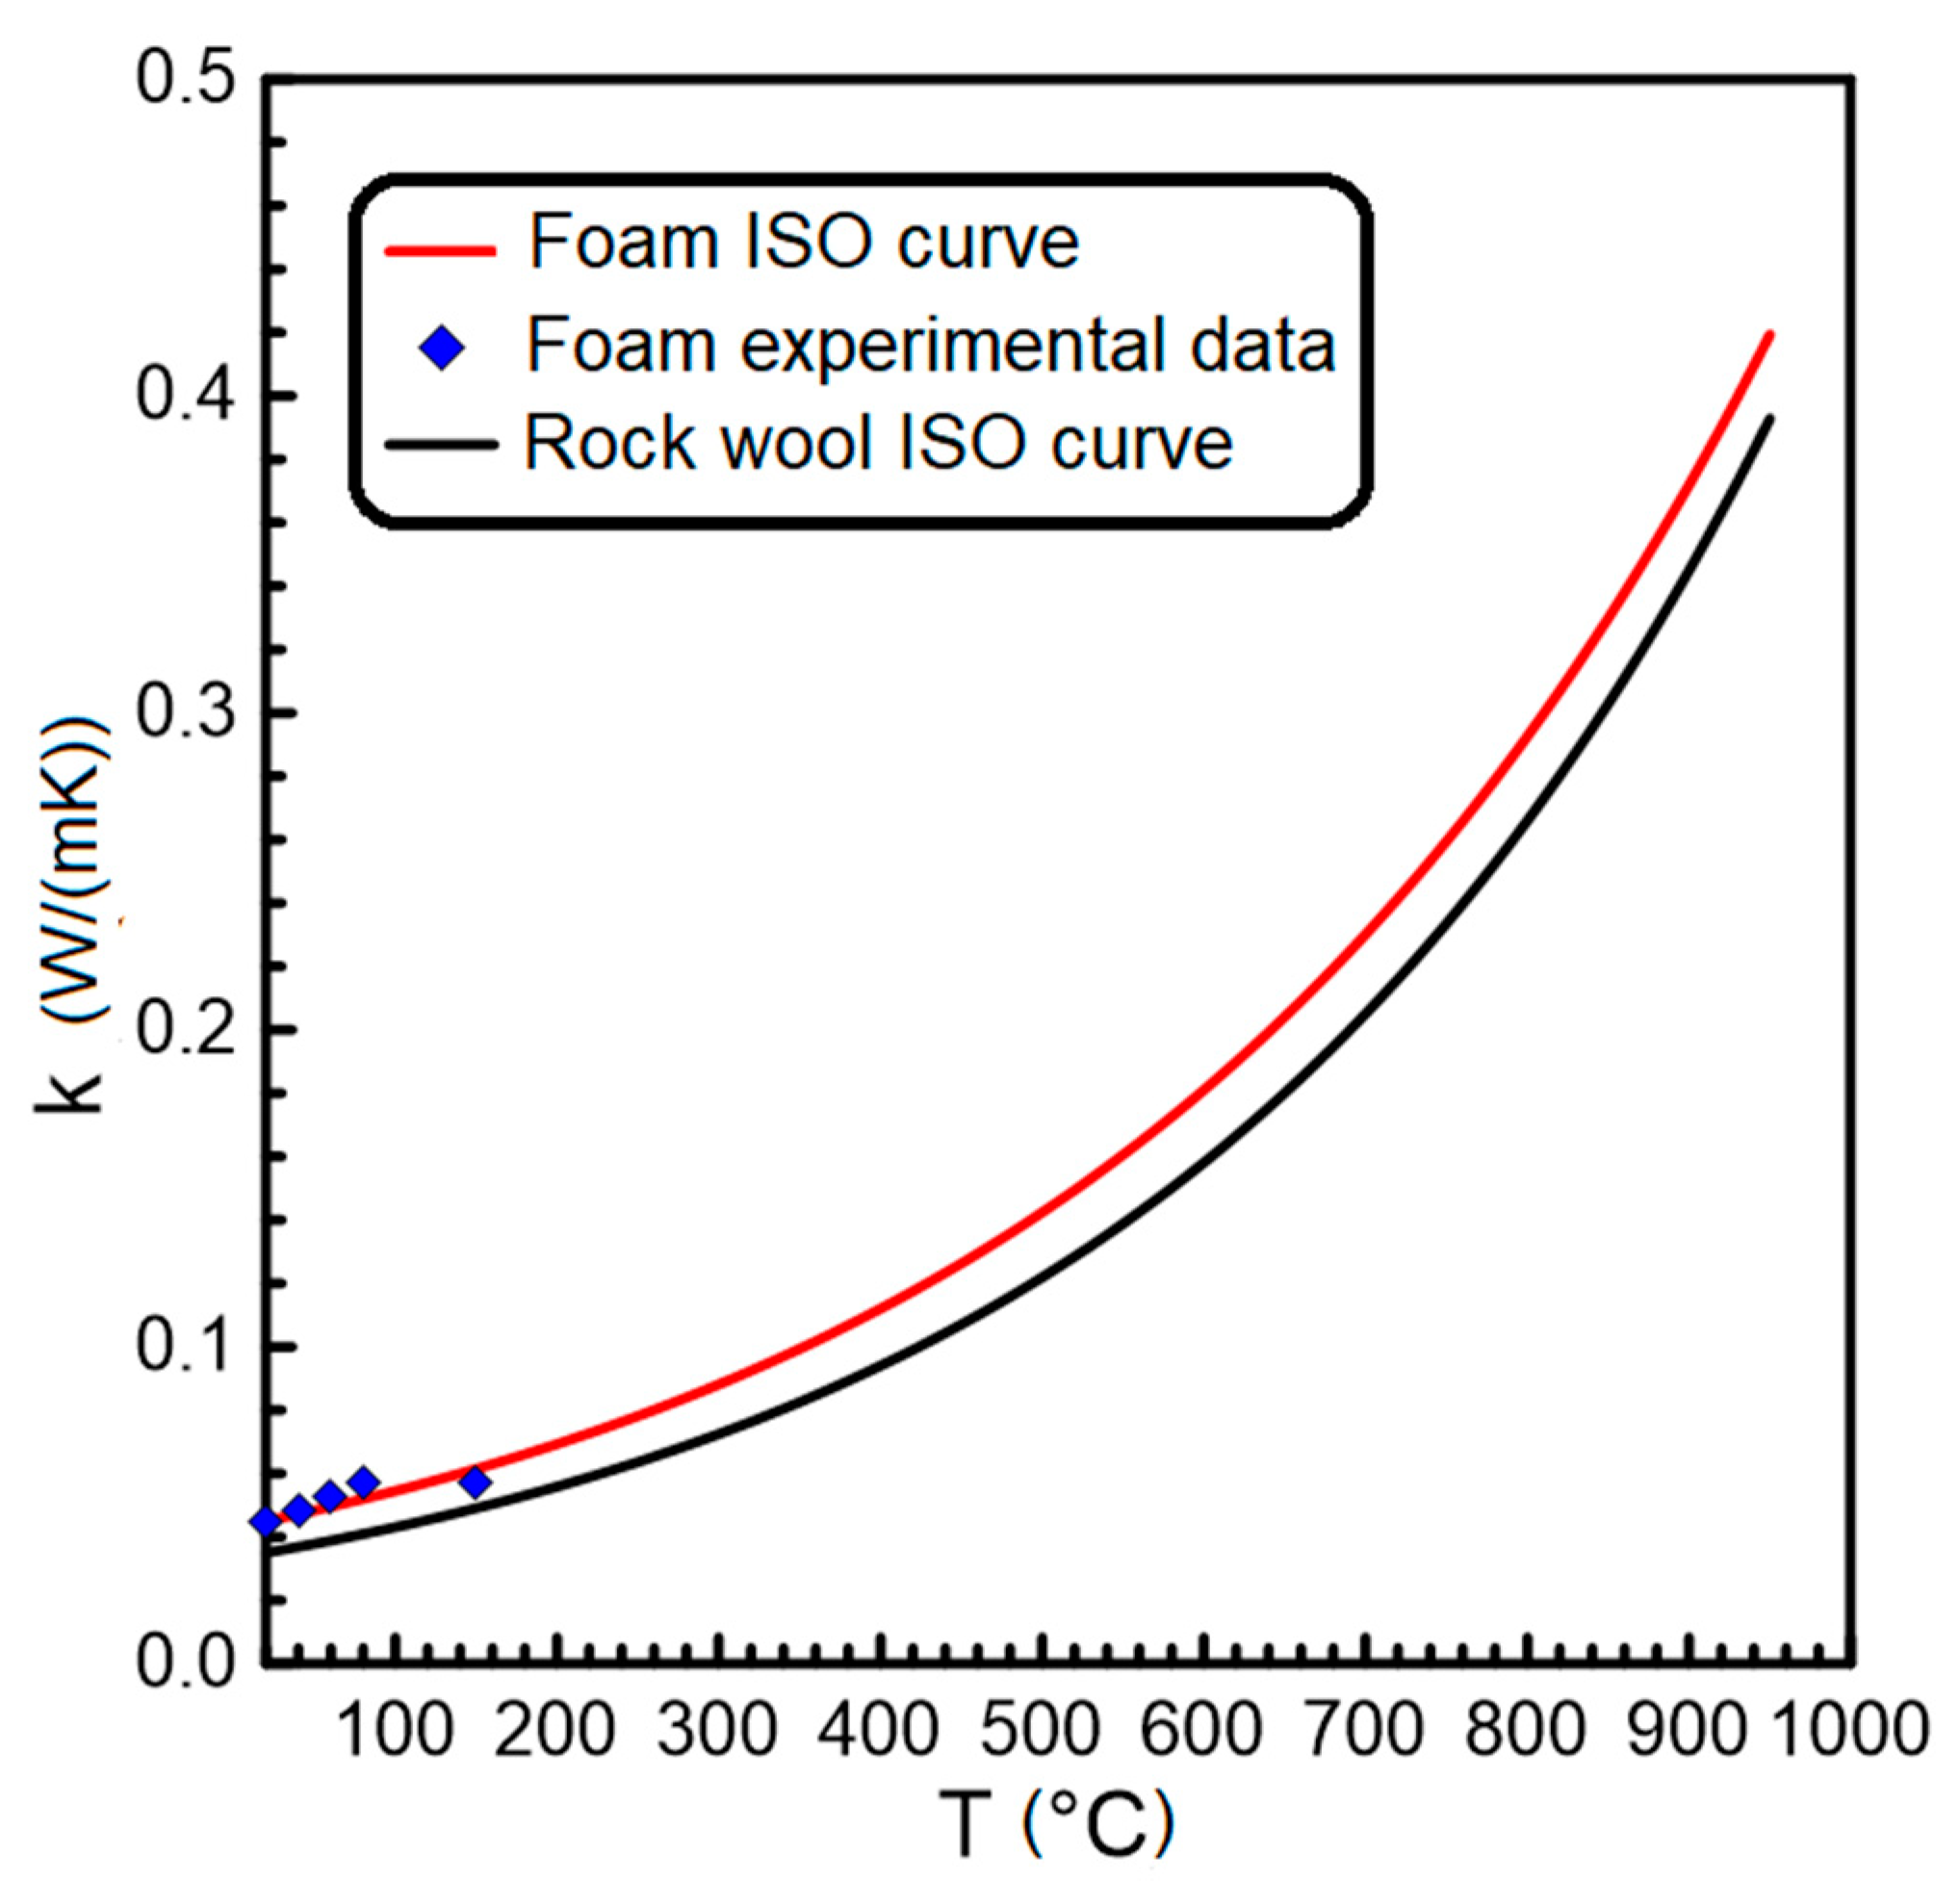
The thermal conductivity was measured at 20 °C is 0.035 and 0.045 W (m K)−1 for the rock wool and the foam, respectively. The experimental thermal conductivity up to 200 °C fit fairly well to the conductivity vs. temperature ISO 10456: 2007 curve [20] (Figure 4); accordingly, Equation (1) was used for higher temperatures, both for the foam and the rock wool.

3.2. Numerical Model Assessment

3.2.1. Boundary Conditions for Thermal Analysis

A value of T2 = 568 K (see Equation (3)) was calculated for the fire-unexposed side using a simplified model, without considering radiation and convection. The resulting Nusselt (Equation (5)) and Rayleigh (Equation (7)) numbers were 447.4 and 6.2 × 10¹⁰, respectively. A Rayleigh number higher than 109 indicates a turbulent flow for which the correlation used for the Nusselt number is valid [26].
Consequently, the convection and radiation coefficients equal to 9.0 W (m2 K)−1 and 13.9 W (m2 K)−1, respectively, were calculated. Thus, an equivalent convection coefficient of 22.9 W (m2 K)−1, as obtained from Equation (8), was imposed on the fire-unexposed side of the door.
An emissivity factor of 0.7 was used in this work (see Section 4.1).

3.2.2. Mesh Sensitivity Study

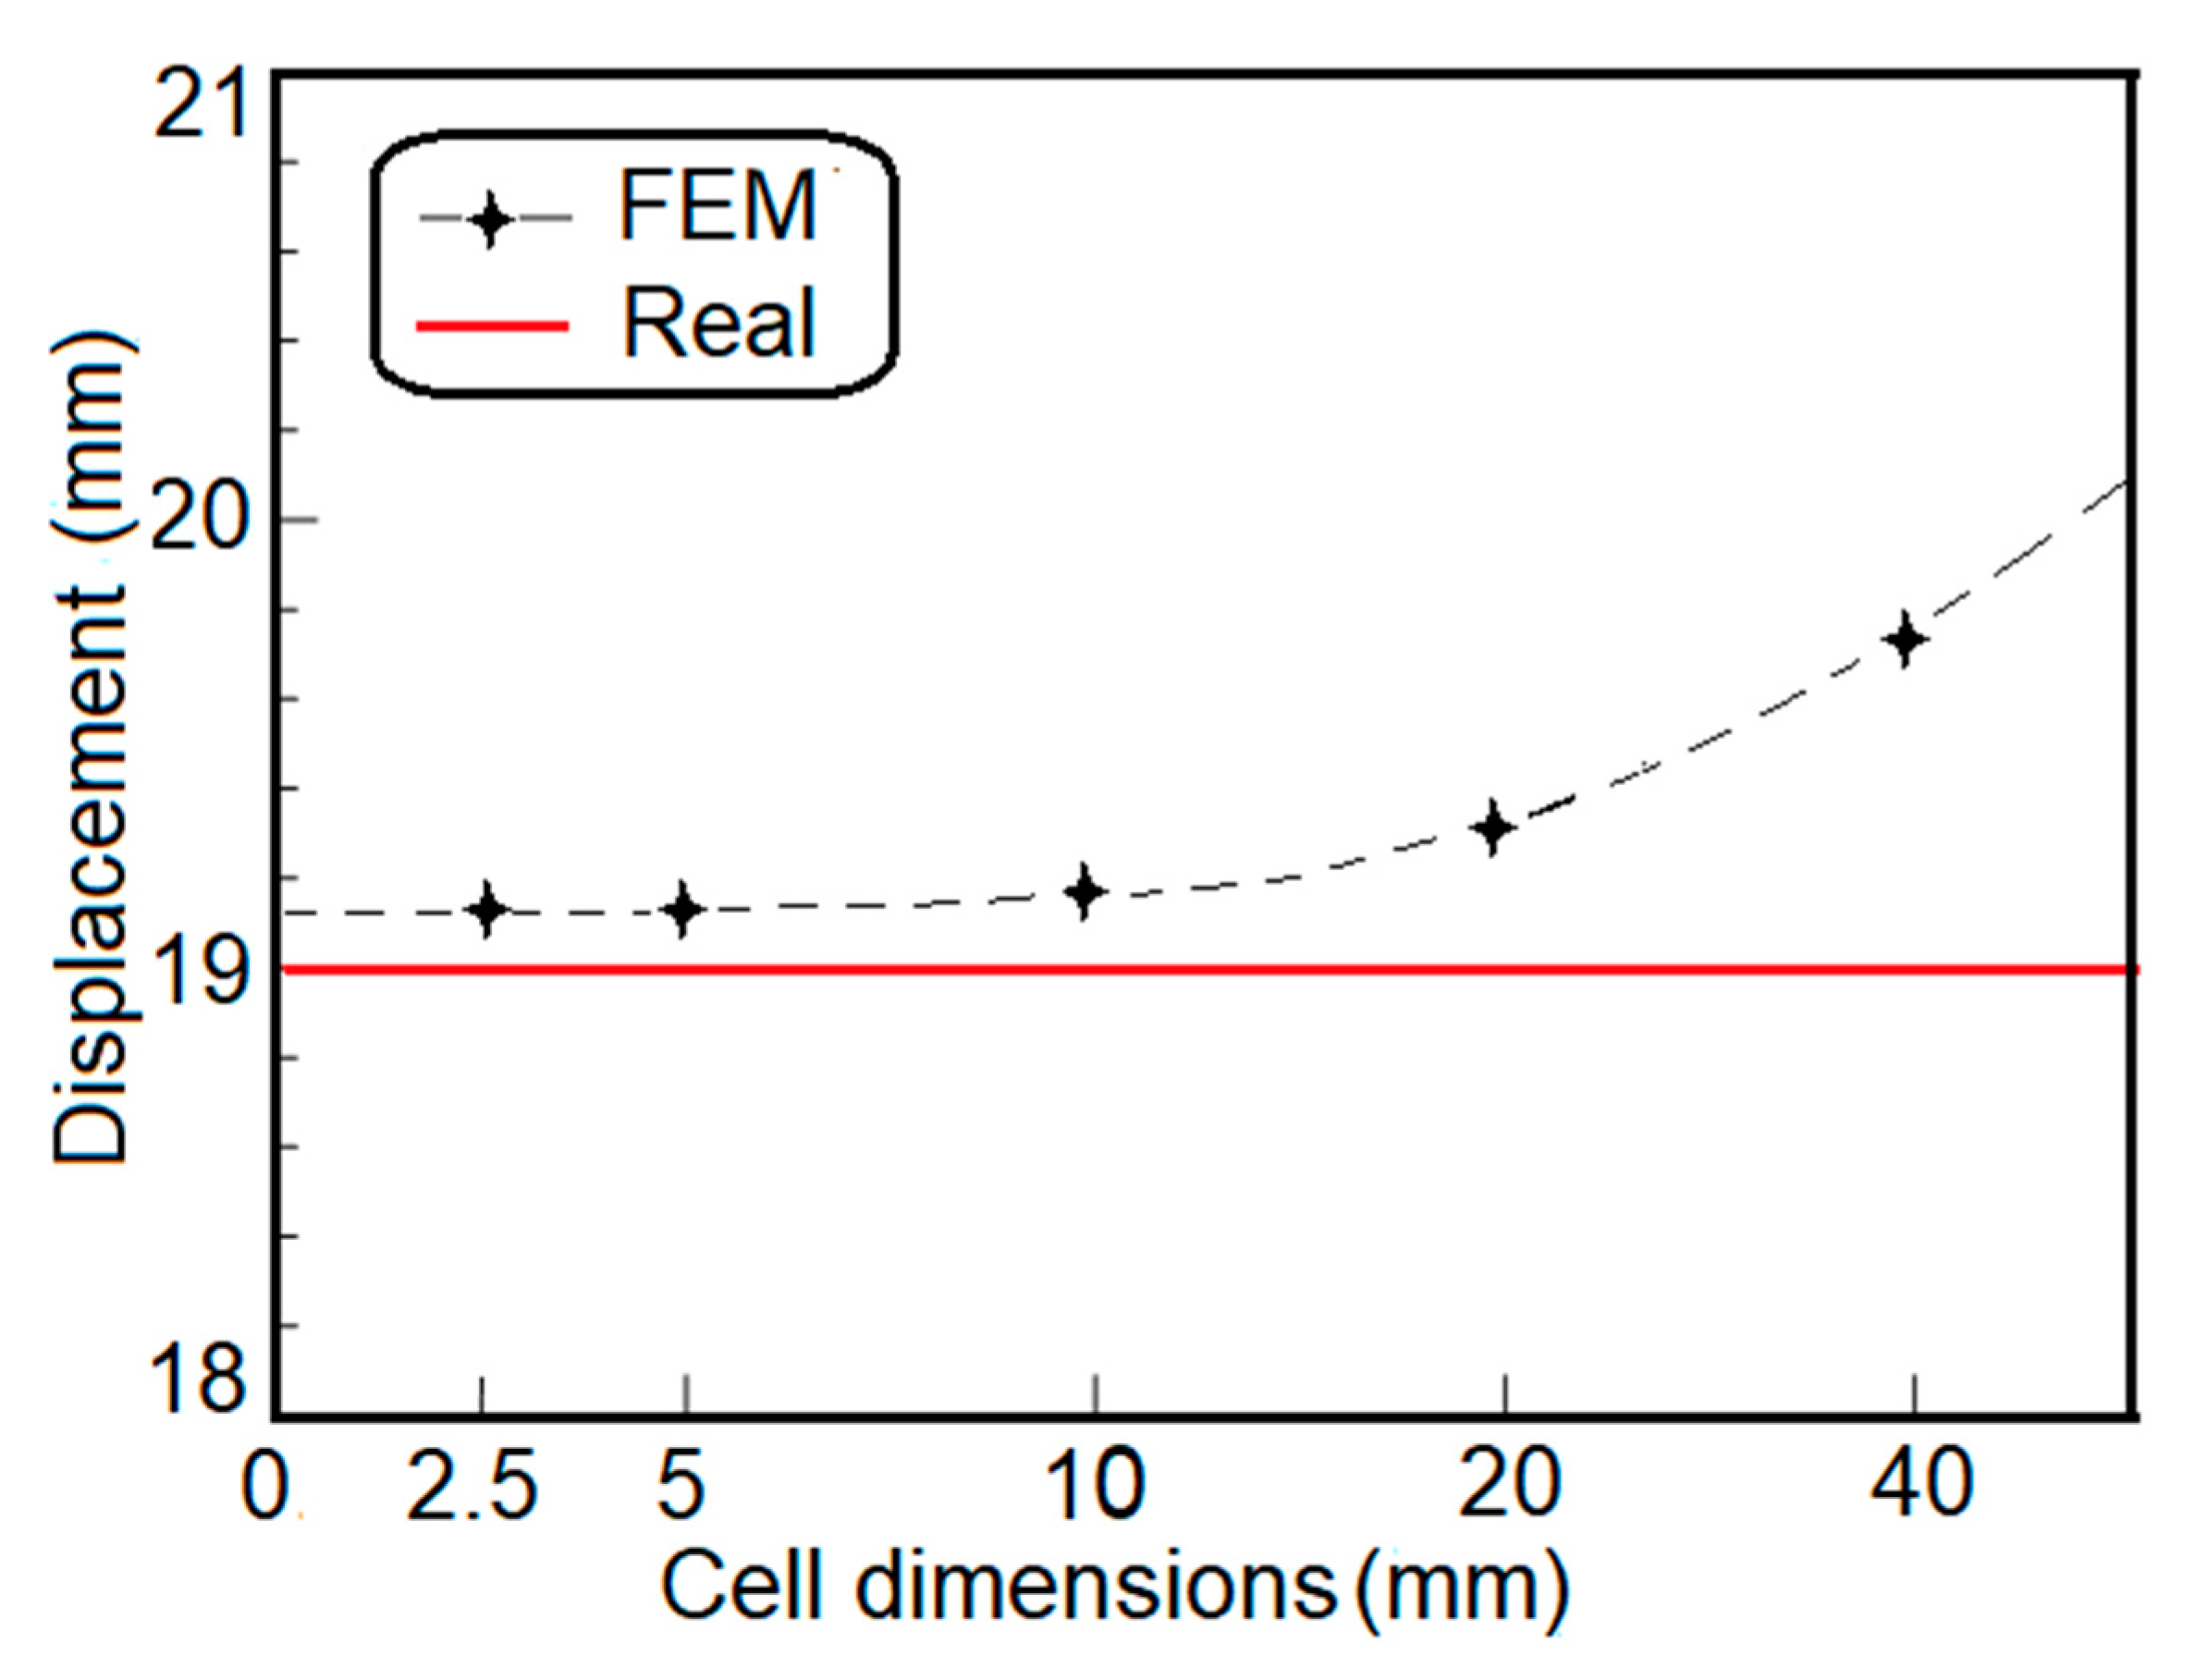
Thermal results do not change on varying cell dimensions (data not reported), on the contrary, the calculated displacements strongly depend on mesh size as shown in Figure 5 for point B, taken as reference. The mesh sensitivity study was performed, changing the base cell size in the range 2.5–40.0 mm with a refinement ratio equal to 2.
Decreasing the cell dimensions, the calculated displacements asymptotically reached the experimental value (19 mm). The asymptotic solution can be evaluated by the Grid Convergence Index (GCI) [27], expressed in the following equation:
GCI   =   1.25   {   ( | F i + 1     F i | / F i )   [ 1 / ( r p     1 ) ] } ,
where r is the refinement ratio, Fi are the model values with i that decreases with the grid refinement and p is the solution convergence order expressed in the following equation:
p   =   ln [ ( F i + 2       F i + 1 ) / ( F i + 1     F i ) ] / ln ( r ) ,
Comparing two successive values of GCI using the following equation, the asymptotic solution can be estimated; when the value of the parameter Ar is near to 1, the desired condition is satisfied.
A r   =   r p   ( GCI i / GCI i + 1 ) ,
In this case, considering the grids having dimensions 5 mm, 10 mm and 20 mm, a value of Ar equal to 1.005 was obtained, with GCI1 and GCI2 equal to 0.009 and 0.003, respectively.
Accordingly, a mesh size of 10 mm was used in all the computations as it is in the asymptotic range and it represents the best compromise between computational burden and the accuracy of the results.

3.2.3. Validation of the Model

Table 2 reports the final temperatures calculated by the FEM using the self-consistent equivalent coefficient H, calculated as reported in Equations (3)–(8). For comparison, the results of computation using the equivalent convection coefficients recommended by Eurocode 1 [24] equal to 9 W (m2 K)−1 are reported; these values largely overestimate the experimental results.
As stated in the introduction, for a self-consistent methodology, a criterion for the validation must be applied. For this purpose, the condition reported in the following equation is therefore employed to numerically validate the results of the self-consistent model [27,28,29,30].
| E |   <   U ,
where E is the error between numerical (Fn) and experimental (Fe) measurements and U is the norm between experimental (ee) and numerical error (en), as expressed in the following equations:
E   =   F n     F e   ,
U   =   e e 2   +   e n   2 ,
The numerical error can be calculated with the following equation:
e n   =   1.25   | F 0     F n | ,
where 1.25 is a security factor, suggested by Roache [30], and F0 is the ideal value calculated through the Richardson extrapolation [29] reported in the following equation:
F 0   =   F i   +   [ ( F i     F i + 1 ) / ( r p     1 ) ] ,
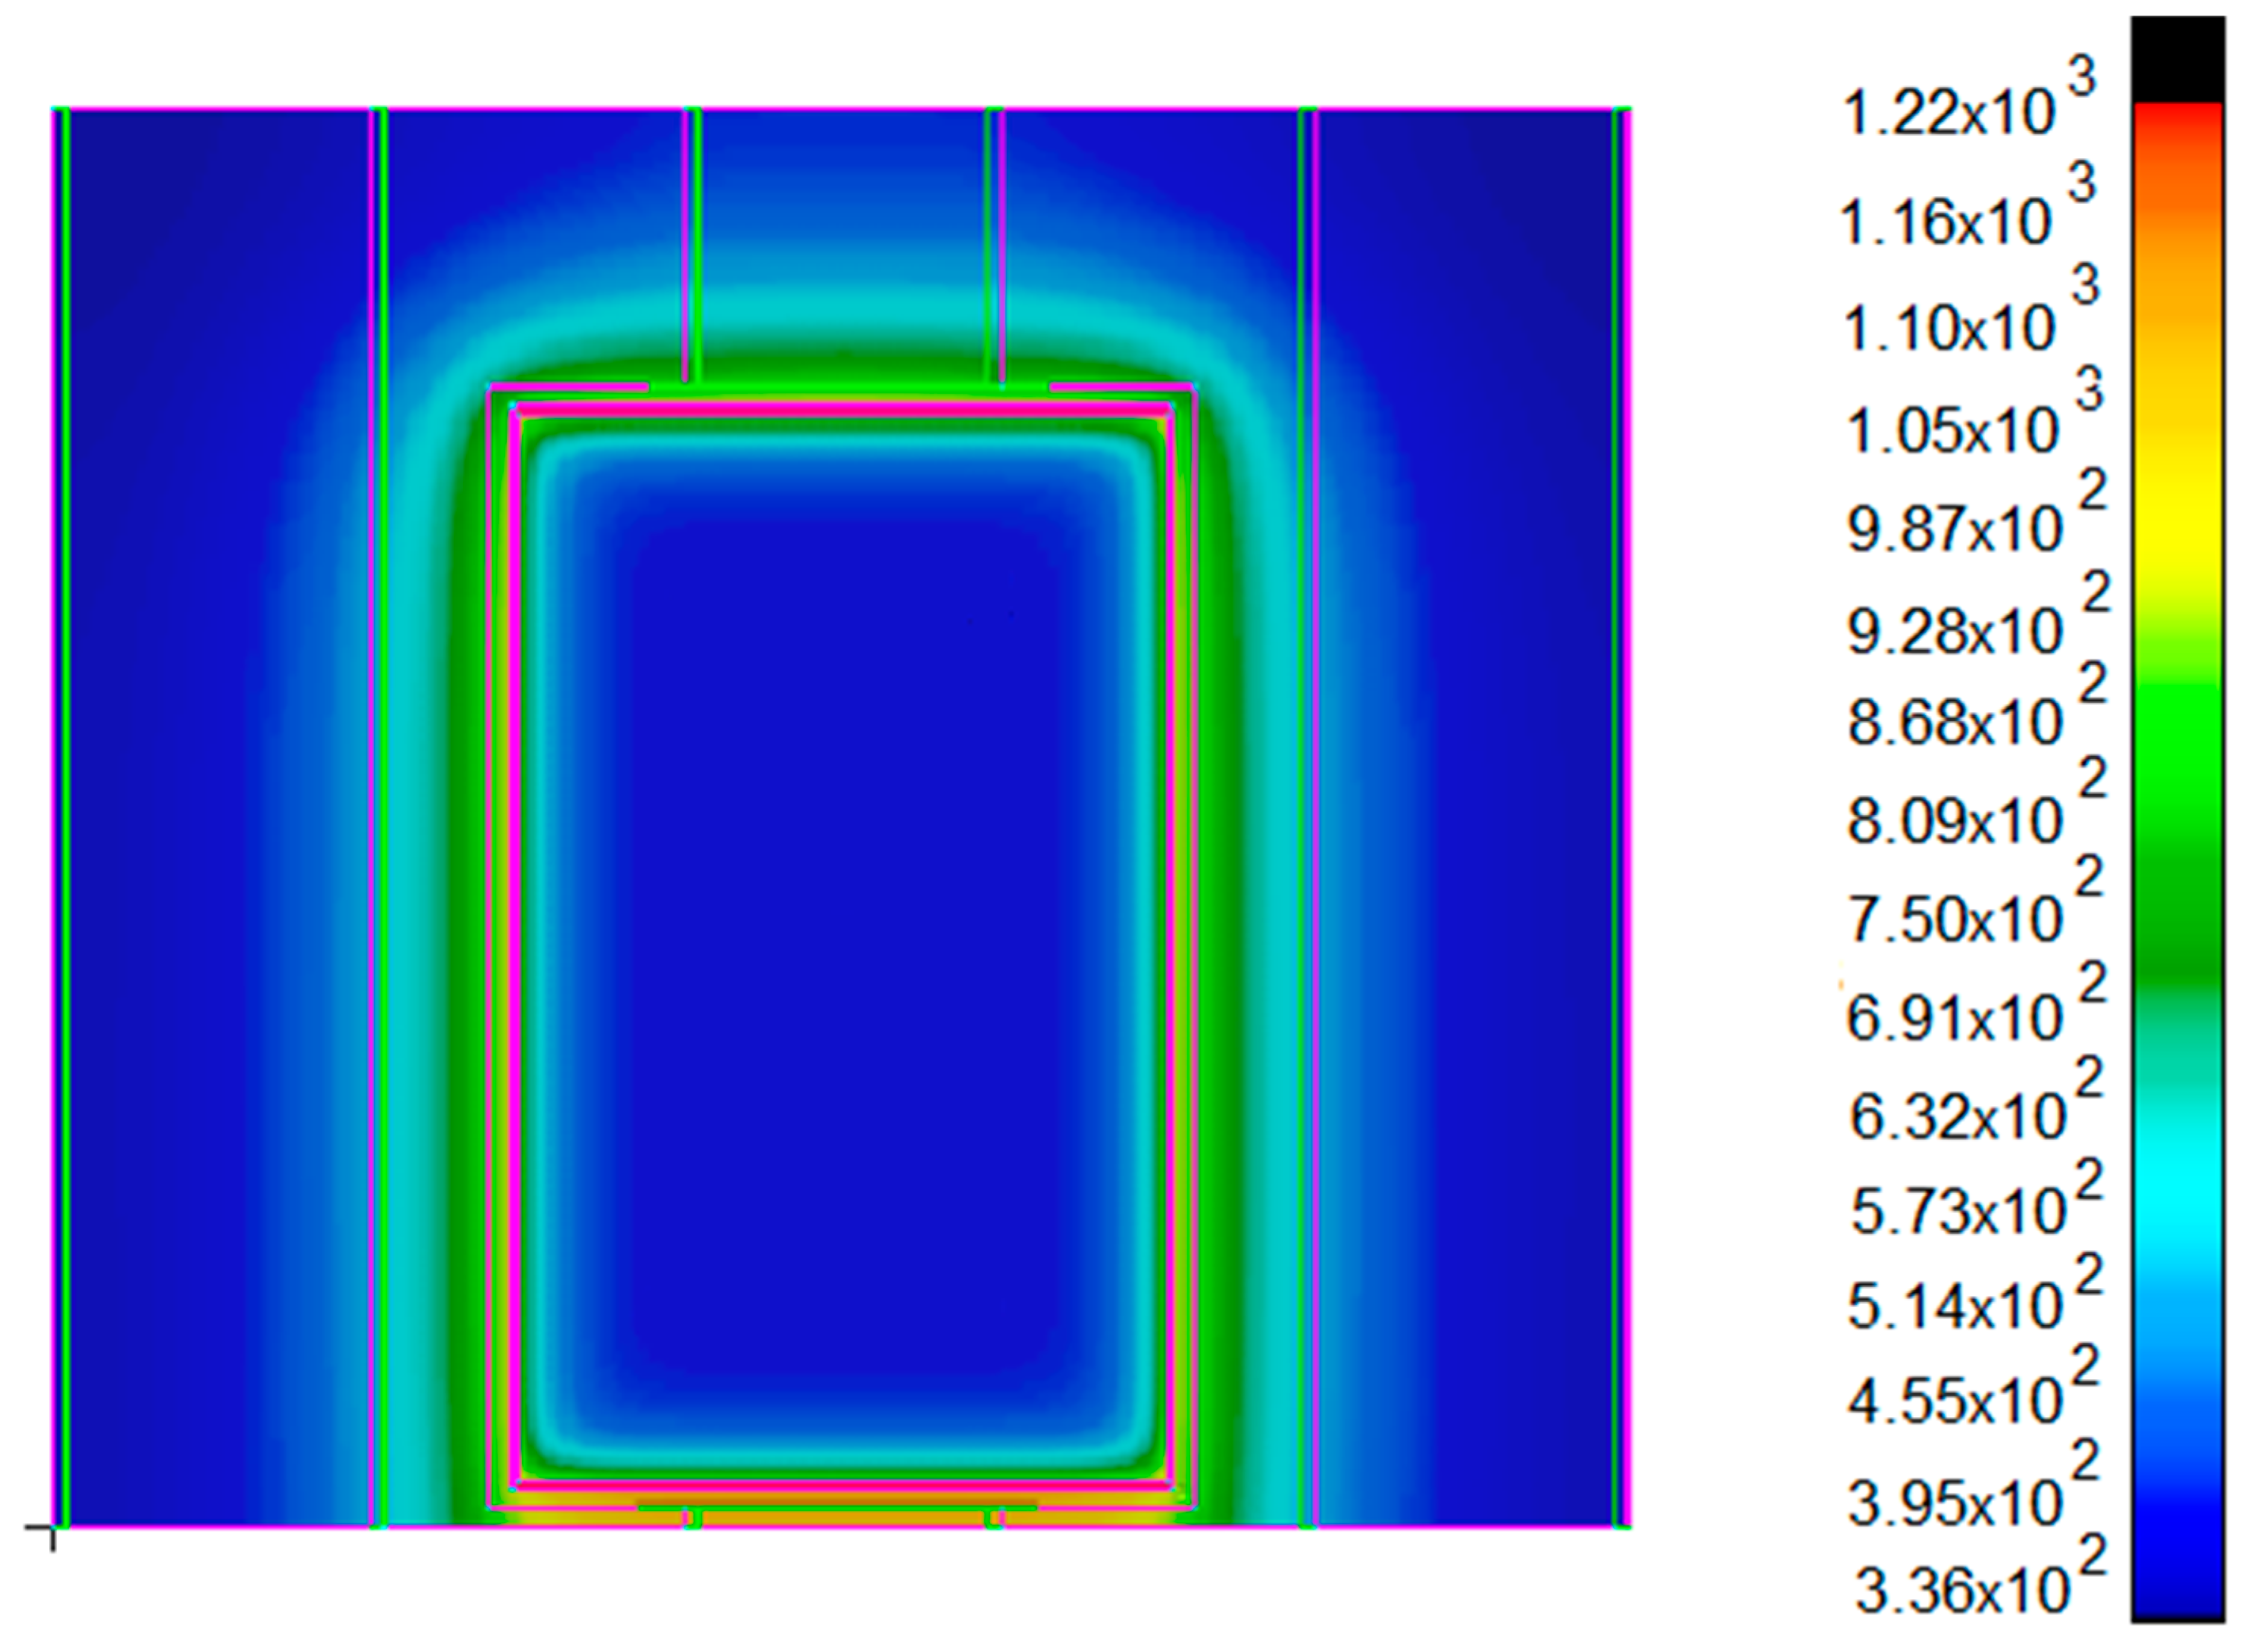
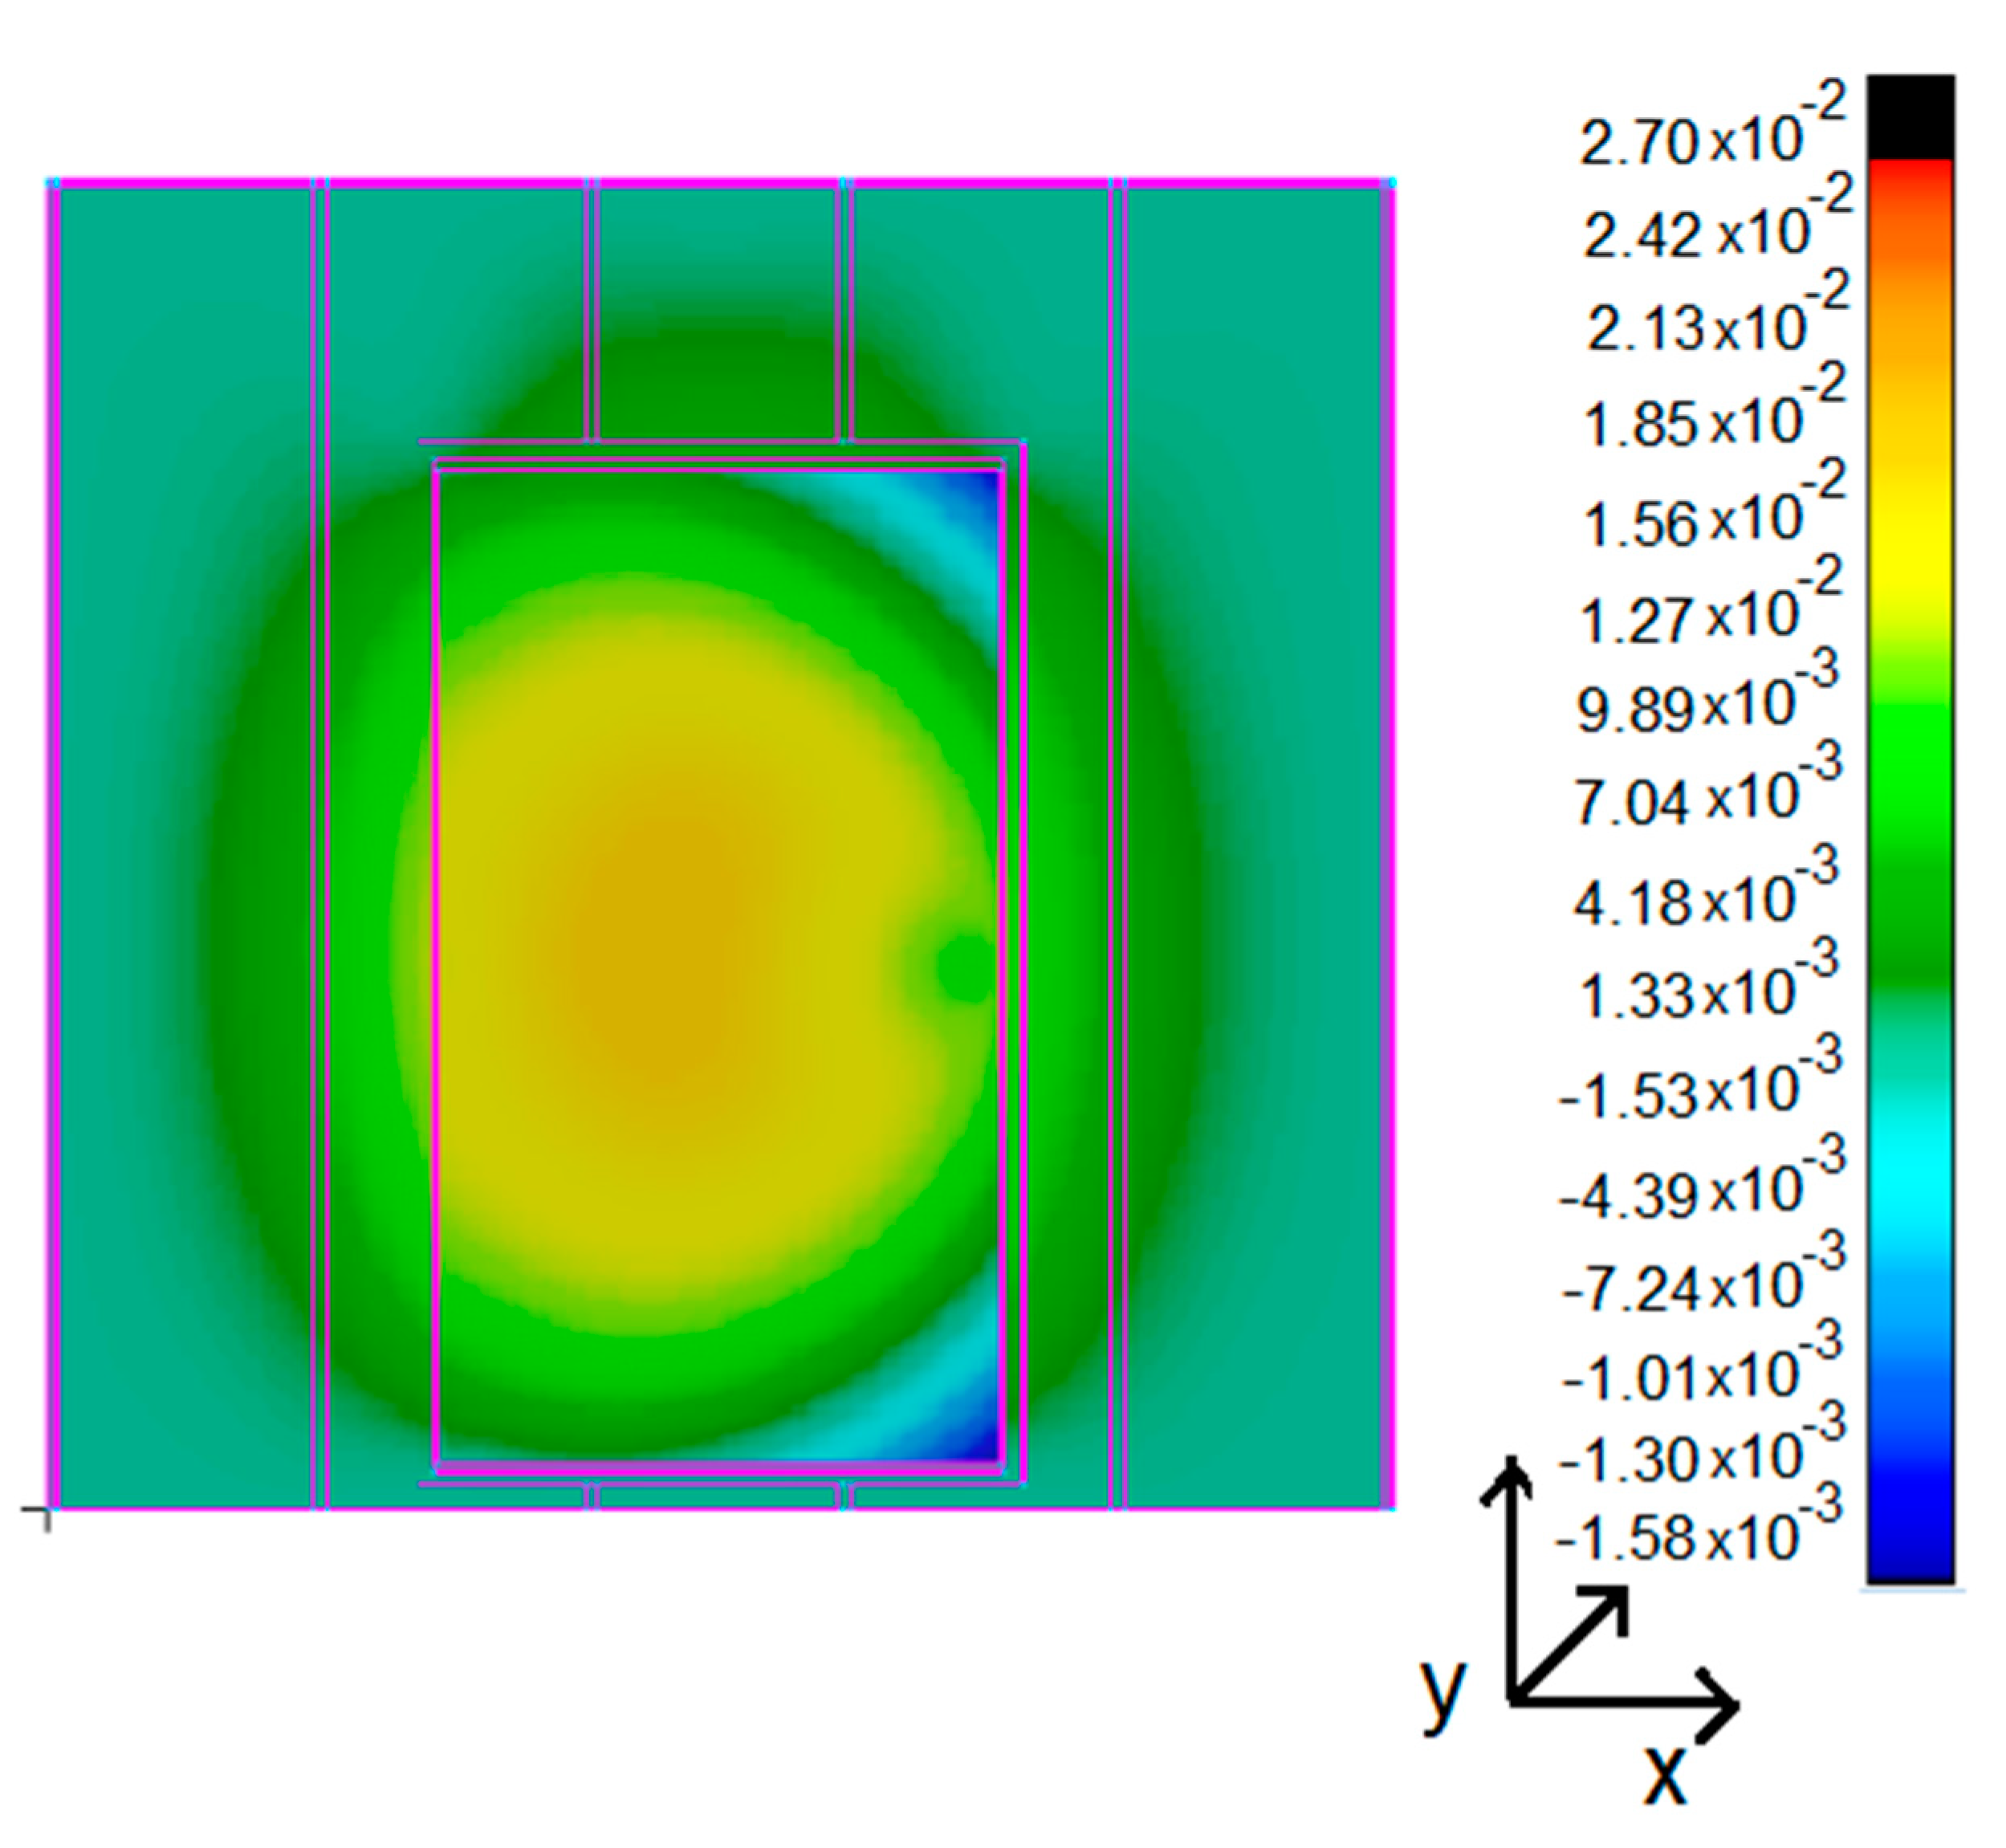
For the thermal analysis, an experimental error of ± 1.1 °C was considered, given by the accuracy of the thermocouples used. Figure 6 shows the temperature field on the fire-unexposed side of the door, whereas Table 2 compares the experimental temperatures and the numerical results. Equation (12) is satisfied in all of the test points, thus assessing the validity of the numerical method.
An experimental error of ± 1.0 mm is reported for the structural analysis. Figure 7 shows the displacements field, whereas Table 3 compares the experimental and calculated displacements. The condition reported in Equation (12) is satisfied for all the measured displacements. The model is, therefore, validated according to this criterion.

3.2.4. Effect of the Thermal Bridge

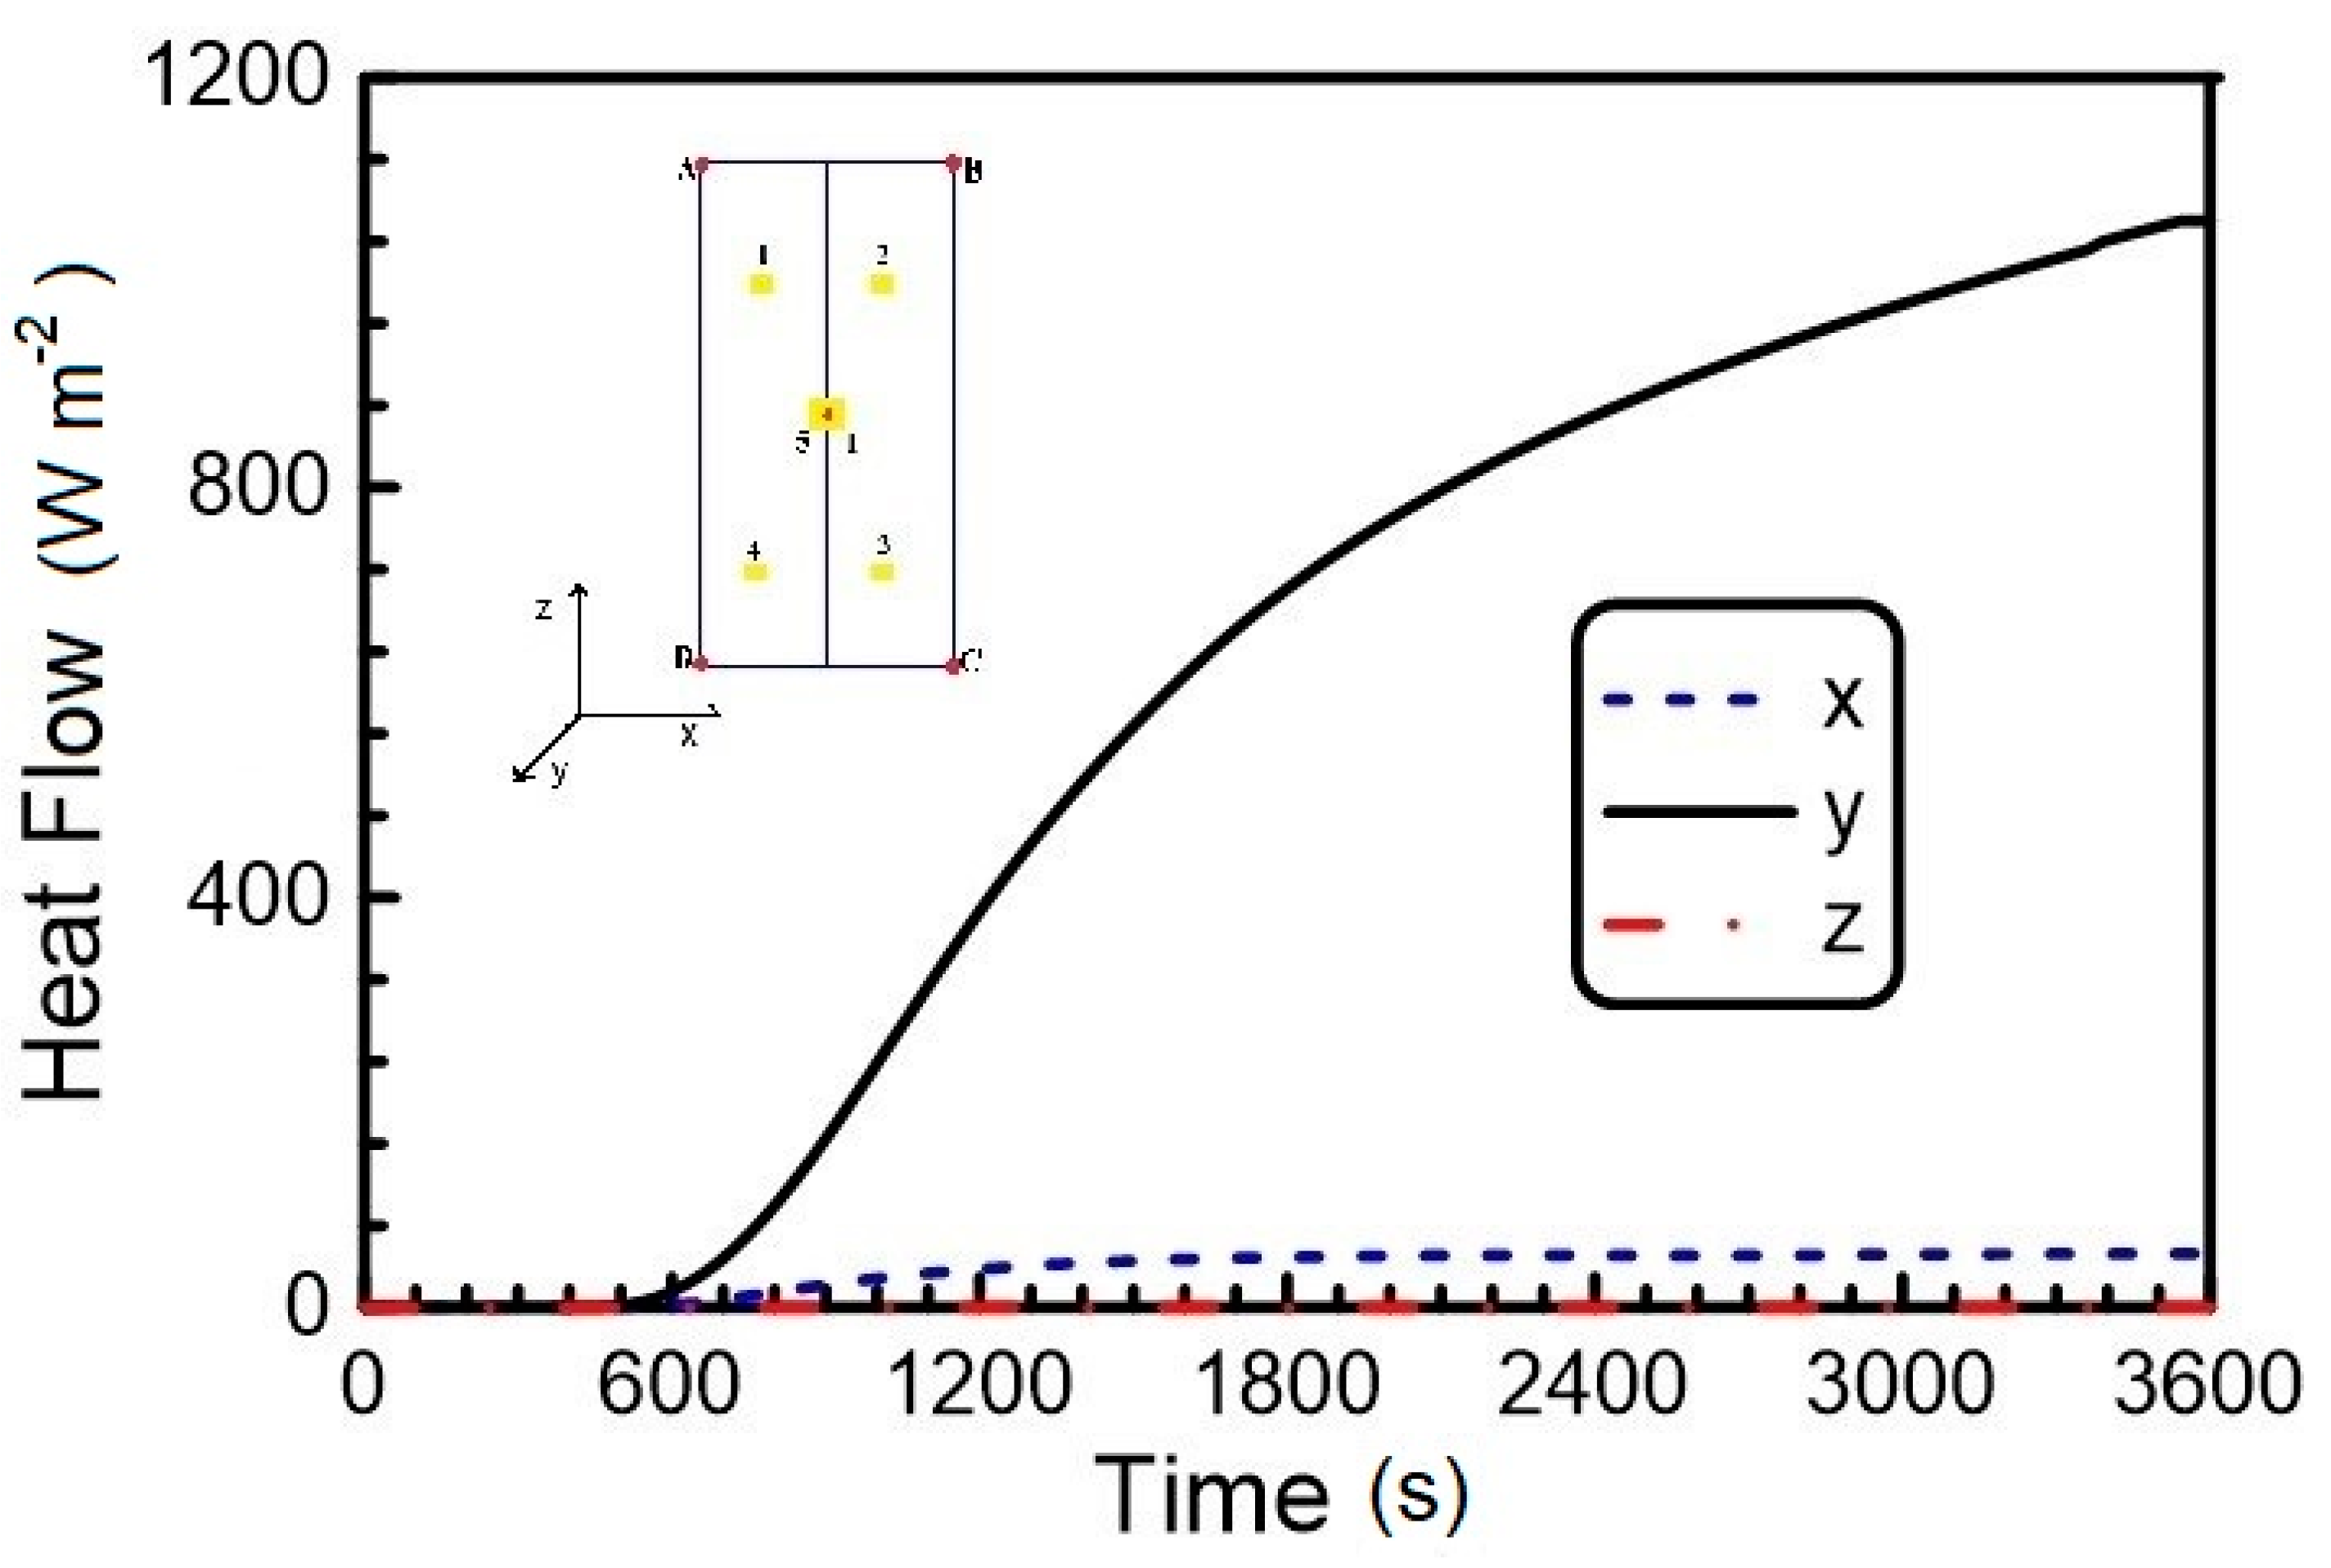
Taking measuring point 1 as a reference (at a distance of 312.0 mm and 562.5 mm from the edges of the door along x- and z-direction, respectively), the decomposition of the heat flow into the three Cartesian directions is reported in Figure 8. The influence of the thermal bridge is represented by the heat flow component in x-direction. In the z-direction a negligible contribution is observed as the measuring point 1 is far enough from the upper edge. The heat flow along y-direction represents the heat transmitted by conduction through the door and is the higher contribution.

3.2.5. Fire-Door with the Foam

Table 4 compares the temperatures calculated at the final stage of the fire-resistance test using the foam with those obtained for the rock wool.
An increase of 20 °C in the calculated temperatures is observed with respect to those obtained for the traditional insulator, yet the final temperatures satisfy the requirements reported in the FTP Code for the A-60 class fire-door.
From the structural point of view, the estimated displacements are equal to those obtained for the rock-wool (Table 3) model, given the negligible increase in the thermal load (20 °C) (data not reported).
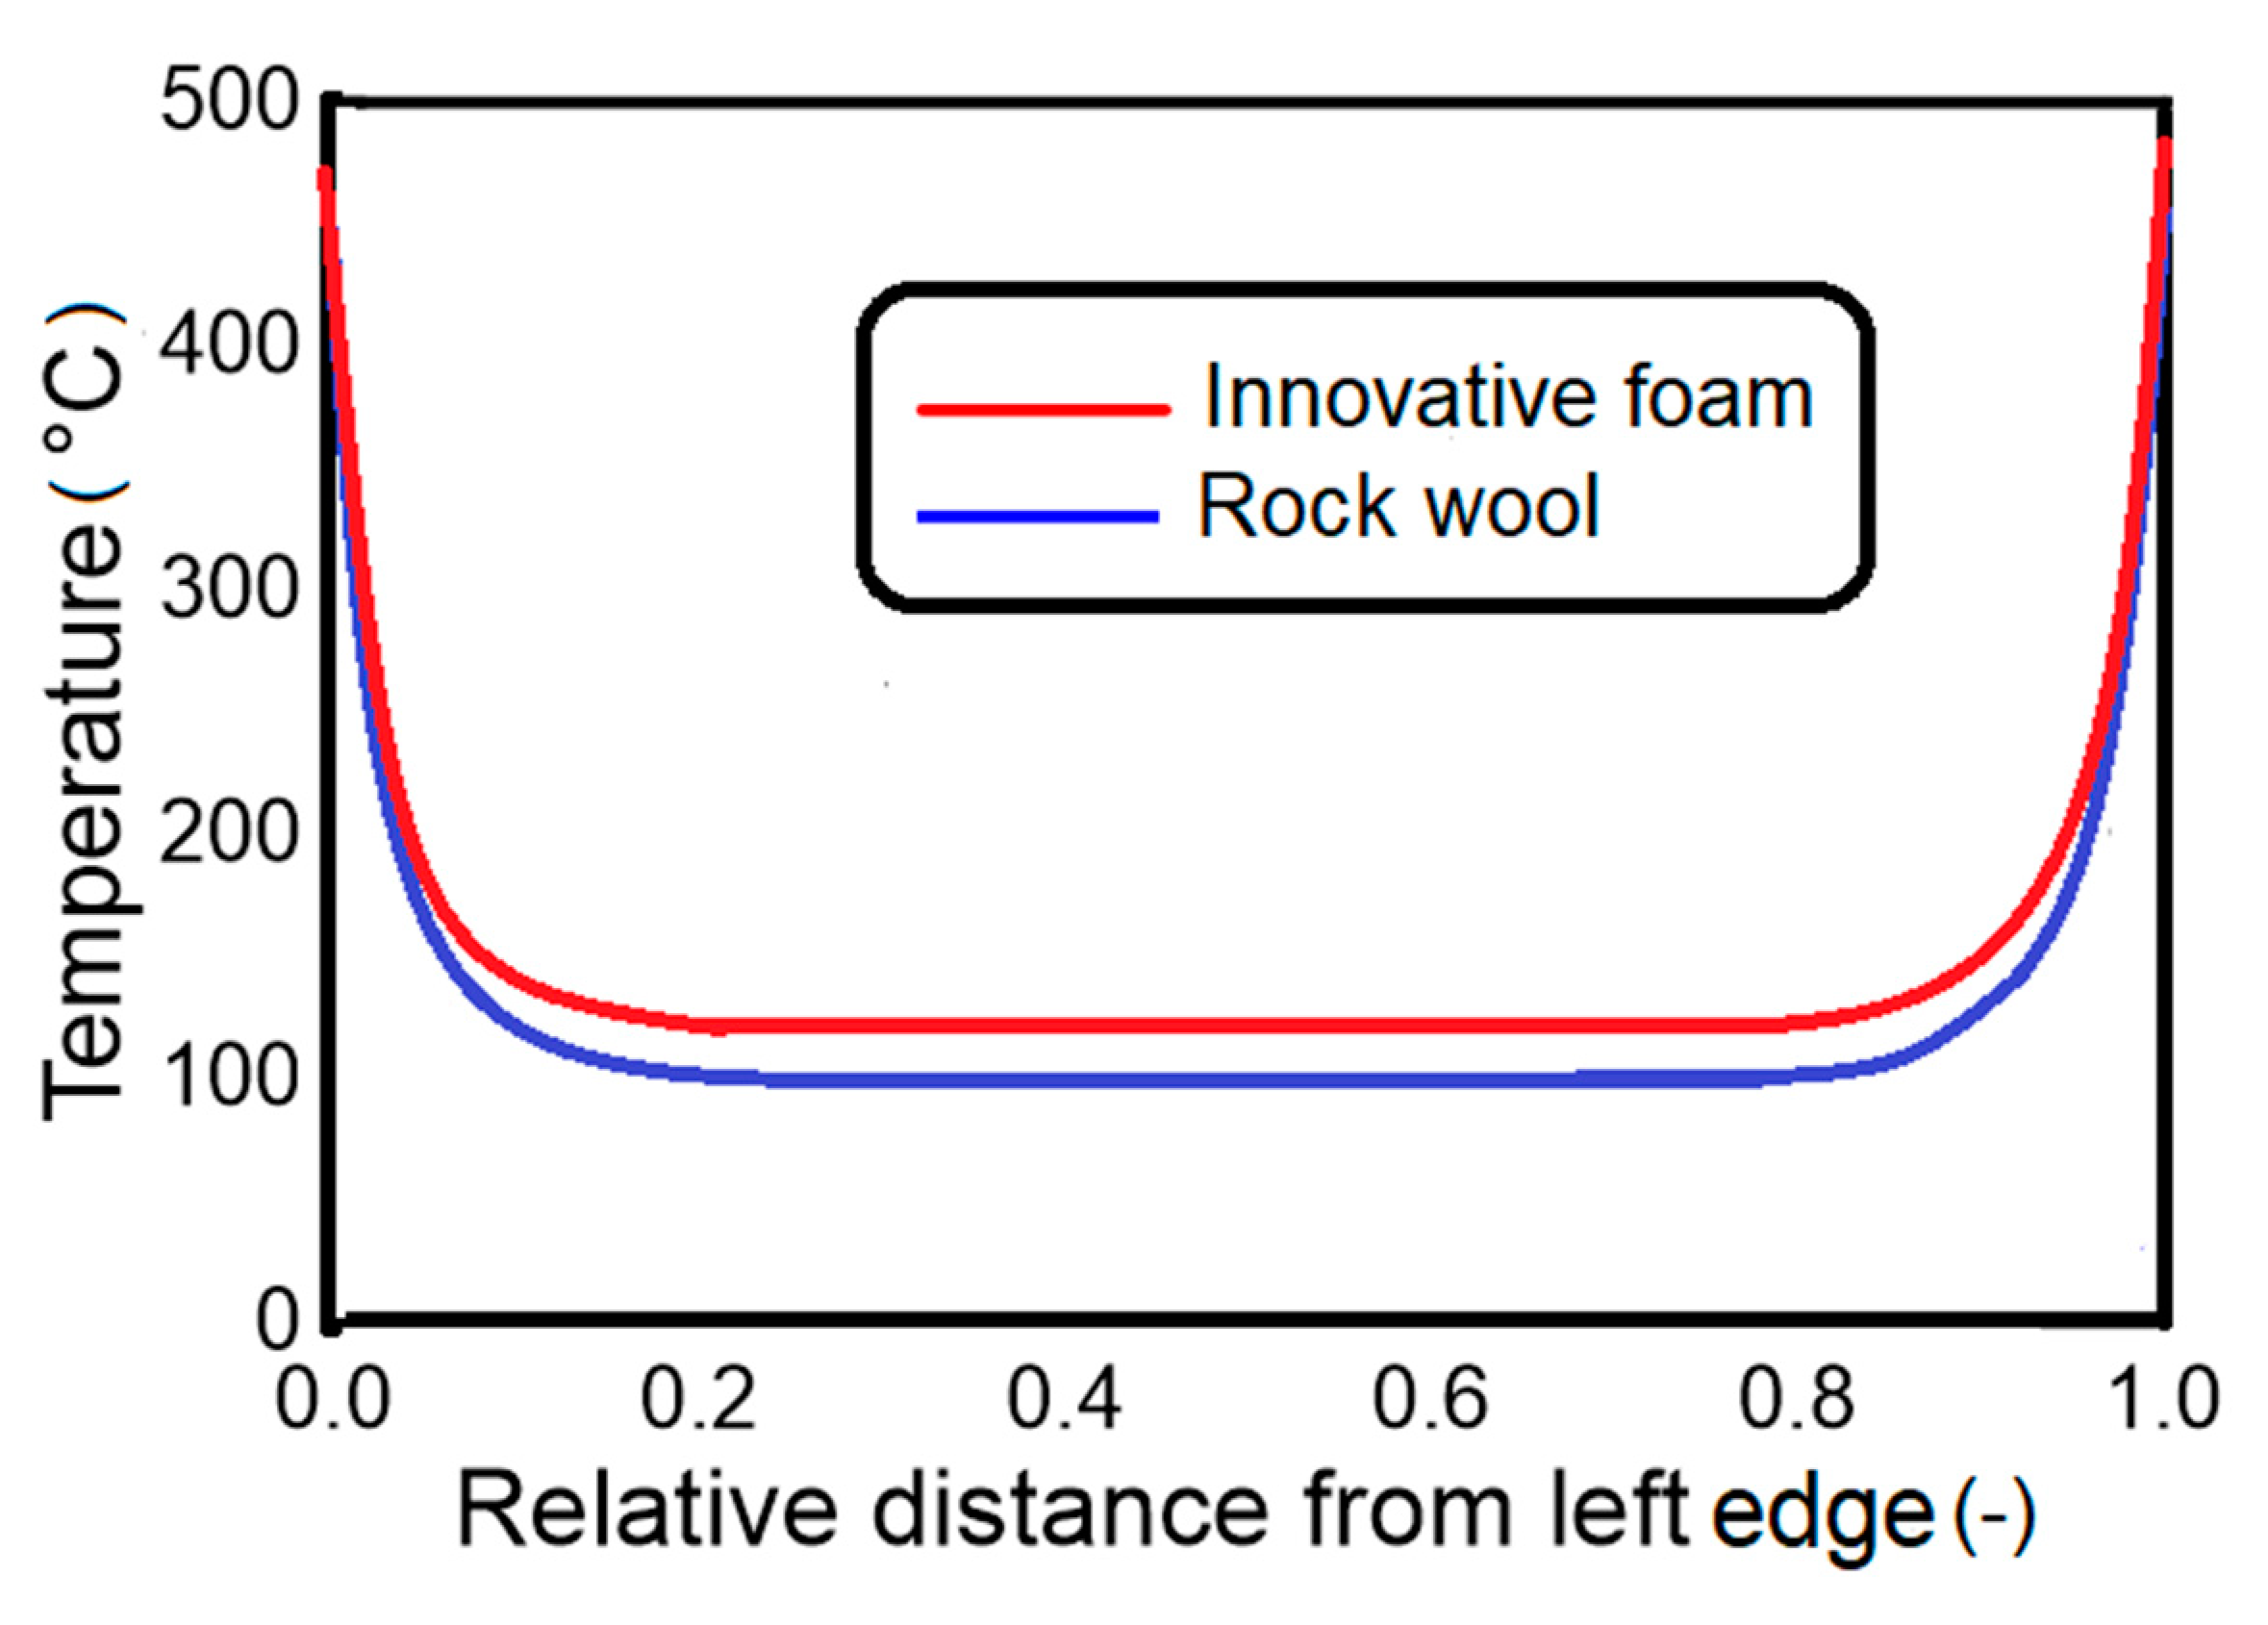
Figure 9 shows the comparison between the transversal profiles calculated along the line passing through the measuring point 5 with rock-wool and foam models (similar profiles are obtained on the other measuring points). Noticeable is that the profile obtained with the foam model has the same shape as that obtained with the rock-wool model but transposed to higher temperature. Thus, the effect of the thermal bridge (visible up to a relative distance of about 0.2 from the edges) does not change if a different insulator is used.

4. Discussion

4.1. Assessment of the FE Model

The choice of the heat convection coefficient (hc) on the fire-unexposed side of the door heavily affects the modelling—the final calculated temperature on the fire-unexposed side decreased by about 50 °C when hc was increased from 0 to 12 W (m2 K)−1 [13]. The Eurocode 1 [24] recommends the use of values 4 or 9 W (m2 K)−1, when the effects of heat transfer by radiation are considered. The literature shows that hc ranging from 4 to 10 W (m2 K)−1 are used in order to fit the experimental results [2,9,10]. In this work the numerical results could not properly fit with the experimental data using either of the recommended values, as exemplified in Table 2. Noticeably, the Eurocode 1 recommended values could reasonably fit well to the data obtained on a door with different construction geometry (compare to caption of Figure 10), as observed from the analysis in the preliminary study [14]. This clearly shows the need for the appropriate and independent definition of the boundary conditions. With this aim, the methodology reported in Section 2.2.2 has been proposed to calculate the T2 temperature and hence hc, using the geometry of the door and the physical properties of the employed materials as input data—this approach leads to a self-consistent procedure. Moreover, a criterion for the numerical validation of the results is proposed to confirm the reliability of the calculation. Noticeably, the presented self-consistent procedure can also properly fit to the results of the door analyzed in the preliminary study (data not reported for brevity) [14].
Convection and radiation phenomena inside the door are irrelevant [11] due to the use of relatively dense materials (d ≥ 130 kg m−3) [31,32].
The value of 25 W (m2 K)−1, recommended by Eurocode 1 [25] for the convection coefficient on the fire-exposed side of the door, is quite consistent with the high temperature inside the furnace (945 °C) and clearly does not depend on the door employed.
Emissivity factors ranging from 0.3 to 1.0 are adopted [9,10], mostly giving no justification. Clean carbon steel features an emissivity factor of 0.3, while the value of 0.7 is recommended in Eurocode 3 [15], consistent with the presence of surfaces oxides [33,34]. To avoid a source of possible flame propagation, unpainted doors are generally used for the FTP fire test, with a film of surface oxide—accordingly, a value of 0.7 is used and recommended for the calculation of the equivalent convection parameter (H).
The use of constant convective coefficients is certainly appropriate for the fire-exposed side of the door as the final temperature is achieved very rapidly and it is subjected to uniform heat. For the fire-unexposed side, the use of variable convective coefficients might be appropriate; yet the results could be numerically assessed, suggesting that a realistic model of the FTP test is achieved. As a matter of fact, the calculated convective coefficient is some sort of an average value that keeps track of the initial and “final” temperature on the door surface. Even if a simplified approach is adopted, the choice appears to effectively describe the fire resistance of fire doors in the FTP test, thus providing an efficient tool with predictive capabilities, useful for innovation.
The structural analysis of the door appears less critical as it depends on the constraints between the door and the frame and on the thermal load. The constraints are directly identified by the technical design of the door. Further, the structural analysis is dominated by the carbon steel structure, as the insulation material does not contribute significantly [2]. Thus, the critical factors for the structural analysis are only the thermal load and the mesh size. The thermal load is obtained as discussed earlier, whereas for defining the mesh size, a sensitivity study and a criterion for choice of the appropriate mesh size have been addressed in the present paper.

4.2. Effect of the Construction Geometry and Use of Innovative Insulation Material

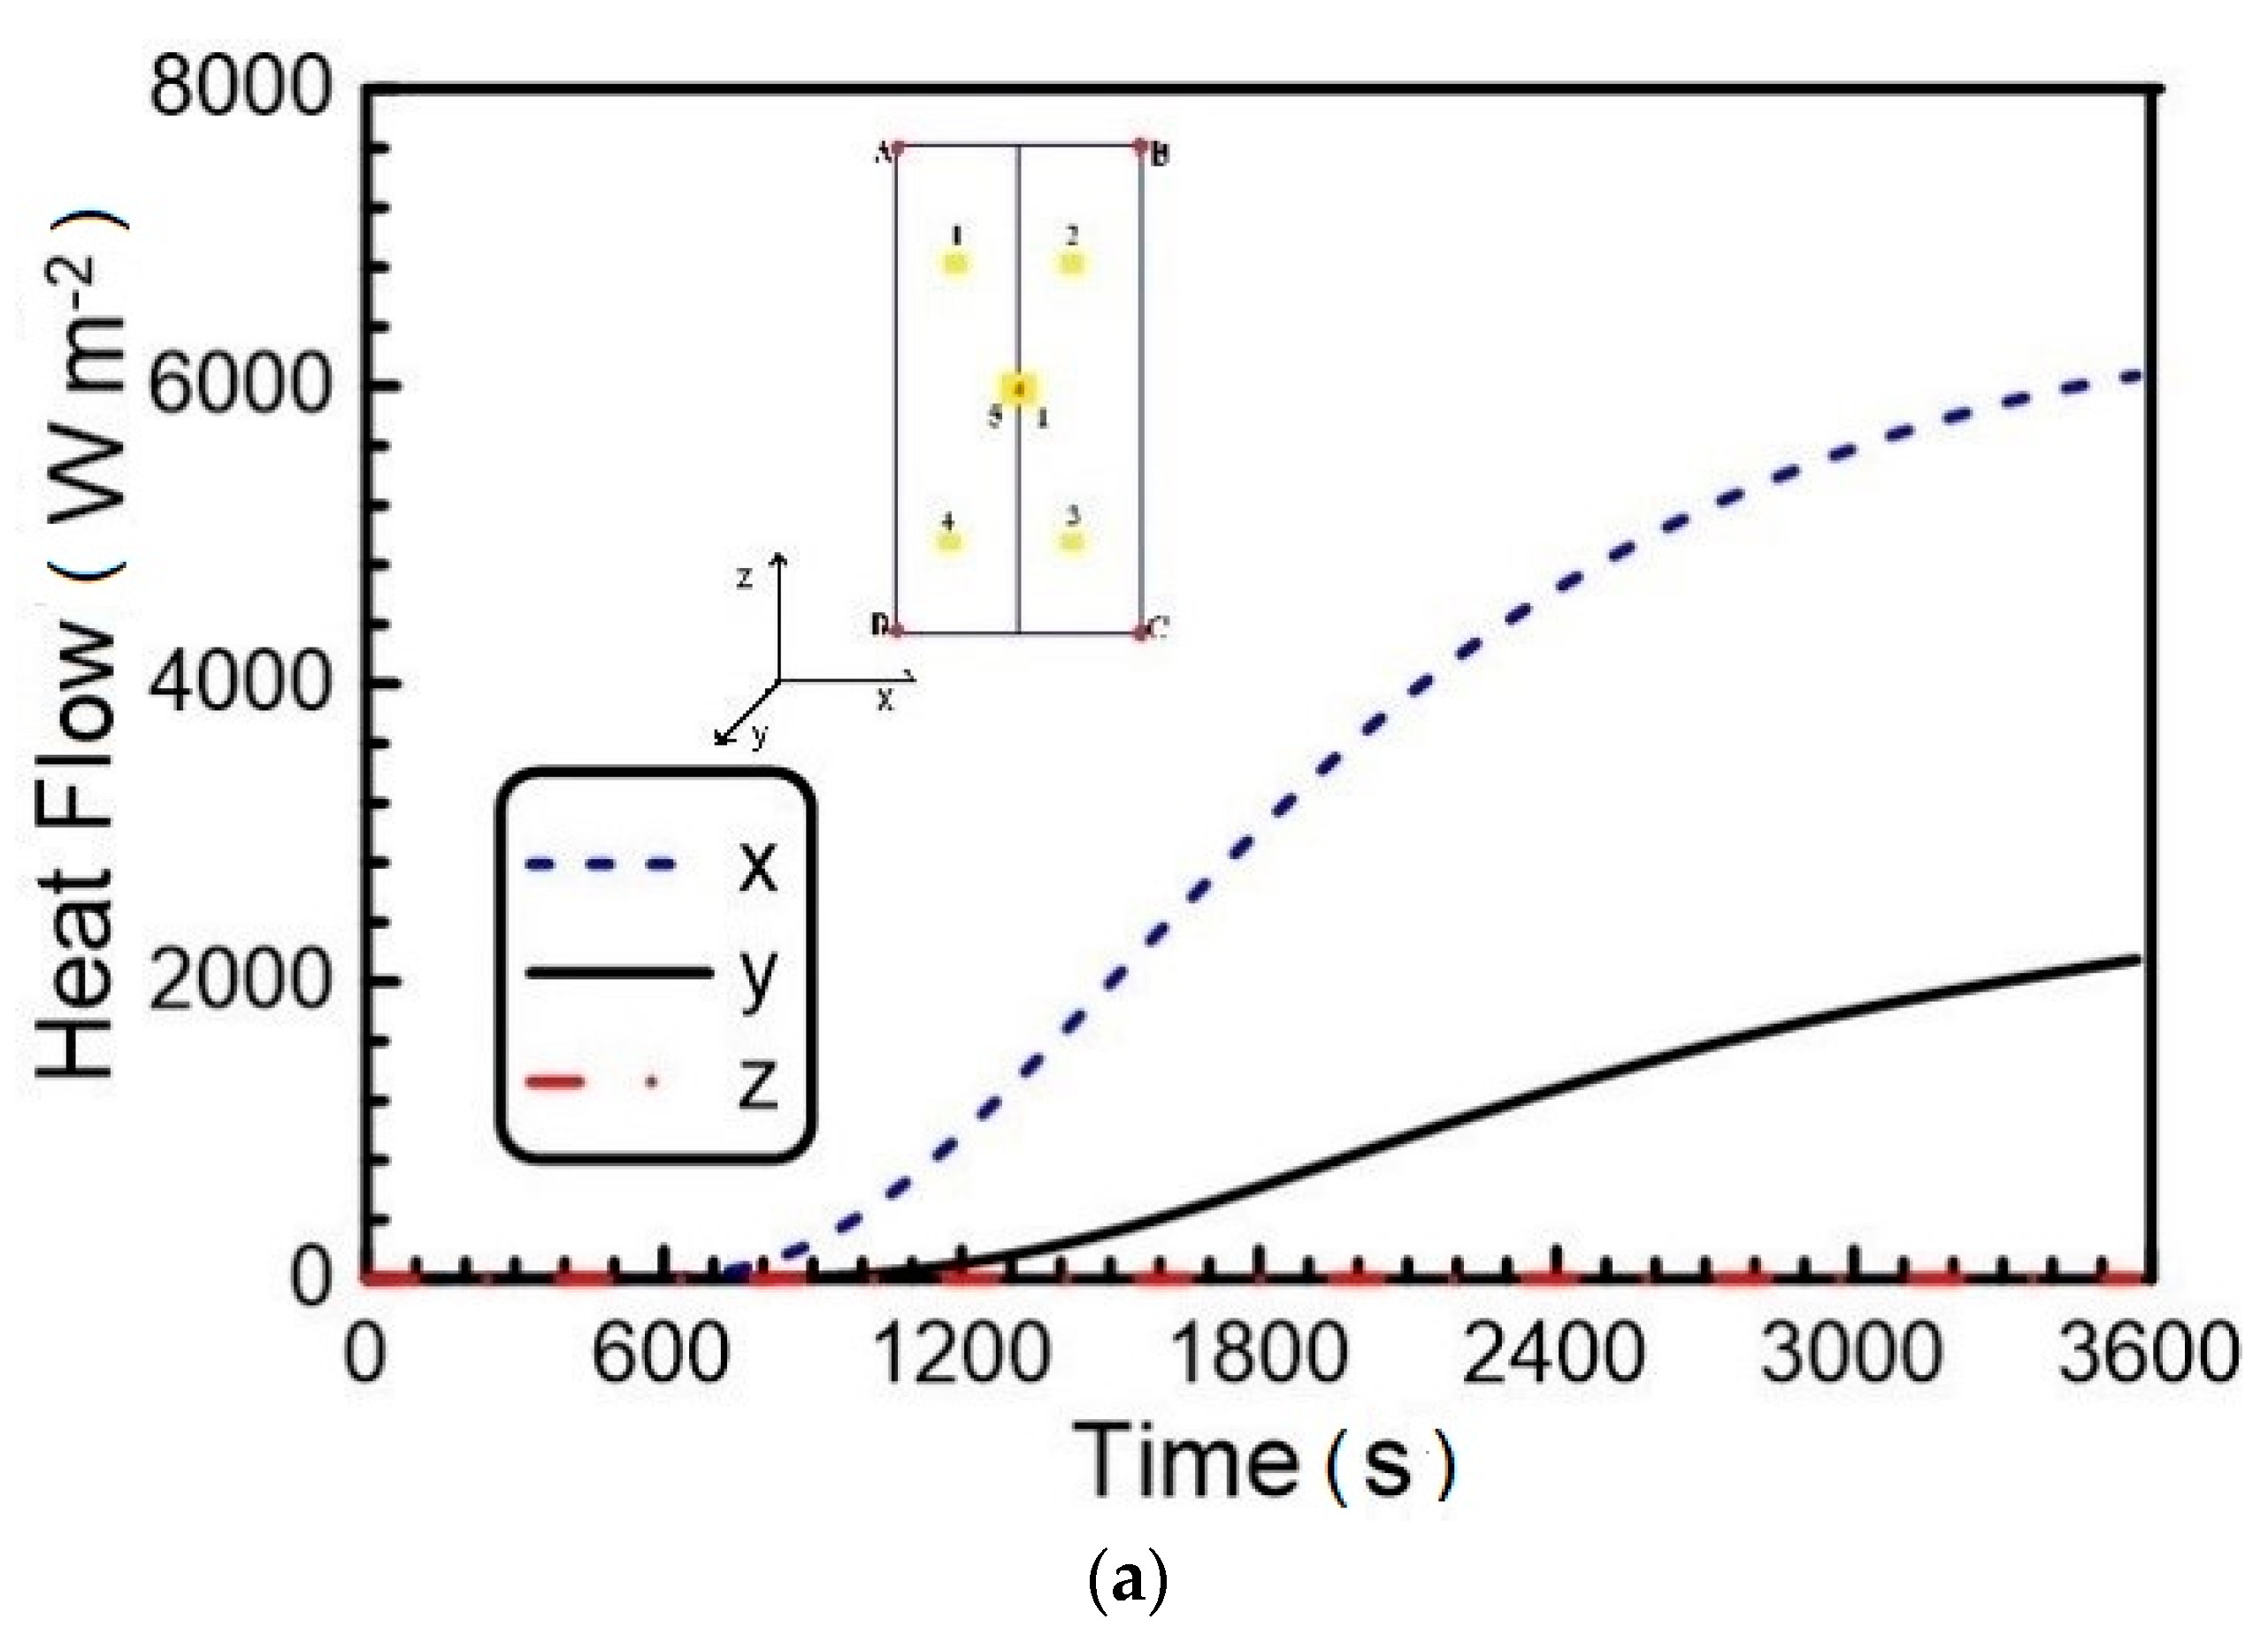
As anticipated in the preliminary study [14], thermal bridges originated at the door edge play a key role in determining its fire resistance. To fully appreciate this effect, Figure 10a reports the decomposition of the heat flow along the Cartesian directions calculated for the door presented in the previous study [14] with edges of 5 mm. The heat flow along the x-direction, which represents the thermal bridge, is even higher than the heat flow passing through the door along the y-direction. On the basis of the results obtained in the previous work, a different geometry of the door has been presented, using thin steel plates (1 mm) for the edge as a way to minimize the thermal bridge. The decomposition of the heat flow reported in Figure 8 fully demonstrates the validity of this solution, along with the results of the FTP test. An important observation is the difference in the pattern of the transversal temperature profile at the final stage of the fire test (60 min) observed in Figure 9 and Figure 10b, respectively, for the door presented here and that of the preliminary study. The trend of the profile shown in Figure 9 clearly suggests that the effects of the thermal bridge reach the location of the measuring points, at a relative distance of 0.25, 0.50 and 0.75. On the contrary, Figure 9 reveals an almost constant temperature profile for relative distances between 0.2 and 0.8. Thus, the heat transfer at the measuring points is essentially affected by the heat flow passing through the door, the other contributions being irrelevant, as shown in Figure 8.
In summary, by reducing the thickness of the sheets, and specifically the thickness of the edges, it is possible to minimize the effect of the thermal bridge and build a thin and light door. Specifically, the results indicate the feasibility of a door 37% thinner and 61% lighter than the door reported in the preliminary study [14]. Moreover, the thermal performance is better since temperatures as low as 100°C could be measured in the FTP fire-test. Keeping in mind that the FTP test limit is an average temperature of 140°C above room temperature (18 °C in this case), this means that there is a “reservoir” of nearly 60°C before the FTP limit is reached; clear evidence that a very efficient thermal insulating capability may not be the most important criterion for the choice of the insulating material to be used within the door. This observation opens new perspectives in the design of fire-doors as far as the use of novel/innovative insulation materials is concerned. As observed in the introduction section, soundproofing is another important issue on onboard ships, particularly passenger ones [35,36,37,38]. Generally speaking, cellular foam materials are extensively employed as insulating materials, as their structure can be optimized for both thermal and acoustic performance [38]. Open pore cellular foams feature better soundproofing properties compared to closed pore ones [38]. Incidentally, the insulator used in this paper presents an open cell microstructure, as shown in Figure 3b, which features significantly better soundproofing capability compared to rock-wool [14]. The results show that it is classifiable as an incombustible material, which is a major requirement for use in fire doors. It is also lighter in comparison to the rock wool and features better mechanical properties (e.g., no loose fiber), however, its thermal insulation capability is poorer. Despite the approximately 30% higher thermal conductivity compared to rock-wool, the numerical analysis of the door equipped with the foam gives a maximum final temperature of 120 °C on the measuring points, well below the limits imposed by FTP fire-test [1]. Clearly, the appropriate construction design of the door allows for the use of innovative materials having advantages in different aspects—e.g., eco-sustainability of the product, its production process [16] and its acoustic properties [14].

5. Conclusions

In this work, a self-consistent numerical model of the FTP Code fire resistance test, has been developed and successfully applied to the optimization of a fire-door.
The results clearly show that an equivalent convection coefficient (Equation (8)), composed of both convective and radiant heat transfer, has to be calculated by considering the physical properties and geometry of the door and computed in order to fit the experimental temperatures. The emissivity factor has to be properly set due to the presence of surface oxides or coatings on the door. From the structural point of view, the critical parameters are the thermal load and the mesh size. For this latter parameter, a criterion for the definition of the mesh size was derived.
The influence of thermal bridge was investigated for the present door—the heat flow decomposition at the measuring point (Figure 8) clearly shows that the contribution along the x-axis, related to the thermal bridge, is negligible if compared to the contribution along the y-axes, related to the conduction through the door. Furthermore, the transversal temperature profile (Figure 9) demonstrates that the influence of the thermal bridge is limited to the door edges and does not reach the measuring points.
Thus, appropriate door design and construction make the manufacturing of a thinner and lighter fire-door possible, empowering the use of innovative insulators.
Indeed, based on the numerical model developed, a new foam has been shown as a possible candidate for use in fire-doors. Despite the fact that it presents a higher thermal conductivity compared to the rock-wool, the obtained temperatures on the door fire-unexposed side (Table 4) show a full compliance with the regulation requirements [1].

Author Contributions

G.K.O.D. and M.C. performed experimental measurements. G.K.O.D. performed numerical simulations. G.K.O.D., M.C. and J.K. wrote the paper. A.M., J.K. and F.M. overviewed the research and edited the paper. All authors have read and agreed to the published version of the manuscript.

Funding

This research received no external funding.

Acknowledgments

Officine Del Bello MBM Srl is acknowledged for the RINA certification data.

Conflicts of Interest

The authors declare no conflict of interest. The funders had no role in the design of the study; in the collection, analyses, or interpretation of data; in the writing of the manuscript, or in the decision to publish the results.

References

  1. International Code for Application of Fire Test Procedures (FTP Code); Annex 1, Part 3; International Maritime Organization (IMO): London, UK, 2010.
  2. Moro, L.; De Bona, F.; Gasparetto, A.; Novak, J.S.; Boscariol, P. Innovative design of fire doors: Computational modeling and experimental validation. Fire Technol. 2017, 53, 1833–1846. [Google Scholar] [CrossRef]
  3. Asdrubali, F.; D’Alessandro, F.; Schiavoni, S. A review of unconventional sustainable building insulation materials. Sustain. Mater. Technol. 2015, 4, 1–17. [Google Scholar] [CrossRef]
  4. Papadopoulos, A.M. State of the art in thermal insulation materials and aims for future developments. Energy Build. 2005, 37, 77–86. [Google Scholar] [CrossRef]
  5. Harrison, P.; Holmes, P.; Bevan, R.; Kamps, K.; Levy, L.; Greim, H. Regulatory risk assessment approaches for synthetic mineral fibres. Regul. Toxicol. Pharm. 2015, 73, 425–441. [Google Scholar] [CrossRef] [Green Version]
  6. Tang, X.; Yan, X. Acoustic energy absorption properties of fibrous materials: A review. Compos. Part A 2017, 101, 360–380. [Google Scholar] [CrossRef]
  7. Wang, C.-N.; Torng, J.-H. Experimental study of the absorption characteristics of some porous fibrous materials. Appl. Acoust. 2001, 62, 447–459. [Google Scholar] [CrossRef]
  8. Caniato, M.; Kyaw Oo D’Amore, G.; Kaspar, J.; Gasparella, A. Sound absorption performance of sustainable foam materials: Application of analytical and numerical tools for the optimization of forecasting models. Appl. Acoust. 2020, 161. [Google Scholar] [CrossRef]
  9. Boscariol, P.; De Bona, F.; Gasparetto, A.; Moro, L. Thermo-mechanical analysis of a fire door for naval applications. J. Fire Sci. 2015, 33, 142–156. [Google Scholar] [CrossRef]
  10. Tabaddor, M.; Gandhi, P.D.; Jones, G. Thermo-mechanical analysis of fire doors subjected to a fire endurance test. J. Fire. Prot. Eng. 2009, 19, 51–71. [Google Scholar] [CrossRef]
  11. Capote, J.A.; Alvear, D.; Abreu, O.; Lazaro, M.; Boffill, Y.; Manzanares, A.; Maamar, M. Assessment of physical phenomena associated to fire doors during standard tests. Fire Technol. 2013, 49, 357–378. [Google Scholar] [CrossRef]
  12. Teytelman, L. No more excuses for non-reproducible methods. Nature 2018, 560, 411. [Google Scholar] [CrossRef] [PubMed] [Green Version]
  13. Hugi, E.; Wakili, K.G.; Wullschleger, L. Measured and calculated temperature evolution on the room side of a butted steel door frame subjected to the standard fire of ISO 834. Fire Saf. J. 2009, 44, 808–812. [Google Scholar] [CrossRef]
  14. D’Amore, G.K.O.; Marinò, A.; Kašpar, J. Numerical modeling of fire resistance test as a tool to design lightweight marine fire doors: A preliminary study. J. Marine Sci. Eng. 2020, 8, 520. [Google Scholar] [CrossRef]
  15. Eurocode 3: Design of Steel Structures—Part 1–2: General rules—Structural Fire Design; European Committee for Standardization: Brussels, Belgium, 2005.
  16. Caniato, M.; Travan, A. Method for Recycling Waste Material. European Patent EP 3216825 B1, 28 August 2019. [Google Scholar]
  17. ASTM. D1621: Standard Test Method for Compressive Properties of Rigid Cellular Plastics; ASTM International: West Conshohocken, PA, USA, 2000. [Google Scholar]
  18. ASTM. C518: Standard Test Method for Steady-State Thermal Transmission Properties by Means of the Heat Flow Meter Apparatus; ASTM International: West Conshohocken, PA, USA, 2017. [Google Scholar]
  19. Incropera, F.P.; DeWitt, D.P.; Bergman, T.L.; Lavine, A.S. Fundamentals of Heat and Mass Transfer, 6th ed.; John Wiley & Sons: Hoboken, NJ, USA, 2007; ISBN 13:978-0471457282. [Google Scholar]
  20. ISO 10456: Building Materials and Products, Hygrothermal Properties, Tabulated Design Values and Procedures for Determining Declared and Design Hermal Values; International Organization for Standardization: Geneva, Switzerland, 2007.
  21. ISO 1182: Reaction to Fire Tests for Products—Non-Combustibility Test; International Organization for Standardization: Geneva, Switzerland, 2010.
  22. Test Report No. 2016CS011021/14; Registro Navale Italiano (RINA): Genoa, Italy, 2017.
  23. Green, D.W.; Perry, R.H. Section 5: Heat and mass transfer. In Perry’s Chemical Engineers’ Handbook; McGraw-Hill Professional: New York, NY, USA, 2008; pp. 1–83. ISBN 0-07-154212-4. [Google Scholar]
  24. Dry Air Properties. Available online: https://www.engineeringtoolbox.com/dry-air-properties-d_973.html (accessed on 10 September 2019).
  25. Eurocode 1: Actions on Structures—Part 1–2: General Actions—Actions on Structures Exposed to Fire; European Committee for Standardization: Brussels, Belgium, 2002.
  26. Bergman, T.L.; Incropera, F.P.; Dewitt, D.P.; Lavine, A.S. Fundamentals of Heat and Mass Transfer, 7th ed.; John Wiley & Sons: Hoboken, NJ, USA, 2011; ISBN 978-0-470-50197-9. [Google Scholar]
  27. Kwaśniewski, L. Application of grid convergence index in FE computation. Bull. Pol. Acad. Sci. Tech. Sci. 2013, 61, 123–128. [Google Scholar] [CrossRef] [Green Version]
  28. Mauro, F.; Cerni, P.; Nabergoj, R. Rans calculations on submerged bodies. In Proceedings of the 23rd International Conference Engineering Mechanics, Svratka, Czech Republic, 15–18 May 2017; pp. 630–633. [Google Scholar]
  29. Richardson, L.F. The Approximate Arithmetical Solution by Finite Differences of Physical Problems Involving Differential Equations, with an Application to the Stresses in a Masonry Dam. Philos. Trans. R. Soc. A 1911, 210, 307–357. [Google Scholar]
  30. Roache, P.J. Verification and Validation in Computational Science and Engineering; Hermosa Pub: Sierra County, NM, USA, 1998; ISBN 13 978-0913478080. [Google Scholar]
  31. Batty, W.J.; Probert, S.D.; Lane, J.W. Convection and radiation in layers of low-density fibrous insulants. Appl. Energy 1984, 18, 143–161. [Google Scholar] [CrossRef]
  32. Dyrbøl, S.; Svendsen, S.; Elmroth, A. Experimental investigation of the effect of natural convection on heat transfer in mineral wool. J. Therm. Envel. Build. Sci. 2002, 26, 153–164. [Google Scholar] [CrossRef]
  33. Fang, H.; Wong, M.B.; Bai, Y. Heating rate effect on the thermophysical properties of steel in fire. J. Constr. Steel Res. 2017, 128, 611–617. [Google Scholar] [CrossRef]
  34. Sadiq, H.; Wong, M.B.; Tashan, J.; Al-Mahaidi, R.; Zhao, X.-L. Determination of steel emissivity for the temperature prediction of structural steel members in fire. J. Mater. Civ. Eng. 2013, 25, 167–173. [Google Scholar] [CrossRef]
  35. MSC 91/22/Add.1 Adoption of the Code on Noise Levels on Board Ships; International Maritime Organization (IMO): London, UK, 2014.
  36. Borelli, D.; Gaggero, T.; Rizzuto, E.; Schenone, C. Analysis of noise on board a ship during navigation and manoeuvres. Ocean Eng. 2015, 105, 256–269. [Google Scholar] [CrossRef]
  37. Goujard, B.; Sakout, A.; Valeau, V. Acoustic comfort on board ships: An evaluation based on a questionnaire. Appl. Acoust. 2005, 66, 1063–1073. [Google Scholar] [CrossRef]
  38. Lind-Nordgren, E.; Göransson, P. Optimising open porous foam for acoustical and vibrational performance. J. Sound Vib. 2010, 329, 753–767. [Google Scholar] [CrossRef]
Figure 1. (a) Model geometry; (b) test measuring points: location of thermocouples (1, 2, 3, 4, 5) and displacements measurements point (A, B, C, D, I).
Applsci 10 05736 g001
Figure 2. Particular of the door mesh.
Applsci 10 05736 g002
Figure 3. (a) Fiberglass foam; (b) fiberglass foam microstructure.
Applsci 10 05736 g003
Figure 4. Thermal conductivity vs. temperature; comparison between ISO curves and experimental data.
Applsci 10 05736 g004
Figure 5. Cell dimension vs. displacements calculated at point B. Comparison with the experimental displacements (RINA test report n. 2016CS011021/14 2017).
Applsci 10 05736 g005
Figure 6. Temperature distribution on the fire-unexposed side of the door at the final stage of the fire test (60 min); scale in (K).
Applsci 10 05736 g006
Figure 7. Displacements field at the final stage of the fire test (60 min); scale in (m). Displacements perpendicular to the door face, along y direction.
Applsci 10 05736 g007
Figure 8. Measurement point 1: decomposition of the heat flow as a function of time along the Cartesian directions (x, y, z).
Applsci 10 05736 g008
Figure 9. Transversal temperature profile at the final stage of the fire test (60 min) along the line passing through measuring point 5 (see black line in Figure 1b): comparison between foam and rock-wool model.
Applsci 10 05736 g009
Figure 10. (a) Decomposition of the heat flow as a function of time along the Cartesian directions (x, y, z) at measuring point 1: (b) Transversal temperature profile at the final stage of the fire test (60 min) along the line passing through measuring point 5 (see black line in Figure 1b). Door characteristics: 117 mm width, 2117 mm height, steel sheet of 5.0 mm and 1.5 mm for the exposed side with rock-wool, 60 mm thick, and 180 kg m−3 density as insulator. Adapted from [14].
Applsci 10 05736 g010aApplsci 10 05736 g010b
Table 1. Material properties at 20 °C.
MaterialYoung Modulus E
(GPa)
Poisson Ratio
ν
(-)
Density
ρ
(kg m−3)
Thermal Conductivity
k
(W (m K)−1)
Carbon steel1900.3780027.29
Rock wool1.0 × 10−30.01500.035
Foam3.4 × 10−30.01300.045
Table 2. Comparison between modelled—using, respectively, Eurocode and self-consistent convection coefficient—and measured temperatures; error estimation and validation of the self-consistent model.
PointT Eurocode Model (°C)T Self-Consistent Model (°C)T Measured * (°C)|E|U
1206.0100.099.01.01.4
2206.0100.0100.00.01.0
5204.099.099.00.01.0
3206.0100.0101.01.01.4
4206.0100.0101.01.01.4
* Data reported in the RINA test report n. 2016CS011021/14 2017. Ambient temperature 18 °C.
Table 3. Comparison between model and measured displacements; error estimation and validation.
Pointd Model (mm)d Measured * (mm)|E|U
A0.50.00.51.0
B19.219.00.21.0
C19.2ND//
D0.5ND//
I17.917.00.91.3
* Data reported in the RINA test report n. 2016CS011021/14 2017.
Table 4. Comparison between temperatures of the foam and rock-wool models.
PositionT Foam Model (°C)T Rock Wool Model (°C)∆T (°C)
112010020
212010020
51199920
312010020
412010020