Article

Prediction of Damage Level of Slab-Column Joints under Blast Load

1
Department of Civil and Environmental Engineering, The University of Suwon, Gyeonggi-do 18323, Korea
2
Department of Architecture, The University of Suwon, Gyeonggi-do 18323, Korea
*
Author to whom correspondence should be addressed.
Appl. Sci. 2020, 10(17), 5837; https://doi.org/10.3390/app10175837
Submission received: 23 July 2020 / Revised: 21 August 2020 / Accepted: 21 August 2020 / Published: 23 August 2020
(This article belongs to the Special Issue Buildings and Structures under Extreme Loads II)

Abstract

:
The behavior of a slab-column joint subjected to blast loads was studied by numerical analysis using a general-purpose finite element analysis program, LS-DYNA. Under the explosive load, the joint region known as the stress disturbed zone was defined as a region with a scaled distance of 0.1 m/kg1/3 or less through comparison with ConWep’s empirical formula. Displacement and support rotation according to Trinitrotoluene (TNT) weight and scaled distance were investigated by dividing in and out of the joint region. In addition, fracture volume was newly proposed as an evaluation factor for blast-resistant performance, and it was confirmed that the degree of damage to a member due to blast loads was well represented by the fracture volume. Finally, a prediction equation for the blast-resistant performance of the slab-column joint was proposed, and the reliability and accuracy of the equation were verified through additional numerical analysis.

1. Introduction

Recently, a number of cases have been reported in which structures are seriously damaged by explosion loads caused by terrorism or accidents. It is necessary to protect citizens’ property and lives through blast-resistant design of structures against such extreme events.
The explosion load is characterized by very high pressure in a very short time. In addition to the peculiarity of the load, the inhomogeneity of the material of concrete causes difficulties in the blast-resistant design of reinforced concrete (RC) structures [1,2,3]. For this reason, the blast-resistant design of RC structures has generally been overly conservative, mainly by increasing the thickness of the members or by reinforcing bars excessively. Therefore, reliable blast-resistant performance evaluation and prediction methods are required for the rational blast-resistant design of RC structures.
While many studies have been conducted on the blast-resistant behavior of single members, such as columns and beams, sufficient studies have not been conducted in the case of joints composed of two or more single members [4,5,6]. However, the joint may cause the collapse of the entire structural system upon its failure, so more attention is required in design [7,8]. Therefore, this study focused on the slab-column joints, which is one of the common types of joints.
Currently, support rotation is the only evaluation factor for the blast-resistant performance of RC members in various design standards, including American Society of Civil Engineers(ASCE) and Department of Defense (DoD) [9,10]. Moreover, no specific guide is provided for the blast-resistant design of joints connecting structural members. According to the previous study, it was confirmed that the support rotation alone was not sufficient to evaluate the blast-resistant performance of the joint [11]. In some cases, even though the support rotation was within the limits of the design criterion, severe fractures in the joint region were observed. As such, the need for additional evaluation factors for blast-resistant performance was confirmed, but no specific solution has been proposed so far. Therefore, this study analyzed the behavior of slab-column joints under blast loads from various viewpoints as well as displacement and support rotation. As a result, it was found that effective fracture volume could be used as a new blast-resistant performance evaluation factor. The effective fracture volume is the total volume of the joint concrete destroyed by the blast load, excluding the concrete cover. In addition, a model for predicting the damage level of the slab-column joints according to the amount and location of explosives was proposed using the effective fracture volume. This could be used not only for the blast-resistant design of new structures but also for determining the level of blast-resistant performance of existing structures.

2. Modeling of Slab-Column Joints

2.1. Analysis Variables

According to the scaled distance, Z (Equation (1)), the behavior of the RC joint due to the blast load was investigated through numerical analysis. That is, the weight of the explosive load, W (kg), and the distance between the explosive material and the joint, R (m), were set as analysis variables.
Z = R/W1/3
As shown in Table 1, the charge weight of the explosion load was determined to describe the terrorist situation in a general facility [12]. Explosives applied to the analysis were limited to a weight of 30 kg or less. It is an explosive material that can be transported by briefcase or bicycle. In addition, 10 kg of explosives is the size of a vest bomb commonly used by terrorists, which can be defined as the minimum weight that can be used in terrorism [13]. Therefore, in this study, 10 kg, 20 kg, and 30 kg Trinitrotoluene (TNT) weights were set as variables for the purpose of simulating a single terrorist situation where no vehicle or heavy equipment is used. As shown in Table 2, when simulating such a small bombing situation, it had a fairly small Z value compared to a free air burst situation with Z of 0.147 m/kg1/3 to 40 m/kg1/3 in general [14]. In this case, it could be seen how the structure behaved when a blast load was applied near the member surface.

2.2. Modeling of Slab-Column Joints

Numerical analysis was performed on the slab-column joint, which is the most common type of joint in RC structures. Figure 1 shows the structural details of the slab-column connection. Numerical analysis was performed using LS-DYNA, a general-purpose finite element analysis program whose reliability has been verified through many previous studies [15,16]. The upper and lower surfaces of the column were completely constrained, and four sides of the slab were constrained in the horizontal direction. In this study, Mat_072R3 was selected from the concrete material models provided by the analysis program LS-DYNA. This material model reflects the strain-rate effect and has already been found in several works of literature to be suitable for analyzing concrete structures under high strain-rate [17,18,19]. However, Mat_072R3 was unable to exhibit local damage caused by explosions, such as crater spalls, which are associated with structural failure and erosion [20]. Therefore, to simulate these characteristics, LS-DYNA’s ‘Add_Erosion’ keyword option was applied to the concrete material model. To model the reinforcing bars, LS-DYNA’s Mat_024 was applied, which is defined as an elastic-plastic material with arbitrary stress versus strain curve and an arbitrary strain-rate dependency. The fracture of Mat_024 is based on plastic deformation [19]. Table 3 shows the properties of the concrete and reinforcement used in the analysis.
Numerical analysis results may vary depending on the mesh size of the element [21,22]. According to the previous studies, when simulating a structure subjected to an explosive load, a mesh size of 25 to 30 mm led to the analysis results, most similar to the experimental results [23,24]. In this study, before the main analysis was conducted, various mesh sizes were evaluated in terms of accuracy and efficiency of analysis, then it was determined that a mesh size of 20~25 mm was the most reasonable. Therefore, the concrete mesh used a 20 mm cubic, 8-node solid element (C3D8), and the rebar was modeled as a 2-node beam element.
The interaction between concrete and reinforcing bars has a great influence on the behavior of RC structures. In particular, interactions, such as bond-slip, are very difficult to simulate. In RC structures subjected to explosion load, modeling reinforcing bars as solids elements and defining contact conditions can be considered. However, it is not recommended because this method dramatically increases the run time of the analysis and often causes analysis errors. Therefore, a method of tying nodes was recommended to simulate the structure’s actual behavior and to provide the simplicity of analysis [18,25]. In this study, the nodes of the reinforcing bar and concrete were connected to each other to provide accurate structural performance.
Blast loads were modeled using the LBE (load blast enhanced) method, where the explosive pressure is applied directly to the element surface. The LBE method has already been verified through many studies [26,27,28,29].
Table 4 shows the analysis conditions. Considering the enough converge of kinetic energy, the end time of analysis was set to 2000 ms. Analysis running time was approximately 6 h and 45 min with slight differences for each variable.

3. Defining a Joint Region under Blast Load

In the slab-column connection under static load, the section at half the effective depth of the slab from the column surface is considered as the critical section [30]. The joints, which are D-regions (disturbed or discontinued region) with complex strain distributions, may exhibit behavior different from that under a static load in a high strain rate region, such as an explosion load. Therefore, in this study, prior to performing the parametric analysis in Table 2, a preliminary numerical analysis was conducted to define the area of the joint in the slab-column connection under the explosive load.
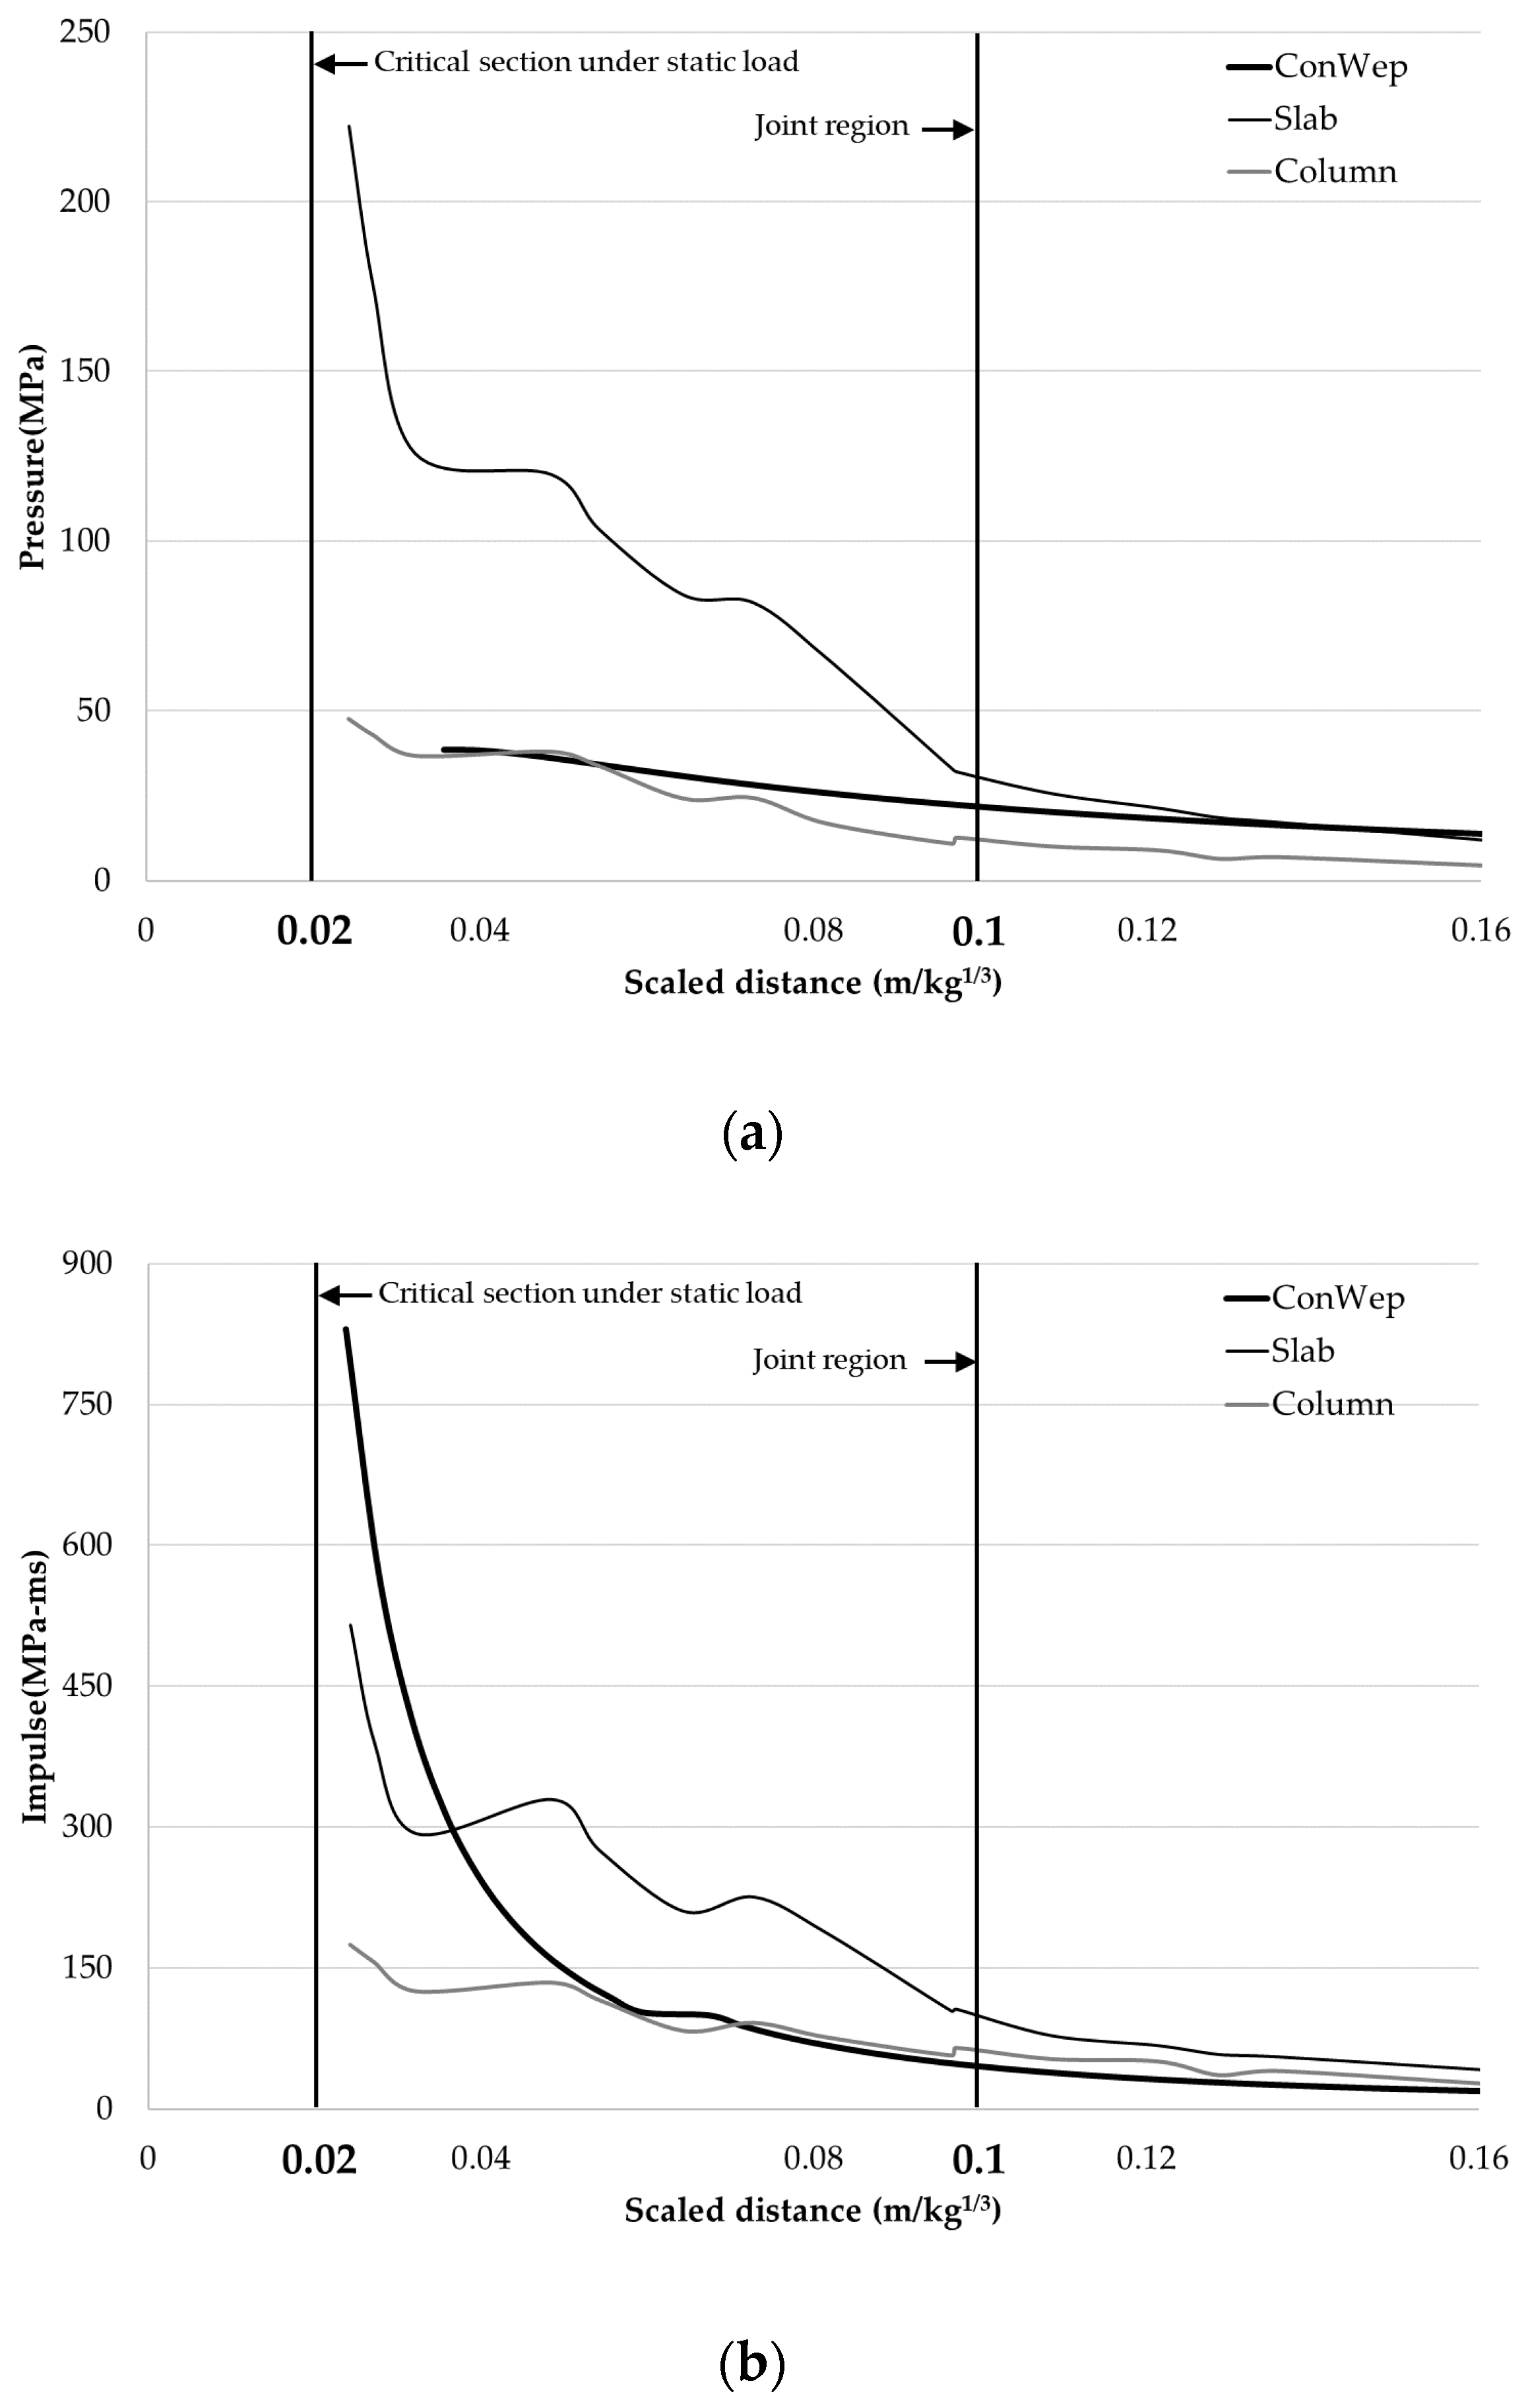
The U.S. Department of Defense (DoD) suggested shock wave parameters, such as pressure and impulse, according to the scaled distance for single members [10]. According to this, it shows a specific pressure or impulse value for an arbitrary scaled distance regardless of the type of members, such as a column or a slab. Therefore, in this study, through the preliminary numerical analysis of the slab-column connection, the scaled distance, where the analysis results for the slab and the column are similar to each other and at the same time to the value suggested by the DoD, was considered as the point separating the joint region from the single-member region.
Figure 2 shows the pressure and impulse according to the scaled distance. The graphs for slab and column are the results obtained through numerical analysis. Here, the pressure and impulse represent the maximum reflected values that occur in the entire region of the modeled slab and column, according to the location of TNT 30 kg. Figure 2 also includes the values proposed by DoD by using the ConWep model [10]. For both pressure and impulse, the analysis results of the column and the slab differed from each other when the scaled distance was small, but from about 0.1 m/kg1/3 or more, the difference was markedly reduced and showed similar values. It should also be noted that from about 0.1 m/kg1/3, both the column and the slab showed pressure and impulse similar to those of the ConWep model. As mentioned above, considering that the ConWep values of DoD are the results derived for a single member, the region with a scaled distance of 0.1 m/kg1/3 or less from the surface of the slab and column can be considered as the joint region, as shown in Figure 3.

4. Numerical Analysis Results and Discussion

4.1. Displacement

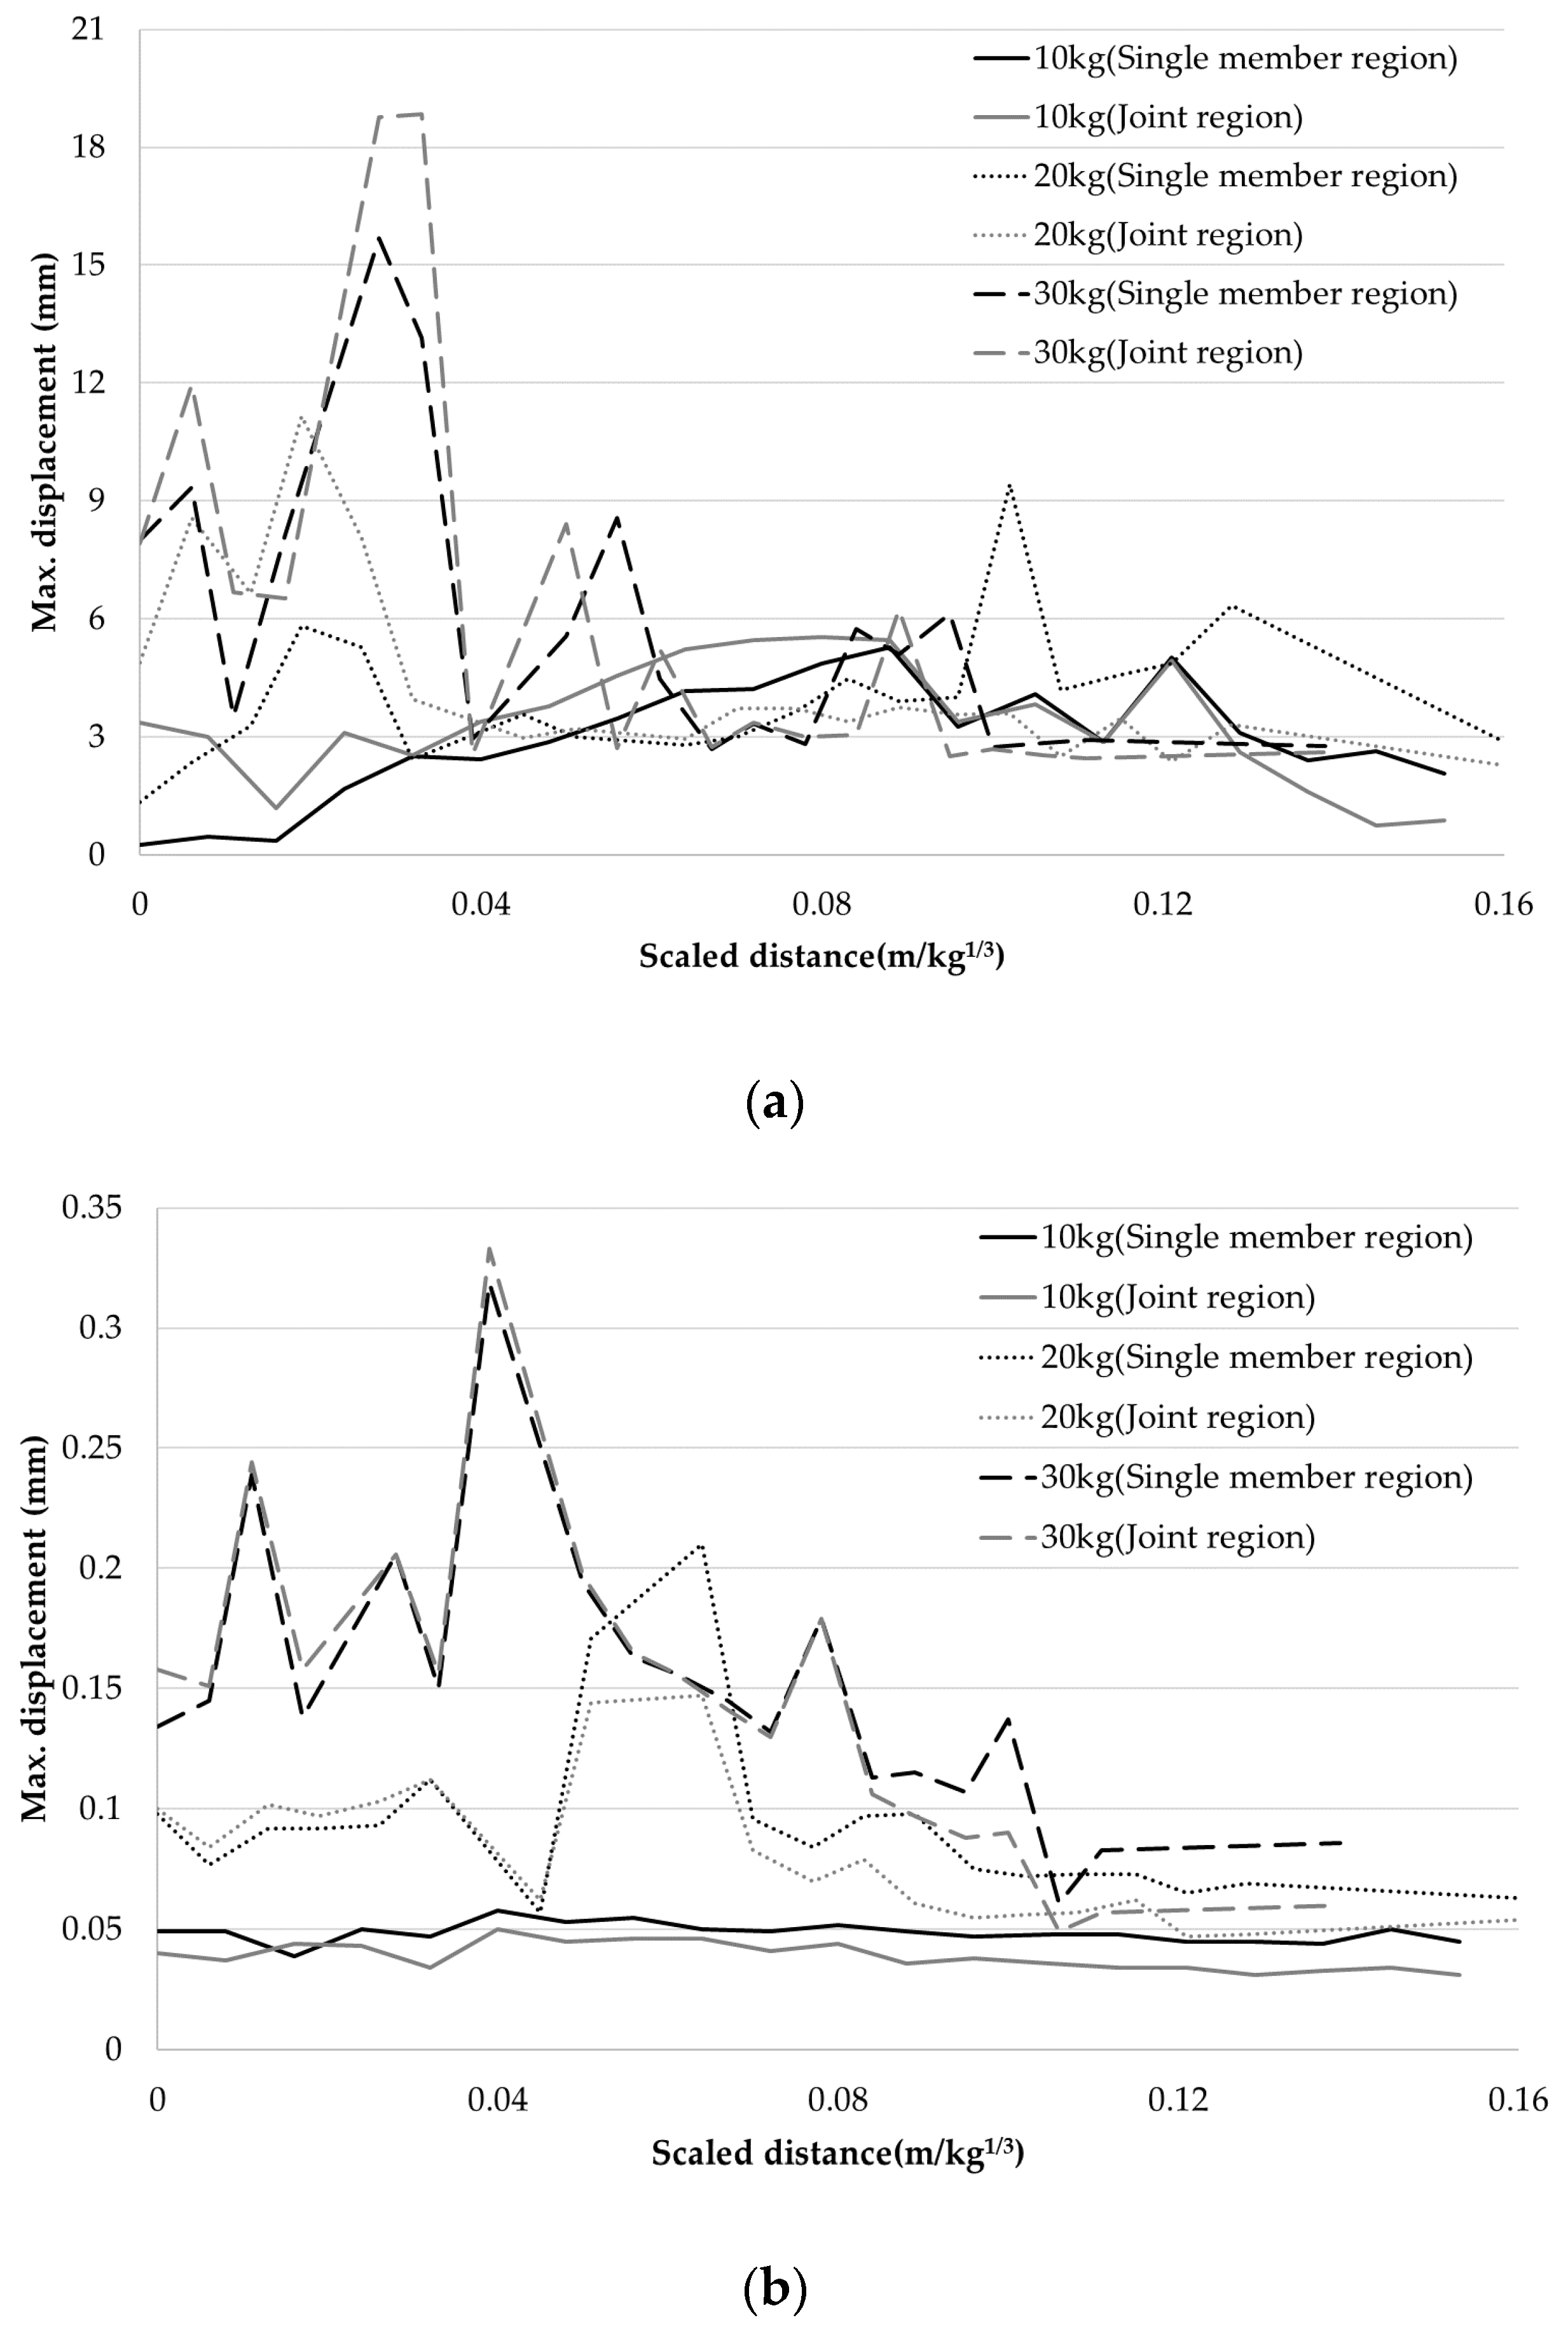
Figure 4 shows the results of the maximum displacement of the slab and the column. The displacement for various scaled distances was observed by increasing the standoff distance of each TNT of 10 kg, 20 kg, or 30 kg. In Figure 4, the displacement represents the maximum displacement generated on the central axis of the cross-section of the slab and column. In addition, according to the results of preliminary numerical analysis, it was divided into a joint region and a single member region based on a scaled distance of 0.1 m/kg1/3, and the maximum displacement in each region was investigated. Here, the distance from the column or slab surface of TNT 10 kg, 20 kg, and 30 kg corresponding to a scaled distance of 0.1 m/kg1/3 was about 215 mm, 271 mm, and 311 mm, respectively. In Figure 4, it was noted that the maximum displacement was not a value at a fixed location but represented the maximum value among displacements that occurred in each region, such as joint and the single-member region, according to different scaled distances.
In all cases, the displacement of the slab was greater than the displacement of the column. This was in line with the results of preliminary numerical analysis, which resulted in greater pressure and impulse in the slab. When the scaled distance was relatively small, the larger the TNT weight, the greater the amount of displacement. However, as the scaled distance became larger, the difference in displacement amount according to the TNT weight was not large. It appeared that the magnitude of shock wave parameters, such as pressure and impulse, transmitted directly to the member decreased significantly as the position of the explosion moved away from the member. When comparing the amount of displacement of the joint region and the single-member region, the slab generally had slightly larger deformation in the joint region, but the difference was not significant. Columns were also observed to have almost the same maximum strain in both regions. However, since there was no clear tendency in the relationship between the scaled distance and the displacement, it was difficult to predict the blast-resistant behavior of the joint based on this relationship.

4.2. Support Rotation

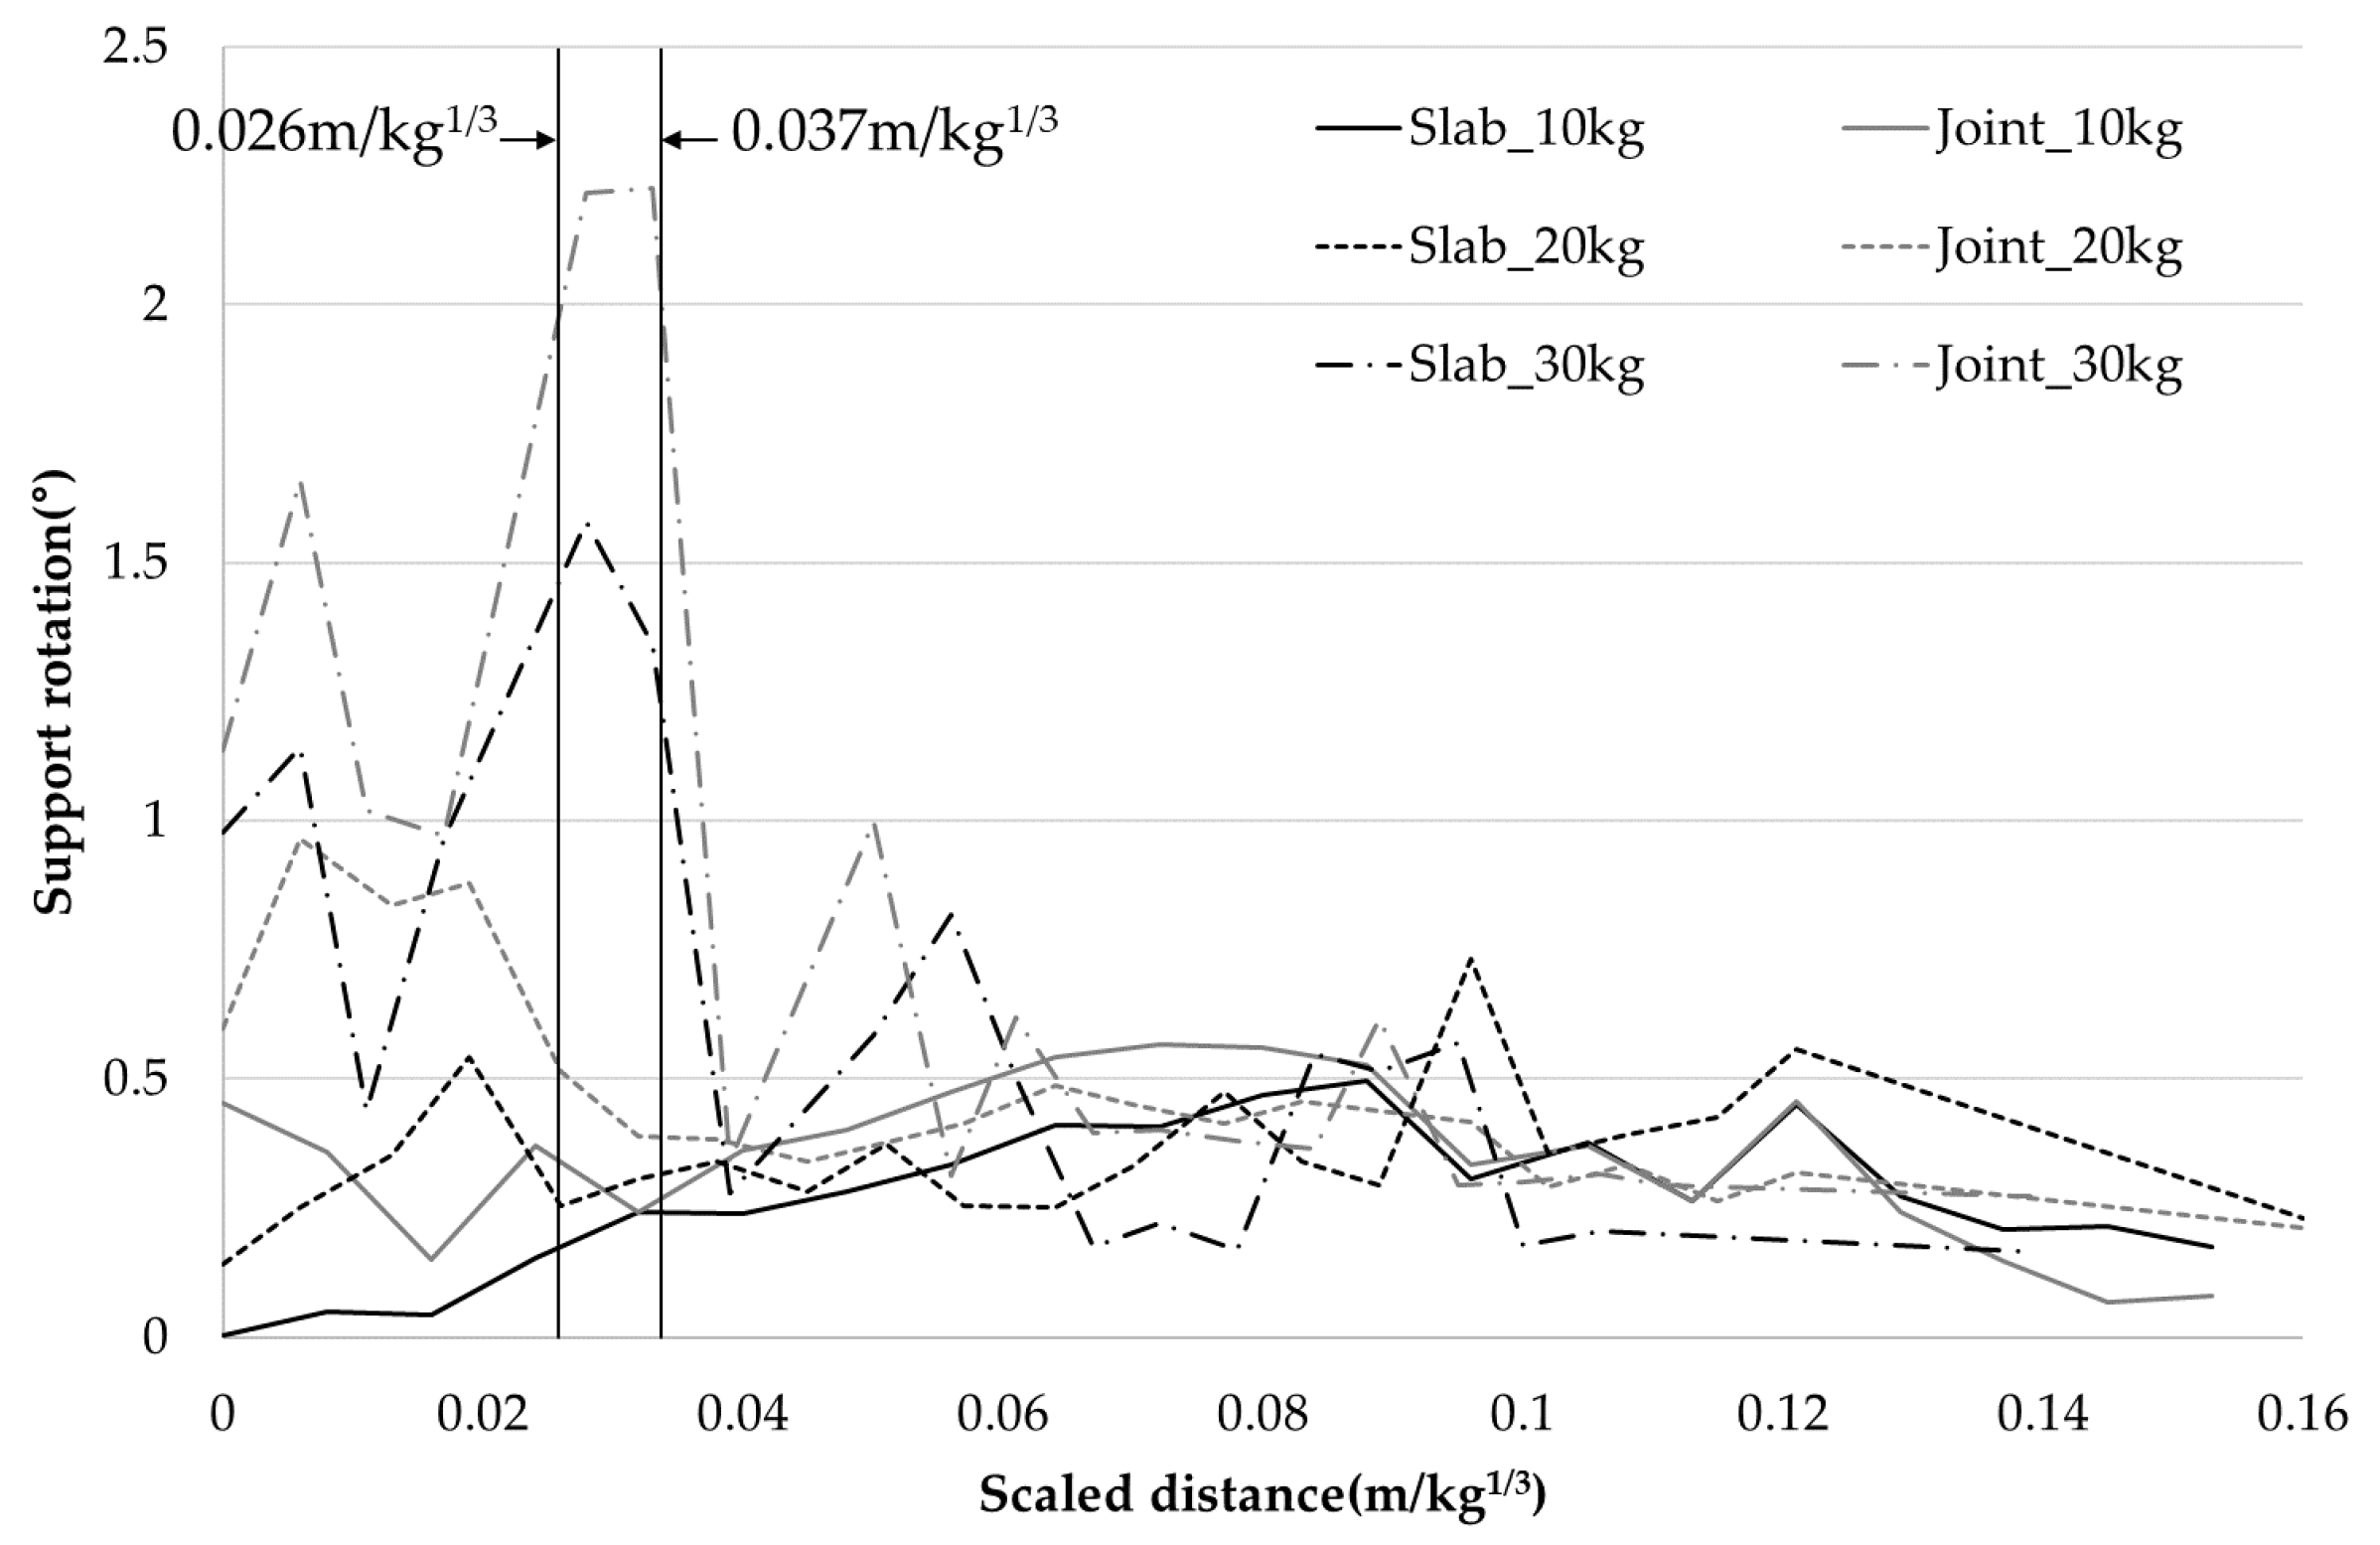
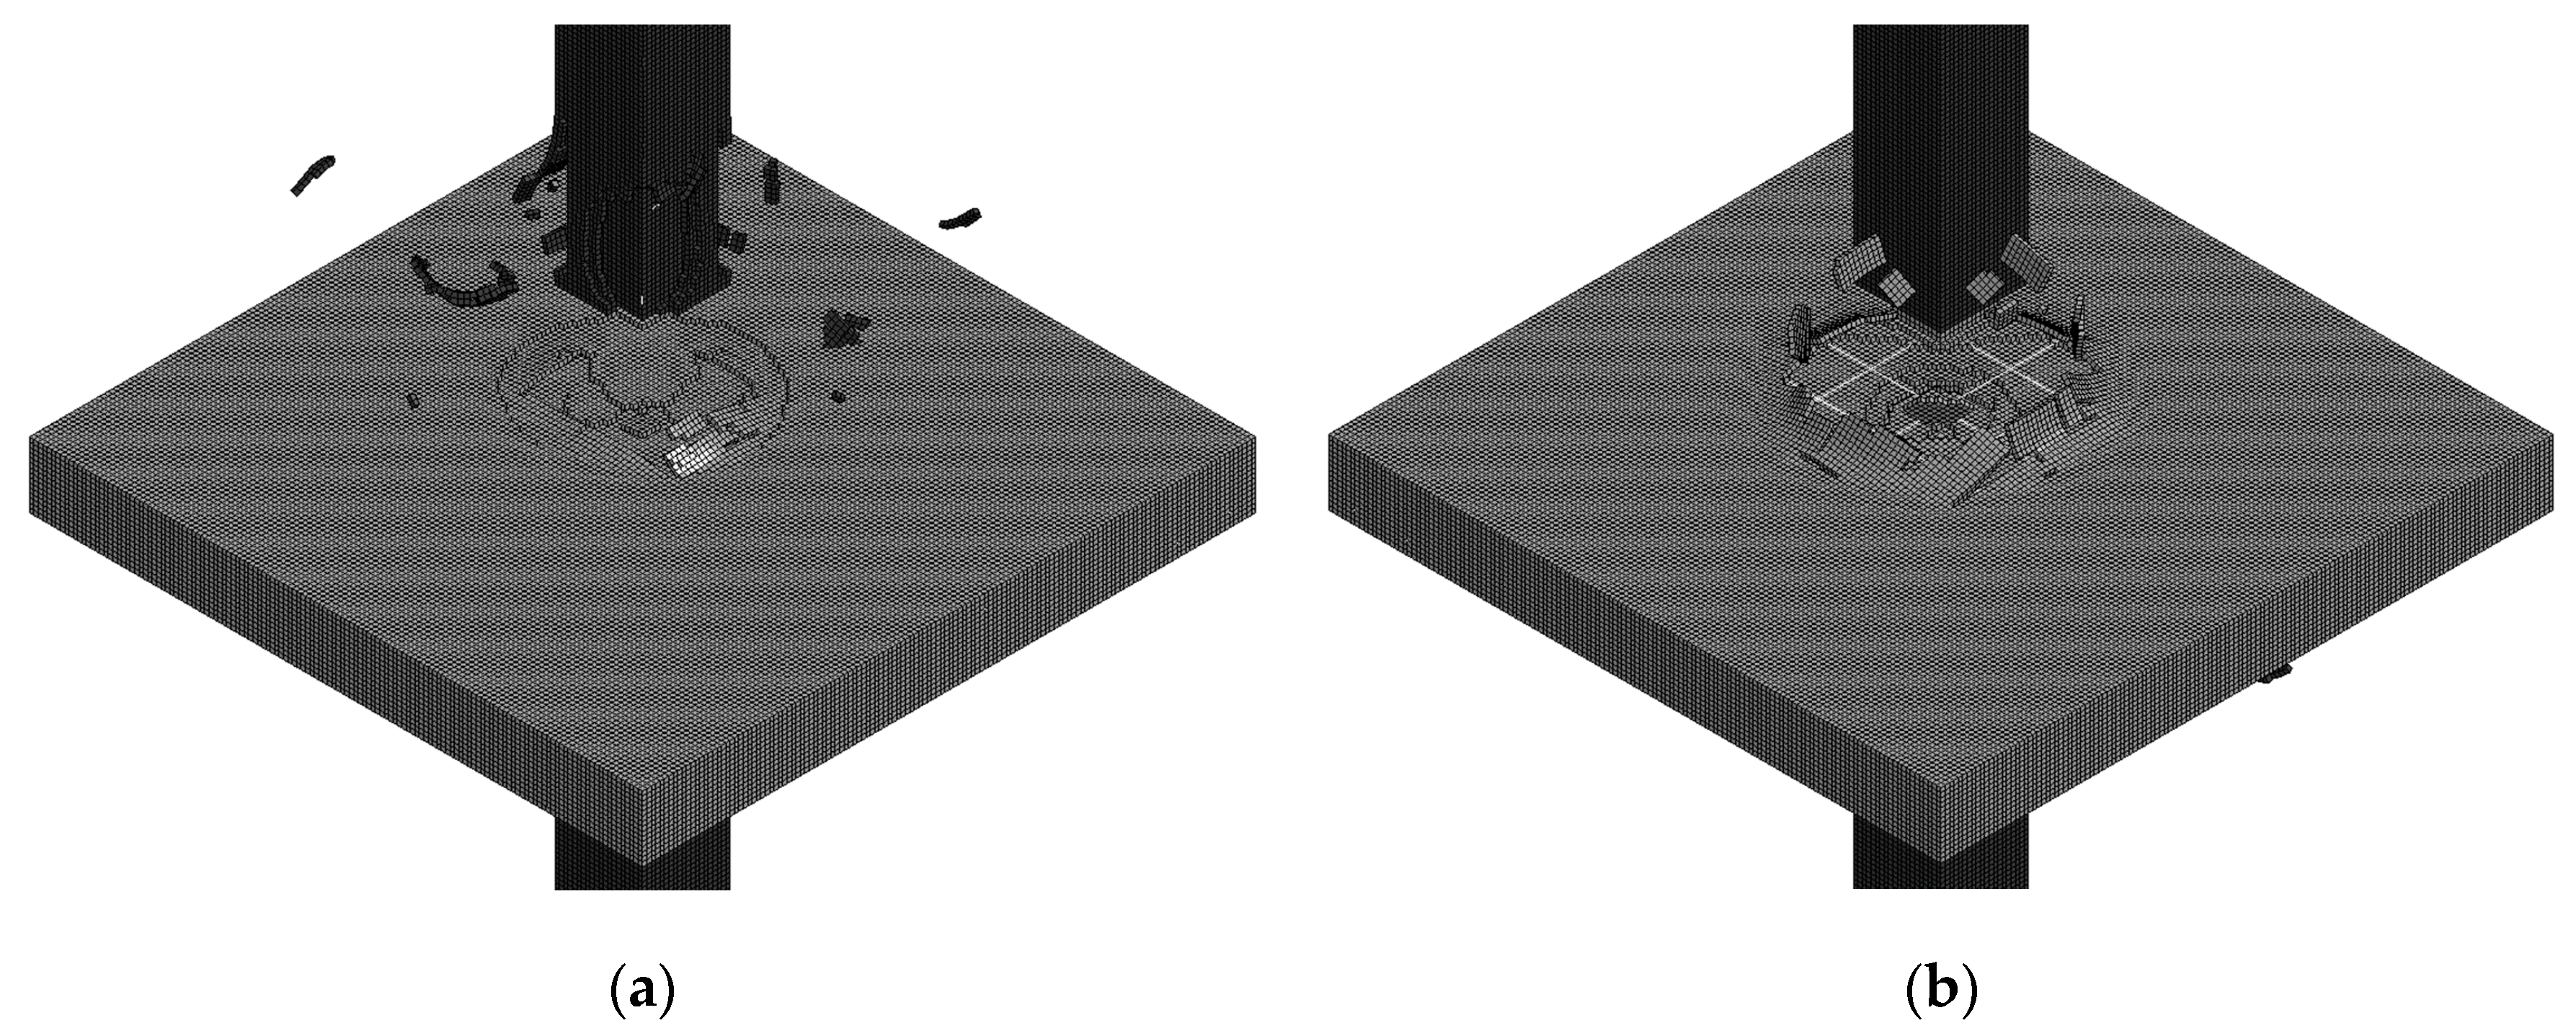
Figure 5 shows the support rotation calculated by the displacement of the slab. According to the criteria, the limit of support rotation to effectively resist the moment is 2 degrees [9,10]. As shown in Figure 5, in all cases, except that the scaled distance between 0.026 m/kg1/3 and 0.037 m/kg1/3 for TNT 30 kg explosive loads, the support rotation was less than the American Society of Civil Engineers/Structural Engineering Institute (ASCE/SEI) and DoD criteria limit of 2 degrees [9,10]. However, as shown in Figure 6, the top and bottom surfaces of the slab suffered severe fracture damage at all scaled distances for the 30 kg TNT. Similar phenomena were observed in all specimens with 20 kg of TNT. This means that even if the support rotation is smaller than the criteria limit, substantial destruction can occur in the member. In order to properly evaluate the blast-resistant performance of the joint, other evaluation factors besides support rotation are required.

4.3. Fracture Volume

In general, support rotation and displacement are used as criteria for evaluating the blast-resistant performance of RC members, but as shown in the previous analysis, the support rotation and displacement alone were not sufficient to accurately evaluate the performance of the slab-column joint. Moreover, it was difficult to use the support rotation or displacement to predict the blast-resistant performance of the slab-column joint because the support rotation and displacement according to the blast load condition did not have a certain tendency. Therefore, it is necessary to examine additional factors to evaluate the performance of the joint subjected to a blast load.
In this study, fracture volume was analyzed from the analysis results as an additional evaluation factor. Fracture volume was expressed as a percentage of the volume lost due to the explosive load relative to the total volume for the joint region within a scaled distance of 0.1 m/kg1/3 in Figure 3. It should be noted that this fracture volume is the effective volume of joint excluding the concrete cover.
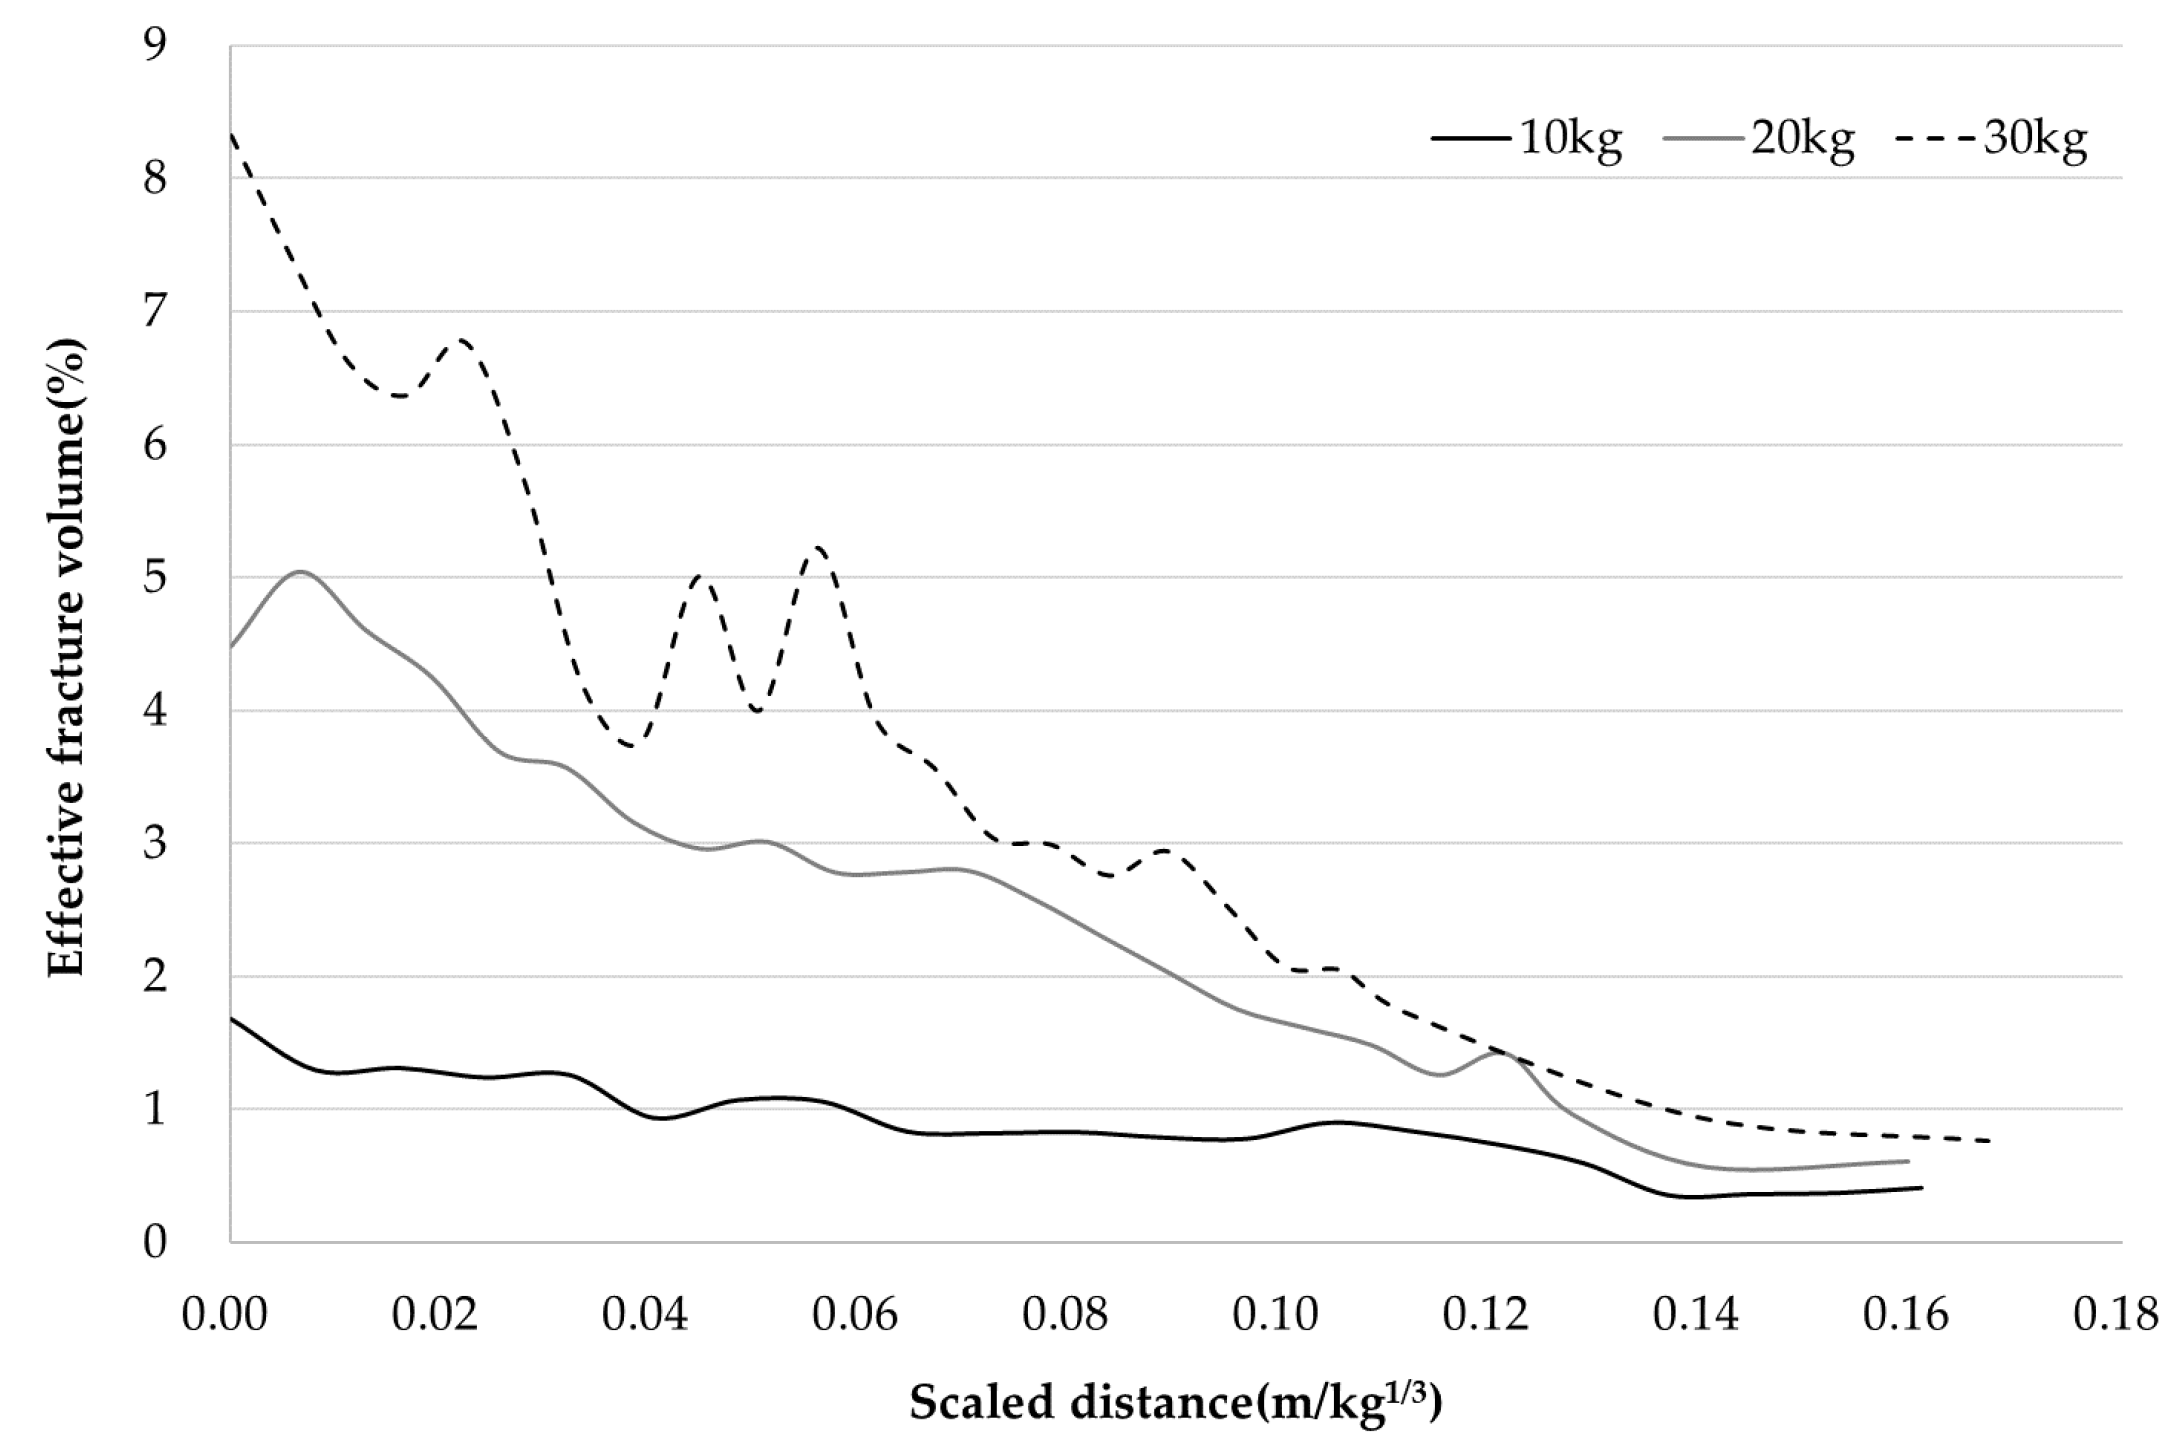
Figure 7 shows the effective fracture volume of the joint according to the scaled distance for each TNT weight of 10 kg, 20 kg, and 30 kg. Not surprisingly, as the weight of TNT increased, more damage occurred in the joint region. Interestingly, in all cases, the effective fracture volume decreased almost uniformly as the scaled distance increased.

5. Prediction Model

5.1. The Suggestion of Prediction Model

In this study, the effective fracture volume was used to predict the blast-resistant performance of the slab-column joint. Based on the trends identified in Figure 7, the correlation between the effective fracture volume per unit weight of TNT and the scaled distance was derived. As shown in Figure 8, regardless of the total amount of TNT applied, the effective fracture volume per unit weight of TNT showed almost similar value at any scaled distance and showed a certain tendency to decrease with increasing scaled distance. The trend line equation is shown in Figure 8, and the coefficient of determination (R2) of the equation for the entire data was 0.870.
As a result, Equation (2) was proposed to predict the damage level of the slab-column joint subjected to blast load through the weight of the explosive material and the standoff distance.
Effective fracture volume = W × (0.2375 × 10−5·1374Z)
where Effective fracture volume: Effective fracture volume percentage of slab-column joint (%). W: TNT weight (kg). Z: scaled distance (m/kg1/3).

5.2. Verification of Prediction Model

In order to verify the prediction model proposed in this study, numerical analysis was additionally performed. As shown in Table 5, numerical analysis results for various concrete strength of slab and column, slab thickness, TNT weights, and scaled distances were compared with predicted values of the proposed equation.
Comparing cases 1 to 7 with the same concrete strength and slab thickness as the numerical analysis conditions for deriving the prediction model, the model predictions were in good agreement with the verification numerical analysis results for various TNT weights and scaled distances. It is noteworthy that reliable predictions were shown in all cases of cases 1 to 4 with relatively small effective fracture volume and cases 5 to 7 with relatively large effective fracture volume. Interestingly, although the proposed equation was derived based on a small TNT within 30 kg, the predictions for cases 6 and 7 of TNT 40 kg and 50 kg, respectively, agreed well with the analysis result.
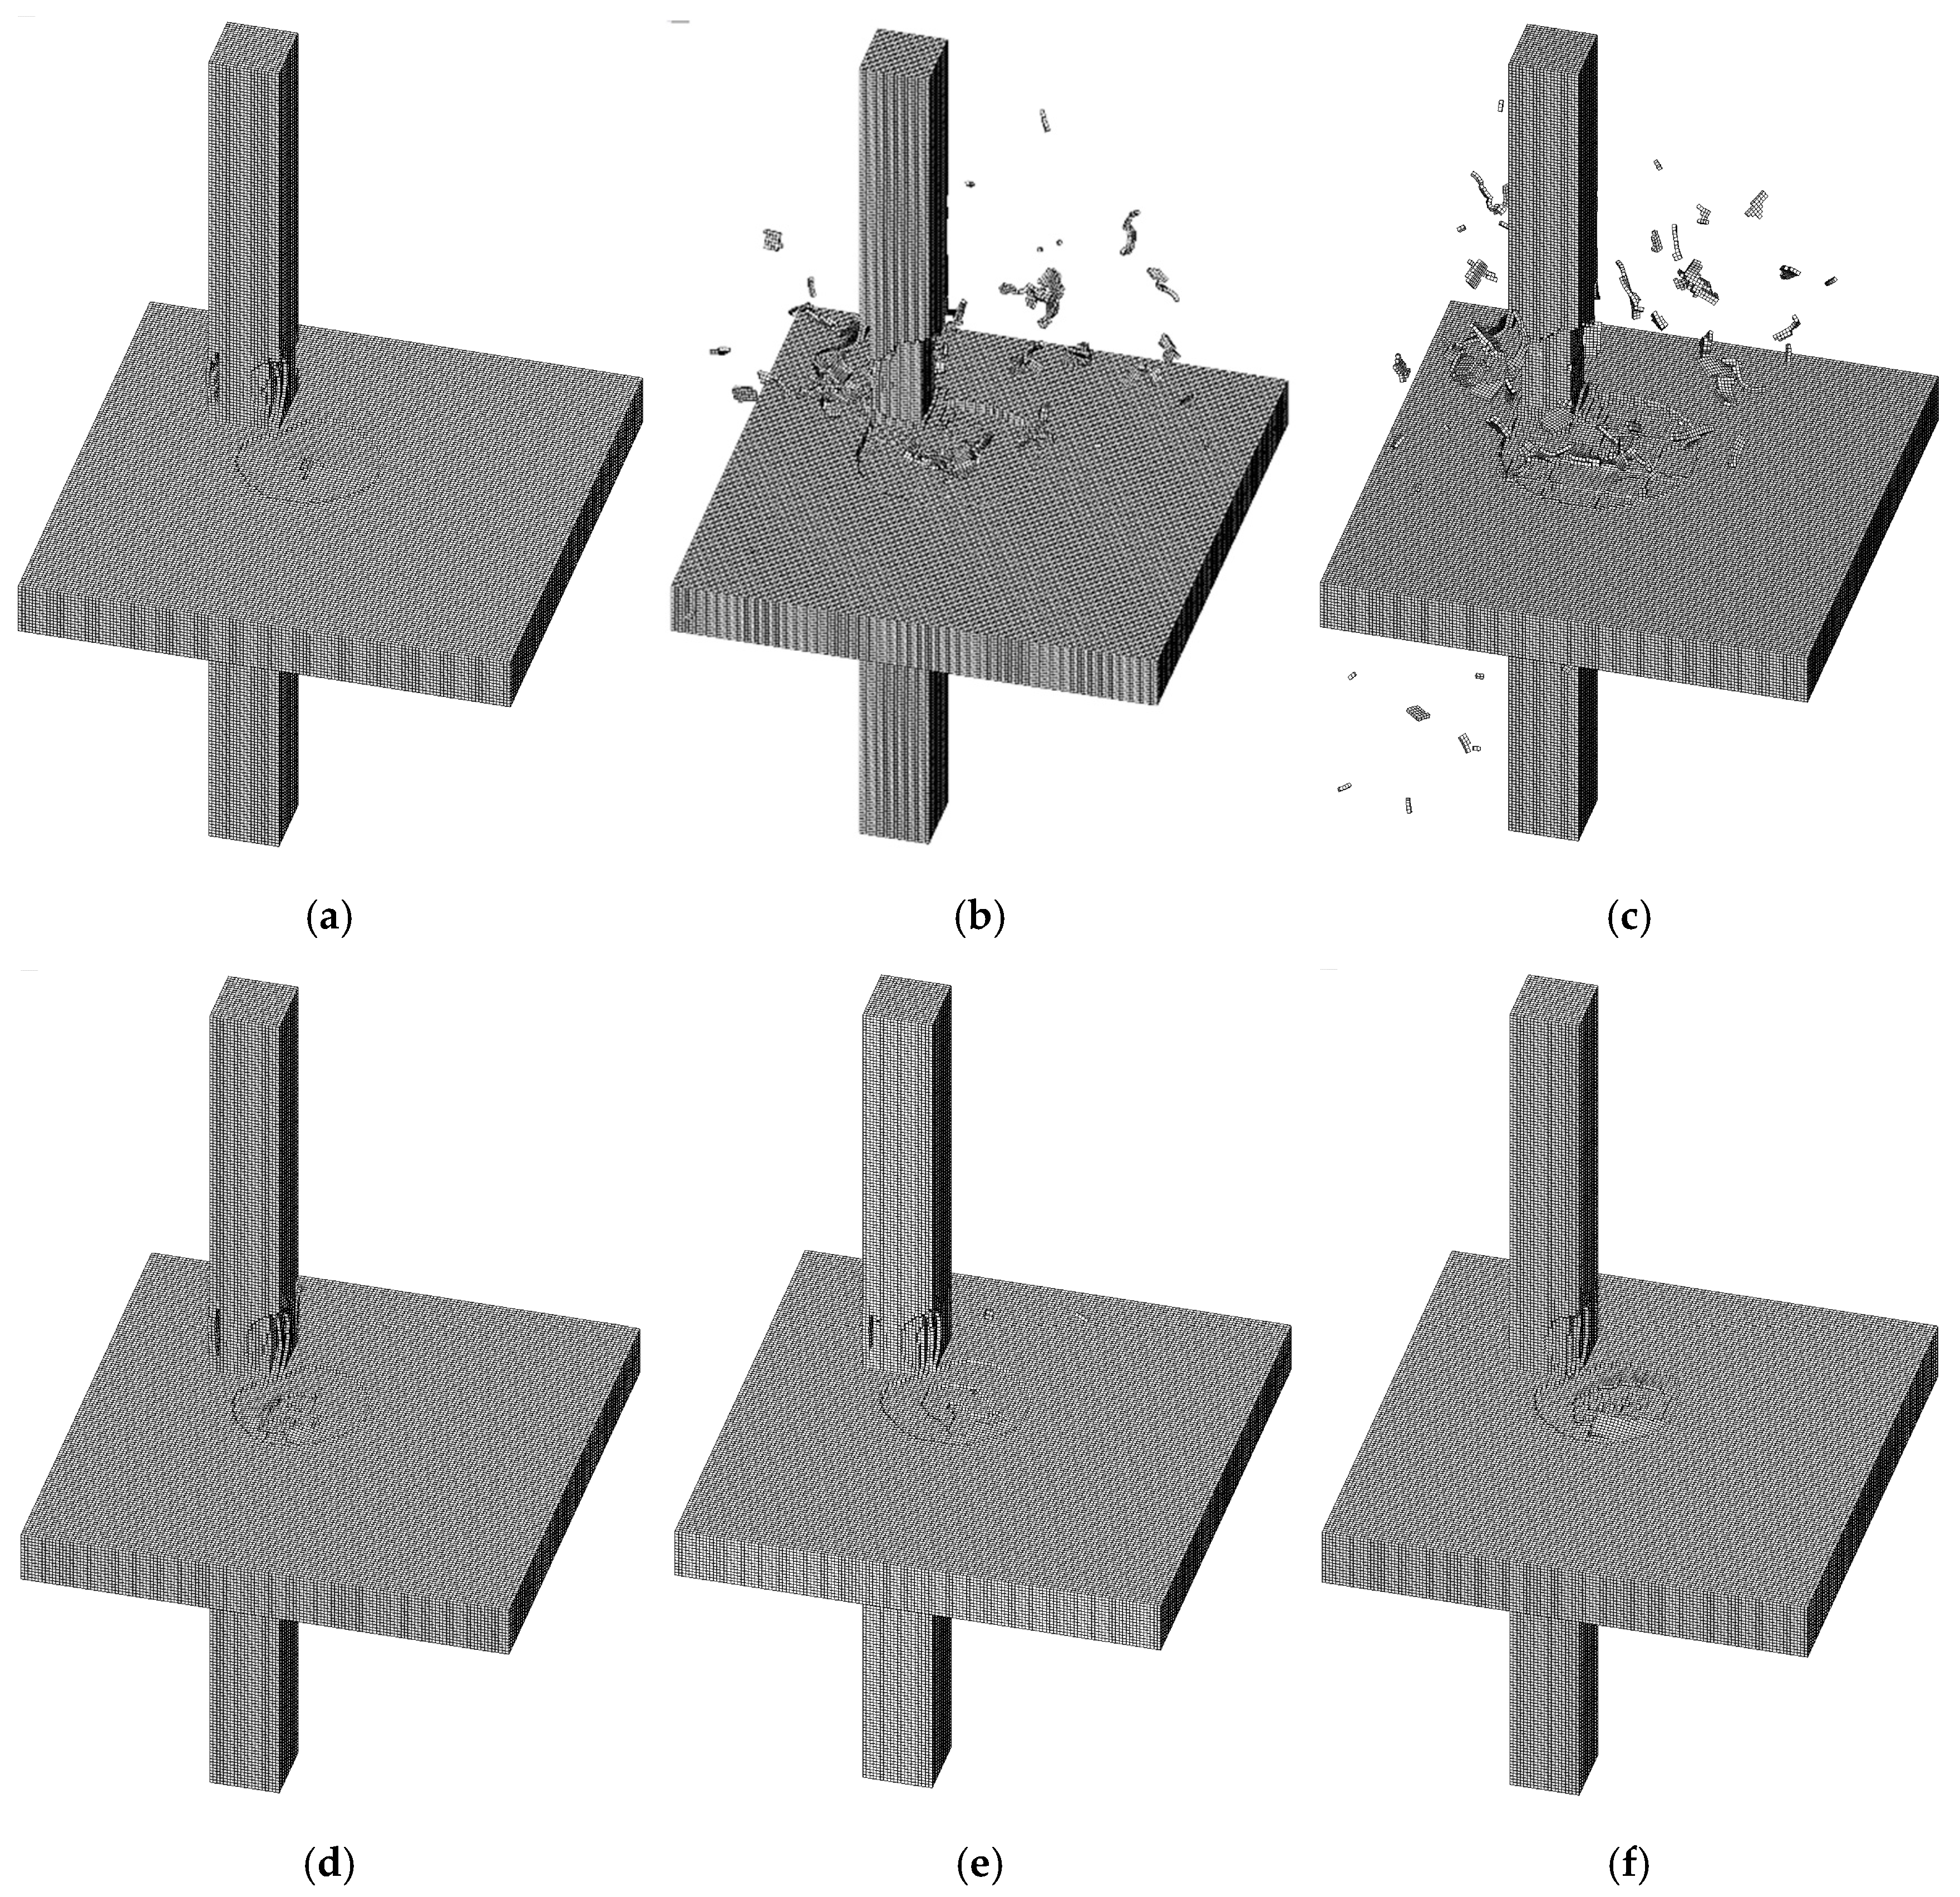
In cases 8 to 13, the effects of variables not included in the prediction equation, such as concrete strength and slab thickness, on the effective fracture volume were examined. As the concrete strength increased, the effective fracture volume decreased. In cases 8, 9, and 2, as the column concrete strength increased to 30 MPa, 40 MPa, and 50 MPa, the effective fracture volume decreased to 1.72%, 1.63%, and 1.21%, respectively. In cases 10, 2, and 11, as the slab concrete strength increased to 20 MPa, 30 MPa, and 40 MPa, the effective fracture volume decreased to 1.92%, 1.21%, and 0.90%, respectively, showing a greater reduction than the column. This was in line with the preliminary analysis results in which the slab showed relatively larger displacement, pressure, and impulse than the column. In cases 12 and 13, which had the same concrete cover thickness and reinforcement details as in case 2, the effect of the slab thickness on the effective fracture volume was investigated. It was observed that the effective fracture volume slightly increased as the slab thickness increased, but the difference in cases 12 and 13 was only 0.02%. It seemed that the effective fracture volume was not significantly affected by column concrete strength and slab thickness. For cases 8 to 13, the proposed equation yielded a constant value of the effective fracture volume due to variables not included in the equation. Although the predictions did not show much difference from the analysis results in the range of variables of concrete strength and slab thickness used in the verification analysis, further research is needed to propose a prediction equation that can take all these variables into account. Figure 9 shows the failure shape for some notable cases.

6. Conclusions

In this study, numerical analysis was performed using LS-DYNA for the behavior of a slab-column joint under an explosive load. The results of this study can be summarized as follows.
(1)
ConWep’s empirical values for shock wave parameters of a single member, such as a slab and a column, were compared with the pressure and impulse of a slab-column joint by numerical analysis. As a result, a region with a scaled distance of less than 0.1 m/kg1/3 was defined as a joint region.
(2)
The explosion created more pressure and impact on the slab than the column, thereby causing a larger displacement in the slab. In addition, it was observed that the damage of the member decreased sharply as the explosion position moved away from the member.
(3)
Even if the support rotation of the slab after the explosion was less than the limit of 2 degrees, it was observed that serious damage, such as spalling, occurred over a wide range of slab. Therefore, in addition to the support rotation and displacement, which are mainly used to evaluate blast-resistant performance, other evaluation factors are required.
(4)
Effective fracture volume was proposed as an evaluation factor for blast-resistant performance. Effective fracture volume was a good indication of the actual degree of damage to the member depending on the TNT weight and the explosive distance.
(5)
A prediction equation for the damage level of the slab-column joints through the TNT weight and the standoff distance of explosives was proposed. The reliability and accuracy of the proposed equation were verified through additional numerical analysis.

Author Contributions

Conceptualization, performing analysis, and writing—original draft, K.M.L. and J.H.L.; Writing—review and editing, D.G.Y., B.Y.L., and J.H.L.; supervision, J.H.L. All authors have read and agreed to the published version of the manuscript.

Funding

The paper was supported by the research grant of the University of Suwon in 2017.

Acknowledgments

The paper was supported by the research grant of the University of Suwon in 2017.

Conflicts of Interest

The authors declare no conflict of interest.

References

  1. Brun, A.; Batti, A.; Limam, A.; Gravouil, A. Explicit/implicit multi-time step co-computations for blast analyses on a reinforced concrete frame structure. Finite Elem. Anal. Des. 2012, 52, 41–59. [Google Scholar] [CrossRef]
  2. Hajek, R.; Fladr, J.; Pachman, J.; Stoller, J.; Foglar, M. An experimental evaluation of the blast resistance of heterogeneous concrete-based composite bridge decks. Eng. Struct. 2019, 179, 204–210. [Google Scholar] [CrossRef]
  3. Kumar, V.; Kartik, K.V.; Iqbal, M.A. Experimental and numerical investigation of reinforced concrete slabs under blast loading. Eng. Struct. 2020, 206, 110–125. [Google Scholar] [CrossRef]
  4. Abdulsamee, M.H.; Yazan, B.A.T.; Amin, H.A.; George, Z.V. The effect of shape memory alloys on the ductility of exterior reinforced concrete beam-column joints using the damage plasticity model. Eng. Struct. 2019, 200, 109676. [Google Scholar]
  5. Cumhur, C.; Ahmet, M.T.; Atakan, M.; Turgay, C.; Guven, K. Experimental behavior and failure of beam-column joints with plain bars, low-strength concrete and different anchorage details. Eng. Fail. Anal. 2020, 109, 104247. [Google Scholar]
  6. Yim, H.C.; Krauthammer, T. Load-impulse characterization for steel connections in monolithic reinforced concrete structures. Int. J. Impact Eng. 2009, 36, 737–745. [Google Scholar] [CrossRef]
  7. Yoon, Y.S. Mechanics & Design of Reinforced Concrete; CIR: Seoul, Korea, 2013. [Google Scholar]
  8. Park, J.Y. Modern Protective Structures; CIR: Seoul, Korea, 2011. [Google Scholar]
  9. ASCE/SEI. ASCE/SEI 59-11: Blast Protection of Buildings; American Society of Civil Engineers, American Society of Civil Engineers/Structural Engineering Institute: Reston, VA, USA, 2011. [Google Scholar]
  10. Department of Defense. UFC 3-340-02: Structures to Resist the Effects of Accidental Explosions; Department of Defense: Arlington, VA, USA, 2008.
  11. Lim, K.M.; Shin, H.O.; Kim, D.J.; Yoon, Y.S.; Lee, J.H. Numerical assessment of reinforcing details in beam-column joints on blast resistance. Int. J. Concr. Struct. Mater. 2016, 10, 87–96. [Google Scholar] [CrossRef] [Green Version]
  12. Yandzio, E.; Gough, M. Protection of Buildings against Explosions; The Steel Construction Institute: Ascot, UK, 1999. [Google Scholar]
  13. Homeland Security. Improvised Explosive Devices; The National Academies and the Department of Homeland Security: Washington, DC, USA, 2019.
  14. Giversen, S. Blast Testing and Modelling of Composite Structures; DCAMM Special Report, No. S167; DTU Mechanical Engineering: Kongens Lyngby, Denmark, 2014. [Google Scholar]
  15. Andrew, R.; Nicola, B.; Giuseppe, C.; Stefano, D.M.; Gianluca, I.; Sonia, M.; Elio, S.; Sara, S.; Gabriel, T. Full scale experimental tests and numerical model validation of reinforced concrete slab subjected to direct contact explosion. Int. J. Impact Eng. 2019, 132, 103309. [Google Scholar]
  16. Azer, M.; Stijn, M.; Bachir, B.; David, L.; John, V. Blast response of retrofitted reinforced concrete hollow core slabs under a close distance explosion. Eng. Struct. 2019, 191, 447–459. [Google Scholar]
  17. Brannon, R.M.; Leelavanichkul, S. Survey of Four Damage Models for Concrete; Sandia National Laboratories: Albuquerque, NM, USA, 2009; SAND2009-5544.
  18. Crawford, J.E.; Wu, Y.; Choi, H.J.; Magallanes, J.M.; Lan, S. Use and Validation of the Release III K&C Concrete Material Model in LS-DYNA; Karagozian & Case technical report, TR-11-36.5; Karagozian & Case, Inc.: Glendale, CA, USA, 2012. [Google Scholar]
  19. LSTC (Livermore Software Technology Corporation). LS-DYNA Keyword User’s Manual Volume II Material Models; Livermore Software Technology Corporation: Livermore, CA, USA, 2013. [Google Scholar]
  20. Ling, L. Local Damages and Blast Resistance of RC Slabs Subjected to Contact Detonation. Master’s Thesis, Korea University, Seoul, Korea, 2013. [Google Scholar]
  21. Gonzalez, H.A.; Zapatero, J. Influence of minimum element size to determine crack closure stress by the finite element method. Eng. Fract. Mech. 2005, 72, 337–355. [Google Scholar] [CrossRef]
  22. Krauthammer, T. Mesh, gravity and load effects on finite element simulations of blast loaded reinforced concrete structures. Comput. Struct. 1997, 63, 1113–1120. [Google Scholar] [CrossRef]
  23. Foglar, M.; Kovar, M. Conclusions for experimental testing of blast resistance of FRC and RC bridge decks. Int. J. Impact Eng. 2013, 59, 18–28. [Google Scholar] [CrossRef]
  24. Thiagarajan, G.; Kadambi, A.V.; Robert, S.; Johnson, C.F. Experimental and finite element analysis of doubly reinforced concrete slabs subjected to blast loads. Int. J. Impact Eng. 2015, 75, 162–173. [Google Scholar] [CrossRef]
  25. Shi, Y.; Stewart, M.G. Damage and risk assessment for reinforced concrete wall pannels subjected to explosive blast loading. Int. J. Impact Eng. 2015, 85, 5–19. [Google Scholar] [CrossRef]
  26. Bae, D.M.; Zakki, A.F. Comparisons of multi material ALE and single material ALE in LS-DYNA for estimation of acceleration response of free-fall lifeboat. J. Soc. Nav. Archit. Korea 2011, 48, 552–559. [Google Scholar] [CrossRef] [Green Version]
  27. Jang, I.H. Sloshing Response Analysis of LNG Carrier Tank Using Fluid Structure Interaction Analysis Technique of LS-DYNA3D. Master’s Thesis, Korea Maritime and Ocean University, Busan, Korea, 2007. [Google Scholar]
  28. Zahra, S.T.; Jeffery, S.V. A comparison between three different blast methods in LS-DYNA: LBE, MM-ALE, Coupling of LBE and MM-ALE. In Proceedings of the 12th International LS-DYNA User Conference, Dearborn, MI, USA, 3–5 June 2012. [Google Scholar]
  29. Huh, Y.C.; Chung, T.Y.; Kim, K.C.; Jung, H.J.; Choi, H.H. A study on the modeling techniques of air blast load using LS-DYNA. In Proceedings of the Korean Society for Noise and Vibration Engineering Conference, Jeju Island, Daejeon, Korea, 26–28 April 2012; pp. 375–376. [Google Scholar]
  30. ACI-ASCE Committee 352. ACI352.1R-11: Guide for Design of Slab-Column Connections in Monolithic Concrete Structures; American Concrete Institute: Farmington Hills, MI, USA, 2012. [Google Scholar]
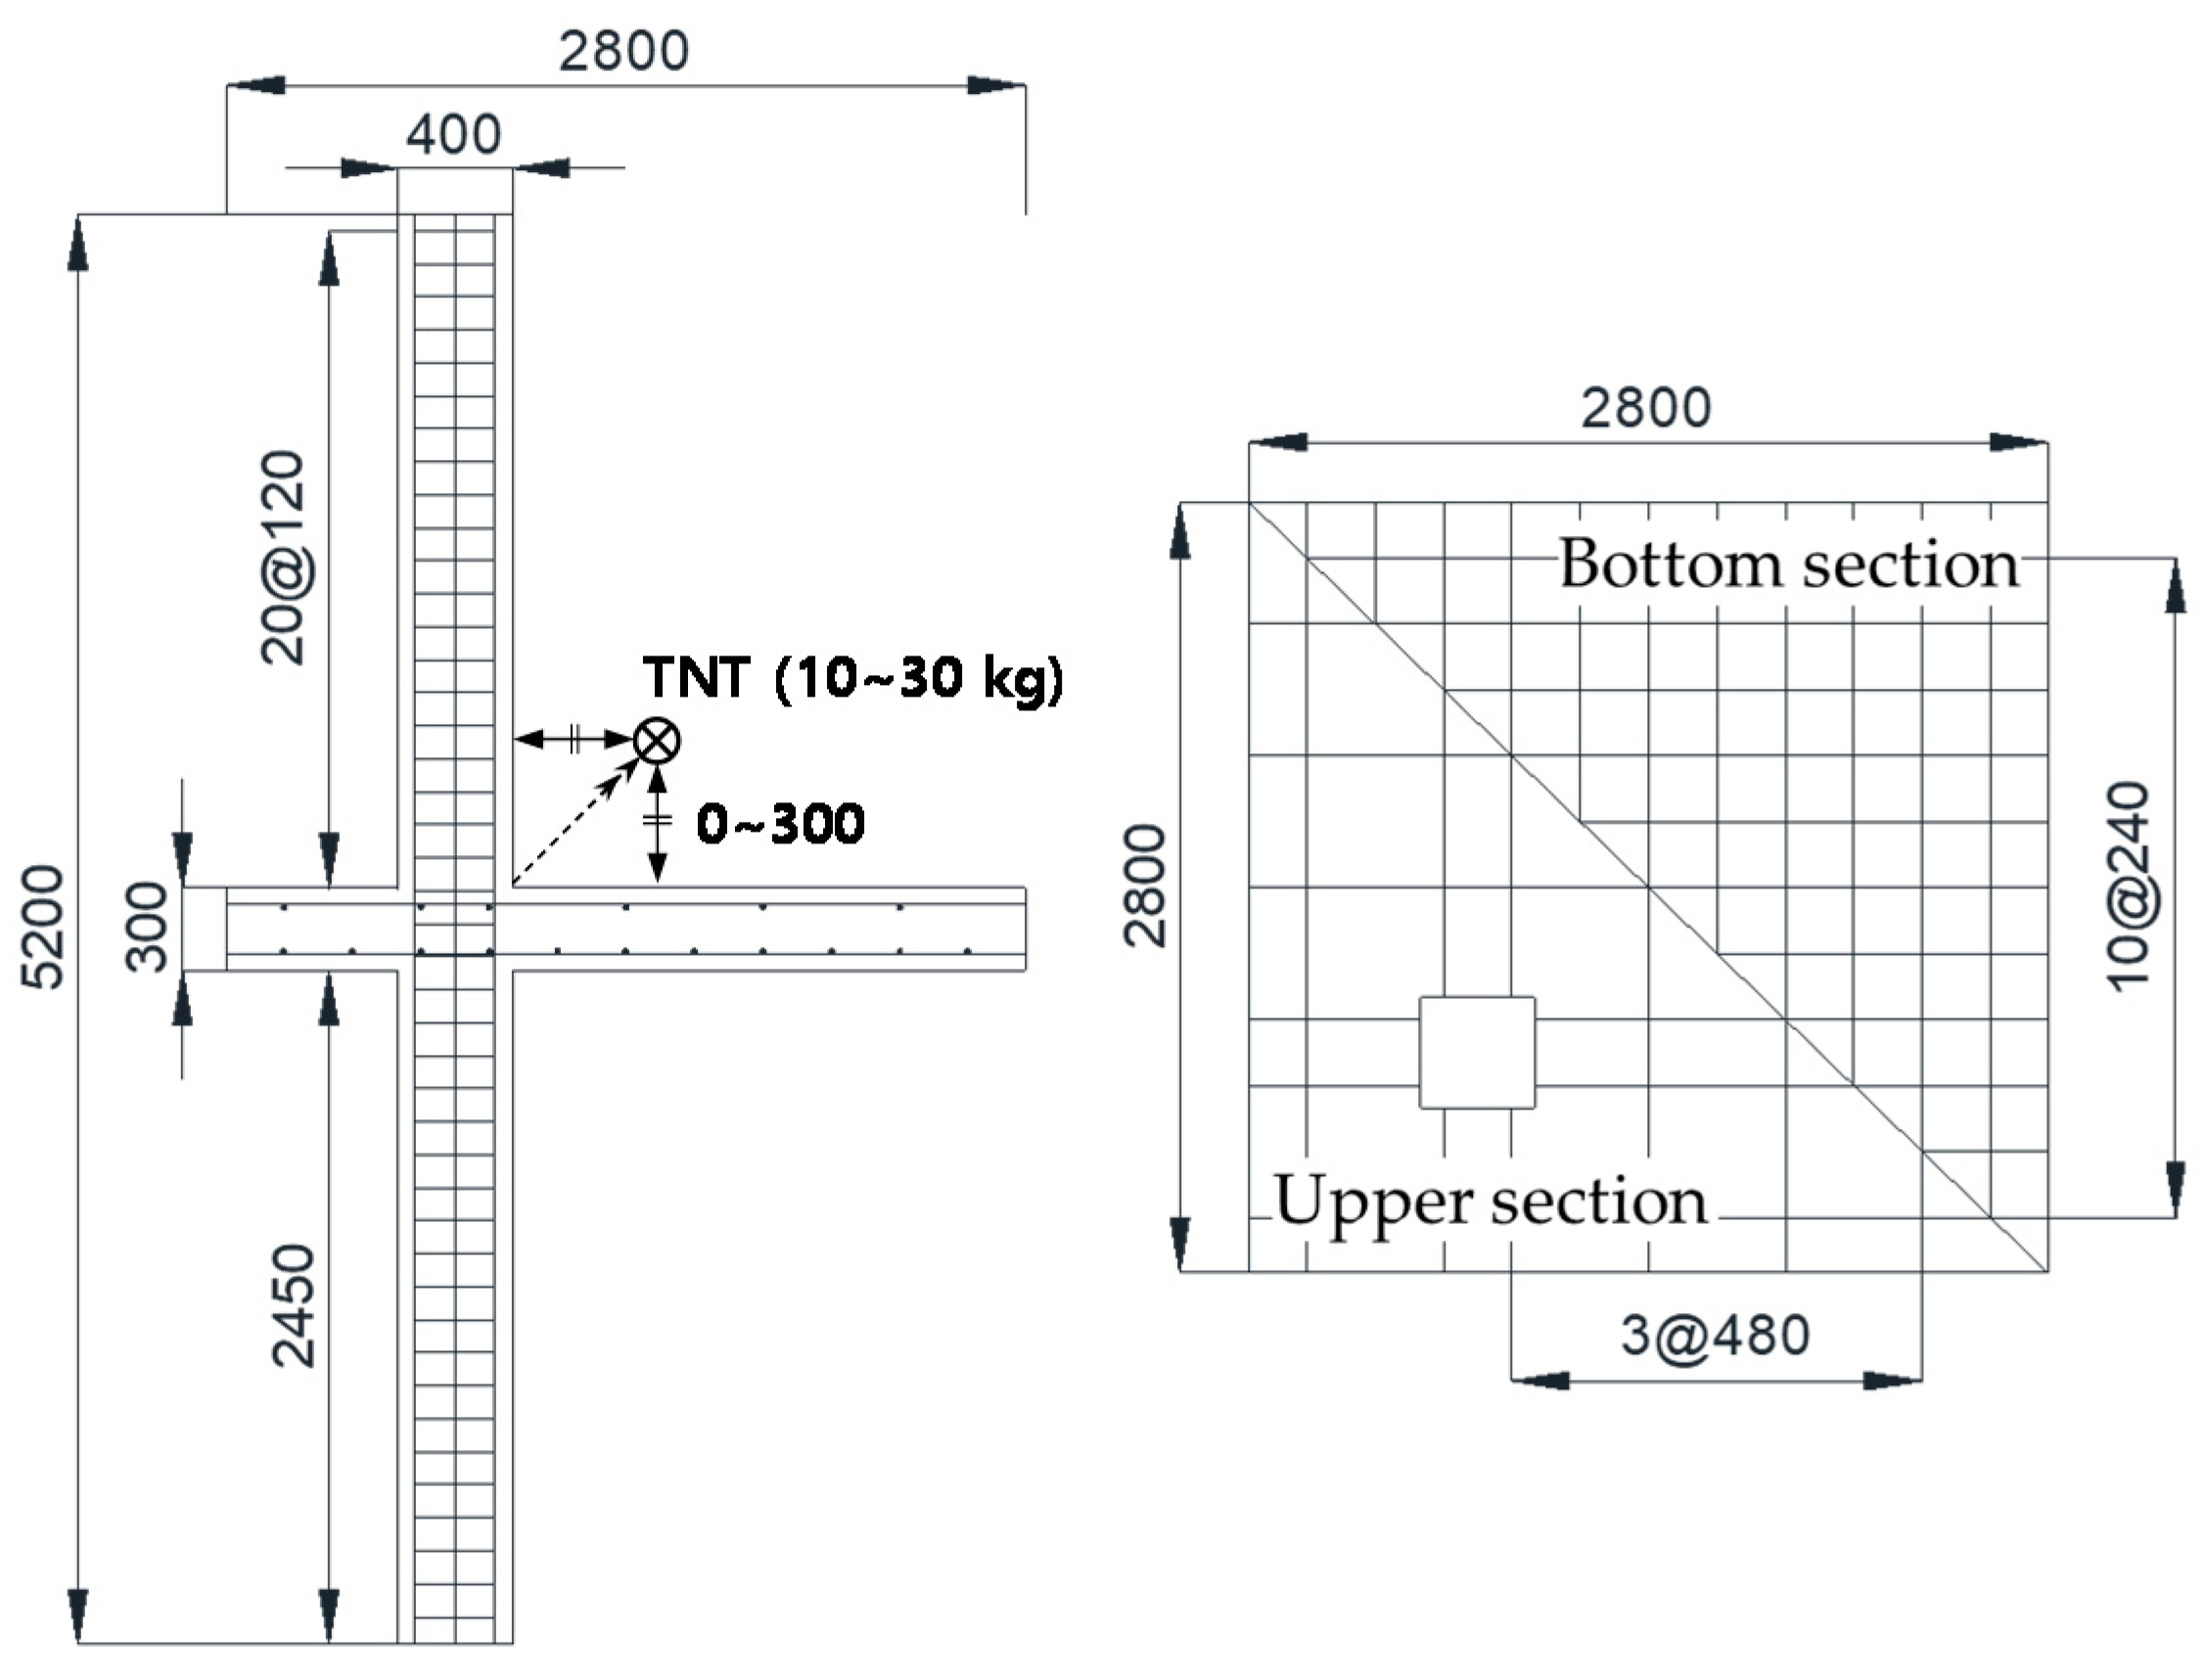
Figure 1. Details of slab-column joints.
Applsci 10 05837 g001
Figure 2. Defining joint region under blast load; (a) Pressure; (b) Impulse.
Applsci 10 05837 g002
Figure 3. Joint region (Z = 0.1 m/kg1/3).
Applsci 10 05837 g003
Figure 4. Maximum displacement of slab and column; (a) Slab; (b) Column.
Applsci 10 05837 g004
Figure 5. Support rotation of slab.
Applsci 10 05837 g005
Figure 6. Failure shapes (30 kg, Z = 0.067 m/kg1/3); (a) Top surface; (b) Bottom surface.
Applsci 10 05837 g006
Figure 7. Effective fracture volume.
Applsci 10 05837 g007
Figure 8. Effective fracture volume per unit weight of TNT according to scaled distance.
Applsci 10 05837 g008
Figure 9. Failure shape for some verification analysis cases; (a) Case 3; (b) Case 6; (c) Case 7; (d) Case 8; (e) Case 10; (f) Case 13.
Applsci 10 05837 g009
Table 1. The typical weight of explosive materials [12].
BombletLoaded Weight (kg)Material Type
Small briefcase2~4Military and commercial explosives
(such as Trinitrotoluene (TNT))
Large briefcase4~12
Suitcase12~22
Bicycle30
Table 2. Analysis variables.
TNT Weight (kg)Standoff Distance (m) *Scaled Distance (m/kg1/3)
100~0.190~0.153
200~0.250~0.160
300~0.300~0.163
Standoff distance *: the vertical distance from the location of the explosive to the surface of the column or slab.
Table 3. Material properties for analysis.
PropertiesSlabColumnReinforcements
Compressive strength (MPa)3050-
Yield strength (MPa)--475
Tensile strength (MPa)--751
Density (kg/m3)240025007850
Poisson’s ratio0.180.180.3
Table 4. Analysis conditions.
Analysis ConditionsValue
Number of elementsSolids392,000 ea (20 × 20 × 20 mm)
Beam10,648 ea (20 mm)
Time step0.1 ms
Analysis of end time2000 ms
Analysis of running time6 h 45 m
Table 5. Verification analysis variables and results.
CaseColumn Strength (MPa)Slab Strength (MPa)Slab Thickness(mm)TNT Weight (kg)Scaled Distance (m/kg1/3)Effective Fracture Volume (%)Prediction Differences (%)
Verification AnalysisPrediction Model
1503030060.030.73 1.00 0.27
2120.061.21 1.40 0.19
3180.091.84 1.47 0.37
4240.121.55 1.38 0.17
5240.034.19 4.00 0.19
6406.39 6.66 0.27
7508.07 8.33 0.26
830120.061.72 1.40 0.32
9401.63 0.23
1050201.92 0.52
11400.90 0.50
1250303201.41 0.01
133401.43 0.03