Article

Characterizing Black Carbon Emissions from Gasoline, LPG, and Diesel Vehicles via Transient Chassis-Dynamometer Tests

1
Department of Environmental Science, Hankuk University of Foreign Studies, Yongin 17035, Korea
2
Transportation Pollution Research Center, National Institute of Environmental Research, Incheon 22689, Korea
3
Department of Civil and Environmental Engineering, Konkuk University, Seoul 05029, Korea
*
Author to whom correspondence should be addressed.
Appl. Sci. 2020, 10(17), 5856; https://doi.org/10.3390/app10175856
Submission received: 22 July 2020 / Revised: 18 August 2020 / Accepted: 20 August 2020 / Published: 24 August 2020
(This article belongs to the Special Issue Air Pollution II)

Abstract

:
With global anthropogenic black carbon (BC) emissions increasing, automobiles are significantly contributing as the major source of emissions. However, the appropriate regulations of BC emissions from vehicles are not in place. This study examined BC emissions following fuel types (gasoline, liquefied petroleum gas (LPG), and diesel) and engine combustion (gasoline direct injection (GDI) and multi-port injection (MPI) for gasoline vehicles) with emission regulations. To this end, chassis dynamometer and aethalometer (AE33) were used. Driving modes created by the National Institute of Environmental Research (NIER) and emission certification modes (CVS-75 and NEDC) for vehicles in Korea were used to determine BC emissions for various vehicle speeds. In addition, the contributions of biomass and coal combustion to the data of AE33 were analyzed to determine the possibility of tracking the BC sources. MPI, LPG, and EURO 6 with diesel particulate filter (DPF) vehicles emitted the lowest BC emissions in NIER modes. Among gasoline vehicles, MPI vehicles showed the lower BC content in PM emissions. Also, older vehicles in MPI vehicles emitted the high PM and BC emissions. The BC emissions of EURO 3 vehicles without DPF were the highest as the results of previous studies, and it was found that as emissions regulations were tightened, the level of BC results of diesel vehicles became similar with MPI vehicles. The average absorption Ångström exponent (AAE) from difference emissions sources were biomass combustion (oak wood) > coal combustion (the power plant stack) > automobile emissions (gasoline, LPG, diesel).

Graphical Abstract

1. Introduction

Black carbon (BC) is a particulate matter (PM) emitted by the incomplete combustion of fuels containing carbon. It is typically 1 μm or less in size, absorbs solar energy, and affects global radiative forcing [1]. Unlike other typical PM that has negative radiative forcing and cools the Earth’s atmosphere, increasing BC concentrations contribute to increased heat absorption in the atmosphere and reduce sunlight reflection, adversely affecting global warming. With a radiative forcing of 0.64 W m−2 or higher, BC is considered one of the major contributors to global warming along with carbon dioxide (1.68 W m−2) and methane (0.97 W m−2) [2,3,4].In addition, toxicological studies have shown that BC can be a major carrier of toxic substances to the human body [5], and a previous study has reported high correlation between BC and respiratory diseases [6].
Research on BC began in the late 1990s. However, there is still considerable scope for future studies as several questions still need to be addressed [7]. Through the investigation of worldwide BC emission sources, more than half of the total emissions have been identified to originate from charcoal manufacturing processes, heating, industrial coal, and diesel vehicles for transportation [8]. In addition, several studies have reported that gasoline vehicles also contribute to BC emissions [9,10]. According to a previous study conducted in Seoul, Korea, gasoline and diesel vehicles were demonstrated to contribute 17.2% and 8.1% of the measured PM, respectively [11]. In other words, automobile emissions can be considered as major contributors to domestic BC emissions.
Recent studies on automobile-related BC measurements have focused on-road BC concentration characteristics [12,13,14], and the BC emissions inventory has rarely been investigated under various conditions of fuel oil type and vehicle type. In this regard, this study aims to supplement existing knowledge by measuring BC emissions from automobiles according to various fuel oil types (gasoline, LPG, and diesel) used in Korea and types of PM regulation, and investigate their emission characteristics. In addition, in order to evaluate the BC quality of combustion in tested vehicles, absorption Ångström exponent (AAE) values were calculated through additional experiments of biomass burning (oak wood) and coal burning from the power plant stack. These values showed that BC emission source depend on the different fuels [15].

2. Materials and Methods

2.1. Vehicle Selection and Driving Modes

Various passenger cars, vans, and SUVs using gasoline, the liquefied petroleum gas (LPG), and diesel were selected for the study, as listed in Table 1. Gasoline vehicles with multi-point injection (MPI) technology, in which a mixture of fuel and air is injected into a cylinder, and gasoline direct injection (GDI) vehicles, in which the fuel is directly injected into a cylinder, were employed for the experiment. In addition, GDI vehicles were measured separately before and after the application of the PM regulation (0.004 g km−1). This standard applies only to GDI vehicles of the model year after 2014 in gasoline. MPI vehicles manufactured between 2001 and 2005 (G#7) and between 2009 and 2012 (G#8) were selected for evaluating the BC emissions based on the degree of vehicle aging. LPG vehicles with liquified petroleum injection (LPI) combustion system were conducted as manufactured 2014 (L#1, 2), 2015 (L#3), and 2008 (L#4). For gasoline and LPG vehicles, passenger cars installed with a three-way catalyst (TWC) as the aftertreatment device were used. Diesel vehicles were selected according to the European regulation standards (EURO 3–6). EURO 6 vehicles are equipped with aftertreatment devices such as a diesel oxidation catalyst (DOC), DPF, and lean NOx trap (LNT) or selective catalyst reduction (SCR). However, EURO 5 vehicles have DOC and DPF, and EURO 3 vehicles only have DOC. PM regulation for diesel vehicles in Korea can be briefly explained as follows: EURO 3 allowed the highest level of PM at 0.11 g km−1, and as the regulation became stricter, EURO 4, 5, and 6 allow a maximum of 0.06, 0.005, and 0.0045 g km−1, respectively.
The driving speed over time in the modes used in the study are shown in Figure 1, and were conducted about two times for each mode. NIER modes were selected to estimate the air pollutant emissions of on-road mobile source air pollution. These NIER modes were developed by the National Institute of Environmental Research according to the road conditions of Korea. In these modes, the driving pattern of low speed to high speed at city centers in Korea can be reproduced on the chassis dynamometer, and they consist of 13 types of modes in total. Among these modes, in this study, NIER-01 (avg. 4.7 km h−1), NIER-05 (avg. 17.3 km h−1), NIER-09 (avg. 34.1 km h−1), NIER-12 (avg. 65.4 km h−1), and NIER-14 (avg. 97.3 km h−1) modes were used to measure BC emissions based on low to high driving speeds (Figure 1) [16]. Prior to driving in all of these NIER modes, to prepare the conditions of driving in a heated state, the vehicle was driven at a speed of 70 km h−1 until the coolant temperature stabilized, and the speed was maintained for an additional 4 min to measure the emission from the vehicle after accounting for preheating. In addition, during measurement, to eliminate the impact of BC emitted when the vehicle engine is started, the driving mode started with the vehicle’s engine turned on after the preheating.
Figure 2 shows the driving patterns of CVS-75 and NEDC, which are emission certification modes in Korea. They were used to identify the characteristics of BC emission following the tightening of PM regulations. CVS-75 is an emission certification mode for gasoline, LPG, and older diesel vehicles (before the EURO 3 regulation), and it has three different driving conditions. They are: phase 1 including cold start and conditions before preheating (avg. 41.03 km h−1), phase 2, a stabilized state after preheating (avg. 25.44 km h−1), and phase 3 including restart after 10 min of stand-by time (avg. speed 41.11 km h−1), accounting for a total average of speed 33.81 km h−1. NEDC (total avg. 33.31 km h−1) is a European emission certification mode applied to EURO 4 and later diesel vehicles (since 2005), and it is divided into phase 1 (avg. 18.53 km h−1), which simulates cold start and traffic congestion of cities, and phase 2 (avg. 62.07 km h−1), which includes high-speed driving (Figure 2).

2.2. Measurement Method and Calculation Formula for Emission Estimation

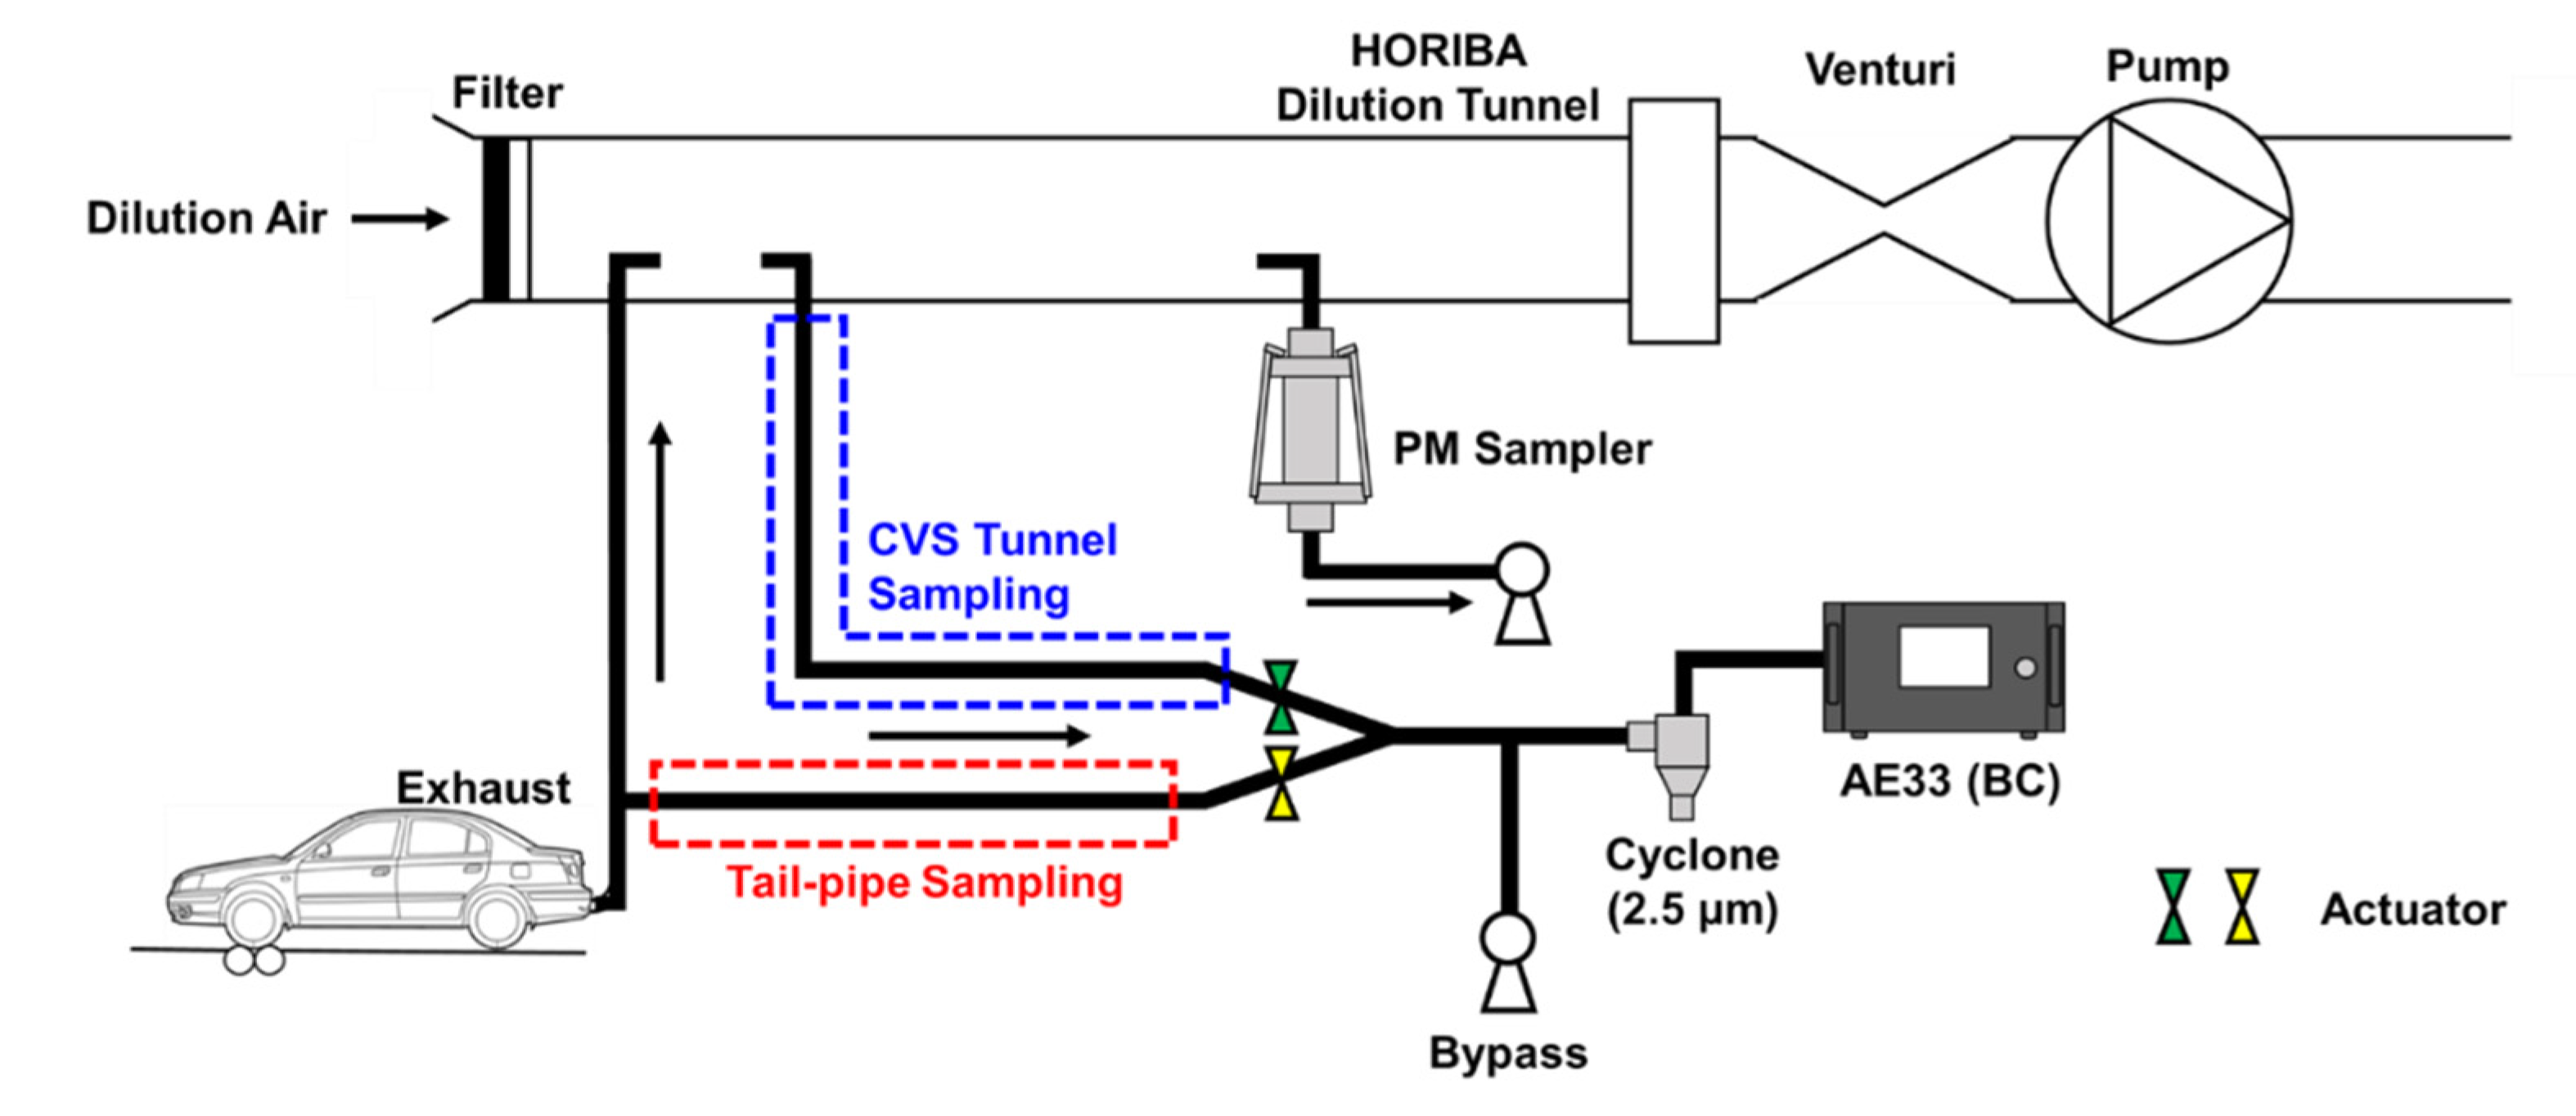
A schematic of the BC emission measurement method is shown in Figure 3. BC concentrations was continuously measured at 1min interval using an Aethalometer (AE33, Magee Scientific) which incorporated the patented Dual-Spot technology and a seven wavelength (370, 470, 520, 590, 660, 880, 950 nm) [17]. The flow rate of emissions into the equipment was set at 2 LPM and had been tested during the cycles, the deviation of the flow rate was found within 5%. Simultaneously, the leakage test of the filter was performed and was also under <10% the appropriate range provided by the manufacturer. To determine the BC concentrations, the mass absorption cross-section (MAC) 7.77 m2 g−1 at 880 nm was used [17]. Two sampling systems were conducted for measuring BC. The constant volume sampler (CVS) tunnel system first diluted the raw exhaust from vehicles using the CVS tunnel, and then, moisture was controlled from the diluted emission using a diffusion dryer; finally, particles with a maximum size of 2.5 µm were captured using a URG cyclone. Tail-pipe system used direct sucking from the exhaust of the vehicles, and the subsequent measurement method was the same as that of the CVS tunnel system. The PM weight was measured using the PM sampler in all driving modes from the CVS tunnel. However, the PM concentration in the NIER modes, which included only the driving modes in the heated state, was too low to be measured using a balance. Therefore, in this study, only PM values measured in CVS-75 and NEDC modes were used.
For NIER modes, Equation (1) was used for calculating the emission factor. If the concentration of the sample is below the minimum detection limit of the equipment, a diffusion dryer was used in the vehicle’s exhaust pipe without dilution. The sample with moisture removed was directly measured using the tail-pipe sampling formula shown in Equation (2). The calculation result is represented in the emission unit considering the dilution factor [16].
Emission factor   ( g   k m 1 )   o f   C V S   t u n n e l   i n   N I E R   M o d e =   B C   ×   V m i x d  
E m i s s i o n   f a c t o r   ( g   k m 1 ) o f   t a i l p i p e   i n   N I E R   M o d e =   B C   ×   V m i x d   ×   D F
where BC is the measured BC concentration (mg m−3), Vmix is the total volume of sample from CVS tunnel (m3), d is the distance that the test vehicle has run (km), and DF is the dilution factor of the sample that has been measured from CVS tunnel.
During CVS-75 and NEDC driving, the results were calculated using Equations (3) and (4) [18]. In the CVS-75 mode, weights were applied to all three phases (0.43 and 0.57) to meet the same conditions as the existing PM emission calculation formula. The p1, p2, and p3 represent data from phases 1, 2, and 3, respectively, in the following equations.
E m i s s i o n   f a c t o r   ( g   k m 1 ) o f   C V S   m o d e   i n   C V S   t u n n e l   s a m p l i n g   = 0.43 × ( B C p 1   ×   V m i x , p 1 ) + ( B C p 2   ×   V m i x , p 2 ) d p 1 +   d p 2 + 0.57   × ( B C p 2   ×   V m i x , p 2 ) + ( B C p 3   ×   V m i x , p 3 ) d p 2 +   d p 3
E m i s s i o n   f a c t o r   ( g   k m 1 ) o f   N E D C   m o d e   i n   C V S   t u n n e l   s a m p l i n g =   ( B C p 1   ×   V m i x , p 1 ) + ( B C p 2   ×   V m i x , p 2 ) d p 1 + d p 2

2.3. Calculation of a Absorption Ångström Exponent (AAE)

The absorption Ångström exponent (AAE) showed the characteristics of source types including pure BC, biomass combustion and mixing BC with non-absorbing compounds [15,19,20]. When this value is close to 1, it shows the effect of fossil fuel combustion, and when it is close to 2, it shows the effect of biomass combustion [19,20].
The AAE can be determined by the AE33 which uses the multiwavelength for measurement. The AAE value was derived using Equation (5). The babs1 and babs2 are absorption coefficients measured at 370 nm and 880 nm, and λ1 and λ2 are wavelengths used for each absorption coefficient, respectively [21].
AEE = ln ( b abs 1 , 370 nm / b abs 2 , 880 nm ) ln ( λ 1 , 370 nm / λ 2 , 880 nm )
In this section, in order the comparison with various emission source, the experiments of the biomass burning (oak wood) using the stove, coal burning from the power plant stack in addition to the results of the NIER modes were conducted. The set-up systems were the same as the measurement of the tailpipe sampling by chassis-dynamometer tests.

3. Results

3.1. BC Emission by Fuel Types According to NIER and Regulation Mode

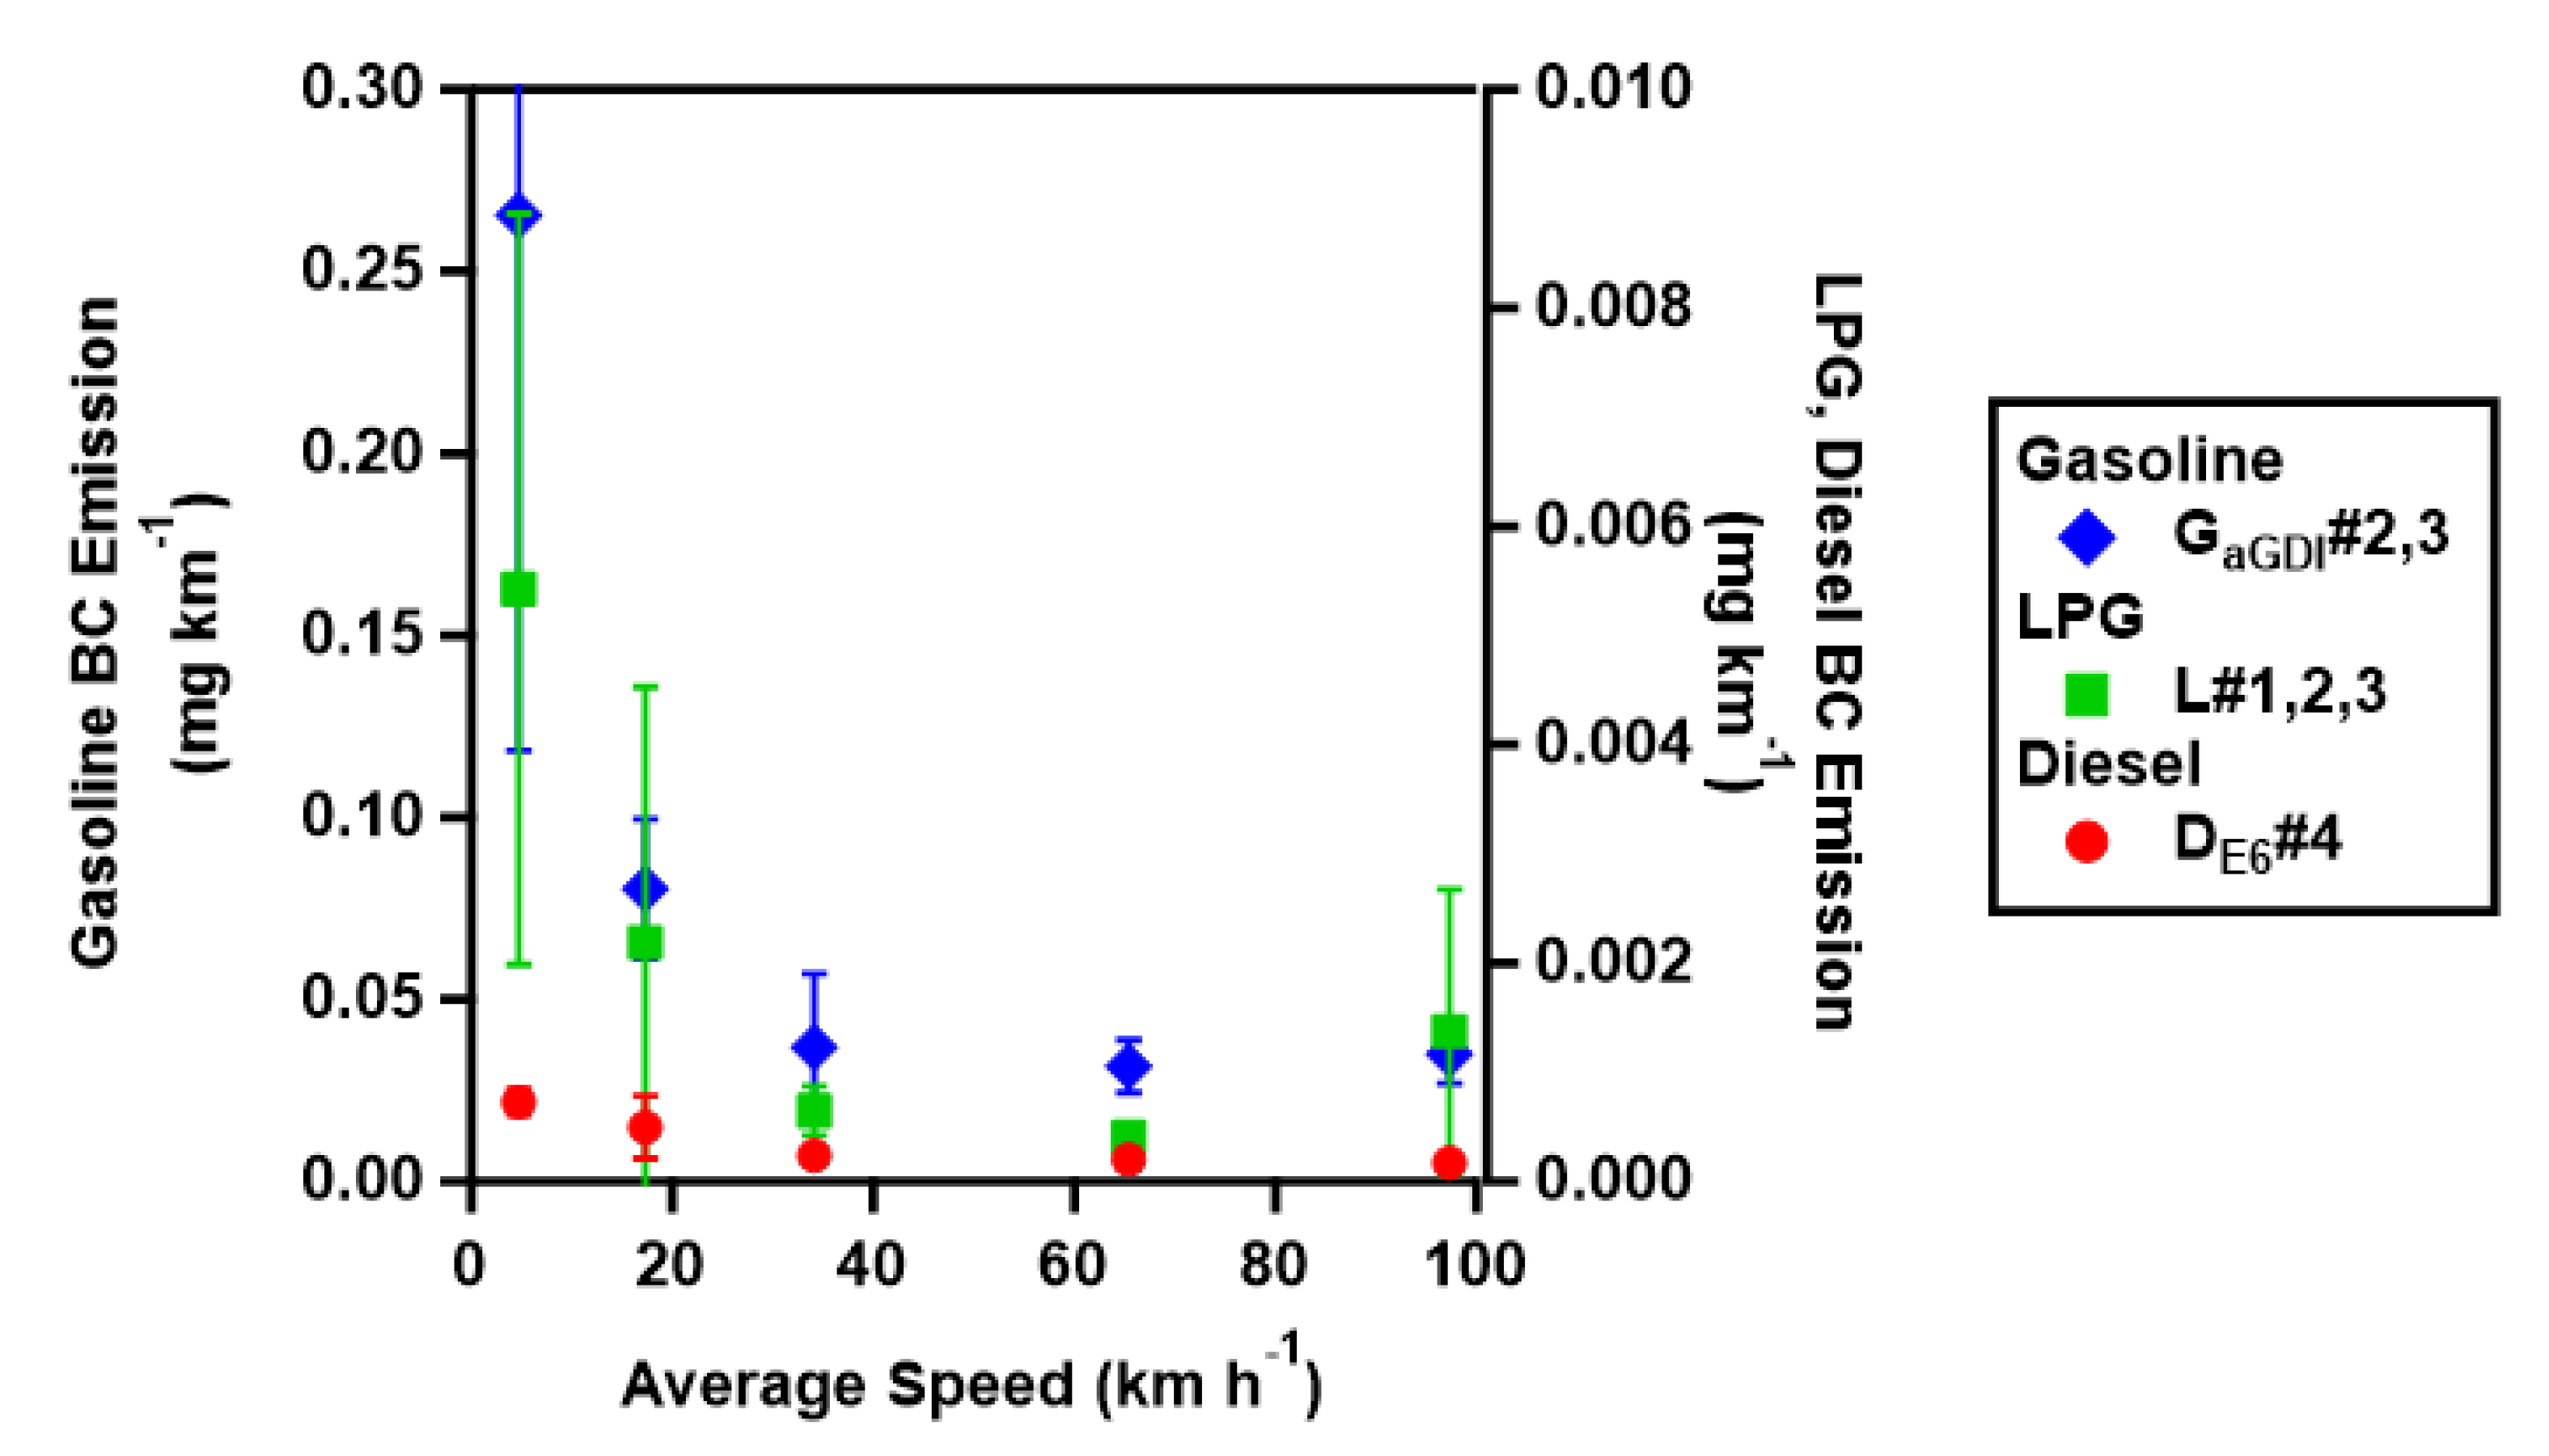
Only those vehicles that comply with the latest regulations (GDI gasoline vehicles with PM regulation (0.004 g km−1) applied, LPG, and EURO 6 diesel vehicles) were selected and compared by fuel types and shown in Figure 4 and Table 2. A decrease in BC emission was observed with an increase in the average speed of the mode according to vehicle displacement, and the emission increased after reaching the NIER-12 (avg. 65.4 km h−1) or NIER-14 (avg. 97.3 km h−1) modes for GDI gasoline and LPG vehicles. The low-speed NIER mode (NIER-01, avg. 4.7 km h−1) has a shorter mileage than the high-speed mode, and the stop section accounts for 49.7%, about half of the total driving mode, resulting in high emission measured for a short mileage with frequent stops and acceleration. In the high-speed modes (NIER-12 and NIER-14), the stopping sections are reduced; however, the BC emissions are ascertained to increase because of the high engine power output required for the high-speed driving.
For NIER modes in the heated state, GDI gasoline vehicles (0.032–0.27 mg km−1) were found to have BC emission values at least 25 times higher than those of LPG vehicles (0.0004–0.0054 mg km−1) and diesel vehicles (0.0002–0.0007 mg km−1). The high levels of BC are believed to be attributable to GDI engine combustion system that caused incomplete fuel volatilization and mixing in a cylinder [22,23]. For diesel vehicles using the same direct injection principles, the DPF installed in the vehicles is believed to reduce the level of BC emissions.
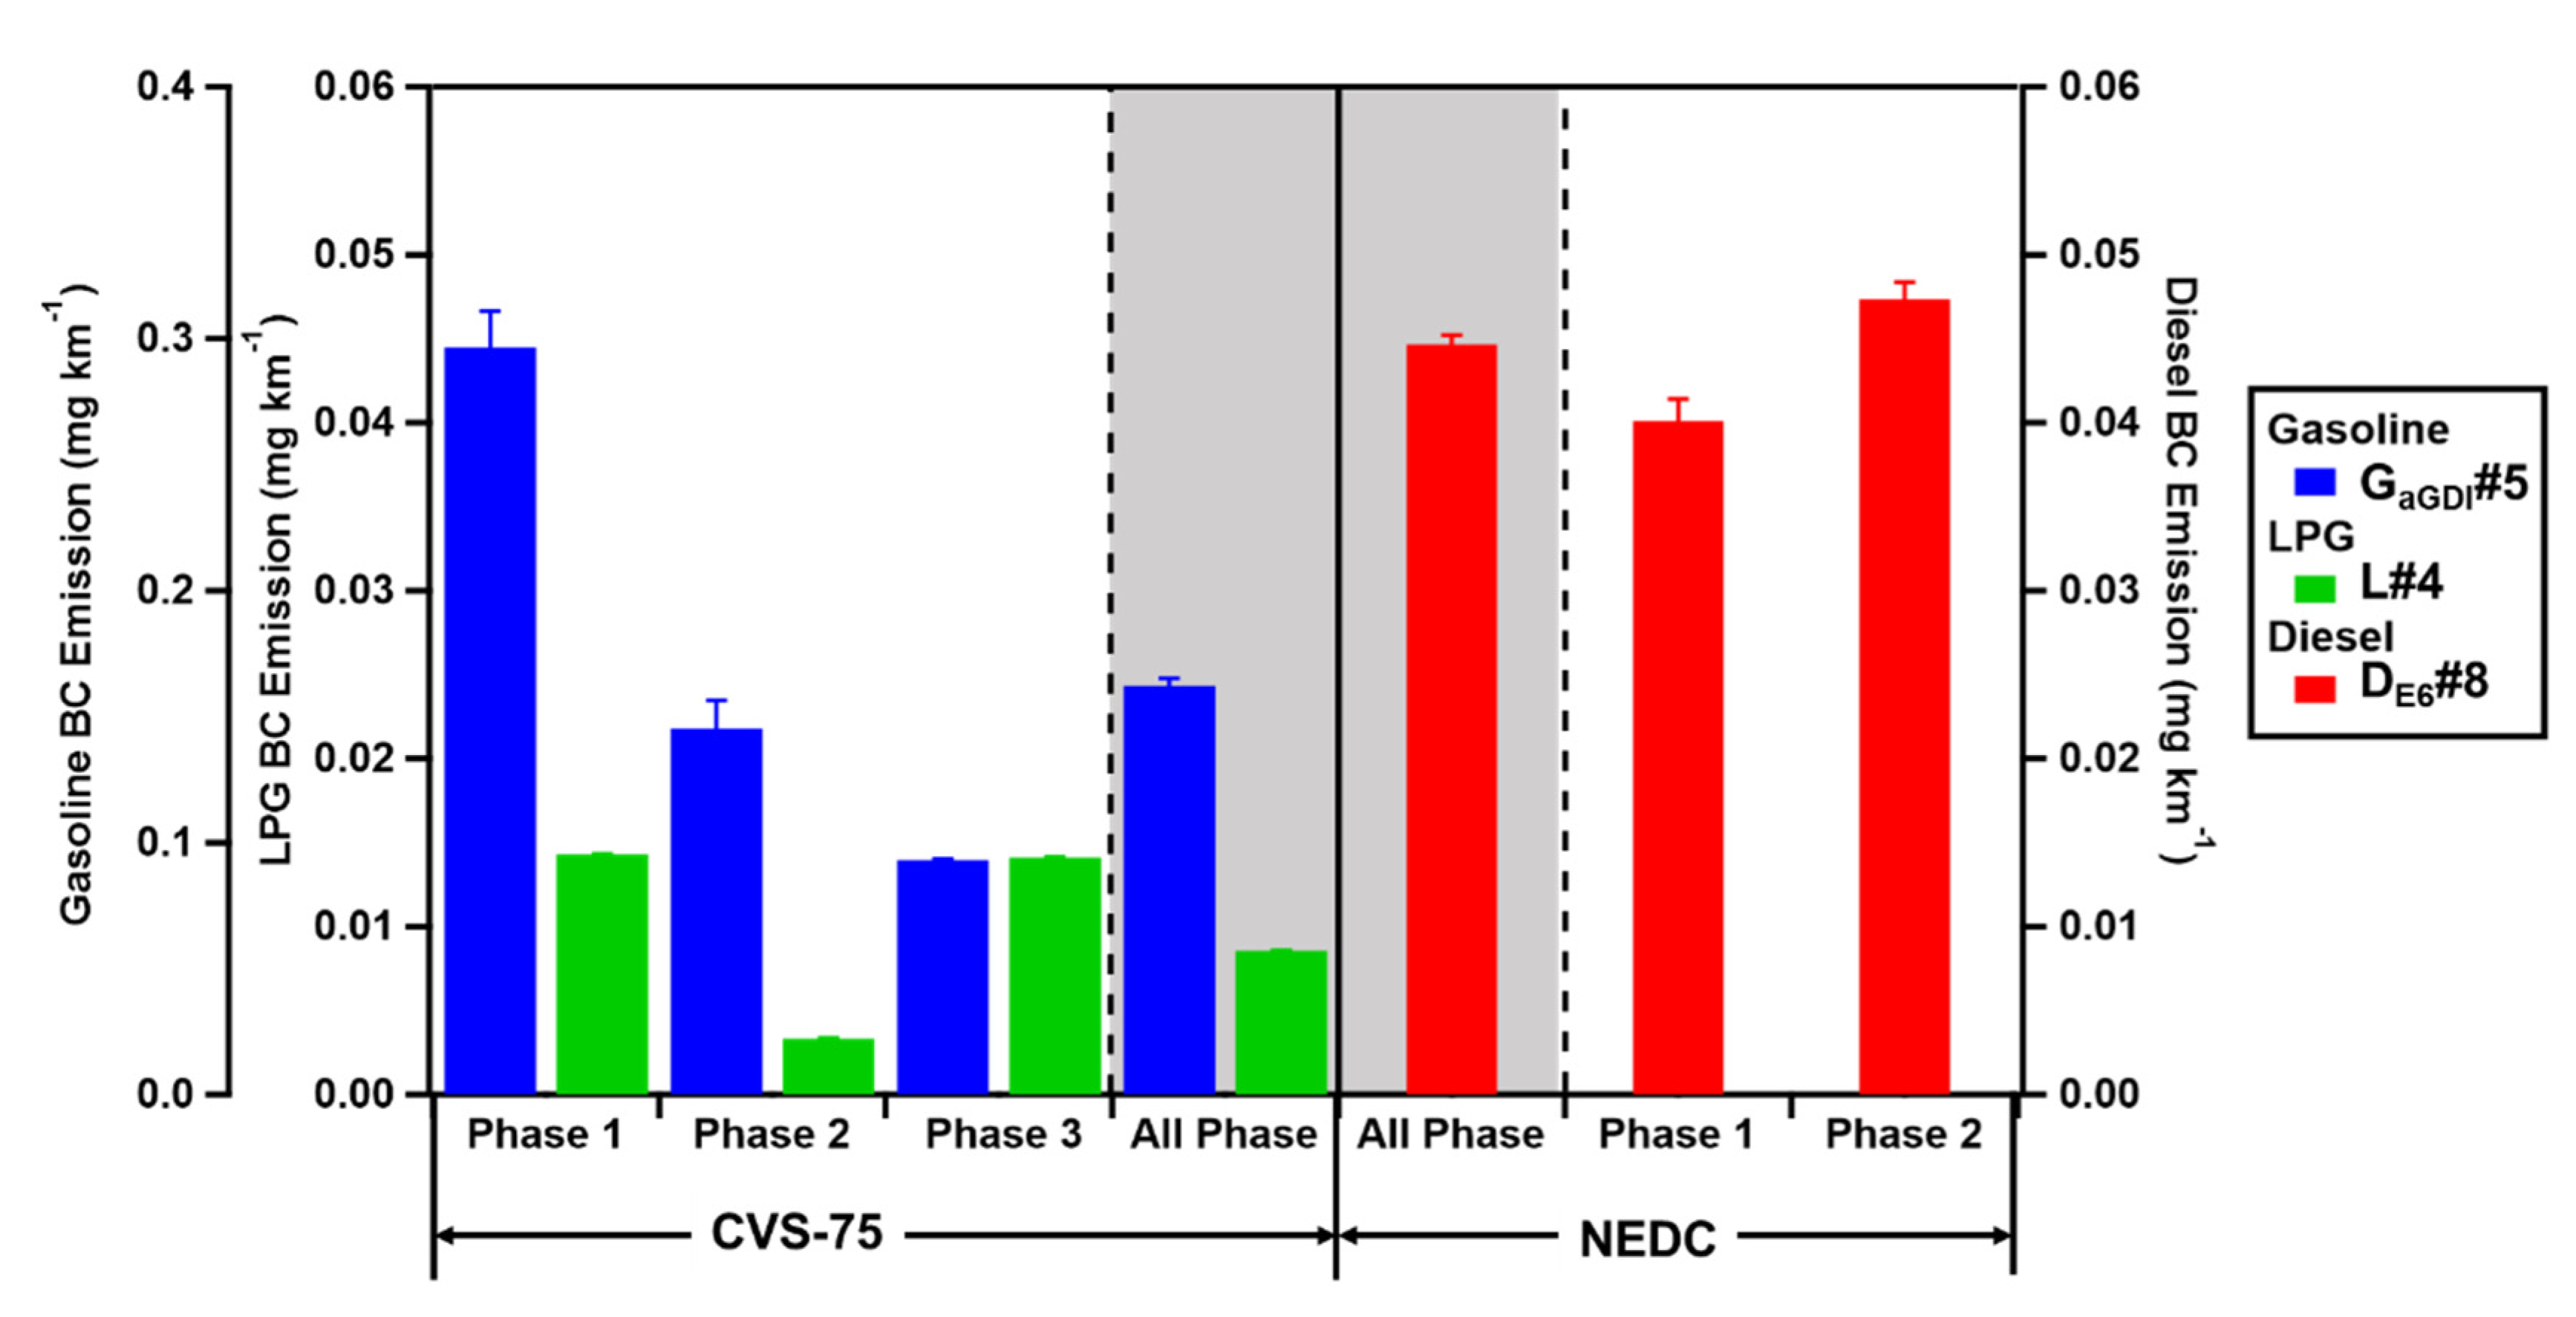
Figure 5 and Table 3 show the BC emissions generated by vehicles driven under the emission certification modes (CVS-75 and NEDC) according to the fuel oil type. As the results of the all phase, gasoline vehicles using PM-regulated GDI engines showed the highest emission at 0.16 mg km−1, while diesel vehicles with DPF and LPG vehicles showed low emission values of 0.045 mg km−1 and 0.0009 mg km−1, respectively. Gasoline vehicles and LPG vehicles showed the highest emissions in phase 1 with cold start. This is because a large amount of fuel is injected to produce the necessary power output while the vehicle is not heated sufficiently. As regards diesel vehicles in the NEDC mode, high emission was observed in the high-speed section (phase 2). In phase 1, a large amount of fuel is consumed due to cold start until the vehicle stabilizes. However, in phase 2, the high-speed section is included. Thus, the emission value becomes higher compared with that of phase 1.

3.2. BC Emission According to Engine Characteristics and Tightening of Regulations

BC emission from vehicles is related to various parameters; engine technology, adoption of aftertreatment like DPF, driving conditions such as a temperature, humidity, acceleration, and deceleration [24,25]. Therefore, in order to understand the characteristics of BC emission, we classified gasoline vehicles according to the engine technology of GDI and MPI, and the degree of aging of MPI vehicles, and diesel vehicles were classified by emission certification mode. Comparing the difference in BC emission for gasoline vehicles with GDI engines and the PM regulation of 0.004 g km−1 after 2014, in the heated state, GbGDI#1 vehicle (before PM regulation) showed an emission of 0.2–1.03 mg km−1, and GaGDI#2, 3 vehicles (after PM regulation) showed an emission of 0.038–0.2 mg km−1, which confirmed that in the preheated state. The GDI vehicle before the PM regulation emitted more BC by approximately five times compared with that after the PM regulation (Figure 6a and Table 4). In the CVS-75 mode, including both the cold start state and before the preheating state, BC emission was higher in GbGDI#5 (0.44 mg km−1) than in GaGDI#6 (0.16 mg km−1) by about 2.8 times. For MPI vehicles without the PM regulation, BC emissions from vehicles in the NIER mode, in the heated state, were lower by 23 times at the minimum and 25 times at the maximum than those of the GDI vehicles. However, in the CVS-75 mode, which includes cold start, the emission was lower by 2–3 times than that of GDI vehicles. These results showed that driving in sufficient preheating conditions on MPI vehicles emitted low BC emission, but the emission was higher on cold start and before the preheating condition (Figure 6b and Table 5). Among gasoline vehicles, the emission difference between GDI and MPI vehicles is believed to be attributable to the increased PM emissions associated with the GDI method and the increased incomplete combustion associated with the MPI method, leading to increased BC emissions [26].
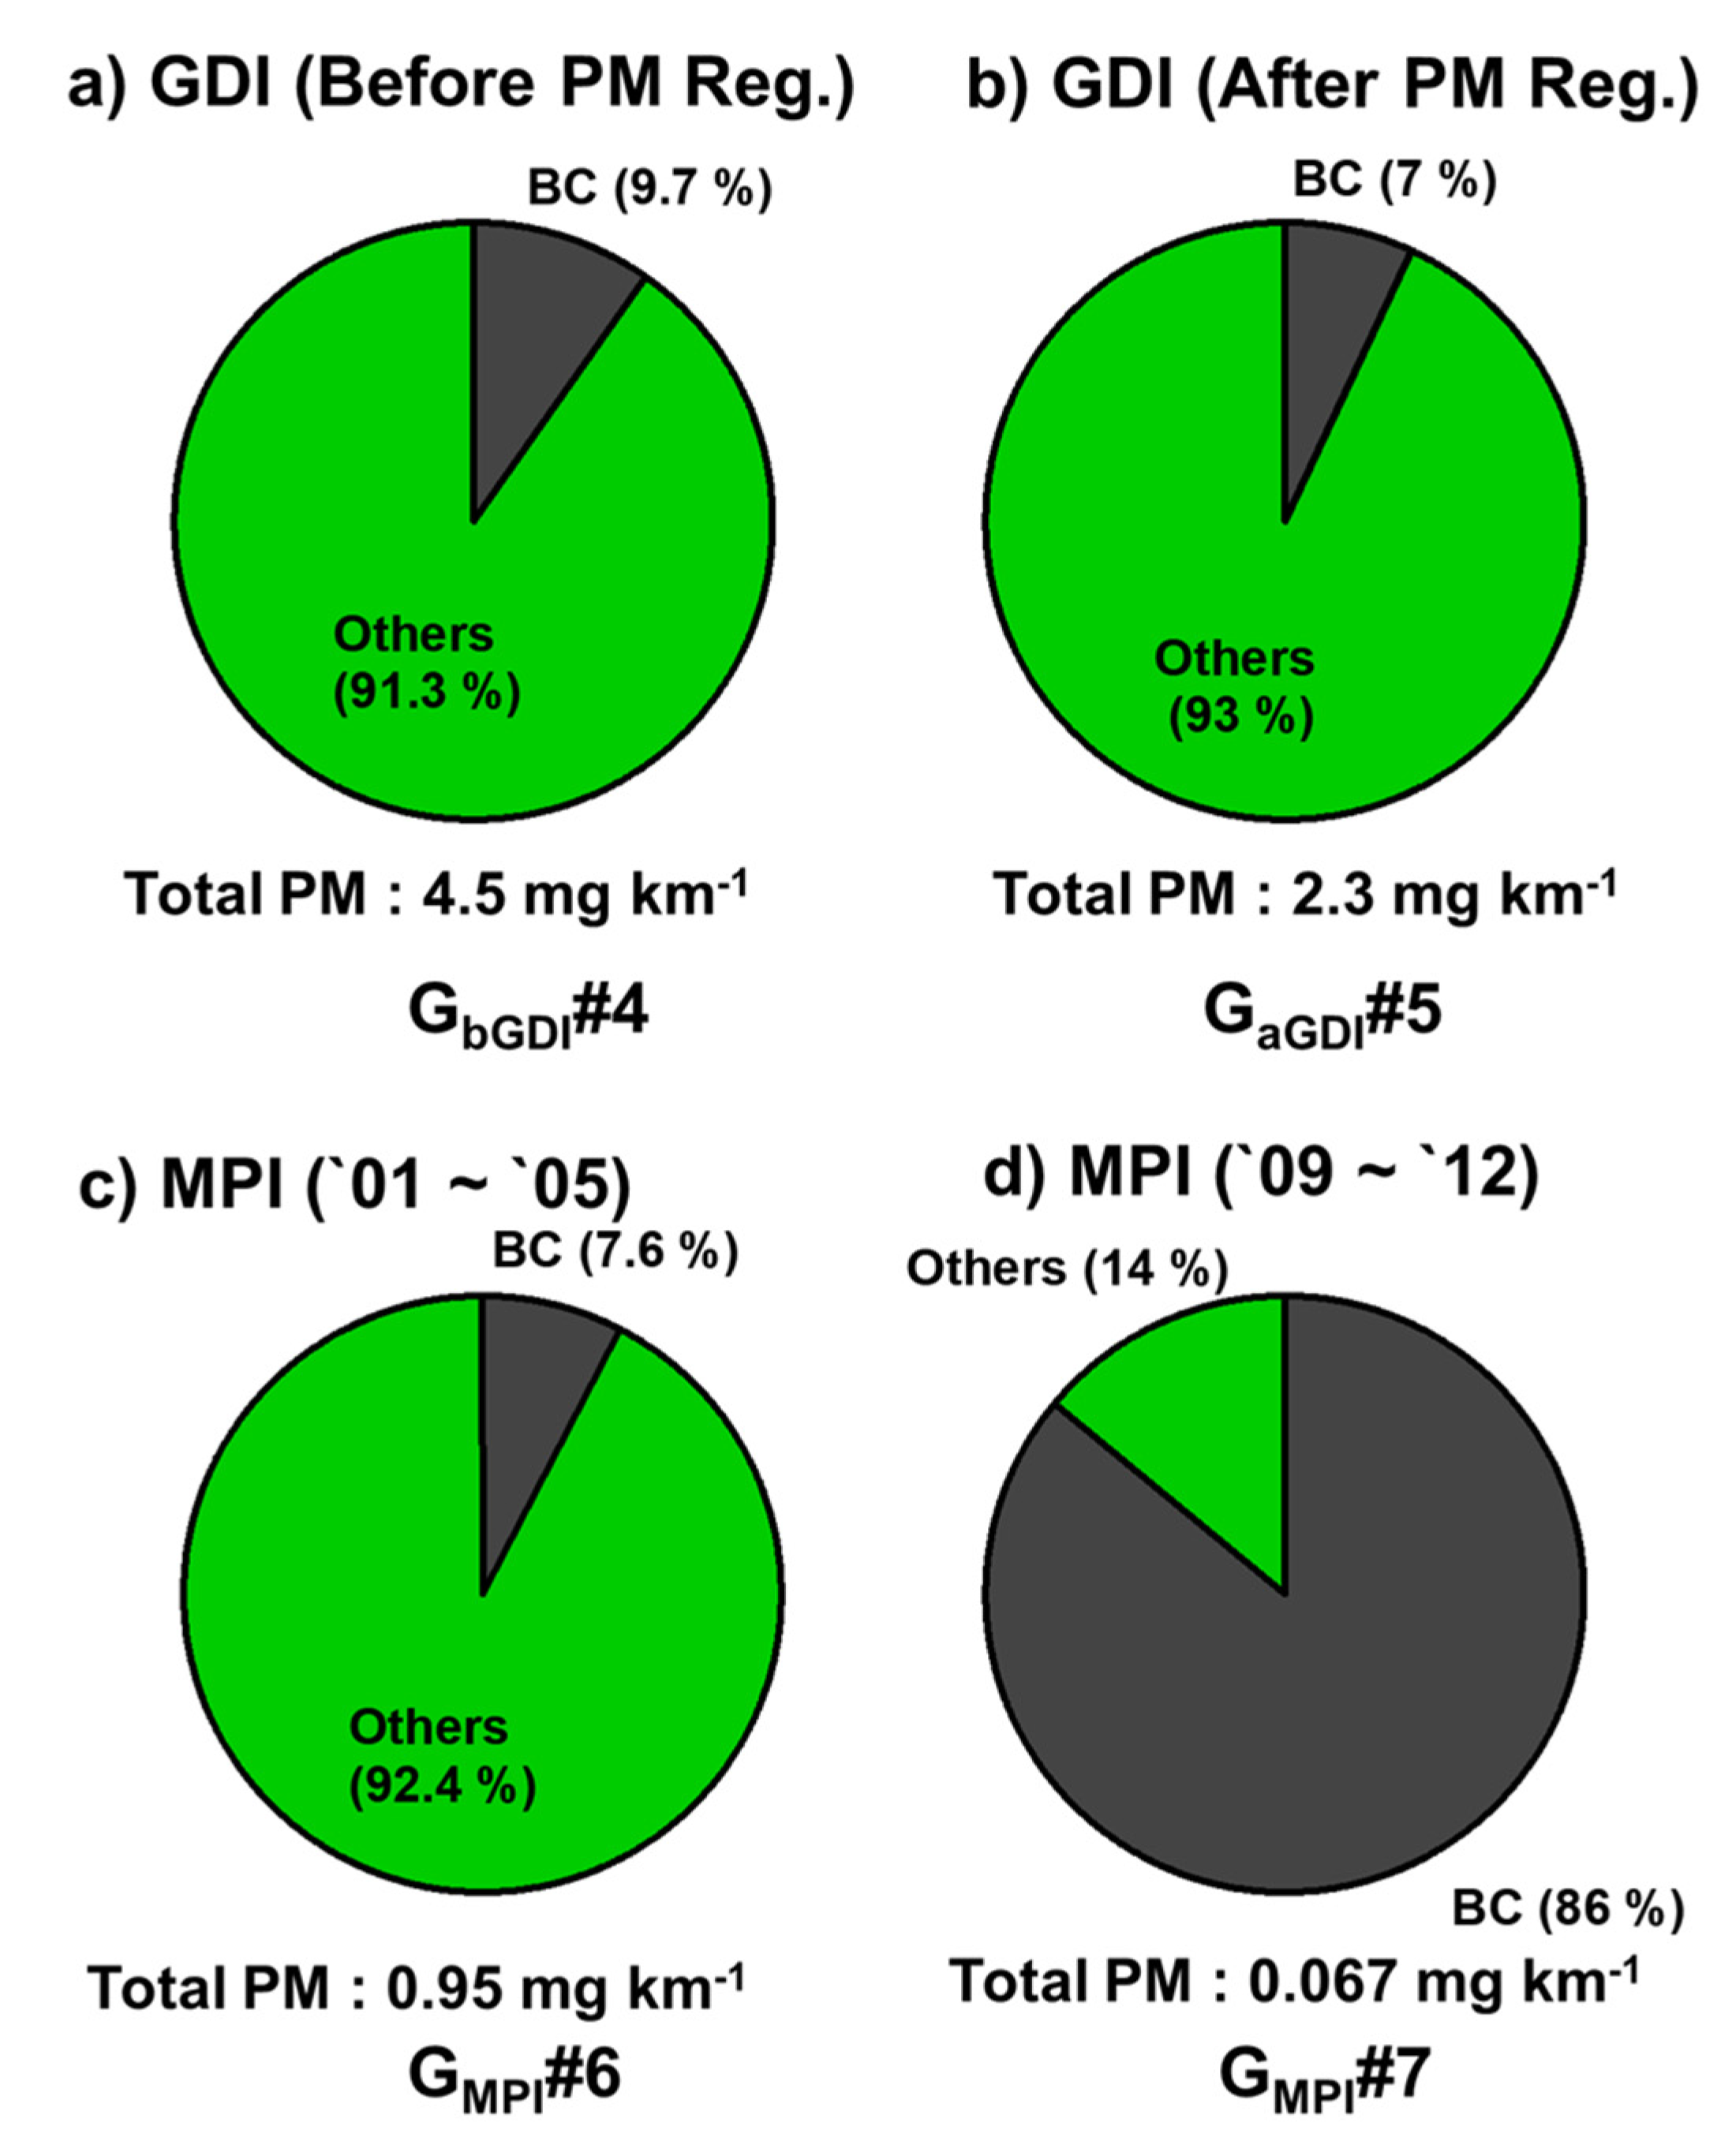
BC is a component of PM and to identify the BC emission in PM according to the implementation of the PM regulation, the value was represented as a ratio using the emissions of PM and BC measured in gasoline vehicles (Figure 7). The BC/PM ratio of GDI vehicles changed from 9.7% to 7% before and after the PM regulation application, indicating that the regulation decreased BC emission by approximately 2%. The BC/PM ratio was 7.6% for MPI vehicles of the model years 2001–2005 and 86% for vehicles of model years 2009–2012 confirming that PM emissions other than BC decreased in recent vehicles compared to older vehicles.
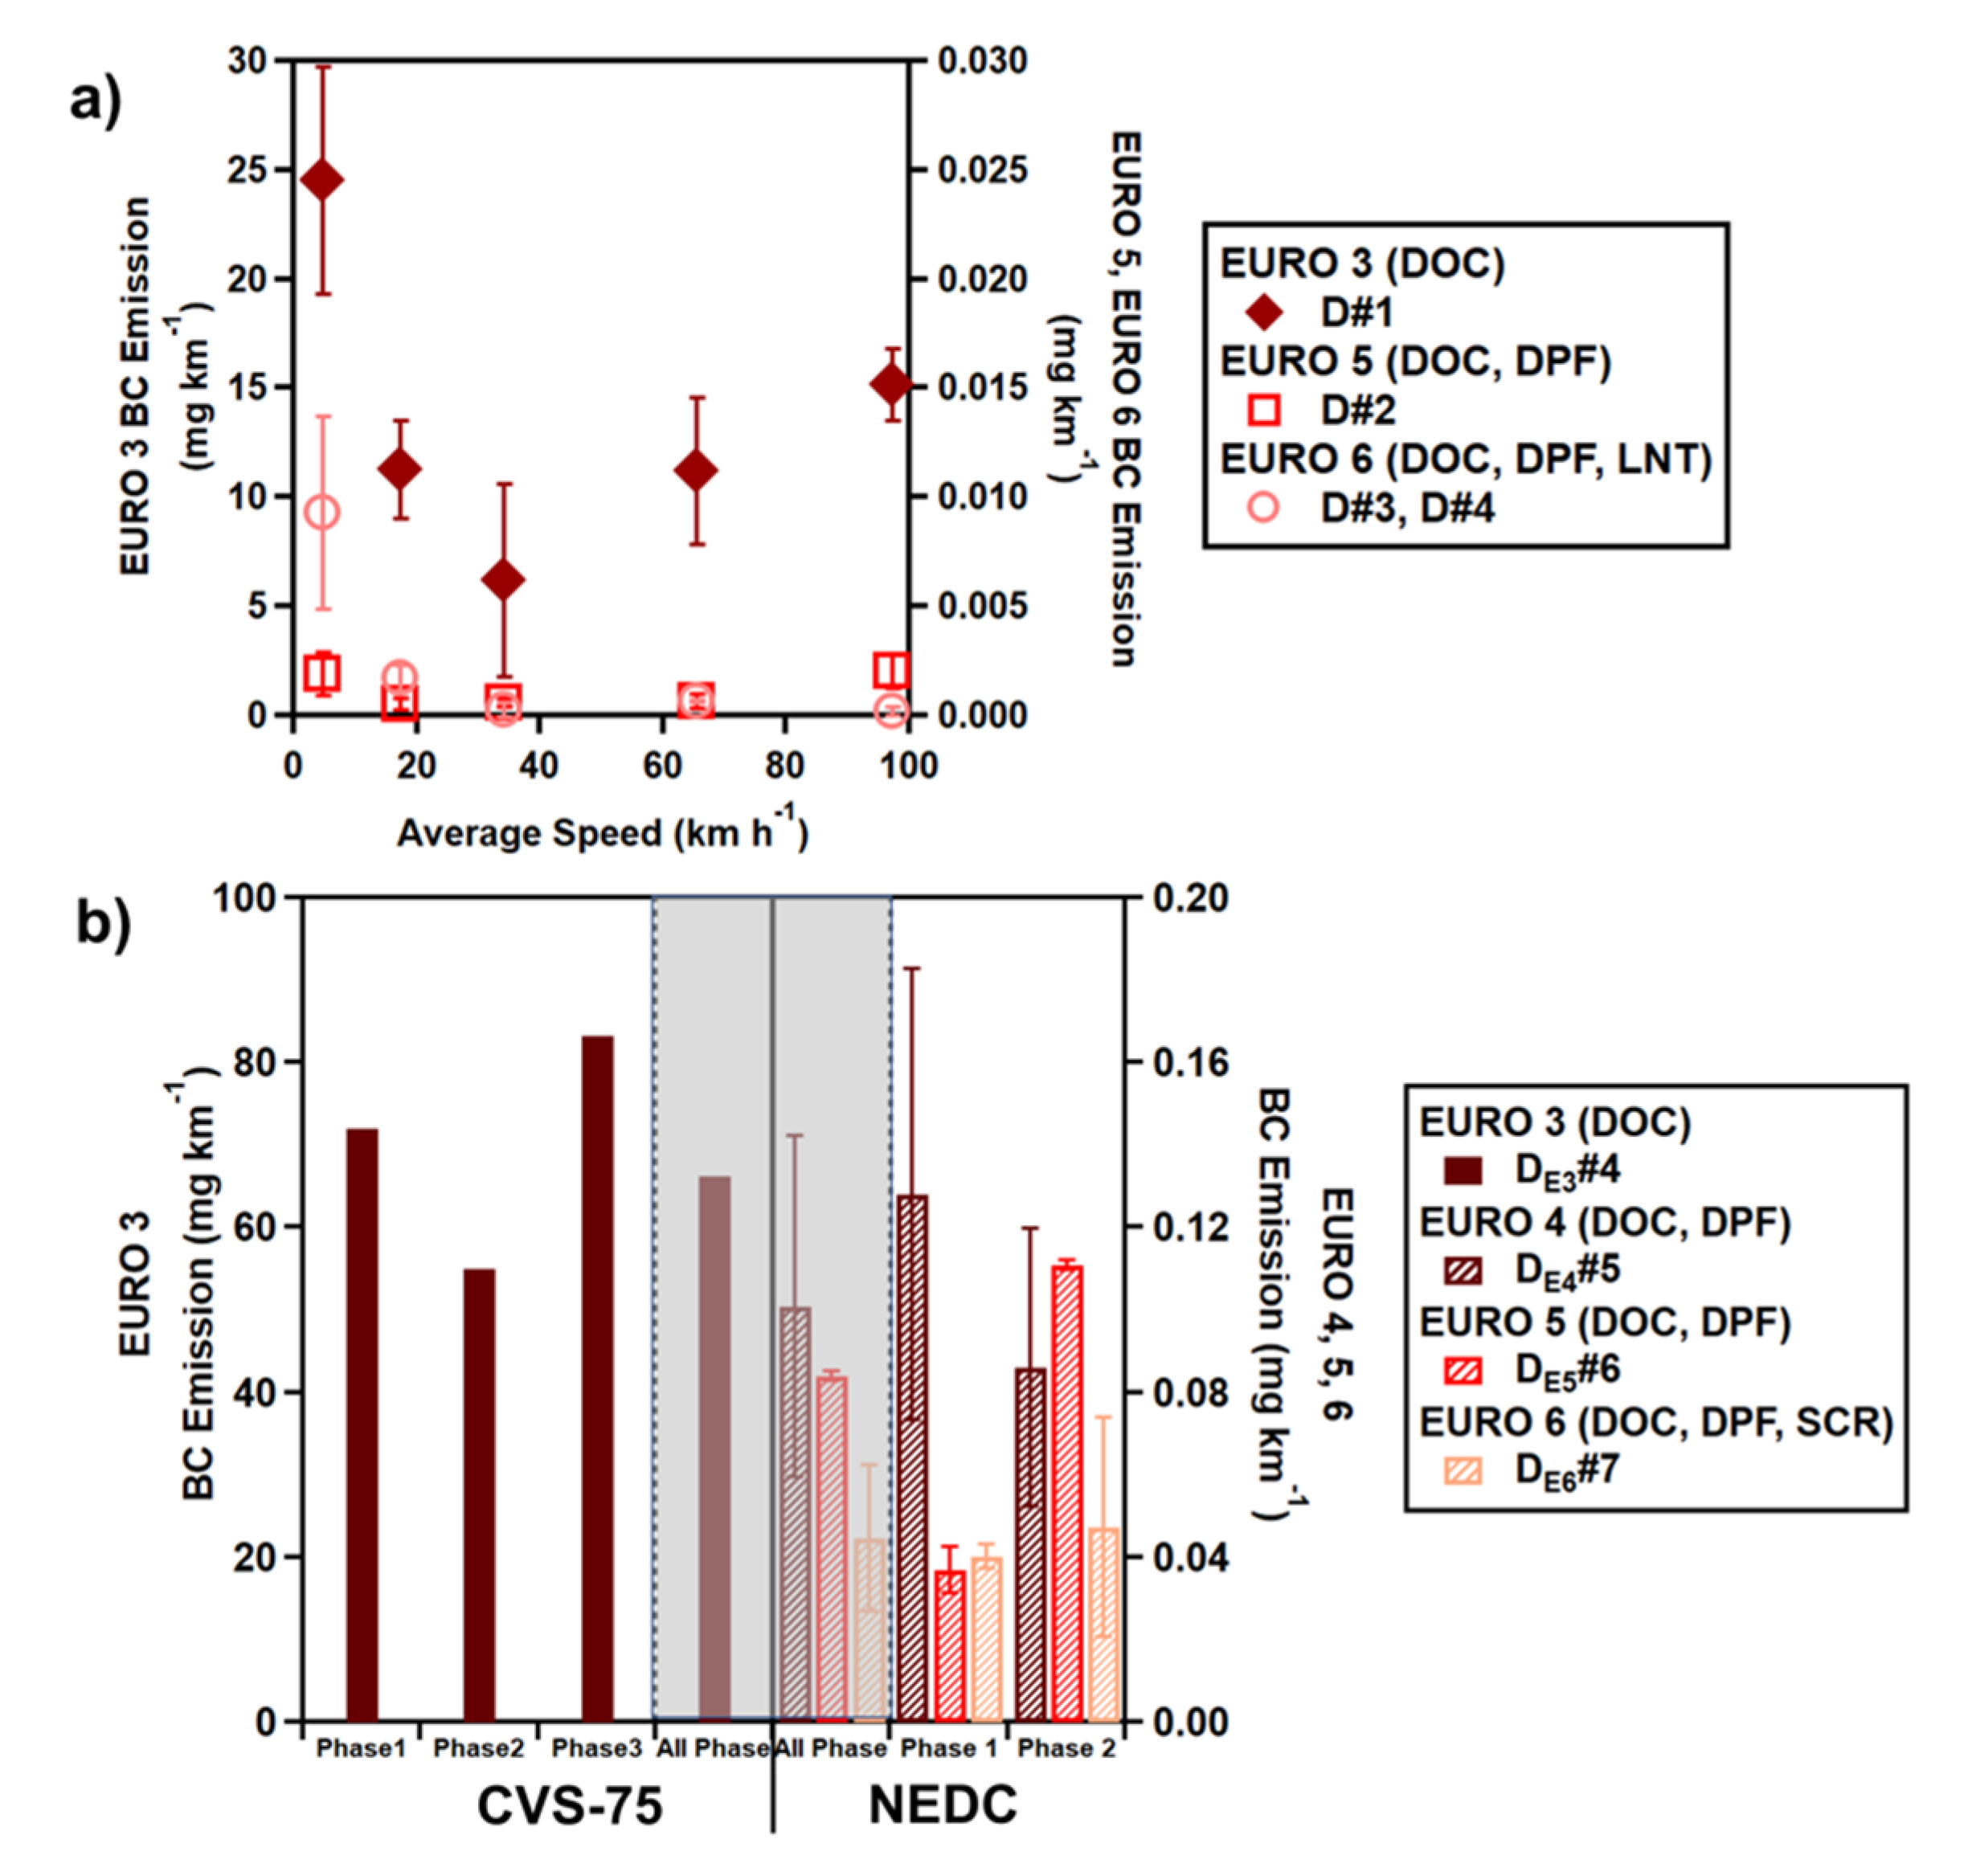
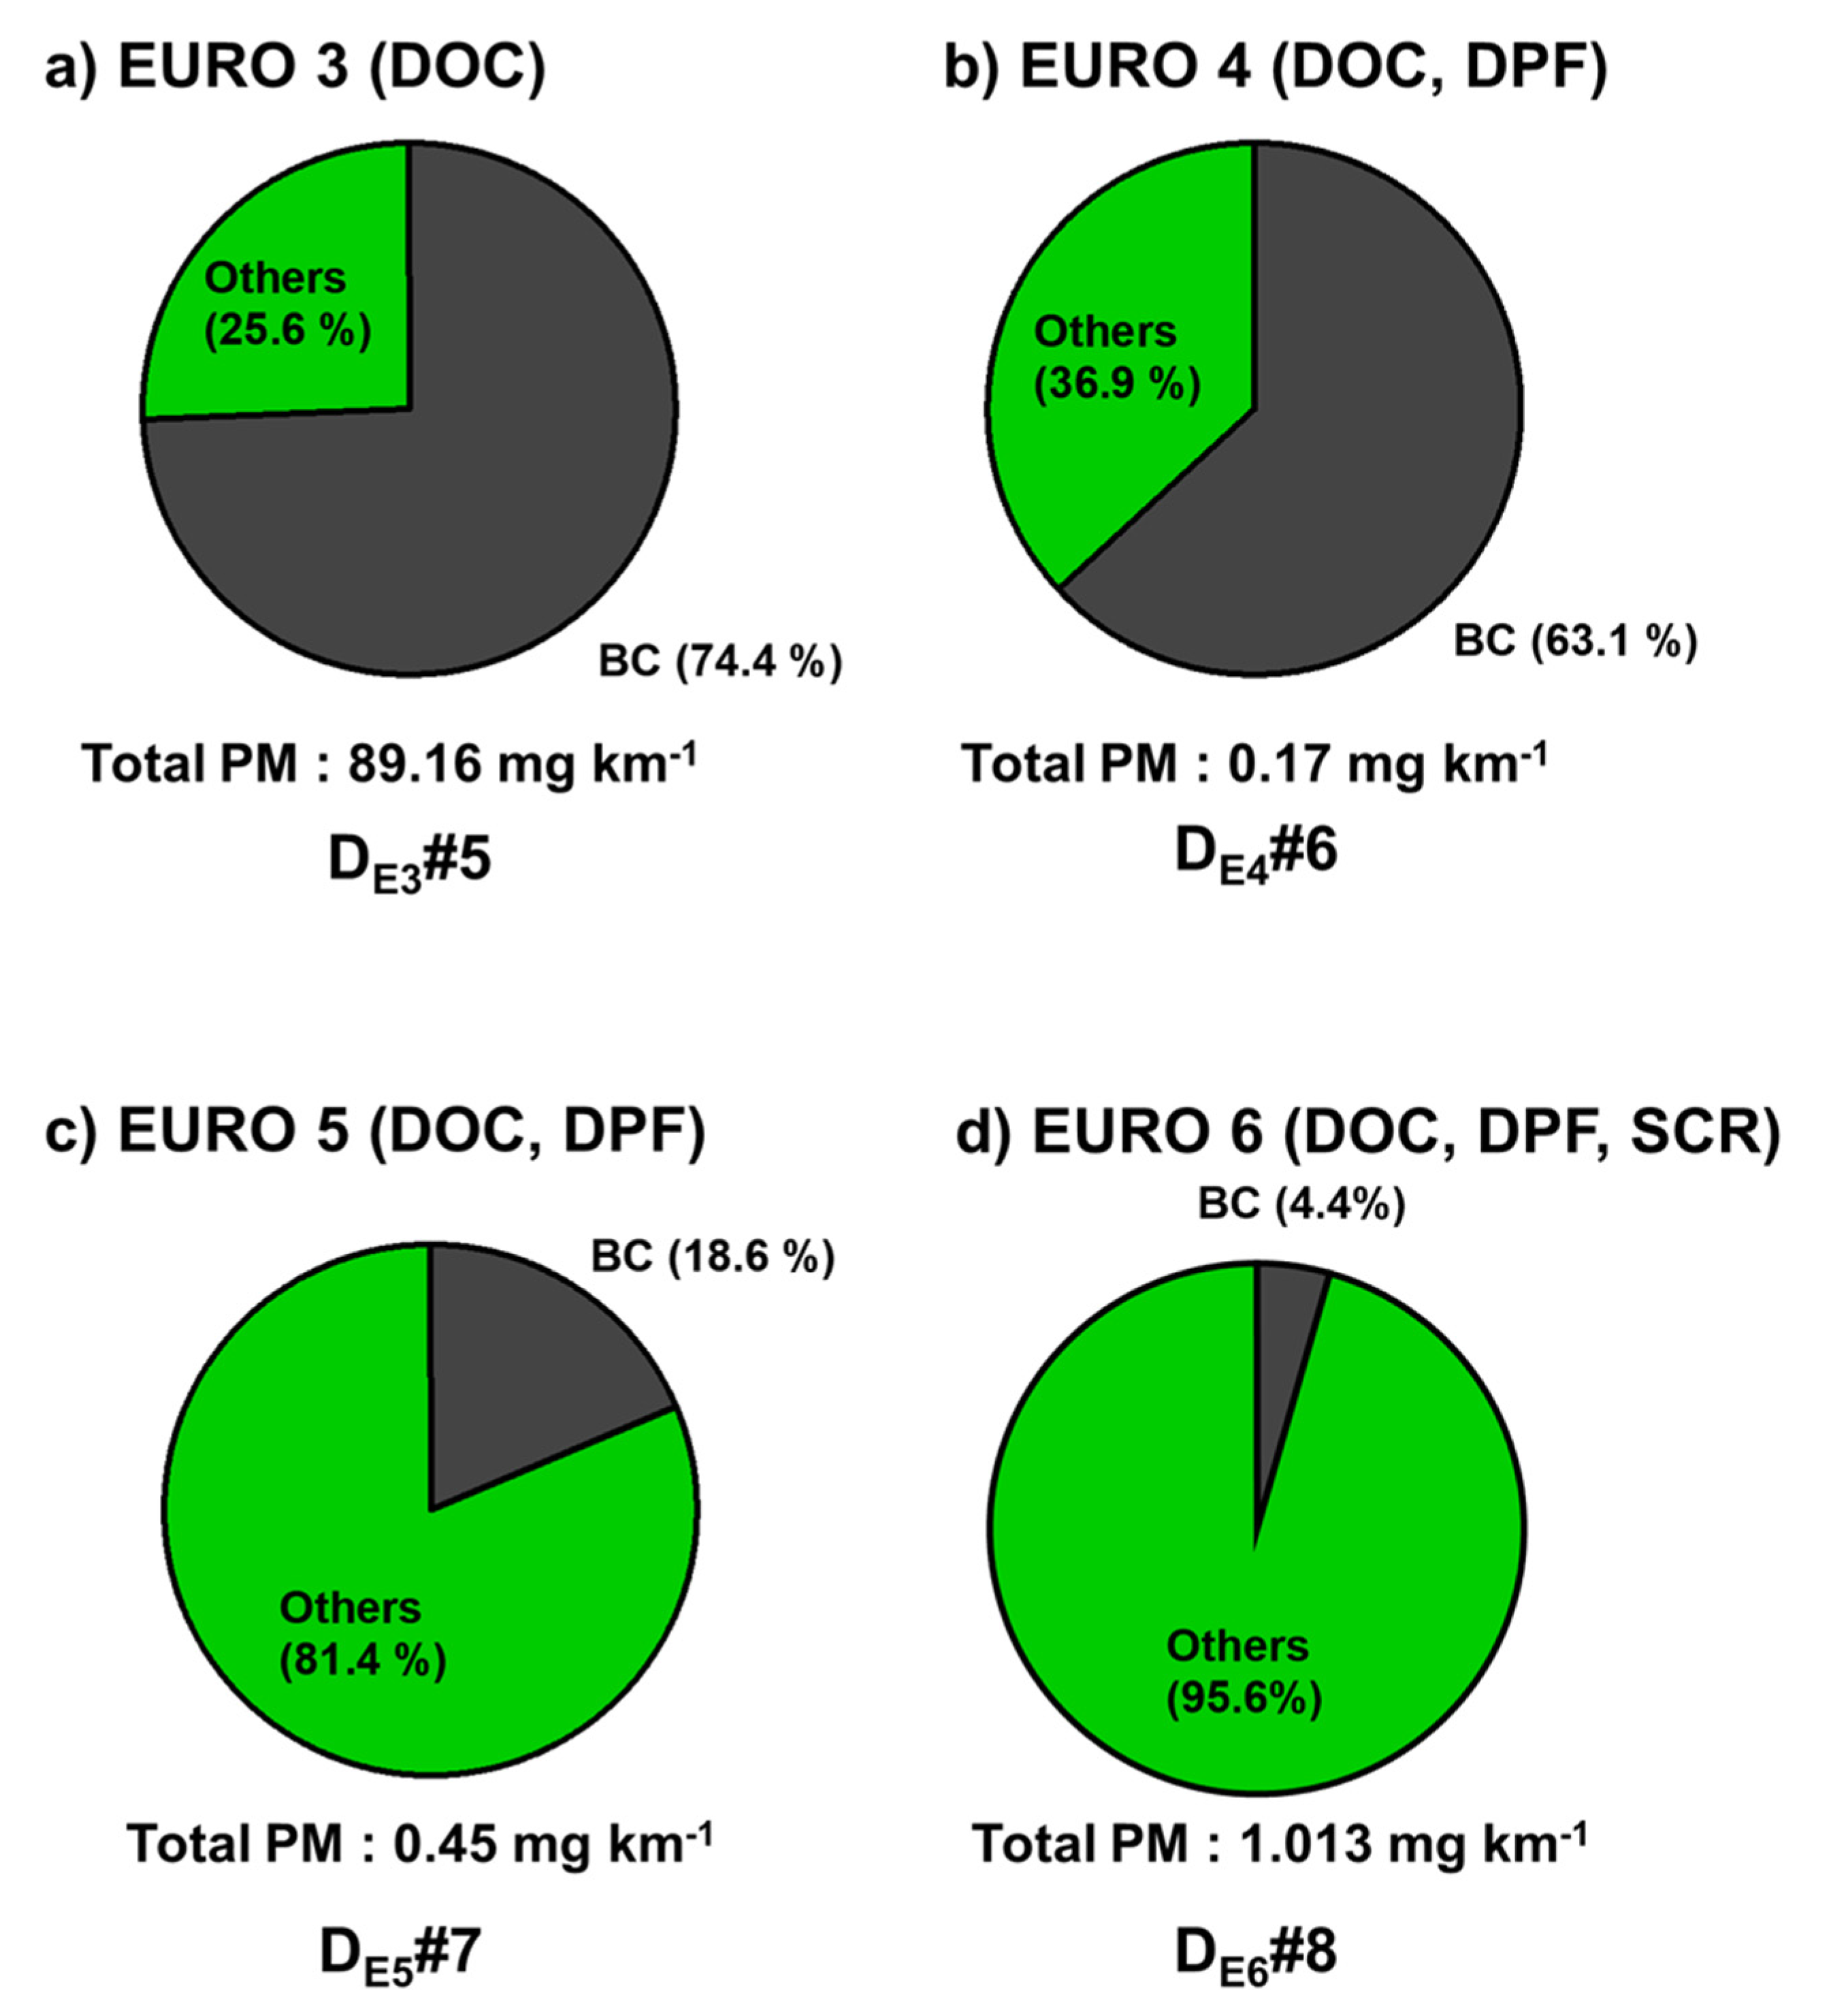
Figure 8 shows the results of BC emissions following the tightening of regulations on diesel vehicles; the results according to driving speed are shown for EURO 3, 5, and 6 vehicles (Figure 8a and Table 6) in NIER modes, and BC emissions are shown for EURO 3, 4, 5, and 6 vehicles (Figure 8b and Table 7). As for EURO 3, CVS-75, a regulation mode for emissions in those days, was applied and for EURO 4 to 6, NEDC, emission certification mode of the corresponding regulation, was applied in CVS-75 and NEDC. In the NIER mode, driven in the preheated state, the BC emission of EURO 3 vehicles was measured to be 6.21–24.54 mg km−1, which was found to be 2000 times higher than that of EURO 5 and 6 vehicles (0.0005–0.0093 mg km−1). In the NEDC mode with cold start, as in the NIER mode, EURO 3 vehicles without DPF (66.29 mg km−1) showed the highest emission, followed by EURO 4 (0.1 mg km−1), EURO 5 (0.084 mg km−1), and EURO 6 (0.044 mg km−1). EURO 3 diesel vehicles with the highest emission are not equipped with DPF, an aftertreatment device that reduces PM emission, commonly used in vehicles manufactured after EURO 4. For this reason, the installation of DPF in diesel vehicles is believed to be effective in reducing BC emission. In addition, the BC/PM emission ratio of diesel vehicles was the highest with EURO 3 vehicles at 74.4%, followed by EURO 4 (63.1%), EURO 5 (18.6%), and EURO 6 (4.4%), confirming that the BC ratio also decreased with the tightening of PM regulation (Figure 9).

3.3. Characteristics of BC Emissions by Emission Source

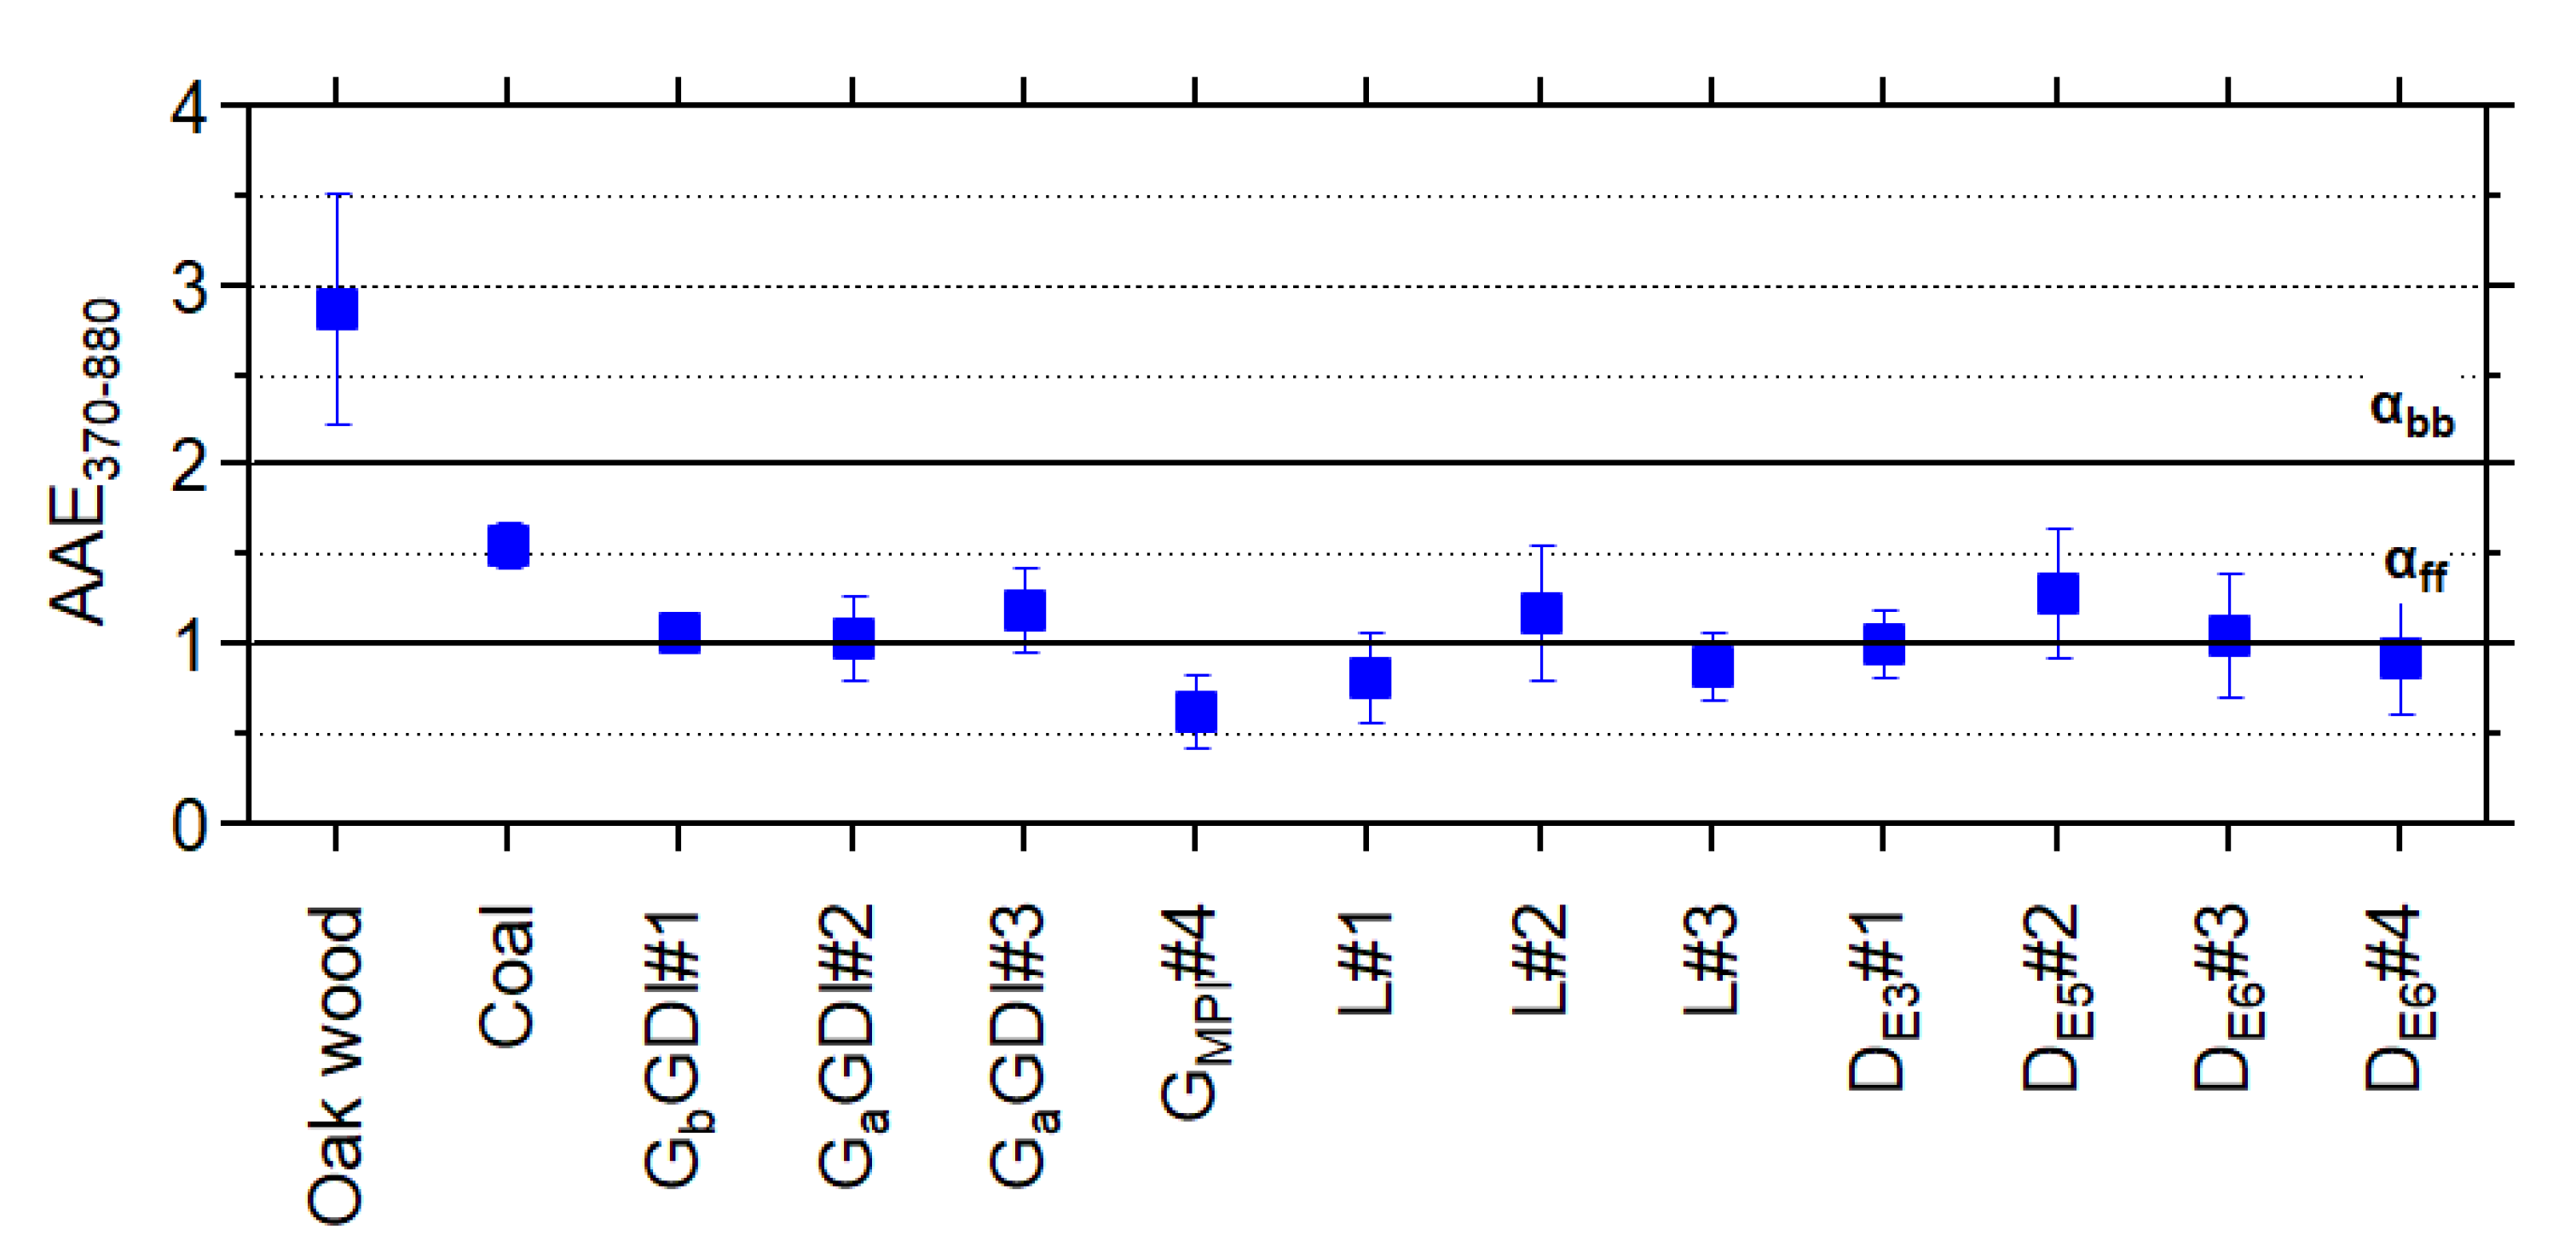
The AAE method is commonly used to separate the fractions of light absorption by properties of BC such as biomass and fossil fuel burning [27,28]. Figure 10 shows the AAE using Equation (5) throughout the average of NIER modes, biomass (oak wood) burning, and coal combustion (power plant stack). Biomass (oak wood) burning was found to be 2.88, a value followed similar with wood-fueled cookstoves, and mixed-fuel stove emissions (2.1–2.9) from Geotz et al. [28]. Also, Kirchstetter et al. and Laskin et al. reported that the AAE from biomass burning was approximately 2.0 [29,30]. The coal combustion (power plant stack) was found to be 1.56. Regarding pollutants emitted from automobiles, the values for tested vehicles in NIER modes were between 0.64 and 1.29. The overall average, divided by fuel, was gasoline 0.98, LPG 0.99, and diesel 1.03. These trends of results were similar to that the AAE of BC in traffic and tunnel emissions were commonly around 0.97–1.35 [31,32].

4. Conclusions

In this study, BC emissions from domestic vehicles in South Korea were measured. The emissions were categorized according to fuel type and the vehicles were categorized by the engine technology used and the regulator standards applied. Various vehicle speeds were also considered. In all types of vehicles, BC emission was reduced with driving speeds from low to high, but beyond a certain threshold (65.4 km h−1 or 97.3 km h−1), the emission increased again. In terms of fuel oil type, in NIER modes with preheating, the emission of GDI vehicles were 0.0032–0.27 mg km−1, and the highest value of 0.16 mg km−1 was observed in the regulation mode that included the cold start section. Diesel vehicles with DPF and LPG vehicles showed low levels of emissions at 0.01 mg km−1 or less in NIER modes, and at 0.045 mg km−1 and 0.0009 mg km−1 in regulation modes, respectively.
Among gasoline vehicles, GDI vehicles showed BC emissions of 2.8–5 times higher than that of MPI vehicles. With the tightening of regulations, MPI vehicles showed reduced PM emissions other than BC. Among diesel vehicles, EURO 3 vehicles without DPF showed emissions of 6.21–66 mg km−1, which is estimated to be at least 1500 times higher than regulated vehicles with DPF. This confirms that DPF reduces BC emissions. With the application and tightening of PM regulations, both gasoline and diesel vehicles exhibited reduced BC emissions as well as PM emissions. However, for gasoline vehicles, many GDI vehicles were manufactured before the application of the PM regulation, and diesel vehicles without DPF are still in operation in Korea. The AAE values of 2.88 for biomass burning (oak wood), 1.56 for coal combustion (power plant stack), and 0.64–1.29 for automobile emissions by NIER modes could be obtained, confirming the possibility of tracking BC sources using AE33 measurement data.

Author Contributions

Conceptualization, G.P. and T.L.; methodology, K.K. and T.L.; formal analysis, T.P., S.K. (Seokwon Kang), J.B., D.-G.Y., and J.-H.W.; investigation, S.K. (Sunmoon Kim) and S.C.; resources, S.L., Y.L., S.K. (Sunmoon Kim), and J.L.; data curation, G.P. and T.L.; writing—original draft preparation, G.P. and T.L.; writing—review and editing, G.P., K.K., and T.L., supervision, T.L. All authors have read and agreed to the published version of the manuscript.

Funding

This work was supported by a grant from the National Institute of Environment Research (NIER), founded by the Ministry of Environment (MOE) of the Republic of Korea (NIER-2019-04-02-018). Additional data analysis was supported by Korea Environment Industry & Technology Institute (KEITI) through Public Technology Program based on Environmental Policy Program, funded by Korea Ministry of Environment (MOE) (2019000160007).

Acknowledgments

The authors thank the research scientists at the Transportation Pollution Research Center in the National Institute of Environmental Research (NIER) for their contribution to the success of the project.

Conflicts of Interest

The authors declare no conflict of interest.

References

  1. Park, S.-S.; Yu, G.-H.; Lee, S.-I.; Bae, M.-S. Aethalometer-based Estimate of Mass Absorption Cross Section of Black Carbon Particles at an Urban Site of Gwangju. J. Korea Soc. Atmos. Environ. 2018, 34, 727–734. [Google Scholar] [CrossRef]
  2. Ramanathan, V.; Carmichael, G. Global and regional climate changes due to black carbon. Nat. Geosci. 2008, 1, 221–227. [Google Scholar] [CrossRef]
  3. Bond, T.C.; Doherty, S.J.; Fahey, D.W.; Forster, P.M.; Berntsen, T.; DeAngelo, B.J.; Flanner, M.G.; Ghan, S.; Kärcher, B.; Koch, D. Bounding the role of black carbon in the climate system: A scientific assessment. J. Geophys. Res. Atmos. 2013, 118, 5380–5552. [Google Scholar] [CrossRef]
  4. Seo, J.; Kim, J.Y.; Youn, D. Climate Impact of Black Carbon Emissions from Marine Engines. Korean Soc. Mech. Eng. 2015, 3965–3970. [Google Scholar]
  5. Janssen, N.; Gerlofs-Nijland, M.; Lanki, T.; Salonen, R.; Cassee, F.; Hoek, G.; Fischer, P.; Brunekreef, B.; Krzyzanowski, M. Health Effects of Black Carbon; WHO: Geneva, Switzerland, 2012. [Google Scholar]
  6. Roosbroeck, S.V.; Hoek, G.; Meliefste, K.; Janssen, N.A.; Brunekreef, B. Validity of residential traffic intensity as an estimate of long-term personal exposure to traffic-related air pollution among adults. Environ. Sci. Technol. 2008, 42, 1337–1344. [Google Scholar] [CrossRef]
  7. Park, S.H. Estimation of Direct Radiation Forcing of Atmosperic Black Carbon Using Air Quality Modeling. J. Korean Soc. Environ. Technol. 2009, 10, 246–253. [Google Scholar]
  8. Bond, T.C.; Streets, D.G.; Yarber, K.F.; Nelson, S.M.; Woo, J.H.; Klimont, Z. A technology-based global inventory of black and organic carbon emissions from combustion. J. Geophys. Res. Atmos 2004, 109. [Google Scholar] [CrossRef] [Green Version]
  9. Chan, T.W.; Meloche, E.; Kubsh, J.; Brezny, R. Black carbon emissions in gasoline exhaust and a reduction alternative with a gasoline particulate filter. Environ. Sci. Technol. 2014, 48, 6027–6034. [Google Scholar] [CrossRef]
  10. Cédric, L.; Goriaux, M.; Tassel, P.; Perret, P.; André, M.; Liu, Y. Impact of aftertreatment device and driving conditions on black carbon, ultrafine particle and NOx emissions for Euro 5 diesel and gasoline vehicles. Trans. Res. Proc. 2016, 14, 3079–3088. [Google Scholar] [CrossRef] [Green Version]
  11. Heo, J.; Hopke, P.; Yi, S. Source apportionment of PM2. 5 in Seoul, Korea. Atmos. Chem. Phys. 2009, 9, 4957–4971. [Google Scholar] [CrossRef] [Green Version]
  12. Bae, G.; Lee, S. Contamination Level of Vehicle-Related Air Pollutants at a Roadside in the Downtown Area of Seoul. In Proceeding of the 2009 KSAE Annual Conference, Incheon, Korea, 29 April 2009; pp. 340–345. [Google Scholar]
  13. Song, S.; Wu, Y.; Xu, J.; Ohara, T.; Hasegawa, S.; Li, J.; Yang, L.; Hao, J. Black carbon at a roadside site in Beijing: Temporal variations and relationships with carbon monoxide and particle number size distribution. Atmos. Environ. 2013, 77, 213–221. [Google Scholar] [CrossRef]
  14. Pérez, N.; Pey, J.; Cusack, M.; Reche, C.; Querol, X.; Alastuey, A.; Viana, M. Variability of particle number, black carbon, and PM10, PM2.5, and PM1 levels and speciation: Influence of road traffic emissions on urban air quality. Aerosol. Sci. Technol. 2010, 44, 487–499. [Google Scholar] [CrossRef]
  15. Stacey, B.; Harrison, R.M.; Pope, F. Evaluation of ultrafine particle concentrations and size distributions at London Heathrow Airport. Atmos. Environ. 2020, 222, 117148. [Google Scholar] [CrossRef]
  16. Park, G.; Mun, S.; Hong, H.; Chung, T.; Jung, S.; Kim, S.; Seo, S.; Kim, J.; Lee, J.; Kim, K. Characterization of emission factors concerning gasoline, LPG, and diesel vehicles via transient chassis-dynamometer tests. Appl. Sci. 2019, 9, 1573. [Google Scholar] [CrossRef] [Green Version]
  17. Drinovec, L.; Močnik, G.; Zotter, P.; Prévôt, A.; Ruckstuhl, C.; Coz, E.; Rupakheti, M.; Sciare, J.; Müller, T.; Wiedensohler, A. The “dual-spot” Aethalometer: An improved measurement of aerosol black carbon with real-time loading compensation. Atmos. Meas. Tech. 2015, 8, 1965–1979. [Google Scholar] [CrossRef] [Green Version]
  18. Mrozek, P.M.; Watson, T.M. The determination of EPA city fuel economy from hot start results. SAE Trans. 1994, 103, 44–50. [Google Scholar]
  19. Olson, M.R.; Victoria Garcia, M.; Robinson, M.A.; Van Rooy, P.; Dietenberger, M.A.; Bergin, M.; Schauer, J.J. Investigation of black and brown carbon multiple-wavelength-dependent light absorption from biomass and fossil fuel combustion source emissions. J. Geophys. Res. Atmos. 2015, 120, 6682–6697. [Google Scholar] [CrossRef]
  20. Wu, G.-M.; Cong, Z.-Y.; Kang, S.-C.; Kawamura, K.; Fu, P.-Q.; Zhang, Y.-L.; Wan, X.; Gao, S.-P.; Liu, B. Brown carbon in the cryosphere: Current knowledge and perspective. Adv. Clim. Change Res. 2016, 7, 82–89. [Google Scholar] [CrossRef]
  21. Liu, C.; Chung, C.E.; Yin, Y.; Schnaiter, M. The absorption Ångström exponent of black carbon: From numerical aspects. Atmos. Chem. Phys. 2018, 18, 6259–6273. [Google Scholar] [CrossRef] [Green Version]
  22. Fushimi, A.; Kondo, Y.; Kobayashi, S.; Fujitani, Y.; Saitoh, K.; Takami, A.; Tanabe, K. Chemical composition and source of fine and nanoparticles from recent direct injection gasoline passenger cars: Effects of fuel and ambient temperature. Atmos. Environ. 2016, 124, 77–84. [Google Scholar] [CrossRef]
  23. Pieber, S.M.; Kumar, N.K.; Klein, F.; Comte, P.; Bhattu, D.; Dommen, J.; Bruns, E.A.; Kılıç, D.; Haddad, I.E.; Keller, A. Gas-phase composition and secondary organic aerosol formation from standard and particle filter-retrofitted gasoline direct injection vehicles investigated in a batch and flow reactor. Atmos. Chem. Phys. 2018, 18, 9929–9954. [Google Scholar] [CrossRef] [Green Version]
  24. Saliba, G.; Saleh, R.; Zhao, Y.; Presto, A.A.; Lambe, A.T.; Frodin, B.; Sardar, S.; Maldonado, H.; Maddox, C.; May, A.A. Comparison of gasoline direct-injection (GDI) and port fuel injection (PFI) vehicle emissions: Emission certification standards, cold-start, secondary organic aerosol formation potential, and potential climate impacts. Environ. Sci. Technol. 2017, 51, 6542–6552. [Google Scholar] [CrossRef]
  25. Deng, W.; Fang, Z.; Wang, Z.; Zhu, M.; Zhang, Y.; Tang, M.; Song, W.; Lowther, S.; Huang, Z.; Jones, K. Primary emissions and secondary organic aerosol formation from in-use diesel vehicle exhaust: Comparison between idling and cruise mode. Sci. Total Environ. 2020, 699, 134357. [Google Scholar] [CrossRef] [PubMed]
  26. Kim, Y.; Kim, K.; Lee, K. Effect of a 2-stage injection strategy on the combustion and flame characteristics in a PCCI engine. Int. J. Automot. Technol. 2011, 12, 639. [Google Scholar] [CrossRef]
  27. Sun, J.Y.; Wu, C.; Wu, D.; Cheng, C.; Li, M.; Li, L.; Deng, T.; Yu, J.Z.; Li, Y.J.; Zhou, Q. Amplification of black carbon light absorption induced by atmospheric aging: Temporal variation at seasonal and diel scales in urban Guangzhou. Atmos. Chem. Phys. 2020, 20, 2445–2470. [Google Scholar] [CrossRef] [Green Version]
  28. Goetz, J.D.; Giordano, M.R.; Stockwell, C.E.; Christian, T.J.; Maharjan, R.; Adhikari, S.; Bhave, P.V.; Praveen, P.S.; Panday, A.K.; Jayarathne, T. Speciated online PM1 from South Asian combustion sources-Part 1: Fuel-based emission factors and size distributions. Atmos. Chem. Phys. 2018, 18, 14653–14679. [Google Scholar] [CrossRef] [Green Version]
  29. Kirchstetter, T.W.; Novakov, T.; Hobbs, P.V. Evidence that the spectral dependence of light absorption by aerosols is affected by organic carbon. J. Geophys. Res. Atmos. 2004, 109. [Google Scholar] [CrossRef] [Green Version]
  30. Laskin, A.; Laskin, J.; Nizkorodov, S.A. Chemistry of atmospheric brown carbon. Chem. Rev. 2015, 115, 4335–4382. [Google Scholar] [CrossRef] [Green Version]
  31. Blanco-Alegre, C.; Calvo, A.; Alves, C.; Fialho, P.; Nunes, T.; Gomes, J.; Castro, A.; Oduber, F.; Coz, E.; Fraile, R. Aethalometer measurements in a road tunnel: A step forward in the characterization of black carbon emissions from traffic. Sci. Total Environ. 2020, 703, 135483. [Google Scholar] [CrossRef]
  32. Tan, Y.; Wang, H.; Shi, S.; Shen, L.; Zhang, C.; Zhu, B.; Guo, S.; Wu, Z.; Song, Z.; Yin, Y. Annual variations of black carbon over the Yangtze River Delta from 2015 to 2018. J. Environ. Sci. 2020, 96, 72–84. [Google Scholar] [CrossRef]
  33. Healy, R.; Sofowote, U.; Su, Y.; Debosz, J.; Noble, M.; Jeong, C.-H.; Wang, J.; Hilker, N.; Evans, G.; Doerksen, G. Ambient measurements and source apportionment of fossil fuel and biomass burning black carbon in Ontario. Atmos. Environ. 2017, 161, 34–47. [Google Scholar] [CrossRef]
  34. Sandradewi, J.; Prévôt, A.S.; Szidat, S.; Perron, N.; Alfarra, M.R.; Lanz, V.A.; Weingartner, E.; Baltensperger, U. Using aerosol light absorption measurements for the quantitative determination of wood burning and traffic emission contributions to particulate matter. Environ. Sci. Technol. 2008, 42, 3316–3323. [Google Scholar] [CrossRef] [PubMed]
  35. Healy, R.M.; Wang, J.M.; Jeong, C.H.; Lee, A.K.; Willis, M.D.; Jaroudi, E.; Zimmerman, N.; Hilker, N.; Murphy, M.; Eckhardt, S. Light-absorbing properties of ambient black carbon and brown carbon from fossil fuel and biomass burning sources. J. Geophys. Res. Atmos. 2015, 120, 6619–6633. [Google Scholar] [CrossRef] [Green Version]
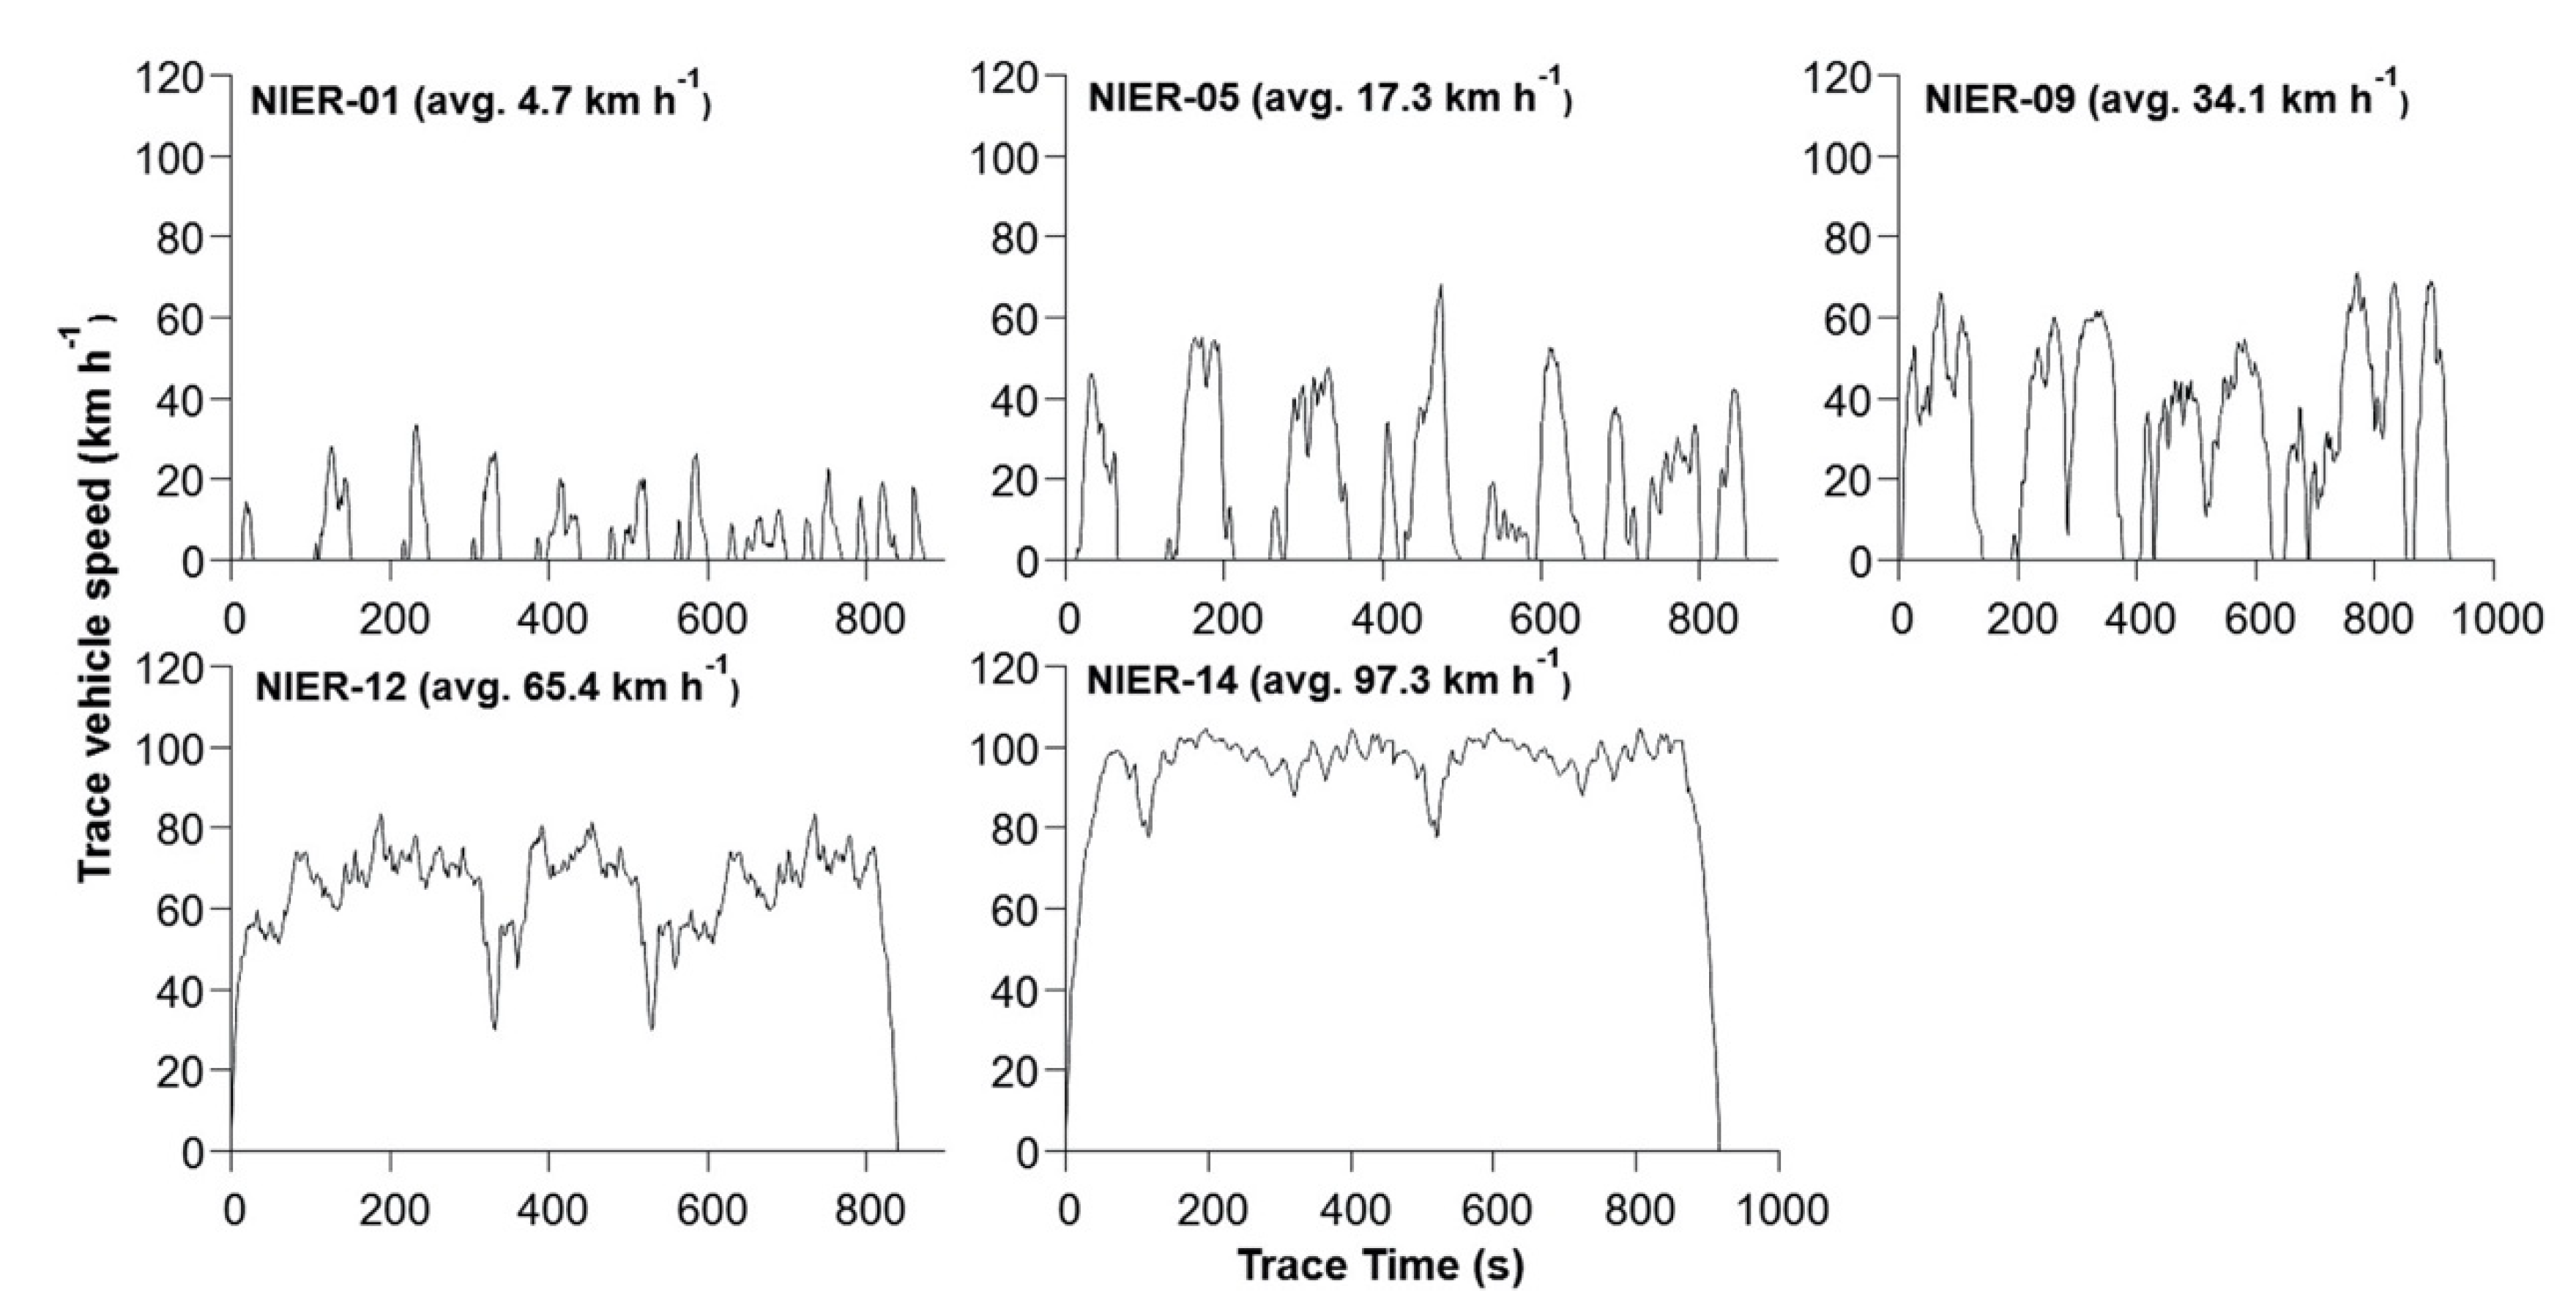
Figure 1. Five different NIER modes used in this study. Each mode represents different average speeds on Korean roads.
Applsci 10 05856 g001
Figure 2. Regulation modes used in measurement. CVS-75 mode used in gasoline, LPG, and diesel vehicles for EURO 3. NEDC mode used in diesel vehicles after EURO 4.
Applsci 10 05856 g002
Figure 3. Sampling system of measuring black carbon. Only one sampling line was opened for one measurement. CVS tunnel sampling for CVS-75 and NEDC modes; Tail-pipe sampling for NIER modes.
Applsci 10 05856 g003
Figure 4. BC emission at five different speeds compared by fuel types (gasoline, LPG, and diesel). Gasoline with GDI engine used vehicle after PM regulation (0.004 g km−1), LPG vehicles, and diesel vehicle in EURO 6.
Applsci 10 05856 g004
Figure 5. BC emission from different fuel types by regulation mode. CVS-75 for gasoline vehicle with GDI engine after PM regulation and LPG vehicle. NEDC for diesel vehicle of EURO 6.
Applsci 10 05856 g005
Figure 6. BC emission from gasoline vehicles according to different types of engines and PM regulations. (a) the result of vehicles tested in 5 different NIER modes, (b) the comparison of BC emission from different fuel types in the CVS-75 mode.
Applsci 10 05856 g006
Figure 7. BC/PM ratio of gasoline vehicles. (a) GDI vehicle before PM regulation. (b) GDI vehicle after PM regulation. (c) MPI vehicle made between 2001–2005. (d) MPI vehicle made between 2009–2012.
Applsci 10 05856 g007
Figure 8. (a) Results of BC emission of EURO 3, 5, and 6 on five different NIER modes. (b) BC Emission from EURO 3 on CVS-75 mode, and EURO 4, 5, and 6 on NEDC mode.
Applsci 10 05856 g008
Figure 9. BC/PM ratio of diesel vehicles from EURO 3 to EURO 6. (a) EURO 3 vehicle with DOC for aftertreatment. (b) EURO 4 vehicle with DOC and DPF. (c) EURO 5 vehicle with DOC and DPF. (d) EURO 6 vehicles with DOC, DPF, and SCR.
Applsci 10 05856 g009
Figure 10. Calculated AAE values in this study. αbb: AAE of biomass burning, αff: AAE of fossil fuel burning for the average results of the NIER modes [33,34,35].
Applsci 10 05856 g010
Table 1. Information on test vehicles measured using chassis dynamometer (Nos. 1–11 used for National Institute of Environmental Research (NIER) mode measurement, and Nos. 12–20 used for emission certification mode for vehicles in Korea).
No.VehicleTypeDisplacement (cc)FuelAfter-TreatmentEngine and RegulationMode
1GbGDI#1Passenger1600GasolineTWCGDI (a)NIER
2GaGDI#2Passenger3000GasolineTWCGDI (b)NIER
3GaGDI#3Passenger1600GasolineTWCGDI (b)NIER
4GMPI#4Passenger2000GasolineTWCMPINIER
5L#1Passenger1600LPGTWCLPINIER
6L#2Passenger3000LPGTWCLPINIER
7L#3Passenger1600LPGTWCLPINIER
8DE3#1SUV1991DieselDOCEURO 3NIER
9DE5#2Passenger1600DieselDOC, DPFEURO 5NIER
10DE6#3Passenger2200DieselDOC, DPF, LNTEURO 6NIER
11DE6#4Passenger1600DieselDOC, DPF, LNTEURO 6NIER
12GbGDI#5Passenger1600GasolineTWCGDI (a)CVS-75
13GaGDI#6Passenger1600GasolineTWCGDI (b)CVS-75
14GMPI#7Passenger2000GasolineTWCMPI (c)CVS-75
15GMPI#8Passenger2000GasolineTWCMPI (d)CVS-75
16L#4Passenger2000LPGTWCLPICVS-75
17DE3#5SUV2000DieselDOCEURO 3CVS-75
18DE4#6SUV2000DieselDOC, DPFEURO 4NEDC
19DE5#7SUV2000DieselDOC, DPFEURO 5NEDC
20DE6#8Van2400DieselDOC, DPF, SCREURO 6NEDC
Gasoline: regular gasoline is fuel with octane number of 91~94. TWC: Three-Way Catalyst, DOC: Diesel Oxidation Catalyst, DPF: Diesel Particulate Filter. LNT: Lean NOX trap, SCR: Selective Catalytic Reduction. GDI: Gasoline Direct Injection, MPI: Multi-Port Injection; LPI: Liquified Petroleum Injection. (a) GDI Vehicle before PM regulation, (b) GDI Vehicle after PM regulation. (c) MPI Vehicle made between 2001 and 2005, (d) MPI Vehicle made between 2009 and 2012.
Table 2. BC emission from different types of fuels; gasoline indicates GDI vehicles applied PM regulation (0.004 g km−1), LPG vehicles and diesel in EURO 6 vehicle at various speeds in the NIER mode.
(Unit: mg km−1)
FuelNIER-01NIER-05NIER-09NIER-12NIER-14
Gasoline0.27 ± 0.140.08 ± 0.0280.037 ± 0.0160.032 ± 0.0160.035 ± 0.0022
LPG0.0054
± 0.003
0.0021
± 0.0023
0.0006
± 0.0002
0.0004
± 0.00001
0.0014
± 0.0001
Diesel0.0007 ± 0.00010.0005
± 0.0003
0.00023
± 0.00007
0.0002
± 0.00008
0.0002
± 0.00005
Table 3. The results of BC emissions in CVS-75 mode for GDI gasoline and LPG vehicles, NEDC mode for diesel vehicle corresponding to emission certification mode in Korea.
(Unit: mg km−1)
ModeFuelPhaseBC
CVS-75GasolinePhase 10.3 ± 0.014
Phase 20.15 ± 0.011
Phase 30.093 ± 0.0004
All Phase0.16 ± 0.003
LPG (a)Phase 10.014
Phase 20.0033
Phase 30.014
All Phase0.0009
NEDCDieselPhase 10.04 ± 0.0005
Phase 20.047 ± 0.001
All Phase0.045 ± 0.001
(a) The result of a one experiment.
Table 4. BC Emission from gasoline vehicles with different types of engines and PM regulations in the NIER mode.
(Unit: mg km−1)
ModeAvg. Speed
(km h−1)
GDI
(Before PM Reg.)
GDI
(After PM Reg.)
MPI
NIER-014.71.03 ± 0.560.2 ± 0.0830.0036 ± 0.0008
NIER-0517.30.53 ± 0.250.081 ± 0.00040.0016 ± 0.0003
NIER-0934.10.27 ± 0.120.038 ± 0.0020.0016 ± 0.0006
NIER-1265.40.2 ± 0.050.045 ± 0.0190.0014 ± 0.0007
NIER-1497.30.64 ± 0.210.053 ± 0.0260.0018 ± 0.0008
Table 5. PM and BC emissions from gasoline vehicles with different types of engines and PM regulations in the CVS-75 mode.
(Unit: mg km−1)
ModeVehiclePhasePMBC
CVS-75GbGDI#5Phase 18.38 ± 1.340.49 ± 0.096
Phase 20.41 ± 0.0010.38 ± 0.01
Phase 37.77 ± 1.830.50 ± 0.023
All Phase4.5 ± 0.0280.44 ± 0.018
GaGDI#6Phase 14.51 ± 1.30.3 ± 0.014
Phase 21.42 ± 0.310.15 ± 0.011
Phase 31.64 ± 0.820.093 ± 0.0004
All Phase2.33 ± 0.720.16 ± 0.003
GMPI#7Phase 12.55 ± 0.490.15 ± 0.079
Phase 20.31 ± 0.100.045 ± 0.006
Phase 30.63 ± 0.330.069 ± 0.02
All Phase0.95 ± 0.270.072 ± 0.025
GMPI#8Phase 10.11 ± 0.0370.14 ± 0.013
Phase 20.034 ± 0.0340.018 ± 0.005
Phase 30.074 ± 0.000020.07 ± 0.012
All Phase0.067 ± 0.0280.058 ± 0.009
Table 6. BC emission of EURO 3, 5, and 6 vehicles during NIER cycle tests.
(Unit: mg km−1)
ModeAvg. Speed
(km h−1)
EURO 3
(DOC)
EURO 5
(DOC, DPF)
EURO 6
(DOC, DPF, LNT)
NIER-014.724.54 ± 5.200.0019 ± 0.0010.0093 ± 0.0044
NIER-0517.311.29 ± 2.270.00053 ± 0.00030.0017 ± 0.0006
NIER-0934.16.21 ± 4.41 0.00062 ± 0.0002 0.00025 ± 0.0003
NIER-1265.411.20 ± 3.380.00064 ± 0.00030.00065 ± 0.0001
NIER-1497.315.16 ± 1.680.0021 ± 0.00080.00017 ± 0.0002
Table 7. Results of PM and BC emission from EURO 3 for CVS-75 mode, and EURO 4, 5, and 6 for NEDC mode.
(Unit: mg km−1)
ModeVehiclePhasePMBC
CVS-75DE3#5 (a)Phase 187.1372.01
Phase 280.1155.017
Phase 377.6183.30
All Phase89.1666.29
NEDCDE4#6 (b)Phase 10.530.13 ± 0.042
Phase 2ND (c)0.09 ± 0.055
All Phase0.170.1 ± 0.034
DE5#7Phase 10.54 ± 0.430.037 ± 0.001
Phase 20.40 ± 0.0310.11 ± 0.006
All Phase0.45 ± 0.180.084 ± 0.001
DE6#8Phase 11.41 ± 0.480.04 ± 0.018
Phase 20.78 ± 0.400.047 ± 0.003
All Phase1.01 ± 0.070.044 ± 0.027
(a) The result of a one experiment. (b) PM was measured twice same as the BC, but the first result was failed due to the weighing the filters. (c) ND = not detected.