Abstract
Renewable energy resources like wind generation are being rapidly integrated into modern power systems. Energy storage systems (ESS) are being viewed as a game-changer for renewable integration due to their ability to absorb the variability and uncertainty arising from the wind generation. While abundant literature is available on system adequacy and operational reliability evaluation, operational adequacy studies considering wind and energy storage have received very little attention, despite their elevated significance. This work presents a novel framework that integrates wind power and energy storage models to a bulk power system model to sequentially evaluate the operational adequacy in the operational mission time. The analytical models are developed using a dynamic system state probability evaluation approach by incorporating a system state probability estimation technique, wind power probability distribution, state enumeration, state transition matrix, and time series analysis in order to quantify the operational adequacy of a bulk power system integrated with wind power and ESS. The loss of load probability (LOLP) is used as the operational adequacy index to quantify the spatio-temporal variation in risk resulting from the generation and load variations, their distribution on the network structure, and the operational strategies of the integrated ESS. The proposed framework is aimed to serve as a guideline for operational planning, thereby simplifying the decision-making process for system operators while considering resources like wind and energy storage facilities. The methodology is applied to a test system to quantify the reliability and economic benefits accrued from different operational strategies of energy storage in response to wind generation and other operational objectives in different system scenarios.
1. Introduction
The growth of renewable resources, like wind and solar, in modern power systems is contributing significantly to limiting carbon emissions, and is still on the rise [1]. The challenge of maintaining the pre-existing economy and reliability balance, however, exists due to the uncertainty in their generation. In this regard, energy storage systems (ESS), like the compressed air energy storage, battery energy storage, and flywheel energy storage, have received increased attention as a supporting resource for renewable integrated power systems [2]. Their ability to absorb the uncertainty of wind generation by charging through the excess generation when not needed and releasing it when necessary helps in significantly limiting the uncertainty. Utilities and system operators have been conventionally carrying out operational planning days ahead, weeks ahead, and months ahead, even prior to the applications of renewables, in power systems with dispatchable nature of generators and predictable load patterns [3,4]. This practice ensured power systems to be well equipped for adequate performance during the real-time operation. In modern systems, the operational planning task has become increasingly challenging as operators are required to utilize growing wind power while maintaining acceptable reliability at affordable costs. The assessment of operational adequacy, therefore, becomes increasingly important for modern and future power systems [5].
A significant amount of work is reported in long-term adequacy evaluation of power systems. Past works, such as References [6,7], present models and methods to quantify the contribution of renewables and ESS to system adequacy. These studies assist long-term investment decisions on generation as well as transmission facilities with renewable resources and ESS. Similarly, studies focused on the reliability of system operation are also noticeable. Reference [8] incorporates wind power into the unit commitment risk evaluation framework by extending the area risk approach, and Reference [9] extends it to include ESS into the unit commitment process to assess the reliability benefits. The utilization of a flywheel energy storage system to lower a power system’s recovery risk is presented in Reference [10]. Operational adequacy studies, on the other hand, lag considerably behind adequacy studies for long-term resource planning and operational reliability studies for real-time system studies. References [11,12] present operational adequacy studies considering wind, photovoltaic, and ESS, focusing on the ramping needs of conventional generation. The consideration of renewables and ESS in operational planning is still evolving in power systems, and policies regarding their participation in electricity markets seem to vary among jurisdictions [13,14]. In this regard, Reference [15] presents an operational reliability study of ESS application as a potential reserve using a modified Pennsylvania New Jersey Maryland (PJM) approach. A Monte Carlo simulation approach is used in Reference [16] to evaluate the spinning reserve requirements for power system operation considering virtual power plants, while Reference [17] also incorporates the transmission network in a similar study. A coordinated operational dispatch scheme for a wind farm with a battery energy storage is presented in Reference [18]. Similarly, a rule-based simulation tool has been developed in Reference [19] to simulate the cooperation of ESS and a wind farm to minimize errors in wind generation forecast. Reference [20] demonstrates a predictive operation scheme for optimal sizing of battery energy storage to enhance the operation of wind and battery systems to meet the commitment. Moreover, reliability standards set under operations planning (TOP-002-4) and reliability coordinator operational analyses and real-time assessments (IRO-008-2) [21] require system operators under the North American Reliability Corporation (NERC) jurisdictions to conduct the next day and current day operational planning. While these studies suggest innovative approaches to wind and energy storage operation, these standards try to maintain uniformity among jurisdictions. In this regard, a standard operational adequacy measurement mechanism or criteria is yet to be established.
This work presents a dynamic system state probability-based operational adequacy assessment framework for a bulk power system considering wind generation and ESS integration. The proposed framework is then used to quantify the operational adequacy and economic benefits for different operational strategies driven by differing objectives and ownership of wind farm and ESS facilities. The reliability benefit is quantified in terms of the improvement in operational adequacy. The economic benefits are evaluated in terms of the reduction in the operating costs. Different operating scenarios and strategies of wind generation and ESS operation have been simulated using the proposed framework on a test system to illustrate the results.
2. System Model
The operational adequacy evaluation of a bulk power system integrated with wind and ESS is carried out at a planning horizon of several hours, days, or weeks, for a selected evaluation period, as illustrated in Figure 1. The evaluation period is split into n number of unit commitment periods (UCP). Each UCP is divided into int number of time intervals of duration dt. Time intervals and UCP are represented by index i and k respectively, during operational adequacy evaluation. The evaluation result helps the system operator to decide the resource requirements in the operational planning horizon.

Figure 1.
Operational planning horizon and adequacy evaluation period.
The proposed framework recognizes that the system operator estimates the capacity available from the wind and ESS and includes them in the unit commitment of a power system with high wind penetration. However, the degree of uncertainty in wind generation is relatively high considering the operational planning horizon. The state of charge (SOC) and thereby the capacity available from the ESS are dependent on the wind and load conditions. The generation model needs to sequentially capture these uncertainties and correlations.
A generation model is developed incorporating the capacity available from the conventional thermal and hydro generation, wind generation, and ESS generation capacity. Similarly, a load model is developed by considering the duration and location of the additional demand on the bulk system required by the charging process of the ESS facilities.
2.1. Wind Generation Model
The initial wind condition and its rising/falling trend depends on the time of day and has a significant impact on the wind speed forecast over a short future time. Past research [22] has shown that this correlation between the known initial wind speed and the future wind speed diminishes as the forecast horizon spans larger than 6–8 h. Then, the conditional probability distribution of the wind speed at the future time will be equal to the distribution obtained from the historical data for that instant of time. Such historical wind speed distribution, is, therefore, obtained and used to model the wind power at the start of an evaluation period that will occur after a planning horizon greater than 6–8 h. This distribution is used to develop conditional wind speed distribution for each interval of the evaluation period in a chronology. The wind speed model developed in this work is based upon the historical wind speed data at a 1 min interval obtained from Reference [23] for a planning horizon of a day ahead, or longer. The speed-power characteristics of a wind turbine generator (WTG), shown in Equation (1), provides the wind power probability distribution for each time interval, from which, the expected wind generation is calculated at each time interval of the evaluation period. The wind generation model is developed in the form of a series of wind power distributions associated with each time interval in the evaluation period. The probability, of a state representing the wind generation capacity between and in the wind power distribution, is given by Equation (2).
where,
2.2. ESS Model Considering Its Operation in Wind-Integrated Systems
In contrast to other power system components, the ESS possesses unique performance characteristics as they exhibit both the supply and demand functions at different times depending on the system requirements, market mechanisms, regulatory policies, and the end objectives of their operation. These characteristics and constraints must be incorporated in an appropriate ESS model. An ESS can be operated under different ownerships, such as the utility, the wind farm owner, or an independent entity. The objectives will, therefore, differ as the owners may operate their ESS facilities to maximize profits from different electricity market components, such as energy arbitrage or reserve markets. Or, the ESS may be operated in coordination with wind power sources to maximize wind utilization, to support wind power commitment, or to provide frequency support. The owner may also want to operate their ESS to mitigate transmission congestion, defer system upgrades, avoid loss of load, mitigate reliability performance penalty, or other time-shifting benefits [24]. The ESS operating modes of charge, discharge, or idle are therefore decided by the ESS operator based on the objectives of operation, as discussed. They can be operated to acquire charge from the grid as needed, or from the wind farms when wind generation is abundant. The operation strategy of the ESS in a power system directly affects its operational adequacy and hence the operational planning.
It is important to recognize the operating strategy of an ESS in the development of its model for operational adequacy evaluation. As noted earlier, the operating strategy will depend on many factors, such as the ownerships and their objectives driven by the market and regulatory policies. It should however be realized that the primary objective of inducting ESS in power systems, in the first place, is to sustain large-scale growth of renewable energy with reliable performance. The regulatory policies will be guided by this objective to exploit wind energy with the proper deployment of ESS. This paper, therefore, recognizes the need to coordinate the operation of ESS with wind power variability in the development of the ESS model.
The ESS model is developed considering a coordinated operation of ESS with wind power and load variation in time chronology within the evaluation period. The accumulated energy in an ESS is generally discharged during the peak load hours. It is also discharged to mitigate loss of load during contingency events, and to support wind power commitment to the system while jointly operating with the wind resources. The maximum energy available from ESS is limited by its storage capacity, SOCmax. Such limitation has been taken into consideration while deploying it for wind support and reserve service. It is assumed that the ESS cannot discharge and will remain idle if its SOC reaches the minimum limit, SOCmin.
The ESS charges from the surplus wind energy or from the grid supply during the off-peak hours. When the ESS charges through the grid, it accumulates charge at its full charging rate, . The charging rate is often reduced and highly variable when the ESS is charged by wind power. The ESS stops charging and remains idle if the charging conditions are not favorable or if the ESS is fully charged until a discharging need arises. An ESS in a charging mode is an additional load to the system. The ESS can, however, stop charging and discharge to support the load in response to a contingency event. Such a response of an ESS virtually enhances the system reserve. Hence, it can be modeled as a dispatchable load during grid charge operation.
The SOC of an ESS at a given interval i, of the UCP, SOCk,i, is continuously changed depending on its mode of operation. It is chronologically updated for each interval dt, using Equations (3) and (4) when respectively charging from the grid and from wind power. The SOC remains unchanged, as shown in Equation (5), in the idle mode. Equation (6) is used to update the SOC following a discharge mode of operation.
The contribution of an ESS to the system operational adequacy and other benefits accrued over a specified evaluation period will also depend on its SOC at the start of the evaluation period. The SOC at a given time is modeled to be normally distributed. Since the operational adequacy evaluation is carried out well in advance of the actual system operation, the operator has the flexibility to adjust the expected magnitude of the SOC at the start of the evaluation period. For example, an ESS may be represented by a normally distributed SOC model with a mean SOC of 50% at the start of the evaluation period.
2.3. Chronologically Integrated Generation and Load Model
The evaluation period is divided into a number of UCPs, and the generating units to be committed during each UCP are decided based upon established reserve requirements, such as the N-1 criterion, the chronological load model, and the estimated wind power. The capacity commitment, from the wind resources in the UCP is considered to be the expected value of the wind power distribution, as given in Equation (7).
The ESS can either be committed as a separate reserve unit or in conjunction with wind power to satisfy its capacity commitment, . The ESS capacity in the UCP, corresponding to state of wind power distribution is given by . In these two modes of operation, is respectively given by Equations (8) and (9).
A committed generation model is then developed for each UCP by integrating the generation models of the committed conventional units, wind power, and the capacity available from the ESS, . The ESS is, however, integrated into the system load model during the hours when it is charged through the grid. This is done by sequentially adding the ESS load consumed based on its charging rate, to the bulk load connected at the same bus. On the other hand, the ESS does not contribute to the system load when it is charged by wind power. Equation (10) gives the wind charging capacity, , available from its capacity state in the UCP to charge the ESS.
It should be noted that the capacity available from the wind, and ESS, to the grid is different during the ESS charge and discharge modes. The integrated power probability table (IPPT) in Table 1 shows the capacity distributions in the charge and discharge modes. The different states of wind power and ESS capacity are obtained by applying Sturge’s rule on wind power and ESS capacity distribution [25].

Table 1.
Integrated power probability table (IPPT).
2.4. Wind Generation and ESS Integrated Bulk Power System Model
The set of system components required to operate in response to the demand will vary throughout the evaluation period. The transition from one operational set of components to the next is sequentially simulated for subsequent UCPs by modeling the start-up of standby units in the priority order, and the shutdown of the committed units that are no longer needed. The operational set of components vary from one UCP to the next but will remain the same for the time intervals within each UCP. The operational set of generators and transmission lines are modeled using two-state Markov processes with state enumeration. The number of committed conventional generators and wind farm, energy storage, and transmission lines are represented by respectively. Therefore, the number of committed units, , and the total number of system states is . The system states with probabilities less than 10−9 have an insignificant impact on the evaluation results. They are, therefore, ignored to reasonably limit the number of states for analysis in this work. Hence, the number of states considered is The complete set of these enumerated system states is given by Equation (11):
Each system state is further split into sub-states, resulting from the different capacity states of number of wind farm and ESS combinations. The IPPT represented in Table 1 can be extended to sub-states by associating each of the wind generation capacity states with the corresponding SOC of the ESS. The ESS capacity, , is obtained from the SOC and the expected duration of service assuming ESS discharges until the end of the unit commitment period.
The system status vector, represents the state of the m enumerated system states. The elements ), and ( of correspond to a wind farm represented by a generator, ESS modeled as a generator, conventional generators, and transmission lines, respectively. These elements can attain the values of 1 or 0 to represent the up and down state of the corresponding system components.
3. Operational Adequacy Evaluation Framework
The proposed framework incorporates the conventional generation, wind generation, and ESS capacity into operational procedures of unit commitment and dispatch. Figure 2 demonstrates the relationship between the wind generation model, ESS model, and the load model within the unit commitment decision process to formulate an evaluation framework consisting of state enumeration, dynamic system state probability estimation, and optimal power flow methods to collectively assess the operational adequacy of the bulk power system.
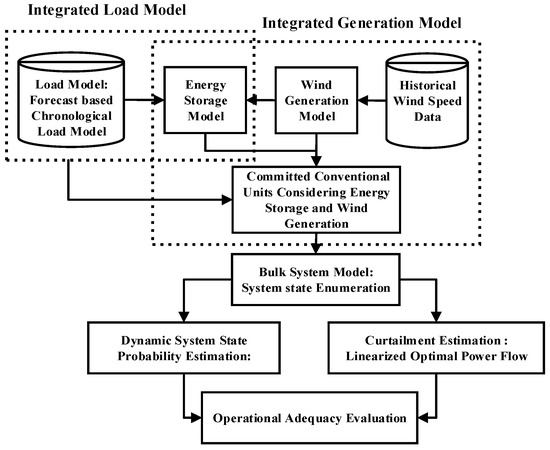
Figure 2.
Overview of the proposed operational adequacy evaluation framework.
The framework takes into account the continuous changes in the committed generating units in response to the anticipated load from one UCP to the next. It also recognizes the dynamic behavior of the wind generation, the ESS SOC, and the load at each node of the grid network at each time interval within each UCP. Such changes are reflected on the system risk, represented by an operational adequacy index that is continuously evaluated at each time interval. The evaluation takes into account the committed generating units (Cu) and their capacity, the wind generation at the time, the integrated load (IL) that includes the ESS charging load, and the ESS capacity during charging and discharging modes obtained from the IPPT. The variation in these parameters and the associated risk curves within the evaluation period are presented in Figure 3. The unit commitment decisions for each UCP within the evaluation period are made considering the integrated generation and load models discussed in Section 2.3, followed by the development of the state enumeration-based bulk power system model described in Section 2.4.
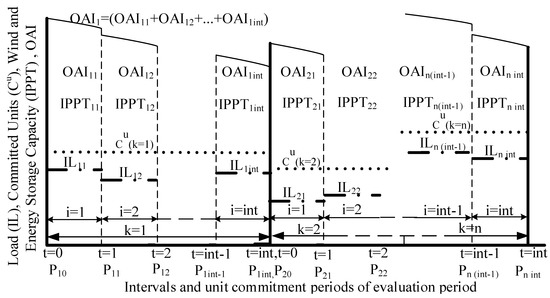
Figure 3.
Risk area curves of a wind and energy storage system (ESS) integrated bulk power system within the evaluation period.
The operational adequacy index evaluation process requires the estimation of the system state probability and the load curtailment associated with each system state. The system state probability is a dynamic parameter and is estimated using the Dynamic System State Probability Estimation Approach (DSSPE) described in Section 3.1. A linearized optimal power flow (OPF) is used to estimate the load curtailments associated with each system state.
3.1. Dynamic System State Probability Evaluation Approach
The system state probability is a dynamic parameter that depends on the exposure time of the operating system in consideration and the stochastic transitions between system states within the evaluation period. The transition probabilities are assessed using the component outage replacement rate, as such transitions are the results of component failures. The repair process is ignored as it lasts significantly longer than the unit commitment period. Equation (12) is used to identify the different states between which transition is possible. For instance, if yth bit of state transition vector, , is 1, it represents the possibility of state transition from the sth system state to the vth system state due to the failure of component represented by the yth bit of state transition vector. The inter-state transition probability () and state transition matrix (), as shown in Equations (13) and (14), are used to update the dynamic system state probabilities.
The system state probability vector of the time interval of the unit commitment period, gives the corresponding dynamic probabilities of each system state of to represent the changing system status along with the time intervals in the evaluation period. All the system components, wind generators, ESS conventional generators, and transmission lines are assumed to be operating at the start of the evaluation period. Hence, is the initial system state of the evaluation period and the initial system state probability vector () of the evaluation period, and the first UCP is therefore given by Equation (15).
System state probability vector, is updated at the end of each interval within the same UCP. However, and are only updated at the start of the new UCP. The system state probability vector of the preceding interval, is used as an initial condition to evaluate the system state probability vector of the succeeding interval, as shown in Equation (16).
3.2. Optimal Power Flow
The adequacy of a system state in satisfying the load of different load points is assessed through a linearized optimal power flow (OPF) developed based on References [26,27], which sufficiently serves the purpose of this study.
The objective function given by Equation (17) is formulated to minimize the operating costs associated with conventional generators, wind generators, and the ESS system and curtailment costs associated with load points for every time interval.
Subject to:
The constraints in Equations (18) and (10) represent the transmission line flows and bus injections, respectively. The constraint in Equation (20) represents the wind generator, ESS discharge capacity, conventional generator and transmission line capacity limits, bus voltage angle limits, and curtailment limits. Finally, linearized OPF is run for each substates within possible system states at each interval within each UCPs of the evaluation period and gives the solution vector as shown in Equation (21):
Aggregated loss of load probability (LOLP) and/or aggregated units per million (UPM) can be used as the operational adequacy index (OAI). LOLP has been considered as OAI in this work due to its preference in adequacy studies. The LOLP is evaluated by associating the curtailment value at each load point, given by the linearized optimal power flow with a probability value, given by the dynamic system state probability evaluation approach. The LOLP is first calculated for each interval. These values are aggregated to obtain LOLP for a unit commitment period. These are again aggregated to yield LOLP for an entire evaluation period. Once such evaluations are done considering all of the states of historical wind power distribution at the start of the evaluation period, aggregated LOLP for the lth load point can be calculated as shown in Equation (22), and for the overall system, as shown in Equation (23), respectively.
4. Application of the Proposed Operational Adequacy Framework
The Roy Billinton Test System (RBTS) [28] is modified as shown in Figure 4 and used to demonstrate the application of the proposed evaluation framework. The generating units are numbered based on their priority loading order. The capacity rating of each generating unit and transmission line is shown in Figure 4, and Table 2 shows their failure rates and operating costs of generating units. The RBTS load model is only available at an hourly interval. The operational adequacy study requires data on the availability of resources and system conditions at the time to carry out predictive assessment for the next day or week. The conditions, however, change continuously in sequence of time. The proposed method is illustrated using wind speed data and load data for a typical day in January to predict the operational adequacy for the next day. The load data simultaneously collected on 15 January at 15 min intervals by the Alberta Electric System Operator (AESO) [29], the European Network of Transmission System Operators for Electricity (ENTSO-E) [30] (Luxembourg and Germany), and the Independent System Operator (ISO) New England [31], and wind speed data collected by Sotavento Experimental Wind Farm [23], were used in this study to assess the next day operational adequacy of the test system. Operational adequacy studies should, however, be carried out continuously with data updated for the corresponding time stamps in the planning horizon. Figure 5 shows the chronological load profile used in the study for the different load busses and Figure 6 and Figure 7 show historical wind speed profile and wind power probability distribution for two wind regimes obtained from the historical wind speed data. The first study uses the wind profile from Regime 1 to illustrate the negative impact of wind generation on the operating adequacy. The two wind regimes are used in a subsequent study to compare the impacts of different wind profiles.
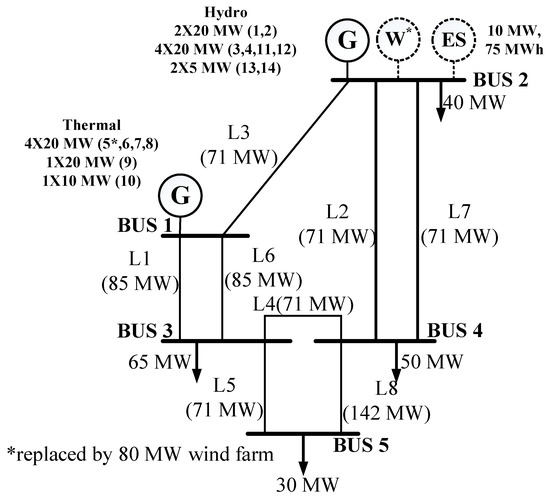
Figure 4.
Test system.
Table 2.
Generation and transmission line data.
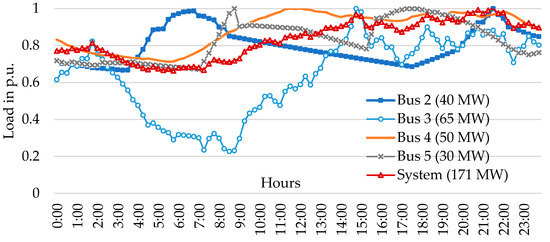
Figure 5.
Load data used for different load points in per unit.
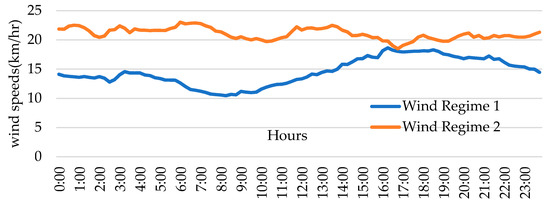
Figure 6.
Wind regime variation.
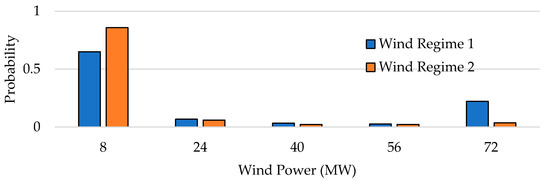
Figure 7.
Wind power distribution associated with different wind regimes at the start of the evaluation period.
A study was carried out to analyze the impact of wind integration and energy storage on the operational adequacy by applying the proposed method to three system configurations. Configuration 1 is the conventional system shown in Figure 4 without wind power and energy storage. Unit 5 at Bus 1 is replaced by an 80 MW wind farm at Bus 2 in Configuration 2. A 75 MWh ESS with a charge/discharge rate of 10 MW is added at Bus 2 of Configuration 2 to obtain Configuration 3. Figure 6 shows the wind speed profiles for 24 h for two wind regimes based upon historical wind speed data obtained from Reference [23]. Figure 7 shows the two wind power distributions in the first hour of that period. The wind data from Regime 1 in Figure 6 is used in this study.
The operational adequacy of the test system was evaluated for a period of 24 h at a day-ahead planning horizon. The evaluation period was divided into 12 unit commitment periods (UCP) assuming lead times of 2 h for assistance from the ready-to-start standby units. The unit commitment is based on the N-1 criterion [32]. The unit commitment requires assigning a capacity value to the wind power in Configurations 2 and 3. The expected value of the wind power in the UCP is used for this purpose. In Configuration 3, the ESS is used to support the commitment of wind power.
4.1. Operational Adequacy Assessment of Wind and Energy Storage Integrated Systems
The operating adequacy of the three system configurations measured using the load-point and system LOLP indices are shown in Figure 8. Since the risks associated with the N-1 criterion have been widely accepted in conventional system operation, the values obtained for Configuration 1 can be used as acceptable benchmarks. The system LOLP of 0.00133 shown by the red horizontal line in Figure 8 is, therefore, used as a benchmark in this study to compare against other system configurations. It can be seen that the risk is not uniform among load points for a system configuration. The LOLP at Bus 5 is higher than at other buses. This can be attributed to its higher dependence upon the transmission lines compared to the rest of the load points that are located close to generating sources.
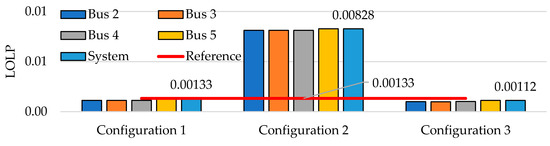
Figure 8.
Impacts of wind and energy storage on operational adequacy.
Figure 8 shows a large increase in operating adequacy risks in Configuration 2 due to the replacement of a conventional unit by a wind farm. The system LOLP of 0.00828 is more than 5 times the acceptable risk of the benchmark value. The integration of wind resources is expected to bring environmental and economic benefits by offsetting the conventional fuel-based generation, thereby reducing the carbon emissions and operational costs. However, it needs to be ensured that the system risk does not exceed the acceptable limits. The operating adequacy risk can, however, be reduced by either raising the operating reserve requirement or by limiting the wind generation in the unit commitment. Both solutions, however, contradict the prime objectives of integrating wind resources into the power system. An alternate and promising solution is to use ESS to absolve the uncertainty and reduce the risks associated with wind generation.
Figure 8 shows that the operating adequacy risks are significantly lowered with the use of ESS in Configuration 3. The system LOLP of 0.00120 is about 10% lower than the benchmark value of 0.00133. The improvement in operational adequacy results from the energy storage support the wind generation as well as its ability to mitigate the loss of load events arising from the generating unit failures. This demonstrates the value of energy storage for wind-integrated power systems as they can serve power systems to achieve the objective of reliable, affordable, and clean power delivery to customers. It must be noted that the contribution of ESS depends on its operating strategy, and they could be subjected to different operating strategies depending on the objectives of their utilization.
4.2. Impact of ESS Operating Strategies on Operational Adequacy
An ESS can be owned by the utility, the wind farm owner, or by an independent entity. The utility-owned ESS will likely be used to reduce the operating costs after maintaining the reliability of the system and meeting environmental compliance. The wind farm operator will coordinate the operation of its ESS with the wind generation to meet its commitments and maximize energy sales. On the other hand, an independently owned ESS will operate to maximize revenues from available components of an electricity market. The operating strategies will, therefore, vary depending on the ownerships and objectives, and as a result, will have different impacts on the operating adequacy of the power system.
A study was therefore carried out to demonstrate the impact of different ESS operating strategies on the operational adequacy of a power system integrated with wind power and energy storage. The test system shown in Figure 4 and described in Configuration 3 of the previous study is used in this study. Two ESS operating strategies, termed as wind-coordinated strategy and grid-supported strategy, are considered for comparative studies. It should be noted that these two are representative cases of several possible ESS operational strategies.
Wind-coordinated (WC): This operational strategy considers coordination between a wind farm and an ESS. These can be owned by the same owner or different owners in a coordination agreement. ESS is coordinated with a wind farm to be charged when available wind generation exceeds the commitment.
Grid-supported (GS): This operational strategy considers coordination between wind farm, ESS, and utility or system operator which controls grid power access. ESS coordination with wind and grid power support for ESS is simple if the system operator owns both the wind farm and ESS. If they are separately owned, it requires an additional agreement between themselves and the system operator. ESS uses the grid power, usually, during off-peak hours and coordinates with wind farms during the rest of the hours for charging.
The evaluation period is divided into three different periods, as shown in Table 3, based upon the net load (forecasted load—expected wind generation) of an hour, to simulate the operating strategies of ESS. Figure 9 demonstrates the coordination strategy for the operation of a wind generation farm and an ESS system.
Table 3.
Different periods of operational strategies.
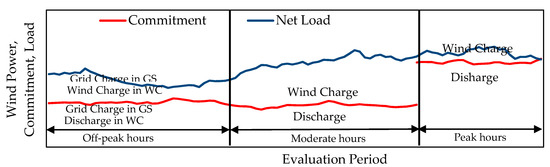
Figure 9.
Wind generation and ESS coordination in grid-supported (GS) and wind-coordinated (WC) ESS operational strategies.
Figure 10a shows that the grid-supported ESS operational strategy results in better operational adequacy of the system compared to the wind-coordinated ESS operational strategy. With this operational strategy, the resultant operational adequacy of LOLP = 0.00112 is better than the benchmark value by almost 15% when Regime 1 is considered. This is possible as ESS can accumulate enough charge irrespective of the initial state of charge of the energy storage with this strategy. Besides, the number of hours when ESS needs to discharge are effectively reduced in this strategy. This allows ESS to perform better in supporting the wind generation and mitigate the loss of load events. However, it needs to be acknowledged that the grid-supported strategy uses a higher number of conventional generators, thereby resulting in higher emissions and operational costs compared to the wind-coordinated strategy, as illustrated in Figure 10b. Moreover, the possibility of variation in wind regime for different days or evaluation period is presented through consideration of Regime 2 beside Regime 1. Regime 2 has a higher average wind speed and a different wind power distribution. Figure 10b shows the expected operating costs of the operational planning with both wind regimes calculated based upon the operating costs data in Table 2.
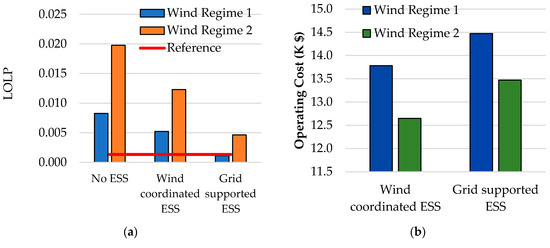
Figure 10.
Impact of operational strategy and wind regimes on (a) operational adequacy and (b) operating cost.
It is evident that Regime 2 has higher average wind speed and thereby, the wind generation offsets more conventional generation. This results in larger environmental benefits and more economic operation, as observed from the results. Operating costs with Regime 2 are almost 7.97% and 6.89% lower than that with Regime 1 for wind-coordinated and grid-supported strategies, respectively. Also, with this regime, the system risk was higher with the wind-coordinated strategy compared to the grid-supported strategy. However, it is noticeable that the grid-supported strategy fails to achieve an acceptable operational adequacy with this wind regime. The system should, however, comply with the operational adequacy reference.
Figure 11 shows the operational adequacy evaluated by considering different percentages of expected wind generation for the unit commitment decisions. It is seen that acceptable operational adequacy is achieved with 70% of expected wind generation and 60% of wind generation in the grid-supported and wind-coordinated ESS operational strategies, respectively. This kind of approach helps system operators to preplan the optimal wind generation to be included in operational planning to limit system risk within an acceptable level. This also allows the system operator to assign an operating capacity value to the wind power which can be helpful for system operators to quantify the contribution of wind farms participating in the electricity market. Despite the lower operating capacity value achievable from the wind-coordinated operational strategy, it might be able to offset more conventional generation than the grid-supported operational strategy, resulting in higher environmental and economic benefits.
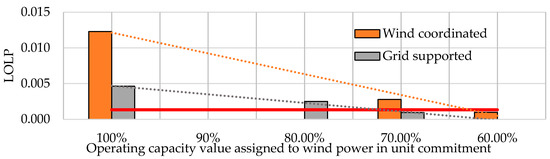
Figure 11.
Operating capacity value of wind power with different ESS operational strategies.
The presented mitigation measure to maintain operational adequacy restricts the operating capacity value, which is not desirable for wind farms and ESS from their sustainability perspective. A possible solution that enables wind farms and ESS to maintain a higher operating capacity value has been presented. Figure 12 presents the operational adequacy evaluated for such an alternative operational planning.
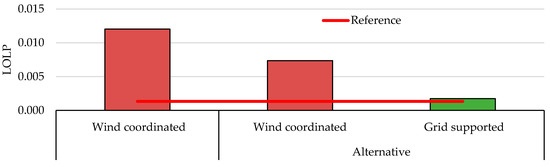
Figure 12.
Alternative operational adequacy planning of wind and ESS integrated power system.
This option envisions the possibility of support from mobile energy storage like battery banks, which can be a separate resource on its own. A 10 MW, 75 MWh battery energy storage (BES) is assumed to be added by the wind farm and energy storage combination. With BES, the operational adequacy improves noticeably, but still violates the adequacy reference. Thus, another option is further explored. The grid-supported operational strategy is considered to ensure enough charge to be available during peak hours. With this option, the operational adequacy improves significantly, bringing it closer to the reference value. Thus, this alternative also resolves the challenge of the limitation in the investment and thereby the size of wind farm-owned ESS. The possibility of assistance from mobile ESS during a favorable wind regime presents the possibility of maintaining a higher operating capacity value and accruing higher revenue from electricity markets. This can be instrumental in the sustainability of wind farms. Besides, conventional generators required are also reduced, which brings greater environmental benefits at lower operating costs. This makes a strong market case for mobile energy storage or generating unit resources in the modern power systems, which can meet the temporary needs of market participants scattered in the network. Thus, system operators can assess operational adequacy of the expected system operation considering the offers made by market participants, like wind and energy storage, before finalizing the operational planning. If the proposed offer forces the system to violate the operational adequacy requirement, as illustrated in the previous example, alternative solutions can be demanded and planned before the actual operation time instead of reducing their operating capacity value. This illustrates how prudent policies and regulations can promote power system reliability, environmental benefits, and economics, eventually contributing to sustainability.
5. Conclusions
Operational planning of electric power systems is routinely carried out to ensure the availability of adequate resources. Growing uncertainties brought about by rapidly growing penetration of intermittent renewable generation is causing challenges to operation planning. ESS are being introduced to mitigate the adverse impacts of variability and uncertainty in power generation. The advent of these new resources in power systems requires new approaches and methods to evaluate operational adequacy in operational planning. This paper proposed a new framework for operational adequacy evaluation and illustrated its application on a test system.
The presented study showed that the operational adequacy risks are substantially increased when a conventional generating unit is replaced by wind resources. The presented example showed that the operational adequacy measured in LOLP is increased by over a factor of 6 when a 20 MW conventional unit is replaced by 80 MW of wind power in the test system. The paper also demonstrated how a benchmark criterion selected based on past acceptable performance can be used to determine the need to take preparatory actions to ensure acceptable performance during system operation. The example study showed that the utilization of ESS can reduce the LOLP below 10% of the specified criterion. The evaluation results obtained from the studies quantitatively show that the system operational adequacy risk varies substantially with different operating strategies that are dictated by the ownership of the ESS and the market objectives. Among the two operating strategies illustrated in the presented study, the grid-supported ESS operation resulted in an operational adequacy risk that was about 5 times lower than the wind-coordinated strategy without grid support. The paper illustrated how comparative analyses of different operating strategies of ESS facilities can be conducted to derive a solution to maintain acceptable operational adequacy. The paper illustrated examples of two remedial measures in the form of incorporating different percentages of expected wind generation capacity in the unit commitment process and utilizing additional resources like mobile ESS to mitigate the operational adequacy risk to an acceptable level. It should be noted that these studies were carried out in advance at a certain planning horizon, and therefore, provide opportunities to make alternate resource management plans and take preventive actions before the actual operation. Thus, the proposed operational adequacy assessment framework is expected to assist system operators and policymakers to plan and facilitate the operation of system resources, including renewables and ESS facilities, to operate within acceptable risks.
Author Contributions
T.K.S. developed the methodology, analytic tool and performed the evaluations; R.K. supervised the research work. All authors have read and agreed to the published version of the manuscript.
Funding
This research was jointly funded by the University of Saskatchewan and the Natural Science and Engineering Research Council of Canada under the Energy Storage Technology Network Grant.
Conflicts of Interest
The authors declare no conflict of interest.
Nomenclature
| Index, number, and duration of time interval | |
| Index and number of system states | |
| Index and number of unit commitment periods | |
| Wind turbine generator parameters | |
| Cut-in and cut-out wind speeds (m/s) | |
| Rated and observed wind speeds (m/s) | |
| Index and number of states of wind power distribution and integrated power probability table (IPPT) | |
| Wind generation capacity of state (MW) of IPPT in unit commitment period | |
| Wind power probability distribution function | |
| Probability of state of IPPT in unit commitment period and wind power distribution at the start of the evaluation period | |
| Probability of state of wind power distribution at the start of the evaluation period | |
| Wind capacity (MW) considered for unit commitment period | |
| Expected wind generation (MW) in the time interval of UCP | |
| Operating reserve (MW) available in the time interval of UCP | |
| Energy storage charging power (MW) and efficiency | |
| Energy storage discharging power (MW) and efficiency | |
| Maximum energy storage capacity of energy storage (MWh) | |
| Minimum energy storage capacity of energy storage (MWh) | |
| State of charge of energy storage (MWh) at a given interval i, of UCP | |
| Energy storage capacity in UCP (MW) corresponding to state of wind power distribution | |
| Wind charging capacity (MW) available from its capacity state in UCP to charge the energy storage | |
| Failure rate (failures/year) | |
| System state vector of system state | |
| Set of system state vectors in unit commitment period | |
| Index and number of sub-states within each system state | |
| Index of generators | |
| State transition vector and transition probability from system state to system state | |
| State transition matrix of unit commitment period | |
| System state probability vector of time interval of unit commitment period | |
| System state probability of system state in | |
| Number of available conventional and wind generators | |
| Number of available energy storage | |
| Number of transmission lines |
References
- Gielen, D.; Boshell, F.; Saygin, D.; Bazilian, M.D.; Wagner, N.; Gorini, R. The role of renewable energy in the global energy transformation. Energy Strategy Rev. 2019, 24, 38–50. [Google Scholar] [CrossRef]
- Barton, J.; Infield, D. Energy storage and its use with intermittent renewable energy. IEEE Trans. Energy Convers. 2004, 19, 441–448. [Google Scholar] [CrossRef]
- Pourbeik, P.; Hiskens, I.A.; Gou, B.; Huang, J.; Bouer, R.; Illian, F.; Pitto, A. Review of the Current Status of Tools and Techniques for Risk-Based and Probabilistic Planning in Power Systems; CIGRE Technical Brochure; CIGRE: Paris, France, 2010; p. C4601. [Google Scholar]
- Chattopadhyay, D. Operational Planning of Power System: An Integrated Approach. Energy Sources 1994, 16, 59–73. [Google Scholar] [CrossRef]
- Negnevitsky, M.; Nguyen, D.H.; Piekutowski, M. Risk Assessment for Power System Operation Planning With High Wind Power Penetration. IEEE Trans. Power Syst. 2014, 30, 1359–1368. [Google Scholar] [CrossRef]
- Ummels, B.; Kling, W.; Pelgrum, E. Integration of large-scale wind power and use of energy storage in the Netherlands’ electricity supply. IET Renew. Power Gener. 2008, 2, 34–46. [Google Scholar] [CrossRef]
- Bhattarai, S.; Karki, R.; Piya, P. Reliability modelling of compressed air energy storage for adequacy assessment of wind integrated power system. IET Gener. Transm. Distrib. 2019, 13, 4443–4450. [Google Scholar] [CrossRef]
- Thapa, S.; Karki, R.; Billinton, R. Utilization of the Area Risk Concept for Operational Reliability Evaluation of a Wind-Integrated Power System. IEEE Trans. Power Syst. 2013, 28, 4771–4779. [Google Scholar] [CrossRef]
- Thapa, S.; Karki, R. Reliability benefit of energy storage in wind integrated power system operation. IET Gener. Transm. Distrib. 2016, 10, 807–814. [Google Scholar] [CrossRef]
- Adhikari, S.; Karki, R.; Piya, P. Recovery Risk Mitigation of Wind Integrated Bulk Power System with Flywheel Energy Storage. IEEE Trans. Power Syst. 2019, 34, 3484–3493. [Google Scholar] [CrossRef]
- Wang, P.; Gao, Z.; Bertling, L. Operational Adequacy Studies of Power Systems with Wind Farms and Energy Storages. IEEE Trans. Power Syst. 2012, 27, 2377–2384. [Google Scholar] [CrossRef]
- Koh, L.H. Operational adequacy studies of a PV-based & energy storage stand-alone microgrid. IEEE Trans. Power Syst. 2015, 30, 2. [Google Scholar] [CrossRef]
- Winfield, M.; Shokrzadeh, S.; Jones, A. Energy policy regime change and advanced energy storage: A comparative analysis. Energy Policy 2018, 115, 572–583. [Google Scholar] [CrossRef]
- Cox, S.; Tegen, S.; Baring-Gould, I.; Oteri, F.A.; Esterly, S.; Forsyth, T.; Baranowski, R. Policies to Support Wind Power Deployment: Key Considerations and Good Practices. In Policies to Support Wind Power Deployment: Key Considerations and Good Practices; National Renewable Energy Lab.: Golden, CO, USA, 2015. [Google Scholar]
- Parvini, Z.; Abbaspour, A.; Fotuhi-Firuzabad, M.; Moeini-Aghtaie, M. Operational Reliability Studies of Power Systems in the Presence of Energy Storage Systems. IEEE Trans. Power Syst. 2017, 33, 3691–3700. [Google Scholar] [CrossRef]
- Wang, Y. An Adaptive Importance Sampling Method for Spinning Reserve Risk Evaluation of Generating Systems Incorporating Virtual Power Plants. IEEE Trans. Power Syst. 2018, 33, 5082–5091. [Google Scholar] [CrossRef]
- Da Silva, A.M.L.; Castro, J.F.D.C.; Billinton, R. Probabilistic Assessment of Spinning Reserve via Cross-Entropy Method Considering Renewable Sources and Transmission Restrictions. IEEE Trans. Power Syst. 2017, 33, 4574–4582. [Google Scholar] [CrossRef]
- Luo, F.; Meng, K.; Dong, Z.Y.; Zheng, Y.; Chen, Y.; Wong, K.P. Coordinated Operational Planning for Wind Farm With Battery Energy Storage System. IEEE Trans. Sustain. Energy 2015, 6, 253–262. [Google Scholar] [CrossRef]
- Hartmann, B.; Dan, A. Cooperation of a Grid-Connected Wind Farm and an Energy Storage Unit—Demonstration of a Simulation Tool. IEEE Trans. Sustain. Energy 2011, 3, 49–56. [Google Scholar] [CrossRef]
- Moghaddam, I.N.; Chowdhury, B.H.; Mohajeryami, S. Predictive Operation and Optimal Sizing of Battery Energy Storage With High Wind Energy Penetration. IEEE Trans. Ind. Electron. 2017, 65, 6686–6695. [Google Scholar] [CrossRef]
- North American Electric Reliability Corporation. Reliability Standards for the Bulk Electric Systems of North America; NERC: Princeton, NJ, USA, 2019. [Google Scholar]
- Yousuf, M.U.; Al-Bahadly, I.; Avci, E. Current Perspective on the Accuracy of Deterministic Wind Speed and Power Forecasting. IEEE Access 2019, 7, 159547–159564. [Google Scholar] [CrossRef]
- Parque Eoloca Experimental: Sotavento, Real Time Data. Available online: http://www.sotaventogalicia.com/en/real-time-data/historical (accessed on 7 September 2018).
- Gautam, P.; Karki, R.; Piya, P. Probabilistic Modeling of Energy Storage to Quantify Market Constrained Reliability Value to Active Distribution Systems. IEEE Trans. Sustain. Energy 2020, 11, 1043–1053. [Google Scholar] [CrossRef]
- Sturges, H.A. The Choice of a Class Interval. J. Am. Stat. Assoc. 1926, 21, 65–66. [Google Scholar] [CrossRef]
- Li, F.; Bo, R. DCOPF-Based LMP Simulation: Algorithm, Comparison with ACOPF, and Sensitivity. IEEE Trans. Power Syst. 2007, 22, 1475–1485. [Google Scholar] [CrossRef]
- Yuan, H.; Li, F.; Wei, Y.; Zhu, J. Novel Linearized Power Flow and Linearized OPF Models for Active Distribution Networks with Application in Distribution LMP. IEEE Trans. Smart Grid 2018, 9, 438–448. [Google Scholar] [CrossRef]
- Billinton, R.; Jonnavithula, S. A test system for teaching overall power system reliability assessment. IEEE Trans. Power Syst. 1996, 11, 1670–1676. [Google Scholar] [CrossRef]
- AESO. 15 Minute System Load Metered Volumes. Available online: https://www.aeso.ca/market/market-and-systemreporting/data-requests/15-minute-system-load-metered-volumes/ (accessed on 19 October 2019).
- ENTSO-E. Consumption Data. Available online: https://docstore.entsoe.eu/data/dataportal/consumption/Pages/default.aspx (accessed on 19 October 2019).
- ISO New England. Five-minute System Demand. Available online: https://www.iso-ne.com/isoexpress/web/reports/load-and-demand (accessed on 18 October 2019).
- WECC Standard BAL-002-WECC-2a-Contingency Reserve. Available online: www.nerc.com/pa/Stand/Reliability%20Standards/BAL-002-WECC-2a.pdf (accessed on 20 September 2019).


© 2020 by the authors. Licensee MDPI, Basel, Switzerland. This article is an open access article distributed under the terms and conditions of the Creative Commons Attribution (CC BY) license (http://creativecommons.org/licenses/by/4.0/).