Abstract
Induction motors are mainstay power components in industrial equipment. Fault diagnosis technology of induction motors can detect the incipient fault and avoid the unplanned shutdown. The broken rotor bar is a significant fault mode of induction motors. Classical fault diagnosis methods always have complex principles and high computational costs, which leads to difficulties in understanding and calculation. In this paper, a method of broken rotor bar diagnosis based on the sum-of-squares of current signals is proposed. This method can eliminate the fundamental frequency and extract the signature frequency components by calculating the sum-of-squares of three-phase current signals. The signature frequency components are more apparent in the spectrum of the sum-of-squares of current signals. The effectiveness of the proposed method under different load levels and rotation motor speeds has been validated by two experiments. Compared with the classical diagnostic methods, the proposed method has better effectiveness and lower computation cost.
1. Introduction
Induction motors (IMs), which provide most of the power for the factory, are significant power components of industrial production equipment [1,2]. The health condition of IMs not only affects the quality of products but also causes serious security threats to operators and equipment [3,4,5]. Broken rotor bar (BRB) is a typical fault mode of IMs. Its fault proportion is only lower than that of bearing faults and winding faults, accounting for 7% of the total fault types [6]. The fault diagnosis of BRBs plays a vital role in improving the reliability of induction motors.
Broken rotor bars will cause periodic fluctuations in motor output torque, and the periodic fluctuations not only make the motor periodically vibrate but also change the motor current and magnetic field periodically. These results make it possible to diagnose the BRBs of IMs through different kinds of signals. The diagnosis methods based on vibration signals are popular in the fault diagnosis of rotating machinery, and they are also applied in the fault diagnosis of IMs. Wang et al. [7] used cyclic modulation spectral analysis of the vibration signal to diagnose the broken rotor bars of the IMs. Zhen et al. [8] use improved cyclic modulation spectral analysis based on the continuous wavelet transform to process the vibration signal for BRB detection of IMs. Nascimento et al. [9] extract the higher-order statistics of vibration signals for the diagnosis approach based on machine learning. Sabbaghian et al. [10] improve the Hilbert–Huang transform for vibration signal processing to detect BRBs of IMs. Although the BRBs have an impact on the vibration signals of IMs, they have a greater impact on the magnetic and electrical signals of IMs [11]. Panagiotou et al. [12] use flux signals to detect BRBs of IMs. Soleimani et al. [13] diagnose BRBs of IMs through air-gap rotational magnetic field signals. Although these methods have good effects, these kinds of detection methods are usually invasive. On the contrary, the current signals are widely used because of their convenient measurement and obvious fault signature. In fact, the number of studies using current signals for fault diagnosis of IMs is the largest.
Motor current signature analysis (MCSA) methods are widely used in the fault diagnosis of IMs [14,15,16]. BRBs will stimulate the signature frequency components in the current signals. MCSA methods detect BRBs by extracting the signature frequency components of current signals [6]. The methods based on Fast Fourier Transform (FFT) of MCSA try to find the signature frequency components directly in the spectrum of the single-phase current signal [17,18]. FFT-based methods are simple, but the signature frequency components often cannot be found due to the spectrum leakage of the fundamental frequency and the influence of the noise [17,19].
To solve this problem, many popular MCSA methods extract the signature frequency components by removing the fundamental frequency component of the current signal. The Hilbert transform amplitude demodulation (HT) [20,21,22], Park’ s vector modulus [23,24,25], d-q transform demodulation [1,26], and Teager energy operator (TEO) [27,28] are the most popular among these MCSA methods. HT can obtain the demodulation signal by extracting the envelope of the single-phase current signal using the Hilbert transform. The envelope reflects the torque ripple of the induction motor and is related to the BRBs. Park’s vector and d-q transform are essentially based on coordinate transformation. After coordinate transforming, new current vector signals are obtained which contain fault information and are less influenced by fundamental frequency and noise. The TEO method extracts the energy operator of the single-phase current signal which is modulated by BRBs. However, they all have complicated principles and high calculation costs, which are not conducive to understanding and online diagnosis of IMs.
In order to solve this problem, an MCSA method based on the sum-of-squares of three-phase current signals is proposed in this paper for IMs’ BRB detection, called the SS method. The SS method only needs to calculate the sum-of-squares of the three-phase current signals, which contains the signature frequency components and is less influenced by fundamental frequency and noise. Its computation cost is greatly reduced compared with popular MCSA methods.
The remainder of this paper is organized in the following way. Section 2 proposes an improved signal model of motor current signals to explain the modulation effect of BRBs on the current signal. Section 3 introduces the theoretical basis of the SS method and the process using the SS method to detect BRBs. Section 4 validates the effectiveness of the SS method by experimental data, and the computation cost of the SS method is discussed by comparing it with popular MCSA methods.
2. Modulation Effect of Broken Rotor Bars on the Current Signal
In this section, a mathematical model is established to explain the modulation mechanism of current signals, which is caused by BRBs, by improving the signal model proposed in [29,30].
When the motor is operated under healthy conditions, its current signals of phase A can be ideally expressed as
where I0 is the root mean squared amplitude of the current signal, fe is the fundamental frequency, and φi is the initial phase of the current signal.
Accordingly, the magnetic fluxes can be expressed as
where ϕ is the root mean squared amplitude and φϕ is the initial phase of the magnetic flux.
When the motor rotors are broken, the stator current causes a small additional periodic current component with a frequency fbrb = 2sfe [31,32]. The additional current can be expressed as
where Ibrb is the root mean squared amplitude and the φbrb is the initial phase of the additional current.
The additional current causes the motor to produce torque ripple and it can be expressed as
where p is the number of pole pairs.
According to the dynamic formula
where J is the inertia of the motor rotor and the rotor system.
Thus, the linkage flux can be derived as
Calculating the derivative of with respect to t, the fundamental electromotive force can be obtained as
Assuming that the equivalent impedance of the motor winding is , the fundamental frequency of stator current of the motor can be deduced as follows:
The torque ripple, which is caused by BRBs, modulates the amplitude and phase of the fundamental frequency component of the three-phase current signals. The extra current ibrb generated by BRBs is a tiny component compared with the current fundamental frequency, and it is reasonable to ignore. Ignoring the initial phase and extra current, the stator current in the fault state can be expressed as
where and . It can be seen that I(t) contains the signature frequency components.
Similarly, iBbrb(t) and iCbrb(t) can be derived. Therefore, the current signals of the faulty motor with BRB can be expressed as
3. The SS Method
3.1. The Theoretical Basis of the SS Method
Section 2 proves that BRBs generates amplitude modulation and phase modulation on the fundamental frequency component of current signals. The three-phase current signals can be expressed as Equation (10), and I(t) is the amplitude signal. When the motor is healthy, I(t) is a constant, and when the motor is a faulty motor with BRB, I(t) contains the signature frequency components of BRB.
Assuming SS(t) is the sum-of-squares of three-phase current signals, SS(t) can be expressed as
According to the theoretical derivation in Section 2, I(t) of the faulty motor can be expressed as
where and .
Consequently, SS(t) of the faulty motor can be expressed by integrating (12) into (11):
Therefore, when the motor is a faulty motor with BRB, SS(t) is a variable and contains the signature frequency components. In contrast, SS(t) is a constant when the motor is healthy. The health condition of the motor can be diagnosed by finding the signature frequency components from the spectrum of the SS of three-phase current signals.
3.2. The SS Method for Broken Rotor Bars Detection
Based on Equations (12)–(15), this paper presents a very simple method for BRB diagnosis by calculating the SS of the three-phase current signals, called the SS method. The process of the SS method is shown in Figure 1.
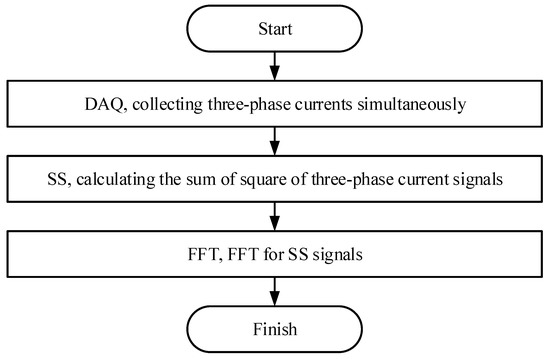
Figure 1.
Flow chart of the Sum-of-Squares (SS) method.
First, three-phase currents need to be collected simultaneously by a data acquisition system.
Then, the SS of three-phase current signals needs to be calculated.
Finally, the FFT analysis of the SS signals is performed. Signature frequency components of BRBs can be sought out easily in the spectrum of the SS signal.
4. Experimental Validation and Discussion
In this section, two experiments are conducted to generate experimental data to verify the effectiveness of the SS method. The performance under different load levels and rotation speeds and the computation cost of the SS method are discussed.
4.1. Experiment Setup
The experimental data are generated by the Mechanical Fault Simulator (MFS) test stand, which is a product of the Spectra Quest company. The MFS test stand, shown in Figure 2, consists of an IM, a variable frequency drive (VFD), a rotor system, a load unit, three current sensors, and a tachometer.
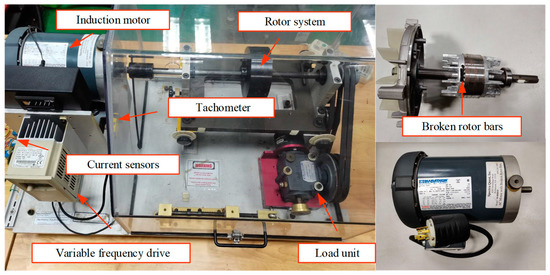
Figure 2.
Mechanical fault simulator and its faulty motor.
The IM used in the experiment is MARATHON 56T34F5301 squirrel-cage motor. The detailed parameters of the IM are listed in Table 1. Four rotor bars are broken by the milling process. The root mean squared amplitude of the AC power source is 220 V, and the frequency is 50 Hz. The power current is divided into three-phase currents by the VFD to drive the IM, and the root mean squared amplitude of VFD output voltage is also 220 V. The motor is loaded by the load unit, which consists of a magnetic brake. The magnetic brake can be set to six load levels of 0%, 20%, 40%, 60%, 80%, and 100% of full load. The full load of the magnetic brake, used in the MFS, is 1.13 Nm.

Table 1.
The detailed parameters of the Induction Motor (IM).
Two experiments have been conducted to verify the effectiveness of the SS method. The first experiment is used to demonstrate the effectiveness of the SS method under different load conditions. In this experiment, the output frequency of the VFD is set to 45 Hz and the motor load levels are set to 100%, 60%, and 20%, respectively. The other experiment is used to validate the effectiveness of the SS method under different motor rotation speeds. In this experiment, the output frequency of the VFD is set to 30.5 Hz, 40 Hz, and 48.5 Hz, respectively, and the motor load level is set to 100%. Three hall sensors and a tachometer are used to measure three-phase currents and rotation speed. The current signals and tachometer signals are collected by a PC-based Date Acquisition (DAQ) system during the experiments. The sampling rate is 2048 Hz, and 15 s data are collected during each test.
4.2. Results and Discussion
4.2.1. Time-Domain Signals and Their Spectrums of Current Signals
Figure 3 shows the three-phase current signals and their spectrums of the healthy motor and faulty motor. It can be seen from Figure 3 that the time domain signals of the faulty motor are slightly larger than those of the healthy motor. The signature frequency components are concealed by the supply frequency and are difficult to distinguish. It requires advanced signal processing methods to remove the supply frequency and make the signature frequency obvious.
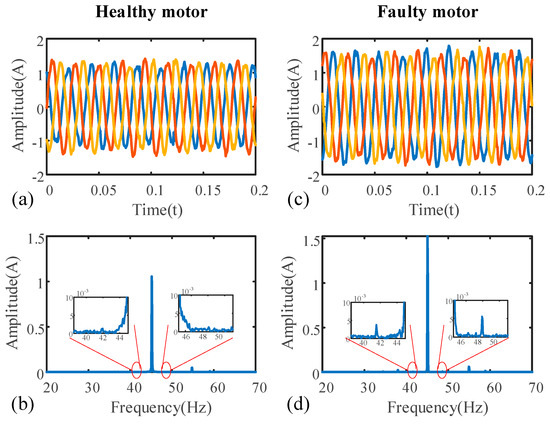
Figure 3.
The three-phase current signals and their spectra of the healthy motor and faulty motor: (a) is the time-domain diagram of the three-phase current signals of the healthy motor, (b) is the spectrum of phase A of the healthy motor, (c) is the time-domain diagram of the three-phase current signals of the faulty motor, (d) is the spectrum of phase A of a faulty motor.
4.2.2. The Calculation of fbrb
First, the signature frequency fbrb of the BRB is calculated. The frequency corresponding to the maximum of the spectrum of the tachometer signal is the running frequency fr of IM. Consequently, the slip of the IM can be calculated by
According to the formula fbrb = 2sfe, the signature frequency fbrb can be calculated. The results of slip and signature frequency are shown in Table 2.
Table 2.
The result of slip and signature frequency.
4.2.3. The Effectiveness of the SS Method
First, the experimental data of different health conditions, collected under the full load level, are analyzed by the SS method. The SS signals are calculated and are shown in Figure 4. There is no significant difference between the healthy motor and the faulty motor in the SS time-domain signals. The FFT is used to analyze SS signals, and the spectra of SS signals are also shown in Figure 4. By comparing the spectra of the SS signals of the healthy motor and faulty motor, it can be seen that the signature frequency components are conspicuous in the spectrum of the faulty motor. This proves that the SS method and the signal model proposed in this paper are effective for BRB detection.
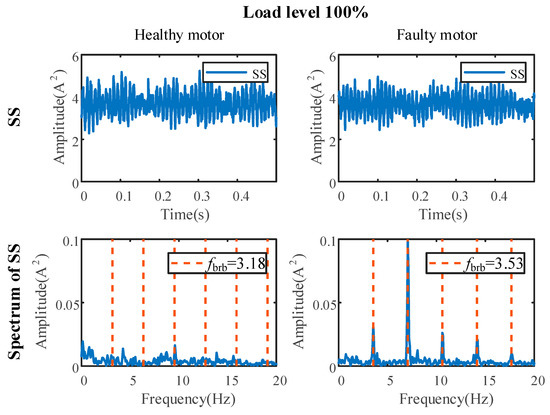
Figure 4.
The SS signal and its spectrum of healthy motor and faulty motor at 100% load.
Then, the SS method is used to analyze the experimental data of the IMs under different load conditions. The results are shown in Figure 4, Figure 5 and Figure 6. It can be seen that there is a huge difference in the spectra of the SS signals of a healthy motor and a faulty motor. The signature frequency components of the BRBs are obvious in the spectra of the SS signals of faulty motors. On the contrary, in the spectra of the SS signals of healthy motor current signals, the amplitude of signature frequency components is very small. The results demonstrate that the SS method proposed in this paper can effectively excavate the signature frequency components contained in the three-phase current signals under different load conditions.
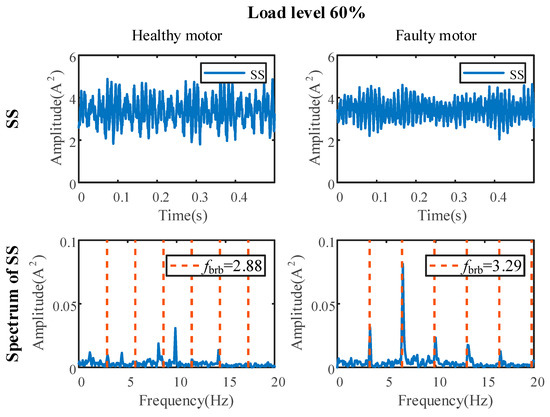
Figure 5.
The SS signal and its spectrum of healthy motor and faulty motor at 60% load.
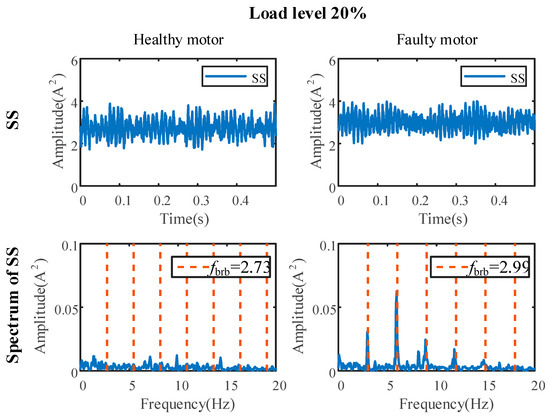
Figure 6.
The SS signal and its spectrum of healthy motor and faulty motor at 20% load.
Finally, the SS method is used to analyze the experimental data of the IMs under different motor rotation speeds. The experimental data are obtained when the motor supply frequency is 30.5 Hz, 40 Hz, and 48.5 Hz and the load level is 100%. The result of the SS method is shown in Figure 7. It can be seen that the slip of the motor gradually decreases as the rotation speed increases, and the signature frequency components are always obvious. This demonstrates that the SS method is also effective under different rotation speeds.
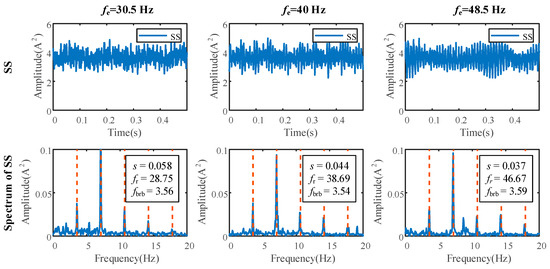
Figure 7.
The SS signals and their spectra of the faulty motor under different rotation speeds.
4.2.4. Comparison with Popular Methods of Broken Rotor Bars Diagnosis
To illustrate the effectiveness of the SS method, this paper compares the effect of the SS method with popular methods under different load conditions, including HT, Park’s vector modulus, TEO, and d-q transform. The results are shown in Figure 8. Three results can be obtained as follows.
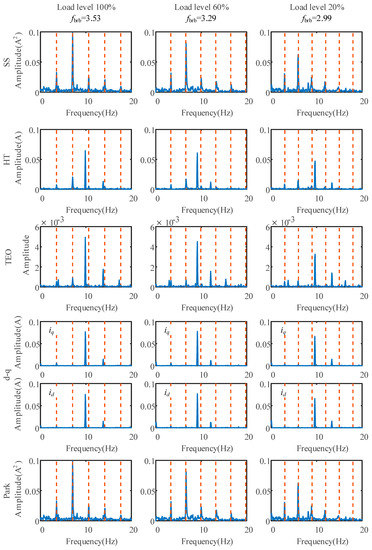
Figure 8.
The spectra of data analysis using different algorithms.
- (1)
- The SS method and Park’s vector modulus have the best effect, and four signature frequency components are obvious in the spectra of the SS method under three load conditions. The spectra of the SS method and Park’s vector modulus are very similar. Theoretically, the results obtained by the two methods are consistent, but the principle of the SS method is simper than Park’s vector modulus.
- (2)
- In the spectra of classical methods, including the HT, TEO, and d-q transform methods, only two signature frequency components are discernible, and there is a strong interfering frequency component near 3fbrb and 4fbrb, which is caused by equipment noise.
- (3)
- For the experimental data used in this paper, the effectiveness of the d-q transform method is unsatisfying compared with other methods.
4.2.5. Comparison of Computation Cost
It can be seen from Section 3 that the principle of the SS method proposed is uncomplicated, which only needs to calculate the sum-of-squares of three-phase current signals. In theory, the calculation cost of the SS method is lower compared with other popular methods.
In order to investigate the computation cost of the SS method, different methods are used to process the same group data. The process is repeated 10,000 times, and the calculation time is compared. The results are shown in Table 3. The runtime of the SS method is the smallest among these methods. Figure 9 shows the ratio of runtime of other methods to the SS method. There is an obvious improvement compared with HT, d-q transformation, and Park’s vector modulus. This shows that the computation cost of the SS method is smaller than other popular methods.
Table 3.
The runtime of different algorithms.
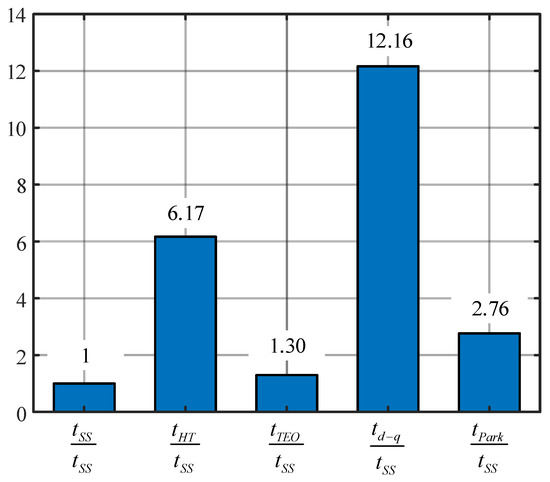
Figure 9.
Comparison of computation cost between the SS method and other algorithms.
5. Conclusions
In this paper, a simple SS method is proposed for the fault diagnosis of broken rotor bars of IMs. The SS method only needs to calculate the SS signal of three-phase current signals. In the spectrum of the SS signal, the signature frequency components are more obvious. The effectiveness of this method is verified by the experimental data and comparison with other popular methods. Through experimental data analysis, this method is shown to have the following advantages:
- (1)
- The SS method is effective for broken rotor bar diagnosis under different load conditions and different rotation speeds of the MFS test stand.
- (2)
- By comparing with the popular methods, including Park’s vector modulus, HT, TEO, and d-q transform, the effect of the SS method and Park’s vector modulus is the best of them. Theoretically, the SS method and Park’s vector modulus have the same effectiveness.
- (3)
- The principle of the SS method is simple and the computation cost is relatively smaller than many popular methods.
However, due to the limitation of experimental conditions, this paper does not discuss the effectiveness of the SS method in BRBs incipient fault detection, and the fault detection threshold for the quantification of BRBs is also not studied. Both of them are of great significance for accurately estimating the health conditions of IMs. In our future studies, we will focus on research into these challenges.
Author Contributions
J.C. conceived and designed the experiments, analyzed the experimental results, and wrote the first draft of the manuscript. N.H. proposed the theoretical system of the method, critically revised the manuscript, and approved the final version of the manuscript. L.Z., L.C., B.W., and Y.Z. revised the manuscript and developed the structure of the manuscript. All authors have read and agreed to the published version of the manuscript.
Funding
This research was supported by the National Natural Science Foundation of China (Grant No. 51975576), Defense Industrial Technology Development Program (Grant No. WDZC20195500305), and the National Natural Science Foundation of China (Grant No. 51475463).
Acknowledgments
Thanks to our younger brother Yuehao Li for his great support during the experiment. Thanks also go to the anonymous reviewers and the editor for their helpful comments and constructive suggestions.
Conflicts of Interest
The author declares no conflict of interest.
References
- Wu, Y.K.; Jiang, B.; Wang, Y.L. Incipient winding fault detection and diagnosis for squirrel-cage induction motors equipped on CRH trains. ISA Trans. 2020, 99, 488–495. [Google Scholar] [CrossRef] [PubMed]
- Bellini, A.; Filippetti, F.; Tassoni, C.; Capolino, G.-A. Advances in Diagnostic Techniques for Induction Machines. IEEE Trans. Ind. Electron. 2008, 55, 4109–4126. [Google Scholar] [CrossRef]
- Burriel-Valencia, J.; Puche-Panadero, R.; Martinez-Roman, J.; Sapena-Bano, A.; Pineda-Sanchez, M.; Perez-Cruz, J.; Riera-Guasp, M. Automatic Fault Diagnostic System for Induction Motors under Transient Regime Optimized with Expert Systems. Electronics 2019, 8, 6. [Google Scholar] [CrossRef]
- Bessam, B.; Menacer, A.; Boumehraz, M.; Cherif, H. Detection of broken rotor bar faults in induction motor at low load using neural network. ISA Trans. 2016, 64, 241–246. [Google Scholar] [CrossRef] [PubMed]
- Xie, Y.; Chen, P.; Li, F.; Liu, H. Electromagnetic forces signature and vibration characteristic for diagnosis broken bars in squirrel cage induction motors. Mech. Syst. Signal Process. 2019, 123, 554–572. [Google Scholar] [CrossRef]
- Mehrjou, M.R.; Mariun, N.; Marhaban, M.H.; Misron, N. Rotor fault condition monitoring techniques for squirrel-cage induction machine—A review. Mech. Syst. Signal Process. 2011, 25, 2827–2848. [Google Scholar] [CrossRef]
- Wang, Z.; Yang, J.; Li, H.; Zhen, D.; Xu, Y.; Gu, F. Fault Identification of Broken Rotor Bars in Induction Motors Using an Improved Cyclic Modulation Spectral Analysis. Energies 2019, 12, 3279. [Google Scholar] [CrossRef]
- Zhen, D.; Wang, Z.; Li, H.; Zhang, H.; Yang, J.; Gu, F. An Improved Cyclic Modulation Spectral Analysis Based on the CWT and Its Application on Broken Rotor Bar Fault Diagnosis for Induction Motors. Appl. Sci. 2019, 9, 3902. [Google Scholar] [CrossRef]
- Nascimento, N.M.M.; Silva, S.P.P.; Reboucas Filho, P.P.; Medeiros, C.M.S. Higher-Order Statistics applied to machine learning as an approach to identify broken rotor bars in induction motors. IEEE Latin Am. Trans. 2018, 16, 2267–2274. [Google Scholar] [CrossRef]
- Sabbaghian-Bidgoli, F.; Poshtan, J. Fault Detection of Broken Rotor Bar Using an Improved form of Hilbert-Huang Transform. Fluct. Noise Lett. 2018, 17, 1850012. [Google Scholar] [CrossRef]
- Gangsar, P.; Tiwari, R. Signal based condition monitoring techniques for fault detection and diagnosis of induction motors: A state-of-the-art review. Mech. Syst. Signal Process. 2020, 144, 106908. [Google Scholar] [CrossRef]
- Panagiotou, P.A.; Arvanitakis, I.; Lophitis, N.; Antonino-Daviu, J.A.; Gyftakis, K.N. A New Approach for Broken Rotor Bar Detection in Induction Motors Using Frequency Extraction in Stray Flux Signals. IEEE Trans. Ind. Appl. 2019, 55, 3501–3511. [Google Scholar] [CrossRef]
- Soleimani, Y.; Cruz, S.M.A.; Haghjoo, F. Broken Rotor Bar Detection in Induction Motors Based on Air-Gap Rotational Magnetic Field Measurement. IEEE Trans. Instrum. Meas. 2019, 68, 2916–2925. [Google Scholar] [CrossRef]
- Naha, A.; Samanta, A.K.; Routray, A.; Deb, A.K. A Method for Detecting Half-Broken Rotor Bar in Lightly Loaded Induction Motors Using Current. IEEE Trans. Instrum. Meas. 2016, 65, 1614–1625. [Google Scholar] [CrossRef]
- Ouadah, M.; Touhami, O.; Ibtiouen, R. Improvement of the detection of the defect squirrel cage rotor by the study of additional components of the space harmonics. Electr. Eng. 2018, 100, 2485–2497. [Google Scholar] [CrossRef]
- Liboni, L.H.B.; Flauzino, R.A.; da Silva, I.N.; Marques Costa, E.C. Efficient feature extraction technique for diagnosing broken bars in three-phase induction machines. Measurement 2019, 134, 825–834. [Google Scholar] [CrossRef]
- Rivera-Guillen, J.R.; De Santiago-Perez, J.J.; Amezquita-Sanchez, J.P.; Valtierra-Rodriguez, M.; Romero-Troncoso, R.J. Enhanced FFT-based method for incipient broken rotor bar detection in induction motors during the startup transient. Measurement 2018, 124, 277–285. [Google Scholar] [CrossRef]
- Martin-Diaz, I.; Morinigo-Sotelo, D.; Duque-Perez, O.; Garcia-Perez, A.; Camarena-Martinez, D.; Romero-Troncoso, R.J. High-resolution Spectral Analysis for Fault Detection on Induction Motors Fed by Variable-Speed Drives. J. Sci. Ind. Res. 2017, 76, 545–549. [Google Scholar]
- Liang, B.; Iwnicki, S.D.; Zhao, Y. Application of power spectrum, cepstrum, higher order spectrum and neural network analyses for induction motor fault diagnosis. Mech. Syst. Signal Process. 2013, 39, 342–360. [Google Scholar] [CrossRef]
- Abd-el-Malek, M.; Abdelsalam, A.K.; Hassan, O.E. Induction motor broken rotor bar fault location detection through envelope analysis of start-up current using Hilbert transform. Mech. Syst. Signal Process. 2017, 93, 332–350. [Google Scholar] [CrossRef]
- Rangel-Magdaleno, J.; Peregrina-Barreto, H.; Ramirez-Cortes, J.; Cruz-Vega, I. Hilbert spectrum analysis of induction motors for the detection of incipient broken rotor bars. Measurement 2017, 109, 247–255. [Google Scholar] [CrossRef]
- Abd-el-Malek, M.B.; Abdelsalam, A.K.; Hassan, O.E. Novel approach using Hilbert Transform for multiple broken rotor bars fault location detection for three phase induction motor. ISA Trans. 2018, 80, 439–457. [Google Scholar] [CrossRef] [PubMed]
- Cruz, S.M.A.; Cardoso, A.J.M. Stator winding fault diagnosis in three-phase synchronous and asynchronous motors, by the Extended Park’s Vector Approach. IEEE Trans. Ind. Appl. 2001, 37, 1227–1233. [Google Scholar] [CrossRef]
- Gyftakis, K.N.; Marques Cardoso, A.J.; Antonino-Daviu, J.A. Introducing the Filtered Park’s and Filtered Extended Park’s Vector Approach to detect broken rotor bars in induction motors independently from the rotor slots number. Mech. Syst. Signal Process. 2017, 93, 30–50. [Google Scholar] [CrossRef]
- Vilhekar, T.G.; Ballal, M.S.; Suryawanshi, H.M. Application of Multiple Parks Vector Approach for Detection of Multiple Faults in Induction Motors. J. Power Electron. 2017, 17, 972–982. [Google Scholar]
- Fu, Q.; Yue, S.; He, B.; Fu, N. Multiple coupled circuit modelling approach for squirrel cage induction machine under single-broken-bar fault with stator winding functions decomposed in d-q rotor reference frame. IET Electr. Power Appl. 2019, 13, 889–900. [Google Scholar] [CrossRef]
- Yin, S.; Hu, N.; Chen, L.; Hu, L. Teager Energy Operator and its Application in the Study of Induction Motor Rotor Broken Bars Fault. In Proceedings of the 2015 Prognostics and System Health Management Conference, Beijing, China, 21–23 October 2015. [Google Scholar]
- Li, H.Y.; Wang, Z.L.; Zhen, D.; Gu, F.S.; Ball, A. Modulation Sideband Separation Using the Teager-Kaiser Energy Operator for Rotor Fault Diagnostics of Induction Motors. Energies 2019, 12, 4437. [Google Scholar] [CrossRef]
- Gu, F.; Shao, Y.; Hu, N.; Naid, A.; Ball, A.D. Electrical motor current signal analysis using a modified bispectrum for fault diagnosis of downstream mechanical equipment. Mech. Syst. Signal Process. 2011, 25, 360–372. [Google Scholar] [CrossRef]
- Gu, F.; Wang, T.; Alwodai, A.; Tian, X.; Shao, Y.; Ball, A.D. A new method of accurate broken rotor bar diagnosis based on modulation signal bispectrum analysis of motor current signals. Mech. Syst. Signal Process. 2015, 50–51, 400–413. [Google Scholar] [CrossRef]
- Bellini, A.; Filippetti, F.; Franceschini, G.; Tassoni, C.; Kliman, G.B. Quantitative evaluation of induction motor broken bars by means of electrical signature analysis. IEEE Trans. Ind. Appl. 2001, 37, 1248–1255. [Google Scholar] [CrossRef]
- Filippetti, F.; Franceschini, G.; Tassoni, C.; Vas, P. AI techniques in induction machines diagnosis including the speed ripple effect. IEEE Trans. Ind. Appl. 1998, 34, 98–108. [Google Scholar] [CrossRef]


© 2020 by the authors. Licensee MDPI, Basel, Switzerland. This article is an open access article distributed under the terms and conditions of the Creative Commons Attribution (CC BY) license (http://creativecommons.org/licenses/by/4.0/).