Article

The Effect of Adsorbed Volatile Organic Compounds on an Ultrathin Water Film Measurement

1
Department of Mechanical Engineering-Engineering Mechanics, Michigan Technological University, Houghton, MI 49931, USA
2
School of Mechanical Engineering, Chung-Ang University, Seoul 06974, Korea
*
Authors to whom correspondence should be addressed.
Appl. Sci. 2020, 10(17), 5981; https://doi.org/10.3390/app10175981
Submission received: 4 August 2020 / Revised: 24 August 2020 / Accepted: 27 August 2020 / Published: 29 August 2020
(This article belongs to the Section Mechanical Engineering)

Abstract

:

Featured Application

The results of this work can be used in ultra-thin film measurement using SPRi and can help enable a better understanding of the mechanism of dropwise condensation.

Abstract

Using surface plasmon resonance imaging (SPRi), we have recently shown for the first time the existence of a monolayer water film between droplets during dropwise condensation. This study examines the effect of adsorbed volatile organic compounds (VOCs) on the ultrathin film measurement using SPRi. Further, the work presents the proper surface-treatment process that enables measurements of the ultrathin water layer during high-speed imaging of dropwise condensation at 3000 frame per second. In this study, two methods were applied for cleaning the surface (gold-coated glass)—(1) standard cleaning procedure (SCP) using acetone, isopropyl alcohol, and deionized water and (2) SCP followed by air plasma cleaning. This work discusses the effect of the cleaning procedures on surface roughness, contact angle, and surface chemistry using atomic force microscopy, optical microscopy, and an X-ray photoelectron spectroscope meter. The results showed that SCP before the SPRi is a proper surface-treatment method. The effect of adsorbed VOCs during dropwise condensation on a surface treated with SCP was measured to be 0.0025 (reflectivity unit), which was 70% smaller than the reflectance associated with a monolayer water film. The results of this work confirm a monolayer water film observation during the dropwise condensation, which has been reported before.

1. Introduction

The physics of dropwise condensation has been under study for more than nine decades [1,2]. However, despite a significant body of prior work, there is still not a united theory behind the physics of dropwise condensation [3]. The main differences between the theories are (I) whether a thin film forms on a surface and ruptures to form droplets or the droplets nucleate heterogeneously on a surface, (II) whether a thin film exists between the droplets during the dropwise condensation, and (III) whether the thin film between the droplets contributes to the overall heat transfer from a surface [4]. To clarify these ambiguities about the physics of dropwise condensation, it is required to atomistically probe the solid–vapor interface during phase-change to evaluate the existence and structure of the thin film and initial nuclei that develop during condensation. In this regard, we have recently shown for the first time the existence of a monolayer film of water between droplets during the dropwise condensation on a smooth gold surface; this work was enabled by surface plasmon resonance imaging (SPRi) at 3000 frames per second (FPS) [5,6]. In our prior manuscripts, we discussed the development of the experimental apparatus and the uncertainty/error of the imaging. Another type of error that can affect water thin film identification and measurement is related to surface properties. As properties of a surface can affect the heterogeneous nucleation, it is necessary to study surface heterogeneity and subsequent influence on thin film measurement results. Surface roughness [7,8,9] and surface contamination [10,11,12] are among the reasons for surface heterogeneity.
Surface contamination is a critical problem in the thickness measurement, specifically ultra-thin film thickness (<1 nm) [13]. Inevitable contamination, such as adsorbed volatile organic compounds (VOCs) on a surface, interfere with measuring the thickness of a thin film by changing the refractive index and thickness of the thin film [14]. VOCs are airborne and can manifest in the form of chlorinated hydrocarbons, aromatic hydrocarbons, mono- and polyalcohols, and ketones [15]. Storing samples to minimize the accumulation of contaminants and surface treatment to minimize the effect of VOCs on a surface are the routine preprocessing steps before measuring a thin film using SPRi [16]. Although these steps minimize the amount of unwanted adsorbed VOCs on a surface before an experiment, the adsorption of VOCs on a surface during an experiment is inevitable. In particular, the effect of adsorbed VOCs on a measuring signal can be considerable when the measurement takes in the ambient atmosphere and runs for a long time‒such as in the case of identifying a thin film that may exist between droplets during the dropwise condensation on a smooth surface.
In this work, two surface-treatment procedures were studied for removing contamination and particles from the gold surface. The effects of these two cleaning procedures on the surface uniformity, surface wettability, surface chemistry, and adsorption of VOCs were studied using atomic force microscopy (AFM) [17], optical microscopy [18], X-ray photoelectron spectroscope meter (XPS) [19,20], and SPRi [21]. Through this research, the cleaning procedure that has the minimum effects on ultrathin film measurement using SPRi was identified, and the error associated with the adsorption of VOCs during thickness measurement of an ultrathin water film was characterized.

2. Materials and Methods

2.1. Sample Fabrication

Plain glass slides (75 mm × 25 mm × 1 mm, catalog number 48300-026, VMR International, Randor, PA, USA) were immersed in a piranha solution (a mixture of H2SO4 and H2O2) for 20 min to remove residues of organic contaminations on the glass surface, followed by thoroughly rinsing with water and drying with nitrogen prior to the gold deposition procedure. Then, 2.5 nm of titanium as an adhesion layer and 50 nm of gold (n = 0.4241 + 2.4721i) were deposited on the glass slides using a Denton DV6 sputter deposition system. Samples were left in ambient conditions (an average relative humidity of 33% and an average temperature of 28 °C) for three months before using them for the surface characterization experiments. The period of three months provided enough exposure time for the adsorption of VOCs on the surface [11,12]. Gold-coated samples were cut into pieces and cleaned using a standard cleaning protocol (SCP) before the surface characterization experiments using the following procedure—10-min ultrasonic cleaning in acetone (CAS 179124-4L-PB, Sigma Aldrich, St. Louis, MO, USA), 10-min ultrasonic cleaning with isopropyl alcohol 99% (CAS 67-63-0, Pharmco Aaper, Bookfield, CT, USA), vigorous rinsing with deionized (DI) water for 1 min, and drying with high-purity-grade nitrogen [22].

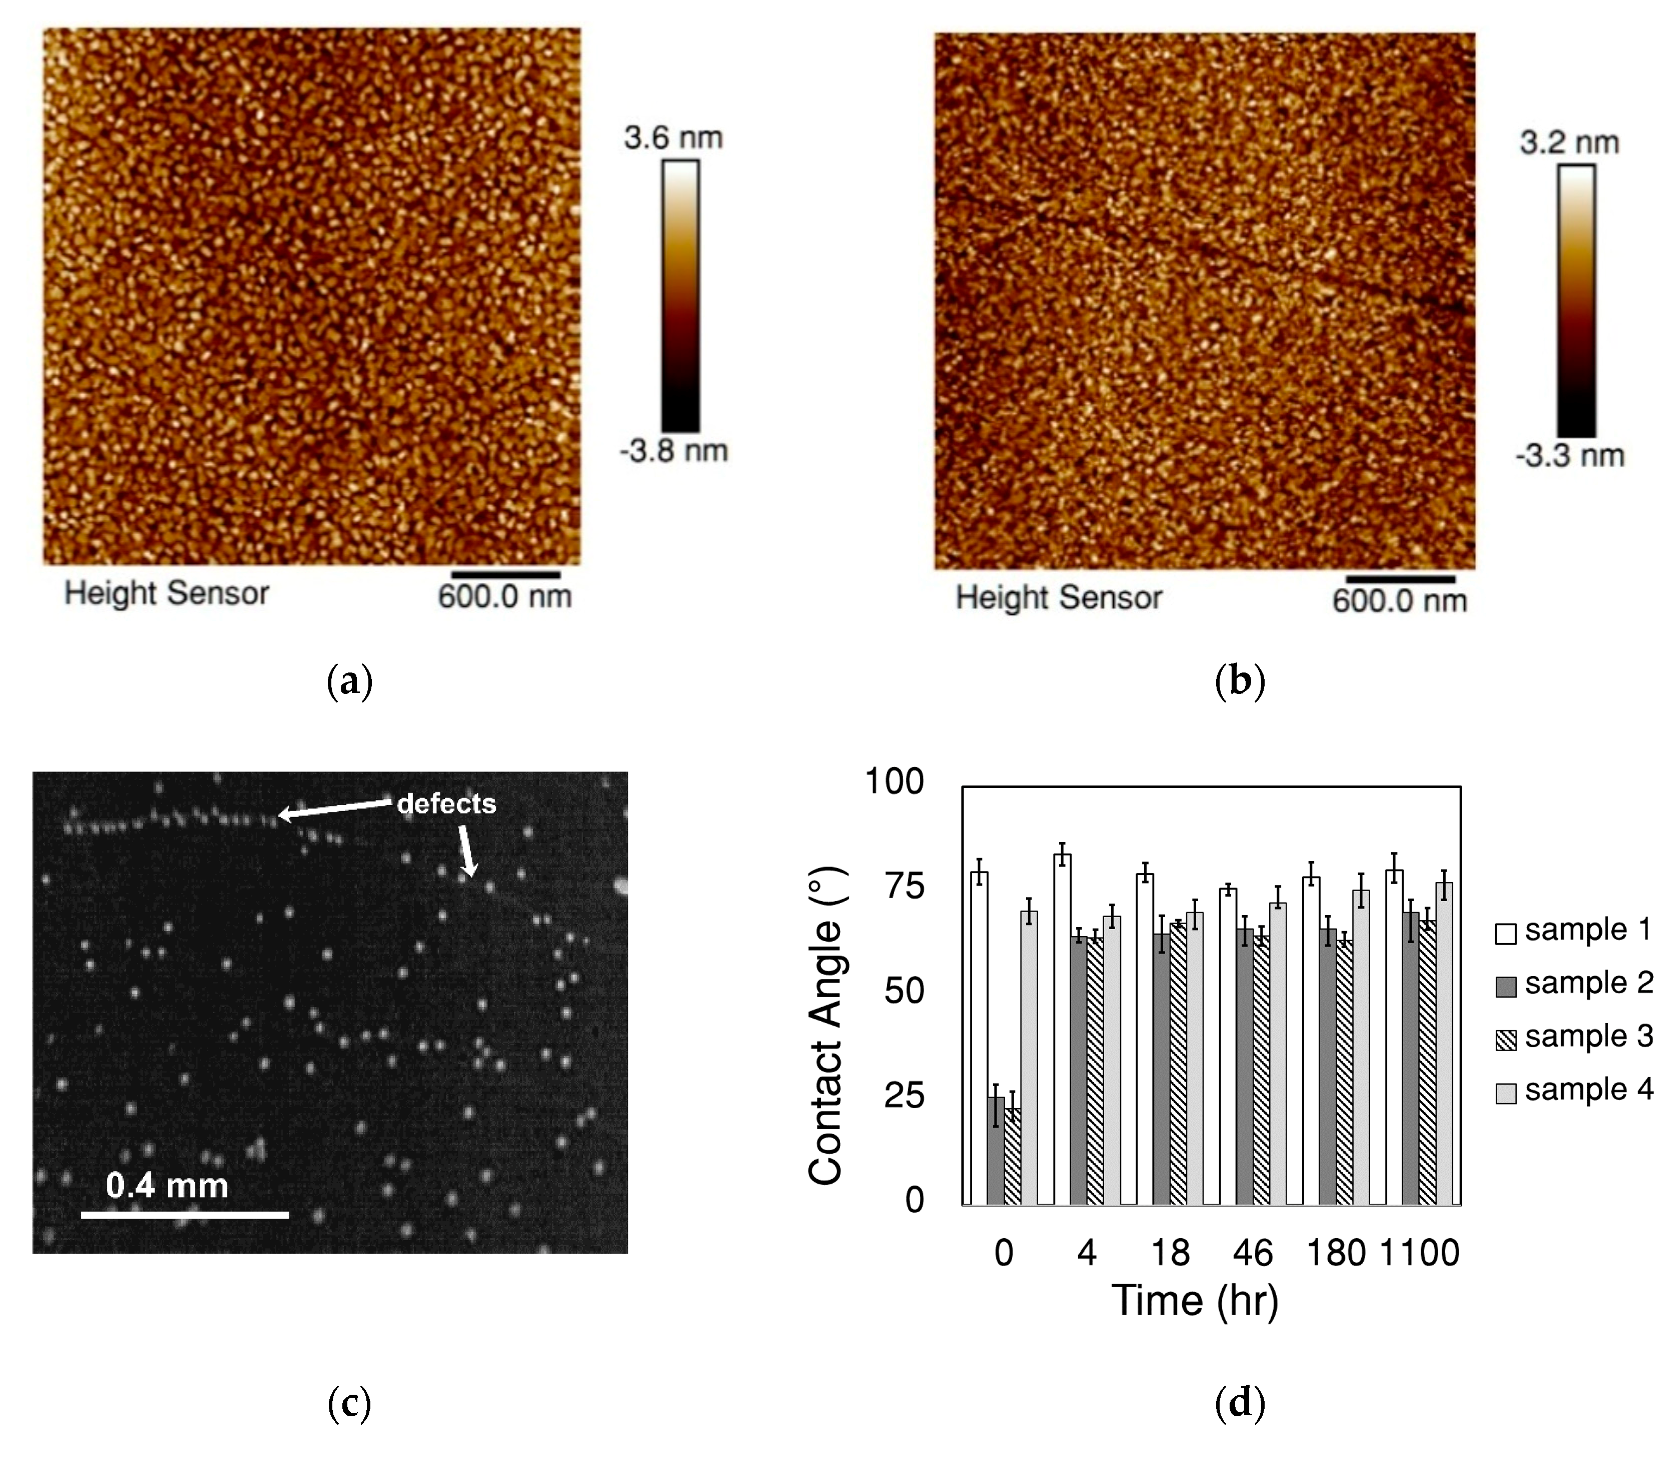
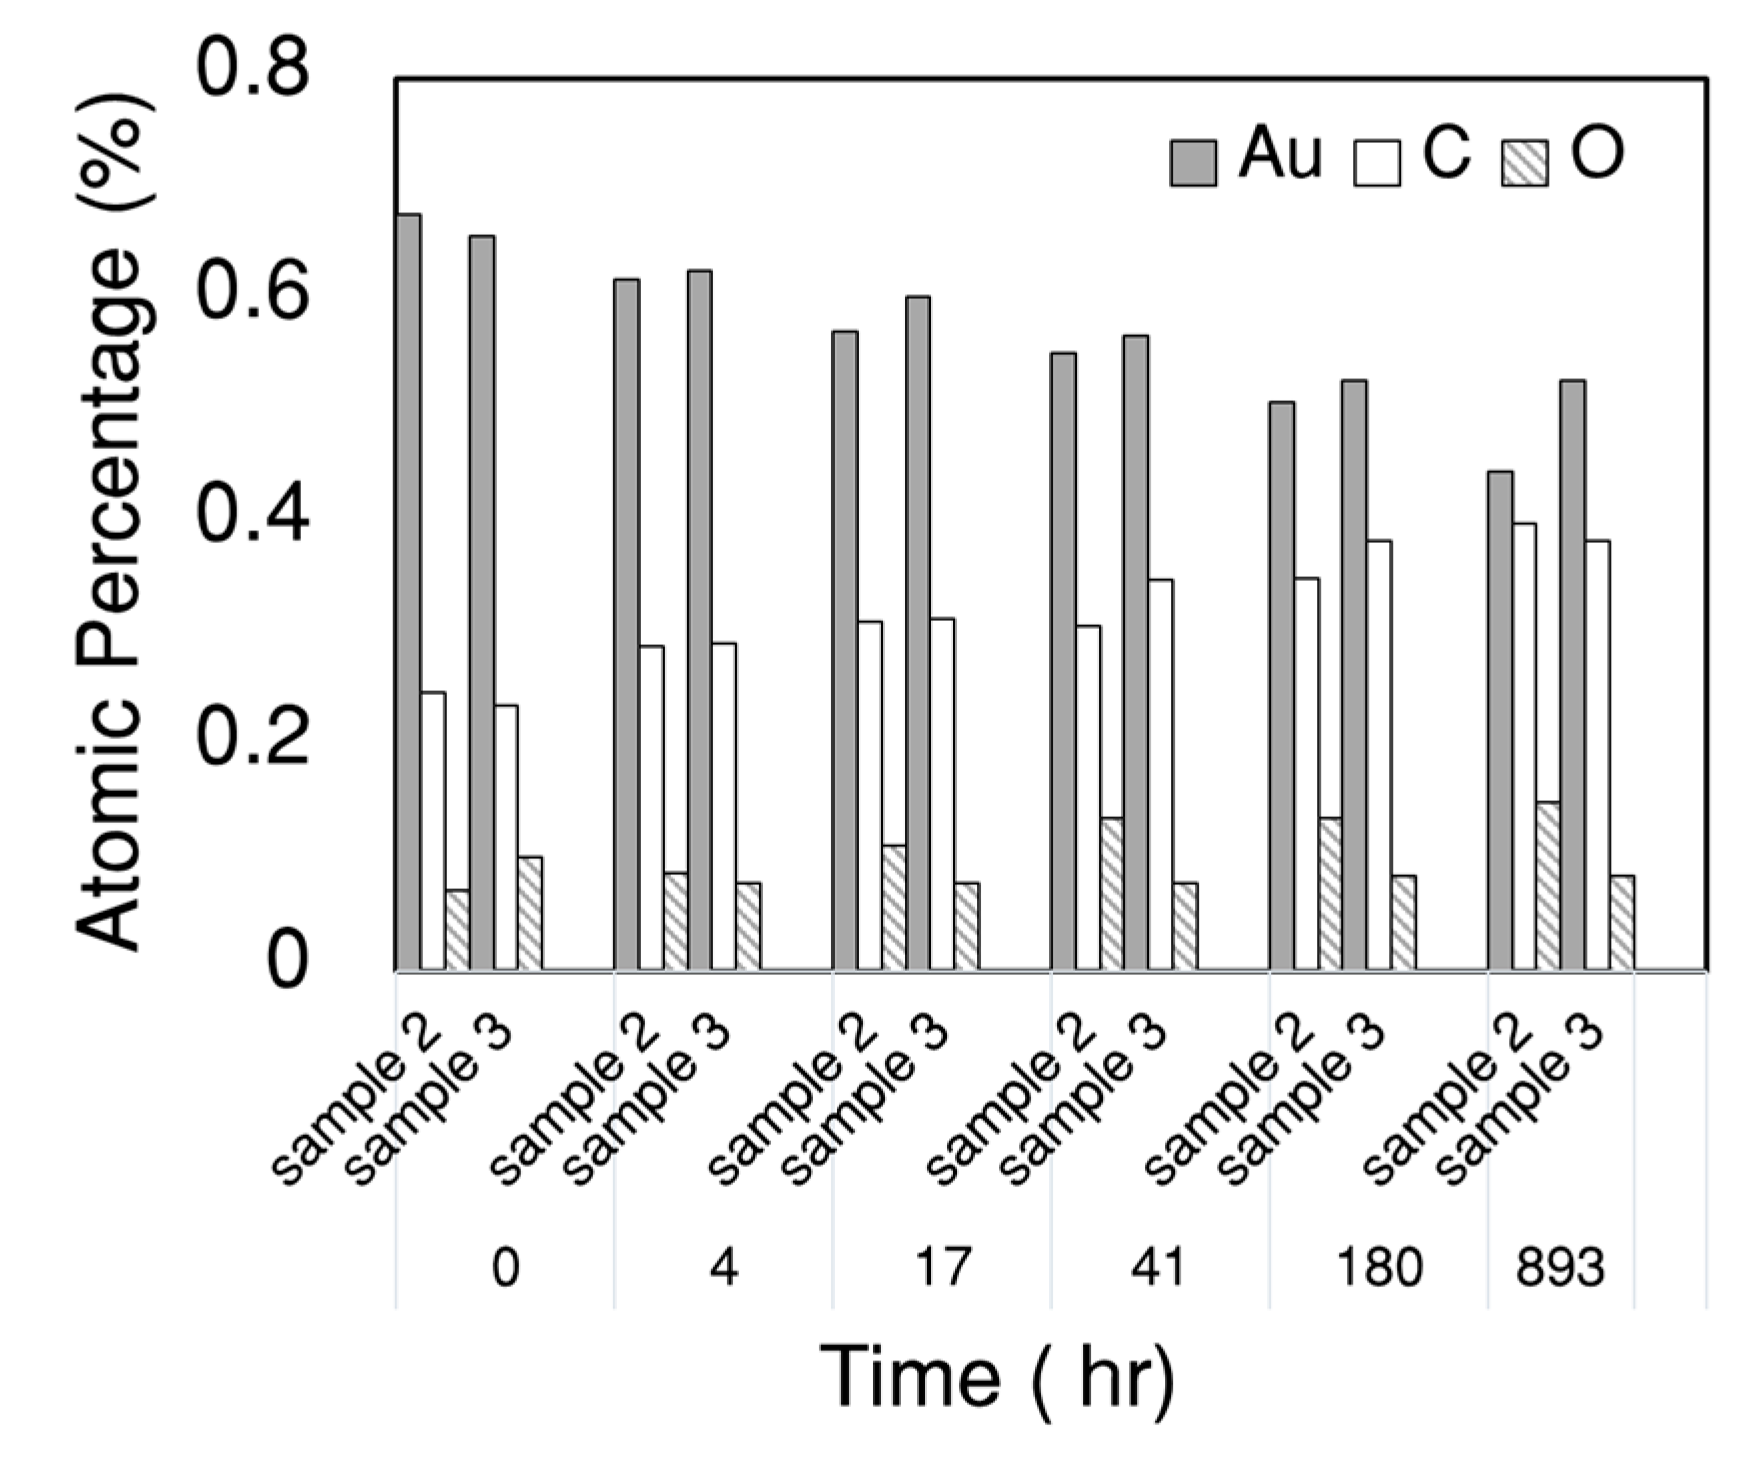
2.2. Surface Characterization

Table 1 shows the surface cleaning and sample storing methods studied in this work. One sample was used as-is without any further cleaning process; this sample was used as a reference. Two cleaning procedures were studied: cleaning using SCP (Section 2.1) and cleaning using SCP followed by plasma cleaning with air using a Harrick plasma cleaner (Harrick Plasma, Ithaca, NY) at 18 W for five minutes. The plasma-cleaned samples were exposed to two environmental conditions—(1) in a sealed desiccator at atmospheric pressure and (2) in an open container in normal room conditions (an average relative humidity of 33% and an average temperature of 28 °C).
Table 2 shows the surface characterization methods that were implemented to study the samples. As the gold-coating quality and glass-slide surface properties may have varied from one sample to another sample, we tried to minimize these effects on the surface characterization results by using a single glass slide for each surface characterization method. A single glass slide was cut into three pieces for AFM measurement, one glass slide was cut into 3 pieces for XPS measurement, and one glass slide was cut into four pieces for contact angle measurement. The surface morphology of samples 2, 3, and 4 at exposure times of 2, 17, 41, 185 h to the atmospheric conditions (exposure time indicates the duration of time a sample was exposed to the ambient environment after the cleaning process and before the onset of the study) was monitored using AFM. To ensure the repeatability of the result, AFM studies was repeated at three random locations on each sample. The equilibrium contact angle of samples, defined by the mean of the contact angles at five different locations on a sample, was measured by dispensing water droplets with a volume of 0.2–0.5 µL. The contact angle was measured for samples 1, 2, 3, and 4 at exposure times of 0, 4, 18, 46, 180, 1100 h. The surface chemistry of samples was studied by XPS (PHI 5800 X-ray photoelectron spectrometer, Mg X-ray source, θ = 45°).

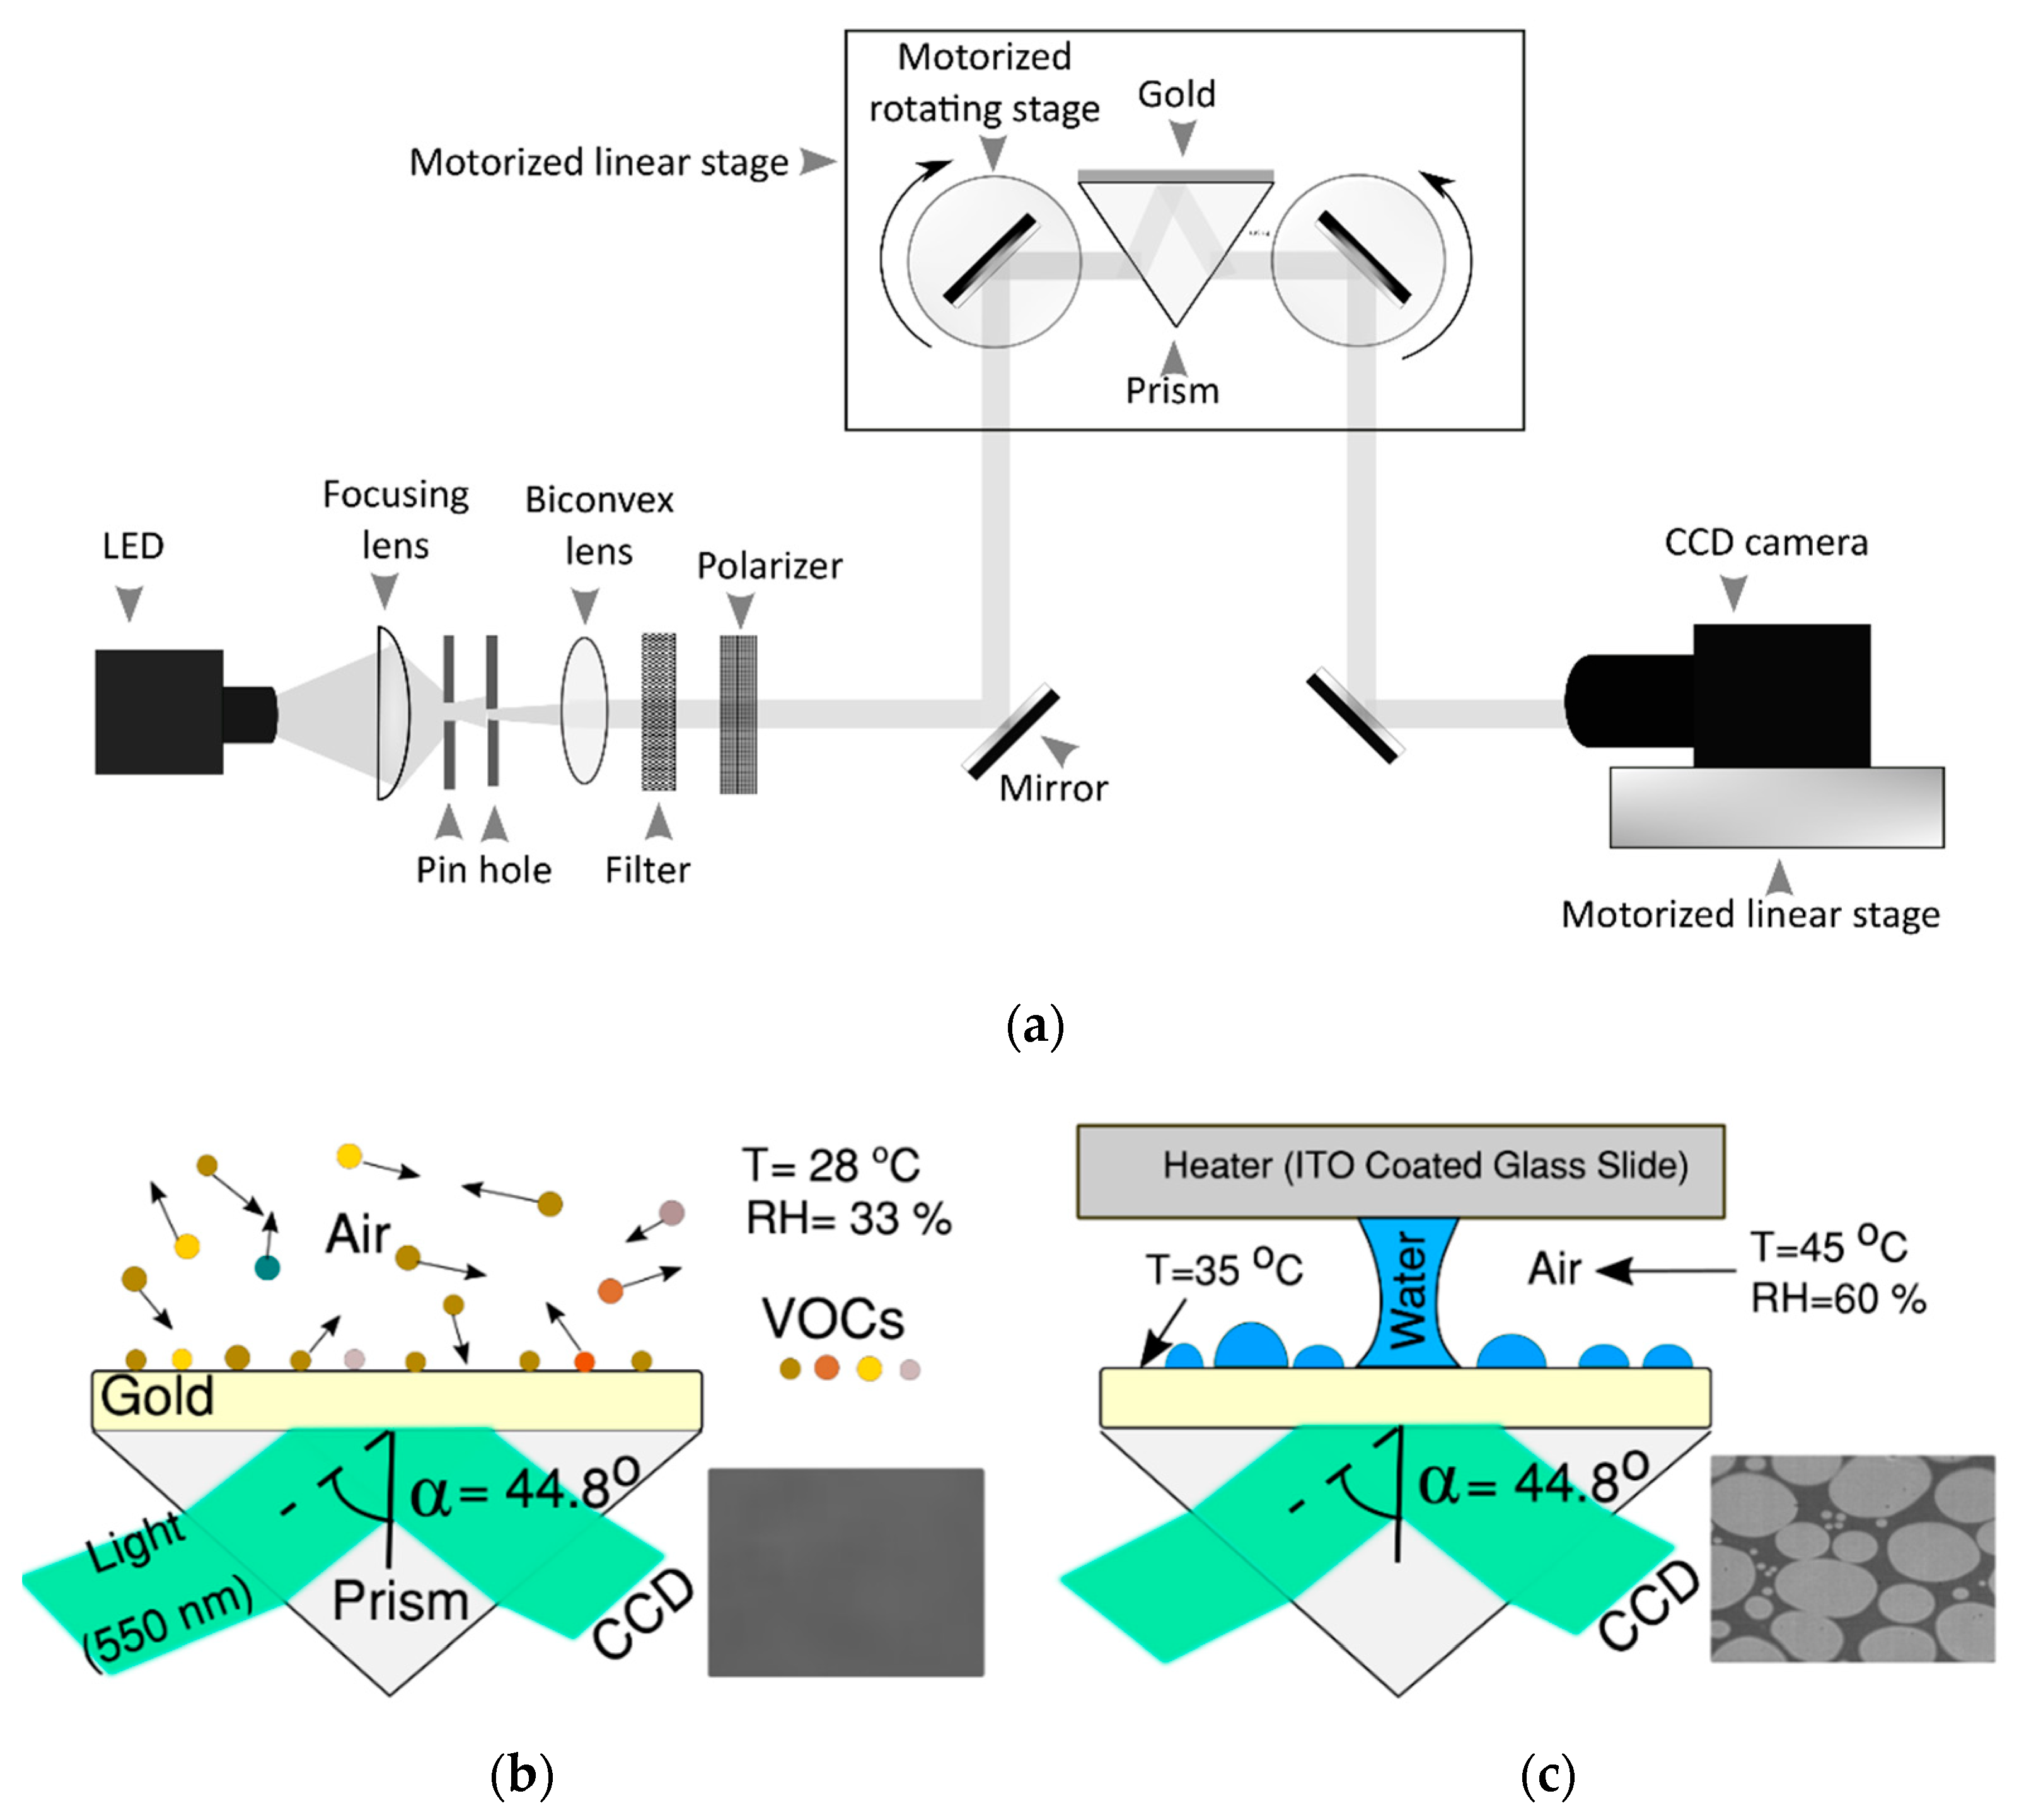
2.3. Adsorbed VOC Characterization Using SPRi

SPRi was used for real-time tracking of adsorbed VOCs on a surface. Our in-house-developed automated SPRi instrument was used for the imaging. Figure 1a shows a schematic of this instrument. P-polarized monochromatic collimated light required for the SPRi forms by passing a divergent light from a LED illumination system through the optical array (focusing lens, biconvex lens, apertures, 550 nm bandpass filter with a full width-half maximum of 10 nm, and p-polarizer). A stationary mirror and a rotating mirror direct the light to launch on a prism. Reflected light from the prism is guided toward a charge-coupled device (CCD) camera using a second pair of rotating and stationary mirrors. The recorded light contains information on the thickness and refractive index of the medium on top of the gold-coated glass. The use of a motorized rotating and linear stage allows for sweeping the incident angle to obtain the SPRi reflectance curve of a sample. The reflectance curve of the sample reveals the surface plasmon resonance (SPR) angle (the angle corresponding to the minimum reflectance), which works as a fingerprint for characterizing the materials on top of the gold substrate. The characterizations of adsorbed VOCs on samples 2 and 4 were done separately. For each sample, first, the corresponding SPR angle of the sample was found by sweeping the incident angle from 40° to 60°. Then, the incident angle was adjusted to 1.5° below the SPR angle (46.3°), i.e., 44.8°, and the time-lapse images (one frame per 1 min) of each sample were recorded for 110 h at room conditions (relative humidity of 33% and temperature of 28 °C), Figure 1b. To ensure the repeatability of the result, SPRi was repeated three times for sample 2 and sample 4. The schematic of the SPRi of dropwise condensation is illustrated in Figure 1c. First, the reflectance curve for a sample cleaned with SCP was obtained using SPRi with angle-scanning. Then, the incident angle was fixed at 44.8° and the setup was prepared for the SPRi of dropwise condensation at 3000 FPS. For inducing condensation on the sample, we placed an indium tin oxide (ITO)-coated glass slide as a heater at a distance of 5 mm above the gold surface. A water column (between the heater and the gold-coated glass) with a size of 15 ± 5 µm was formed using a syringe. By heating the water column, part of the water column evaporated and condensed on the surface. The temperature and relative humidity above the study area were 45 °C and 60 ± 4%, respectively, while the condensing surface temperature was 35 °C. The details of the dropwise condensation experiment, image processing, statistical noise analysis, uncertainty of SPRi, and a monolayer water film measurement are discussed elsewhere [5,23,24].

3. Results and Discussion

3.1. Proper Cleaning Procedure Prior to the Dropwise Condensation Experiment

Surface defects [7,8,9] and adsorbed VOCs [10,11,12] on a surface are key factors that contribute to surface heterogeneity. Surface heterogeneity can cause abnormality in the mechanism of dropwise condensation on a smooth surface. As our final goal was to study the effect of surface treatment on the measurement of ultrathin water film during the dropwise condensation process on a smooth surface, we studied the effect of surface cleaning methods on the surface properties (surface uniformity, surface wettability, and surface chemistry). Figure 2a,b show the surface morphologies of sample 2 with exposure times of 2 h and 185 h, respectively. The root-mean-square of the surface roughness for samples 2 and 3 was reduced slightly (within 183 h exposure time) from 1.10 ± 0.02 nm to 0.95 ± 0.10 nm and from 1.14 ± 0.02 nm to 0.83 ± 0.06 nm, respectively. Meanwhile, the root-mean-square of surface roughness for sample 4 changed from 1.57 ± 0.01 nm to 1.70 ± 0.1 nm. The AFM analysis showed that the surface had a uniform, smooth coating. However, the error of measurement (based on three measurements at three different locations of each sample) increased for all three samples over time. This showed that the adsorption of contamination on the surface can slightly affected the homogeneity of the surface. As the associated error was smaller than 0.10 nm over the course of 183 h, we can consider these samples to have had a uniform surface structure. Figure 2b shows a defect on the surface of the gold-coated glass; a defect can cause heterogeneous nucleation during the dropwise condensation process [9]. It can be seen in the example case in Figure 2c that atomic-scale defects and surface edges on the gold-coated glass caused heterogeneous nucleation on the surface (bright spots are micro-size droplets; the darker color represents the gold substrate). This image was recorded at the onset of dropwise condensation using SPRi [23]. As the surface defects were limited on the gold-coated glass surface, and these defects were prescreened prior to the dropwise condensation experiments, the presumption of homogenous nucleation due to the smooth condensing surface is reasonable.
Equilibrium contact angles of DI water drops on the gold surface are shown in Figure 2d. The averaged contact angle for sample 1 remained relatively constant at 79.4° over the 1100 h period. The contact angle variations over the exposure time of 1100 h were more significant for plasma-cleaned samples ‒sample 2 (contact angle increased exponentially from 27° to 70°) and sample 3 (contact angle increased exponentially from 23° to 68°). For sample 4, which was cleaned with the SCP, the averaged static contact angle was slightly increased (from 70° to 76°) in 1100 h. The results showed that the cleaned samples had smaller contact angles, as compared to the sample with no surface cleaning (sample 1). The decrease of contact angle after surface cleaning could have been an indication of removing some adsorbed VOCs from the surface. The variations in the contact angles were more significant (~ 44°) in the plasma-cleaned samples.
To understand the mechanism of increased hydrophobicity in the plasma-cleaned samples, we analyzed the variation in surface chemistry using XPS. A broad-range energy scan of the cleaned samples showed the presence of gold (Au 4f), carbon (C 1s), and oxygen (O 1s) on the samples’ surface, see Figure 3a. High-resolution XPS spectra of C 1s and O 1s indicated that the atomic parentage of C 1s and O 1s increased significantly on the plasma-cleaned surfaces during the one-month exposure time, see Figure 3b. For sample 2, the ratio of C/Au, which is the indicator of adsorbed VOCs, increased by 240% during the exposure time of one month. The result showed the amount of non-polar C‒C (or C‒H), which is responsible for hydrophobicity, was the dominant part (76%) of the adsorbed hydrocarbons. The high-resolution XPS spectra of sample 4 (seen in Figure 3b) revealed that the adsorbed VOCs on the surface did not contain a polar C=O bond that causes hydrophilicity on the surface. This could explain the larger contact angle (76°) of sample 4 cleaned with SCP, as compared with the eventual contact angle (70° after an 1100 h exposure time) of sample 2. Based on the surface characterizations of samples, we used SCP as the cleaning procedure for the gold samples before the condensation experiment. SCP produced negligible changes to the chemistry of the surface, as compared to the plasma cleaning method. Therefore, the effect of concurrent adsorption of VOCs during the condensation experiment, which can take up to several hours after the cleaning process, was expected to be less than that of the samples treated with the plasma cleaning method.

3.2. Proper Storing Methods of Gold-Coated Samples

As the samples–in our study, gold-coated glass–are usually fabricated in batches weeks or months before the experiment, it is important to properly store them to minimize the amount of absorbed contaminations (as a result, surface heterogenicity) on the samples’ surface. Samples 2 and 3 cut from the same glass slide were both cleaned by SCP, followed by air plasma cleaning. Therefore, the initial conditions for both of these samples should have been relatively similar. As Table 2 shows, sample 2 was kept in an open container in an area of a laboratory that is less accessible by personnel (an average relative humidity of 33% and an average temperature of 28 °C). Further, sample 3 was placed in a sealed desiccator. The AFM results showed the roughness of the two samples were relatively similar during the 185 h exposure time. The contact angle results show a similar trend in the increase of contact angle (44° increase in 1100 h). The atomic percentage of O 1s, C 1s, and Au 4f from XPS are depicted in Figure 4 for samples 2 and 3. The results indicate that the atomic percentage of C 1s changed from ~24% to 40% in one month for both samples, while the atomic percentage of O 1s in sample 2 increased from 7% to 15% and the atomic percentage of O 1s in sample 3 decreased from 10% to 8%. As a result, the atomic percentage of Au 4f was 10% more for the sample kept in a sealed desiccator (sample 3) compared to the sample kept in the open container (sample 2). This result showed that the amount of adsorbed VOCs can be decreased on the surface when the samples are kept in a sealed desiccator. This storing method can be very important for optical microscopies, such as SPRi or ellipsometry, which are sensitive to atomic variations in the thickness of samples.

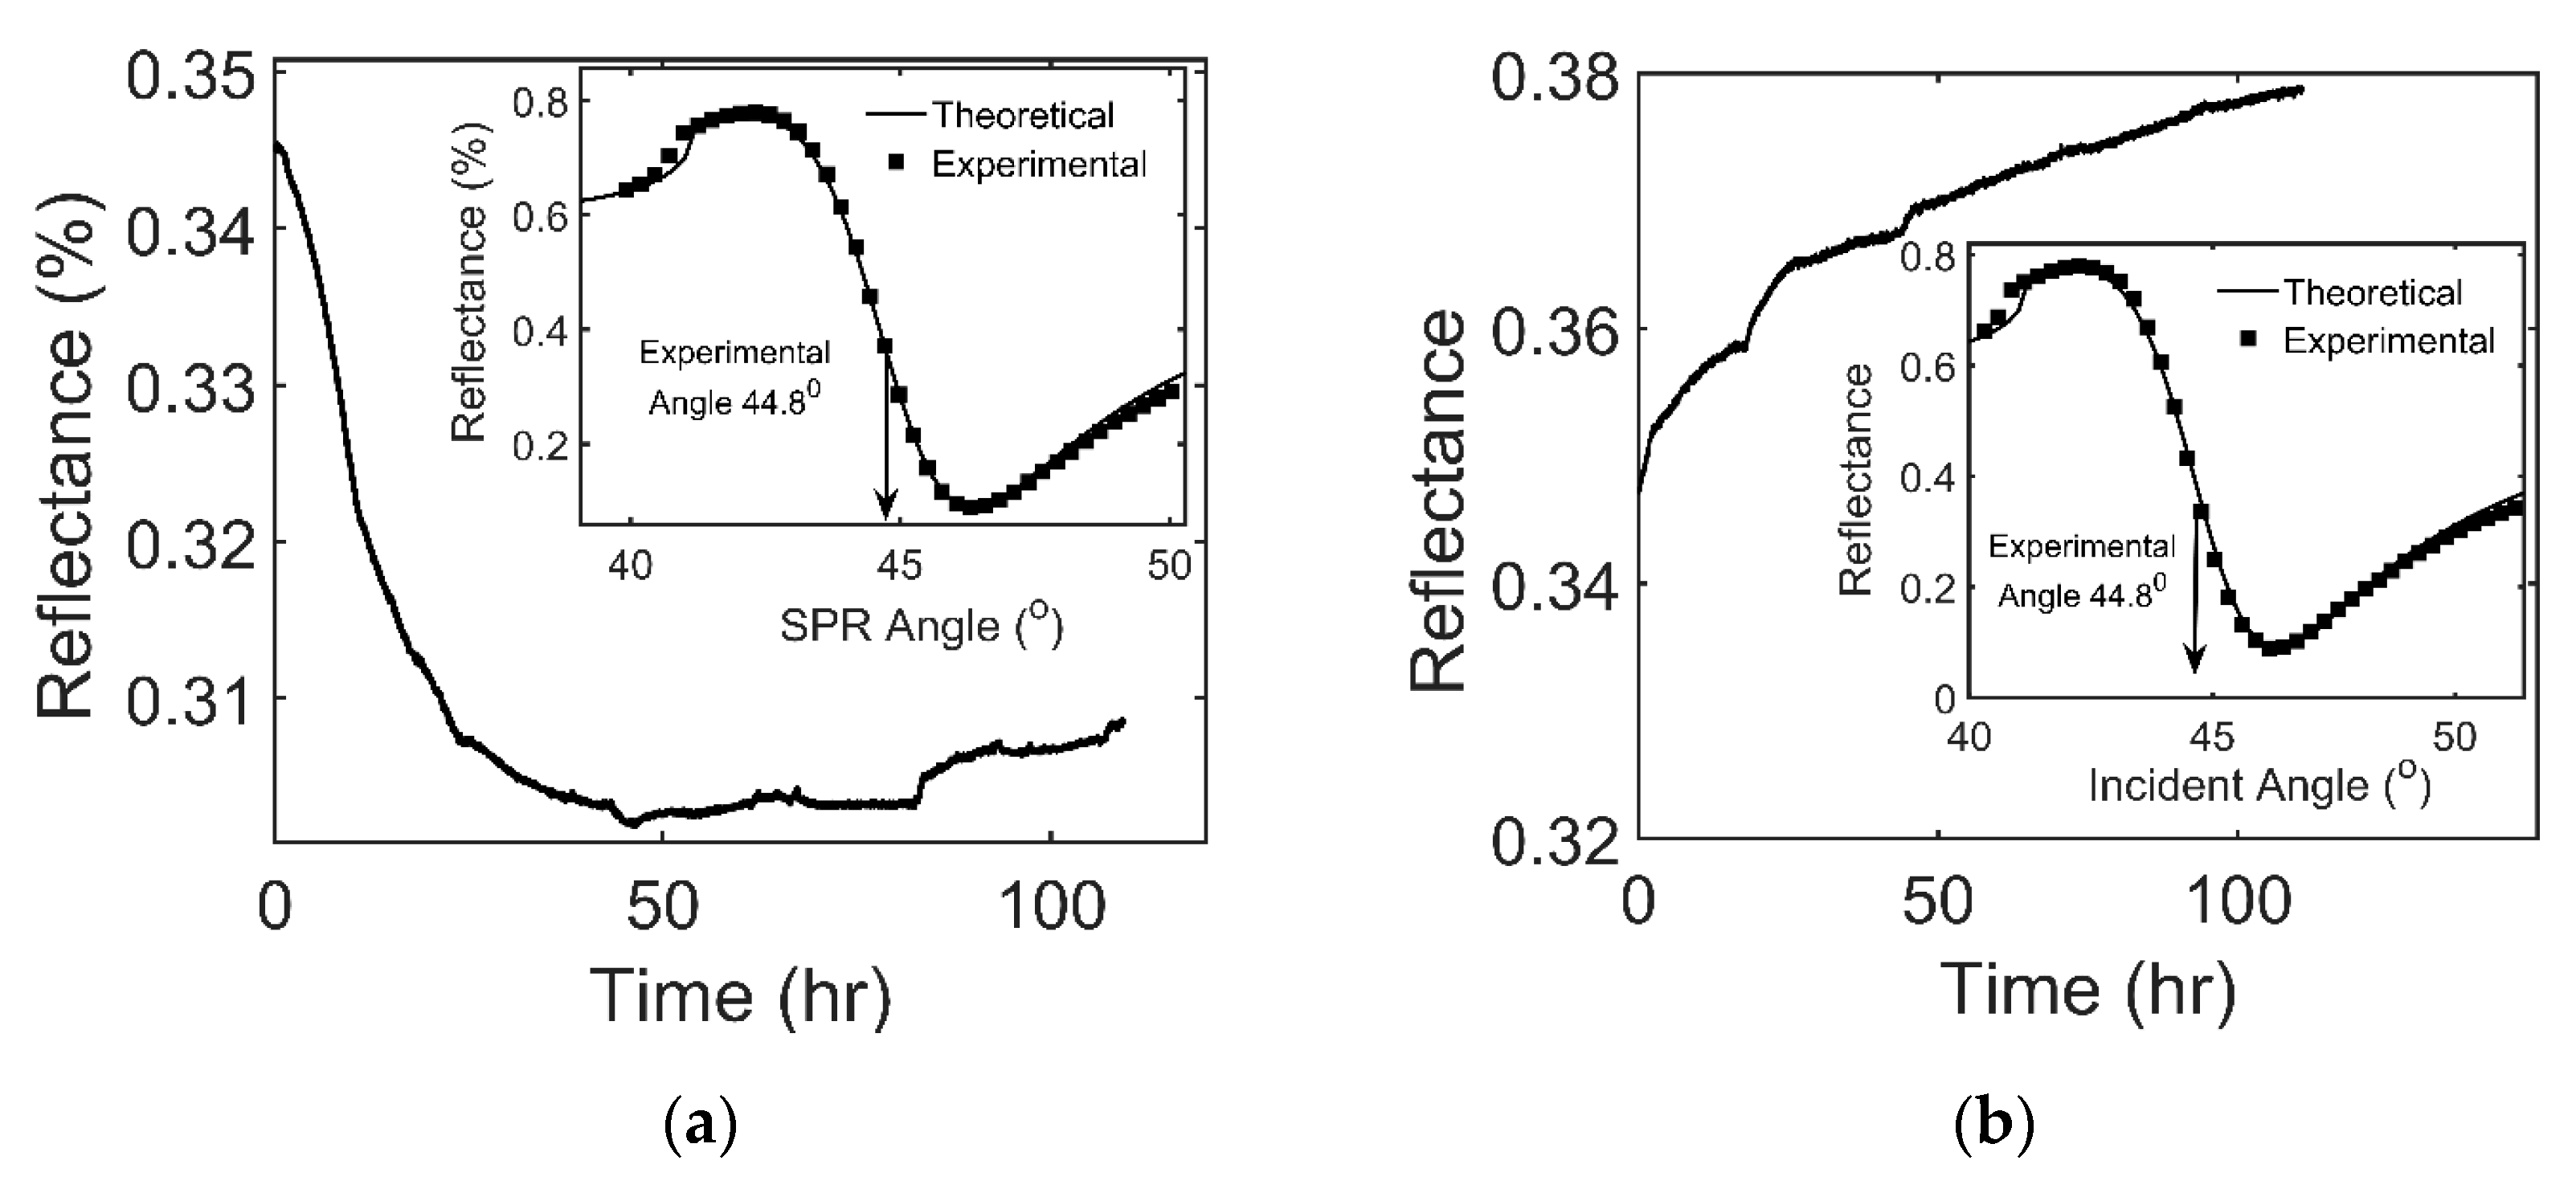
3.3. The Effect of Adsorption of VOCs on SPR Reflectance

As Figure 1b,c show, the recorded images from SPRi are in grayscale (with pixel intensity values in the range of 0 to 4940). For the quantitative analysis of the results, it is required to normalize the images by converting the pixel intensity value into units of reflectivity (0–1). Reflectivity units show the ratio of reflected light from the prism into the incident light on the prism and allow comparison between the SPR theoretical model and the experimental result. The theoretical SPR reflectance can be modeled by solving the Fresnel equation for transverse magnetic light (p-polarized light) in a four-layer configuration BK7 prism, gold, water, and air as:
R = r 12 [ 1 + exp ( 2 i   K 2 d 2 ) ] + [ r 12 r 23 + exp ( 2 i   K 2 d 2 ) ] r 34 exp ( 2 K 3 d 3 ) 1 + r 12 r 23 exp ( 2 i   K 2 d 2 ) + [ r 23 + r 12 exp ( 2 i   K 2 d 2 ) ] r 34 exp ( 2 K 3 d 3 )
In this equation, the thickness of the air and the BK7 prism are considered infinity, and the thickness of the gold layer is 50 nm. In the case of SPRi of adsorbed VOCs on the surface, the thickness of the water layer is zero and Equation (1) reduces into the three-layer system. It is important to note that we assume the initial thickness of adsorbed VOCs on the surface is zero on the surface. For normalization of images, we introduced a scaling factor:
S = I S P R ,   max I S P R ,   min R t ,   max R t ,   min
At a wavelength of 550 nm, the Rt,max and Rt,min were, respectively, 0.778 (at α = 42.0°) and 0.089 (at α = 46.3°) from theoretical reflectance–angle plot. The reflectivity at each pixel can be calculated using:
C = I S P R ,   max S   R t ,   min
R = ( 1 C ) / S + R t ,   min
The reflectance–incident angle curves for samples 2 and 4 are shown in Figure 5a,b, respectively. The results show a good agreement between theoretical and experimental results. The real-time effects of adsorbed VOCs on the SPR reflectivity were measured by visualizing changes in the reflectivity of the surface at a fixed incident angle of 44.8°. This angle is the same angle we used for observation of dropwise condensation. Figure 5a shows the reflectance changes with time for sample 2. The result indicates an odd behavior; initially, (for the first 43 h) reflectance dropped significantly (~ 5%). In the next 70 h, reflectance gradually increased (1%). The SPRi was set up in such a way (incident angle of 44.8° and wavelength of 550 nm [5]) that any increase in the reflectance showed an increase in the thickness of the adsorbed layer and/or an increase in the refractive index of the adsorbed layer. Conversely, a decrease in the reflectance is an indicator of desorption and/or reduction in the refractive index of the adsorbed layer. As SPRi was performed under intensity modulation, it was not possible to deconvolute changes in the refractive index and the thickness of the adsorbed layer concurrently. Simultaneous measurement of refractive index and thickness of a film using SPRi is possible when SPRi with angle-scanning is performed at two different wavelengths. It is possible to determine refractive index and thickness of sample from Equation (1) using reflectance–incident angle curve at two wavelengths. More information regarding the simultaneous measurement of refractive index and thickness can be found in our previous work [24]. In this work, we used XPS data to observe the trend of the adsorbed layer thickness with time. For a two-layer (overlayer and substrate) structure where the overlayer does not produce electrons with the binding energy of interest, i.e., the overlayer does not produce photoelectrons with the binding energy of Au 4f, the thickness (dover) of the adsorbed VOCs on the gold surface can be estimated from XPS data [25]:
I X P S   =   I X P S ,   s u b exp ( d o v e r λ cos θ )
For a thick substrate (dsub >> λ), IXPS, sub can be considered as I, the intensity of a thick sublayer without an overlayer. This is the case for our surface as the 50 nm thick gold layer is much greater than the electron attenuation length of Au 4f photoelectrons (3 nm) through gold.
I is usually measured directly. Normally, for a metal substrate such as gold, the surface is argon sputtered in the XPS chamber to get the signal without the overlayer. However, our samples were not argon sputtered in the XPS chamber and they had a small overlayer at the beginning. Argon sputtering was not been implemented as it would likely have affected the surface morphology and homogeneity of the surface [26] (for studying the mechanism of dropwise condensation, the surface needs to be smooth). The initial overlayer in the first measurement can be seen by the presence of C 1s in the broad range scan of samples (see Figure 3). Therefore, our thickness measurement was an estimate of the additional overlayer thickness formed after the initial measurement and not the actual overlayer thickness. By changing the order of Equation (1):
d o v e r = ln   ( I X P S I X P S ,   0 )   λ cos θ
where IXPS, 0 is the signal associated with Au 4f generated from the substrate layer during the first measurement (t = 0 h), and the collection angle relative to the surface (θ) is 45°. The thickness of the additional overlayer was measured by assuming the adsorbed layer formed a uniform layer on the surface.
Figure 5c presents the trend of thickness variations in one month for sample 2; the thickness exponentially increased in the first 17 h (from 0 to 0.24 nm), then it dropped slightly at 41 h (from 0.24 nm to 0.22 nm); finally, it increased from 0.22 nm to 0.68 nm at 893 h. As these results are based on a single XPS measurement, we cannot present the error of measurement. The increasing trend in the thickness of adsorbed VOCs means the initial drop in the SPR reflectance was due to a drastic decrease in the refractive index, i.e., the chemistry of the adsorbed VOCs on the plasma-cleaned sample initially changed from compounds with a higher refractive index to compounds with a lower refractive index. As these thickness measurements were estimated, we cannot precisely estimate the changes in the refractive index of the adsorbed layer. It is worth noting that a quantitative calculation of the adsorbed layer’s refractive index was not the goal of this work. Therefore, we only mention this to note the trend of changes in the adsorbed VOCs for sample 2. By tracking the atomic percentage of C and O in the XPS data of sample 2, we can understand how the amount of C–O (compared to C–C (C–H) and C=O) in a high-resolution carbon spectrum reduced on the surface for the first 41 h and then increased. Further, XPS data indicated that the peak binding energy of O-C (in high-resolution oxygen spectrum) changed from 533.08 eV to 532.6 eV in 41 h and bounced back to 532.93 eV in the one-month period. The O–C peak shift and atomic percentage can be deciphered as adsorbed VOCs changing from aromatic hydrocarbons to aliphatic hydrocarbons in the first 41 h after exposure. The reflectance behavior of the plasma-cleaned sample clearly showed this method of surface cleaning is not a proper method for SPRi, as it can complicate the interpretation of the SPR results.
The SPRi of samples cleaned with SCP (sample 4) showed a 4% increase of reflectance in 110 h, as shown in Figure 5b. To estimate the thickness of the adsorbed layer, we assumed a range of refractive indices from 1.33 to 1.4 as the refractive index of adsorbed VOCS. This range of refractive indices represents a variety of organic hydrocarbons [27]. Hence, the reflectance of 4% showed the formation of a 0.85–1 nm adsorbed layer. As adsorption of VOCs is inevitable during the experiment involving ultrathin film (<1 nm) measurement, it is imperative to quantify any uncertainties associated with the adsorption of VOCs. Recently, we have shown the existence of a monolayer thin film between droplets during the dropwise condensation process on a gold-coated glass [5]. The results of our work can shed new light on the mechanism of dropwise condensation, which has been under debate for more than nine decades. Here, we focus on the effect of adsorbed VOCs on a monolayer thin film measurement. The SPRi of dropwise condensation took less than an hour. As a result, the net effect of adsorbed VOCs on the reflectance can be estimated from Figure 5a as 0.0025 (reflectivity unit) or 0.053–0.0625 nm (thickness depends on the index) during the one-hour experiment. It is worth noting that our experiment on the effect of adsorbed VOCs on the SPR reflectance was conducted at lower relative humidity and temperature, as compared to the environmental conditions of the dropwise condensation experiment. It has been shown that the adsorption of VOCs reduces with increasing relative humidity and temperature. Therefore, the net effect of adsorbed VOCs on SPR reflectance during the dropwise condensation experiment should be smaller than 0.0025 (reflectivity unit) or 0.0625 nm [28,29,30]. This value is only 30% of the reflectance measured from a monolayer film of water (i.e., the corresponding reflectance is 0.0082) during the dropwise condensation experiment. Quantification of adsorbed VOCs on the SPRi signal helps us to confidently claim that the monolayer film that we have experimentally observed represents an adsorbed water film. Therefore, the adsorbed film exists between droplets during the dropwise condensation. The next questions that needs to be answered by researchers are whether this thin film plays any role in the growth of nucleates and whether this film can affect the overall heat transfer rate. If the answers to these questions are positive, the future models of dropwise condensation need to be revised accordingly.

4. Conclusions

The existence and thickness of a thin film between droplets during the dropwise condensation process has been under debate for decades. In a recent article published by the authors, we shared our observation (using SPRi) of a monolayer-thick water film that exists between the droplets on a smooth hydrophilic condensing surface. As the thickness of this ultrathin film can be similar to the thickness of the adsorbed VOCs layer that forms on the surface during the dropwise condensation experiment, we used two surface-treatment processes‒SCP and air plasma cleaning‒and four surface characterization techniques‒AFM, optical microscopy, XPS, and SPRi‒to quantify the effect of adsorbed VOCs during the dropwise condensation experiment. The results indicate that (1) both surface cleaning methods have negligible effects on surface homogeneity, (2) neither method fully removes the adsorbed VOCs from the surface, (3) the rate of adsorption of VOCs after plasma cleaning is high and it can cause up to 5% change in the SPR signal, (4) the SCP is recommended prior to sensitive measurement such as ultrathin film (<1 nm) measurement using SPRi due to its minimal effect on the SPR reflectance, and (5) the thickness of adsorbed VOCs is more than 70% smaller than the thickness of the monolayer film that is observed between the droplets during the dropwise condensation on a gold-coated glass. This finding verifies our claim [5,6] that a thin water film exists during dropwise condensation.

Author Contributions

Conceptualization, S.B.A.; methodology, S.B.A.; software, S.B.A.; validation, S.B.A.; formal analysis, S.B.A.; investigation, S.B.A.; resources, J.S.A., S.H.L., and C.K.C.; data curation, S.B.A.; writing—original draft preparation, S.B.A.; writing—review and editing, S.B.A., C.H.J., J.S.A., S.H.L., and C.K.C.; visualization, S.B.A. and F.L.; supervision, S.H.L. and C.K.C.; project administration, C.K.C.; funding acquisition, J.S.A. and S.H.L.; All authors have read and agreed to the published version of the manuscript.

Funding

This work was partially supported by the Department of Energy, Office of Energy Efficiency and Renewable Energy (EERE), USA under award number DE-EE0007650 and by the National Research Foundation of Korea (NRF) grant funded by the Korea government (MSIT) (No. NRF-2020R1F1A1072600).

Acknowledgments

The authors would like to thank Dr. Timothy Leftwich from Michigan Technological University for the XPS imaging and discussion of the XPS results. The authors also appreciate support from Multi-Scale Technologies Institute (MuSTI), Michigan Technological University.

Conflicts of Interest

The authors declare no conflict of interest.

List of Symbols

COffsetminMinimum (at the resonance angle)
dThickness of a layer (nm)overOverlayer
IIntensity valueSPRAssociated with SPRi
KWave vector (1/nm)subSublayer
nRefractive indextTheoretical
rCoefficient of reflection between layersXPSAssociated with XPS microscopy
RReflectance0First measurement
SScaling factor1Layer 1
αIncident angle (°) in SPRi2Lauer 2
θXPS angle relative to the surface (°)3Layer 3
λInelastic mean free path in gold (nm)4Layer 4
subscript Thick Au 4f layer with no overlayer
maxMaximum (at the total internal reflection angle)

References

  1. Hwang, K.W.; Kim, D.; Jo, H.; Park, H.S.; Moriyama, K.; Kim, M.H. Effects of heat flux on dropwise condensation on a superhydrophobic surface. J. Mech. Sci. Technol. 2016, 30, 2141–2149. [Google Scholar] [CrossRef]
  2. Chung, B.-J.; Kim, M.C.; Ahmadinejad, M. Film-wise and drop-wise condensation of steam on short inclined plates. J. Mech. Sci. Technol. 2008, 22, 127–133. [Google Scholar] [CrossRef]
  3. Leipertz, A. J3 Dropwise Condensation. In VDI Heat Atlas; Springer: Berlin, Germany, 2010. [Google Scholar]
  4. Khandekar, S.; Muralidhar, K. Dropwise Condensation on Inclined Textured Surfaces; Springer: Berlin, Germany, 2014. [Google Scholar]
  5. Ahangar, S.B.; Konduru, V.; Allen, J.S.; Miljkovic, N.; Lee, S.H.; Choi, C.K. Development of automated angle-scanning, high-speed surface plasmon resonance imaging and SPRi visualization for the study of dropwise condensation. Exp. Fluids 2019, 61, 12. [Google Scholar] [CrossRef] [Green Version]
  6. Ahangar, S.B.; Allen, J.S.; Lee, S.H.; Choi, C.K. Surface Plasmon Resonance Imaging: A Technique to Reveal the Dropwise Condensation Mechanism. J. Heat Transf. 2020, 142. [Google Scholar] [CrossRef] [Green Version]
  7. Xu, K.; Cao, P.; Heath, J.R. Graphene Visualizes the First Water Adlayers on Mica at Ambient Conditions. Science 2010, 329, 1188–1191. [Google Scholar] [CrossRef] [Green Version]
  8. Verdaguer, A.; Cardellach, M.; Fraxedas, J. Thin water films grown at ambient conditions on BaF2(111) studied by scanning polarization force microscopy. J. Chem. Phys. 2008, 129, 174705. [Google Scholar] [CrossRef]
  9. Cao, P.; Xu, K.; Varghese, J.O.; Heath, J.R. The Microscopic Structure of Adsorbed Water on Hydrophobic Surfaces under Ambient Conditions. Nano Lett. 2011, 11, 5581–5586. [Google Scholar] [CrossRef] [Green Version]
  10. Cha, H.; Wu, A.; Kim, M.-K.; Saigusa, K.; Liu, A.; Miljkovic, N. Nanoscale-agglomerate-mediated heterogeneous nucleation. Nano Lett. 2017, 17, 7544–7551. [Google Scholar] [CrossRef]
  11. Yan, X.; Huang, Z.; Sett, S.; Oh, J.; Cha, H.; Li, L.; Feng, L.; Wu, Y.; Zhao, C.; Orejon, D.; et al. Atmosphere-Mediated Superhydrophobicity of Rationally Designed Micro/Nanostructured Surfaces. ACS Nano 2019, 13, 4160–4173. [Google Scholar] [CrossRef] [Green Version]
  12. Orejon, D.; Askounis, A.; Takata, Y.; Attinger, D. Dropwise Condensation on Multiscale Bioinspired Metallic Surfaces with Nanofeatures. ACS Appl. Mater. Interfaces 2019, 11, 24735–24750. [Google Scholar] [CrossRef]
  13. Kurokawa, A.; Odaka, K.; Azuma, Y.; Fujimoto, T.; Kojima, I. Diagnosis and cleaning of carbon contamination on SiO2 thin film. J. Surf. Anal. 2009, 15, 337–340. [Google Scholar] [CrossRef] [Green Version]
  14. Robinson, R.; Sandberg, R.; Allred, D.; Jackson, A.; Johnson, J.; Evans, W.; Doughty, T.; Baker, A.; Adamson, K.; Jacquier, A. Removing surface contaminants from silicon wafers to facilitate EUV optical characterization. In Proceedings of the Annual Technical Conference-Society of Vacuum Coaters, Santa Clara, CA, USA, 9–14 May 2009; p. 368. [Google Scholar]
  15. Pires, J.; Carvalho, A.; de Carvalho, M.B. Adsorption of volatile organic compounds in Y zeolites and pillared clays. Microporous Mesoporous Mater. 2001, 43, 277–287. [Google Scholar] [CrossRef]
  16. Chapter 3—Surface Preparation for Film and Coating Deposition Processes. In Handbook of Deposition Technologies for Films and Coatings, 3rd ed.; Martin, P.M. (Ed.) William Andrew Publishing: Boston, MA, USA, 2010; pp. 93–134. [Google Scholar] [CrossRef]
  17. Hubadillah, S.K.; Harun, Z.; Aminudin, N.N.; Rosman, N. Ceramic membrane surface roughness induced by modified phase inversion: The effect of thermodynamic properties. Aust. J. Basic Appl. Sci. 2014, 8, 233–240. [Google Scholar]
  18. Nouri, N.M.; Sekhavat, S.; Bayani Ahangar, S.; Faal Nazari, N. Effect of curing condition on superhydrophobic surface for 7075Al. J. Dispers. Sci. Technol. 2012, 33, 771–774. [Google Scholar] [CrossRef]
  19. Raja, R.S.S.; Selvakumar, P.; Babu, P.D. A novel fabrication of superhydrophobic surfaces on aluminium substrate by picosecond pulsed laser. J. Mech. Sci. Technol. 2020, 34, 1667–1674. [Google Scholar] [CrossRef]
  20. Huang, T.-H.; Bhalothia, D.; Lin, S.; Huang, Y.-R.; Wang, K.-W. The Ethanol Oxidation Reaction Performance of Carbon-Supported PtRuRh Nanorods. Appl. Sci. 2020, 10, 3923. [Google Scholar] [CrossRef]
  21. Kim, D.Y.; Jeong, C.H.; Lee, H.J.; Choi, C.K.; Lee, S.H. Modeling of the finite boundary limit of evaporation flux in the contact line region using the surface plasmon resonance imaging. Int. Commun. Heat Mass Transf. 2020, 116, 104598. [Google Scholar] [CrossRef]
  22. Yue, W.; Wang, Z.; Yang, Y.; Chen, L.; Syed, A.; Wong, K.; Wang, X. Electron-beam lithography of gold nanostructures for surface-enhanced Raman scattering. J. Micromech. Microeng. 2012, 22, 125007. [Google Scholar] [CrossRef]
  23. Bayani, S.; Tabe, Y.; Kang, Y.T.; Lee, S.H.; Choi, C.K. Surface plasmon resonance imaging of drop coalescence at high-temporal resolution. J. Flow Vis. Image Process. 2018, 25, 191–205. [Google Scholar] [CrossRef]
  24. Ahangar, S.B.; Bellur, K.; Medici, E.; Tajiri, K.; Allen, J.S.; Choi, C.K. Optical properties and swelling of thin film perfluorinated sulfonic-acid ionomer. ECS Trans. 2019, 92, 197. [Google Scholar] [CrossRef]
  25. Baer, D.R.; Wang, Y.-C.; Castner, D.G. Use of XPS to Quantify Thickness of Coatings on Nanoparticles. Microsc. Today 2016, 24, 40–45. [Google Scholar] [CrossRef] [PubMed] [Green Version]
  26. Passiu, C.; Rossi, A.; Weinert, M.; Tysoe, W.; Spencer, N.D. Probing the outermost layer of thin gold films by XPS and density functional theory. Appl. Surf. Sci. 2020, 507, 145084. [Google Scholar] [CrossRef]
  27. Martínez-Hipatl, C.; Muñoz-Aguirre, S.; Beltrán-Pérez, G.; Castillo-Mixcóatl, J.; Rivera-De la Rosa, J. Detection of volatile organic compounds by an interferometric sensor. Sens. Actuators B Chem. 2010, 147, 37–42. [Google Scholar] [CrossRef]
  28. Tao, W.-H.; Yang, T.C.-K.; Chang, Y.-N.; Chang, L.-K.; Chung, T.-W. Effect of moisture on the adsorption of volatile organic compounds by zeolite 13×. J. Environ. Eng. 2004, 130, 1210–1216. [Google Scholar] [CrossRef]
  29. Huang, H.; Haghighat, F.; Blondeau, P. Volatile organic compound (VOC) adsorption on material: Influence of gas phase concentration, relative humidity and VOC type. Indoor Air 2006, 16, 236–247. [Google Scholar] [CrossRef]
  30. Huang, C.-Y.; Song, M.; Gu, Z.-Y.; Wang, H.-F.; Yan, X.-P. Probing the Adsorption Characteristic of Metal–Organic Framework MIL-101 for Volatile Organic Compounds by Quartz Crystal Microbalance. Environ. Sci. Technol. 2011, 45, 4490–4496. [Google Scholar] [CrossRef]
Figure 1. (a) Schematic of the automated surface plasmon resonance imaging (SPRi) instrument (a p-polarized monochromatic (550 nm) collimated light was used for SPRi), (b) schematic of volatile organic compound (VOC) adsorption experiment using SPRi, and (c) experimental conditions for SPRi of dropwise condensation (brighter color represents droplets and darker color represents the gold substrate).
Applsci 10 05981 g001
Figure 2. AFM images of the sample 2 surface (gold-coated glass, plasma-cleaned and stored in an open container at room conditions) after exposure times of (a) 2 h and (b) 185 h. (c) SPRi of dropwise condensation (the darker color represents the gold substrate and the brighter color shows the droplets) shows surface defects can cause heterogeneous nucleation. (d) Contact angle measurements of the samples.
Applsci 10 05981 g002
Figure 3. (a) Broad-range energy scan and (b) high-resolution XPS spectra of sample 2 (exposure time of 0 and 893 h) and sample 4 (exposure time of 0 h).
Applsci 10 05981 g003
Figure 4. The sample stored in a desiccator (sample 3) allowed adsorption of fewer VOC molecules—a higher atomic percentage of Au—on its surface, as compared to the samples left in an open environment (sample 2) by desorbing the part of VOCs that has double oxygen bonds.
Applsci 10 05981 g004
Figure 5. SPRi results of (a) sample 2 and (b) sample 4 (the inner plots show the angle-scanning result and the outer curve shows the effect of adsorbed VOCs on the SPR signal at 44.8°), and (c) XPS result of sample 2 shows the trend of adsorbed VOCs layer thickness variation.
Applsci 10 05981 g005aApplsci 10 05981 g005b
Table 1. Details of the cleaning procedure and storing method of the samples.
PreparationSample 1Sample 2Sample 3Sample 4
Cleaning procedure-SCP + PlasmaSCP + PlasmaSCP
Storing methodOpen containerOpen containerSealed containerOpen container
Table 2. Surface characterization methods used to study the surface properties of the samples.
AnalysisExposure Time (h)
Sample 1Sample 2Sample 3Sample 4
XPS-0, 4, 17, 43, 180, 8930, 4, 17, 43, 180, 8930
AFM-2, 17, 41, 1852, 17, 41, 1852, 17, 41, 185
Contact Angle0, 4, 18, 46, 180, 11000, 4, 18, 46, 180, 11000, 4, 18, 46, 180, 11000, 4, 18, 46, 180, 1100
SPRi-1~1101~1101~110

